Chapter Nine State and Local Government Local Government ~~~~~ Units of Local Government.

Profile of the Local Government Workforce2014 Report

Profile of the Australian Local Government Workforce 2015 Report
February 2015
About the authors
This report was prepared by Catherine Hastings, Roberta Ryan, Melissa Gibbs and Alex Lawrie for the Australian Centre of Excellence for Local Government (ACELG)
Acknowledgements
ACELG would like to thank all those who assisted with this project, including Karen Purser who managed the ACELG Workforce Survey in 2012, and the councils that participated in the pilot of the project.
Citation
Hastings, C., Ryan, R., Gibbs, M & Lawrie, A. 2015, Profile of the Australian Local Government Workforce 2015 Report, Australian Centre of Excellence for Local Government, University of Technology, Sydney.
ISSN 1838-2525
Images courtesy of Penrith City Council, Hume City Council, Roper Gulf Regional Council, Brisbane City Council, Michael Coghlan and Ryan Smith.
© University of Technology, Sydney, 2015
UTS CRICOS Provider Code 00099F

Table of Contents
Executive Summary ................................................................................................................................... i
Profile of the Local Government Workforce .......................................................................... ii
Women in Local Government ................................................................................................ ii
Workforce Issues ................................................................................................................... iii
Workforce Planning ....................................................................................................... iii
Diversity ......................................................................................................................... iii
Education and Training ......................................................................................................... iv
Turnover and Staff Mobility .................................................................................................. iv
Key Findings ........................................................................................................................... v
1. Introduction ..................................................................................................................................... 1
1.1 Context ........................................................................................................................... 2
1.2 National Workforce Strategy 2013–20 .......................................................................... 2
1.3 The Australian Local Government Workforce and Employment Survey ....................... 3
1.4 This Report ..................................................................................................................... 4
2. Profile of the local government workforce ...................................................................................... 5
2.1 Local government employees ........................................................................................ 6
2.1.1 Total employment ................................................................................................ 6
2.1.2 Local government employment compared to other industry sectors ................. 6
2.1.3 Gender of employees in local government .......................................................... 7
2.1.4 An ageing workforce ............................................................................................ 9
2.1.5 Basis of employment .......................................................................................... 14
2.2 Women in Local Government ...................................................................................... 18
2.2.1 Women as elected representatives ................................................................... 18
2.2.2 Women in Management .................................................................................... 19
2.2.3 What women in local government are doing .................................................... 20
3. Workforce issues ............................................................................................................................ 22
3.1 Workforce planning ...................................................................................................... 23
3.2 Diversity ........................................................................................................................ 26
3.2.1 Indigenous .......................................................................................................... 26
3.2.2 Disability ............................................................................................................. 30
3.2.3 Culturally and Linguistically Diverse (CALD) ....................................................... 30

3.2.4 Diversity Targets ................................................................................................ 31
3.3 Education and Training................................................................................................. 32
3.3.1 Education ........................................................................................................... 32
3.3.2 Training .............................................................................................................. 33
3.3.3 Apprenticeships ................................................................................................. 35
3.3.4 Vacancies and Skills Shortages ........................................................................... 36
3.4 Staff turnover ............................................................................................................... 38
3.4.1 Separations ........................................................................................................ 38
3.4.2 New Starters ...................................................................................................... 38
3.4.3 Staff Turnover .................................................................................................... 39
3.4.4 Local Government Staff Mobility ....................................................................... 40
4. Conclusion ...................................................................................................................................... 41
4.1 Key Findings .................................................................................................................. 42
4.2 ACELG’s response ......................................................................................................... 44
5. References ...................................................................................................................................... 45
Appendix A ACLG Classifications...................................................................................................... 48
Appendix B Occupations by age ...................................................................................................... 50
Appendix C Employees in each occupation that received training in 2011-12 ............................... 58
Appendix D Questionnaire ............................................................................................................... 65
Appendix E Methodology of the Survey ........................................................................................ 113
Pilot ......................................................................................................................... 114
Data collection............................................................................................................ 114
Response rate ............................................................................................................. 115
TABLES
Table 1: Employment by gender, breakdown by jurisdiction ................................................................. 8
Table 2: Local government employees aged 50 years or more by occupation .................................... 11
Table 3: Twenty-five occupations with highest proportion of workers aged 50+ ................................ 11
Table 4: Twenty-five occupations with lowest proportion of workers aged 50+ ................................. 12
Table 5: ACELG Survey workforce planning status (n=107 councils) .................................................... 23
Table 6: Disability status by gender by employment status by jurisdiction ......................................... 30
Table 7: Occupations in local government receiving the highest proportions of mandatory training 34
Table 8: Number of local government-employed apprentices in areas of skills shortage ................... 35
Table 9: Vacancies in local government ................................................................................................ 37
Table 10: Separations in local government .......................................................................................... 38
Table 11: New starters in local government ......................................................................................... 38

Table 12: Pilot Councils ....................................................................................................................... 114
Table 13: Profile of participating local governments by state ............................................................ 115
Table 14: Categorisation of ALGWE Census respondents using ACLG category listing ...................... 115
FIGURES
Figure 1: Key industry workforce distribution by urban, regional and rural areas ................................. 7
Figure 2: Occupation streams of local government employees by gender ............................................ 9
Figure 3: ACELG Survey and ABS Census local government workforce by age..................................... 10
Figure 4: Proportion of male and female local government employees by age................................... 10
Figure 5: ACELG Survey local government workforce by employment status ..................................... 14
Figure 6: ABS Census local government workforce by employment status ......................................... 14
Figure 7: Employment status of local government employees compared to other industries ............ 15
Figure 8: Employment status of local government employees by gender ........................................... 15
Figure 9: Employment status of women in local government and all industries ................................. 16
Figure 10: ABS Census employee hours by jurisdiction ........................................................................ 17
Figure 11: Currently serving elected members by gender ................................................................... 18
Figure 12: ACELG Survey managerial level occupation by gender (n=110 councils) ............................ 19
Figure 13: ACELG Survey managerial level by gender in four occupation streams (n=110 councils) ... 20
Figure 14: Occupations in local government with the highest proportions of women employed ....... 21
Figure 15: ACLEG Survey workforce planning status by jurisdiction (n=106 councils) ......................... 24
Figure 16: What does you organisation consider as the ‘biggest challenge’ facing your council in workforce development over the next 12 months (n=62 councils; Multiple answers possible). ........ 25
Figure 17: Proportion of local government Indigenous employees and Indigenous adult population by jurisdiction ............................................................................................................................................ 27
Figure 18: ABS Census Indigenous workforce by gender by employment status by jurisdiction ......... 28
Figure 19: Percentage of Indigenous and non-Indigenous local government employees by hours worked week of the ABS 2011 Census .................................................................................................. 29
Figure 20: Percentage of local government workforce by occupation ................................................. 29
Figure 21: Proportion of local government employees speaking a language other than English at home by jurisdiction, compared to All Industries ................................................................................. 31
Figure 22: Councils with diversity targets (n=107 councils) ................................................................. 31
Figure 23: ABS Census level of educational attainment by gender ...................................................... 33
Figure 24: ABS Census educational qualifications of local government employees by state ............... 33
Figure 25: Percentage of separations and new starters by age............................................................ 39
Figure 26: Mean and median employee turnover in local government, by gender ............................. 39


Executive summary
ii
EXECUTIVE SUMMARY
Executive summary
Local government is a significant employer in Australia—particularly in regional areas—offering
opportunities for employment across a wide range of occupations. This report on the profile of the
local government workforce has been written to support the National Workforce Strategy developed
for the Australian Centre of Excellence for Local Government (ACELG) by Local Government
Managers Australia (LGMA) National Office, and should be read in conjunction with this Strategy
(LGMA & ACELG 2013). Australian Bureau of Statistics (ABS) data from the 2011 Census of
Population and Housing, and ACELG Survey data on the local government workforce from 2013 have
been synthesised in constructing this profile.
Profile of the Local Government Workforce
There are 192,500 people working in local government across the country.
Local governments are important employers in regional and remote areas. A higher proportion
of local government employees work in regional (41%) and remote (18%) areas compared to the
proportion of state and territory (24% and 5%) and federal governments (16% and 2%)
employees. In regional and remote areas, local government employs a larger proportion of the
workforce than most other industries (with the exception of health care, social assistance and
education).
Although men make up a larger proportion of the local government workforce nationally (54%),
by jurisdiction there are large differences in gender distribution driven by the range of
occupations that reflect the strategic priorities and legislative requirements of each state or
territory. Men predominate in engineering/infrastructure (90% of employees) and
planning/environment occupations (76% of employees), whilst women are more likely than men
to be in corporate services/governance (65% of employees) and human/community services
(78% of employees).
The local government workforce is ageing, with 37% of employees aged 50 years or over,
compared to the Australian labour force average of 29%. Male employees are, on average, older
than female employees, with 41% of the men working in local government aged 50 years or
more compared to just 32% of women.
Although 70% of local government employees are working on a full-time basis, there is a large
difference across the genders, with only 54% of women working full time compared to 83% of
men.
Women in Local Government
Approximately one third of all councillors (30%) and one quarter of mayors (23%) are women.
However, unlike males, the proportion of women being elected is approximately equal to the
proportion nominating, suggesting there would be larger numbers of women serving as
councillors if more stood for election.
A very small proportion of council CEOs are female (11%). Research suggests that a cultural shift
in recruitment processes for CEOs will be needed to break the pattern of predominately older
men from technical or finance backgrounds being appointed into these roles.

iii
EXECUTIVE SUMMARY
In local government there are a large number of very well educated women currently working in
middle management (third and fourth level). Although currently not employed in similar roles,
these women could move into higher level senior management roles if supported with
continued flexible work opportunities and considered for appointment.
The number of women in management positions varies according to the occupation stream in
which they are working. Women in all leadership roles are over-represented in human and
community services (63%), and under-represented in engineering/infrastructure (15%) and
environment and planning (36%).
Workforce Issues
Workforce Planning
Only a small proportion of local governments have an established workforce plan (10%),
although the majority say they are working towards implementing one (88%). There are a
number of significant and immediate challenges facing the sector nationally—including the
ageing workforce, skill shortages and training needs—which require workforce planning to
address.
In New South Wales and Western Australia, where workforce plans are mandatory for local
government, all local governments responding to the survey have or are developing a plan.
The foremost workforce planning challenge is the ageing workforce and the high levels of
impending retirements (reported by 19% of councils). Other issues relating to the ageing
workforce included knowledge management/transfer (11%), difficulties in attracting younger
workers to council (10%), and the investment required in new machinery/tools due to the
decreasing physical capacity of workforce (10%).
Challenges relating to skills shortages (reported by 19% of councils), recruitment competition
(19%), and competition with city councils (11%) are also key workforce concerns. Identified
workforce development challenges relating to human resource management included a lack of
workforce planning resources (18%), staff retention (15%), leadership development (15%), and
succession planning (10%).
Research data from the ACELG Survey regarding workforce planning issues facing local
governments complement and support the importance of issues identified as strategic priorities
in the National Workforce Strategy.
Diversity
Nationally, 4.6% of local government employees identified as Indigenous in 2011, already
exceeding the 2.6% CoAG target set in 2008. By way of comparison, nationally, 3.1% of
employees in mining and 2.7% of employees in all public administration (including the three tiers
of government) are Indigenous.
Local governments employ a large number of Aboriginal and Torres Strait Islander people. Whilst
local government employees represent only 9% of the total public service workforce in Australia,
22% of all Indigenous public sector workers are employed by local government.
Across the jurisdictions, the levels of Indigenous employment in local government are varied. In
the Northern Territory, over 50% of local government employees are Indigenous, whereas in

iv
EXECUTIVE SUMMARY
South Australia (1.7%) and Victoria (0.6 %), the proportion of Indigenous employees is lower
than the CoAG target of 2.6%.
Aboriginal and Torres Strait Islander local government employees are over-represented in some
occupations, including health and welfare support workers; labourers; cleaners and laundry
workers; construction and mining labourers; and farm, forestry and garden workers. There are
opportunities to create more stable positions and better career opportunities for Indigenous
employees, as currently there are few Indigenous people in local government leadership
positions.
According to the ABS 2011 Census, 11% of local government employees speak a language other
than English at home. By way of comparison, 24% of all employed persons nationally across all
industries speak a language other than English at home. Local government could be doing more
to attract culturally and linguistically diverse (CALD) employees.
The majority of councils (70%) have no plans to implement diversity targets for their workforce.
7% have diversity targets in place, and a further 23% reported they are working towards
introducing diversity targets. This is concerning given the generally low levels of employment of
people from CALD communities in local government.
Education and Training
In general, employees of local governments have higher levels of educational attainment than
the Australian workforce average, with 65% of men and 70% of women in local government
having a post-school qualification, compared to the national average of only 45%.
Female local government employees hold more university level qualifications (30% of women)
than male employees (21% of men).
Additionally, a larger proportion of women in local government are currently studying full-time
(2.8%) or part-time (9.7%) compared to men (full-time 1.7%; part-time 6.4%).
The Survey results suggest that local governments are spending only a small amount on training
(as a proportion of total payroll). In regional and rural councils, the cost of accessing training is a
significant issue as travel and accommodation costs eat into already limited training budgets.
Data suggests that there are relatively few apprentices in local government, particularly in the
key occupations that are experiencing skills shortages.
The occupations identified as most difficult to recruit by the Government Skills Australia 2012 E-
scan (engineers, planners, childcare staff, environmental health workers, surveyors and
managers), were also found to be positions with the highest number of long-term vacancies in
the ACELG Survey.
Turnover and Staff Mobility
According to the ABS, the turnover for the national workforce was 10.6% in 2012. According to
the ACELG Survey, total staff turnover in 2011/2012, amongst the 108 centres for which this
calculation was possible, ranged from 0% to 46.5%. The average turnover per centre was 12.7%,
although the median was slightly lower at 10.3%.
There was little difference between the turnover figures for males and females.
Nearly half (49.1%) of people employed in local government at the ABS 2006 Census were still
working in local government at the time of the ABS 2011 Census. A small number (1.5% of 2006
local government employees) had moved into federal government employment; 5.2% had

v
EXECUTIVE SUMMARY
moved into state/territory government employment; and 26.3% had taken jobs in the private
sector.
Key Findings
Local government employees are everywhere – From the city to the bush, local governments
are key employers everywhere. A higher proportion of the local government workforce is
employed in regional and rural areas compared to other levels of government and important
regional and remote employing industries. Given the significance of local government to the
Australian regional and rural workforce and the fact that, in many locations, local government is
the only level of government present in the area, strengthening the local government sector
represents an excellent opportunity to secure and strengthen the economic, environmental and
social foundations of rural and regional communities across the breadth of the country.
Gender of local government employees – Local government nationally employs a slightly higher
proportion of men than women. However, there are significant jurisdictional differences. There
is a need to increase gender diversity in the engineering/infrastructure occupation stream,
where females are significantly under-represented with a presence of less than 10%. Providing
more flexible employment opportunities in key occupations, attracting, training and retaining
skilled female employees, and re-imagining existing relationships with local schools and tertiary
institutions may assist in establishing gender equity in the sector.
An ageing workforce – The local government workforce is ageing, and is older compared with
other government and industry sectors. Male employees are older than female employees, with
a higher proportion of male employees aged 50 years or more. The ageing cohort of CEOs and
general managers also suggests local government needs to be thinking about how to develop,
attract and retain the next generation of senior leaders.
Education levels – Women working in local government are more highly educated than their
male counterparts. When considered in the context of an ageing cohort of CEOs and general
managers, this suggests there may be opportunities to address gender imbalance in senior
leadership ranks by developing talented mid-level female managers and enabling career
progression opportunities.
Women as elected representatives – Only one third of councillors and mayors are women, and
an even smaller proportion (11%) of council CEOs/general managers are women. Women
accounted for just 32% of candidates at the last round of local government elections. Local
government and political organisations have a long way to go before they achieve candidate
gender equity. Further research is required to determine what the barriers might be to female
political participation in local government.
Workforce planning – The development of workforce plans is more common in jurisdictions
where workforce planning is mandatory. The biggest workforce challenge facing local
government is an ageing workforce and the high levels of impending retirements. Differences in
how local governments with voluntary and mandatory workforce planning respond to the ageing
workforce challenge will be a key indicator of the success of workforce planning initiatives.
Indigenous employees – While local government is leading the public and private sectors in
Indigenous employment and currently far exceeding CoAG targets, the changes to Community
Development Employment Projects (CDEP) and other employment programs has the potential to
jeopardise this standing. There are opportunities to create more stable positions and better

vi
EXECUTIVE SUMMARY
career opportunities for local government Indigenous employees, as currently there are few
Indigenous people in leadership positions.
Training and development – A more strategic approach to training and development focussed
on developing in-house talent to step into leadership positions, and on developing the skills of
current employees so they are able to move flexibly between occupations experiencing skills
shortages would yield positive outcomes.
Vacancies and skill shortages – Local government is experiencing skills shortages in areas
commonly identified by other sectors and industries. This means that, in areas where local
government experiences difficulties in recruiting , it is likely to be in competition with other
industries for staff. Local government can learn valuable lessons from human resources
strategies in other sectors by differentiating itself as an employer of choice and encouraging and
promoting flexible working conditions, career development opportunities, and the chance to
contribute to civic life and community wellbeing. The evidence suggests that flexible working
conditions and career development is likely to contribute to a more equitable and diverse
workforce that better represents the diverse communities served by local governments around
the country.

1. Introduction

2
1. INTRODUCTION
1. Introduction
1.1 Context
Australia’s 556 local governments (DRALGAS 2012) employ over 192,500 staff (ABS 2013a) in a diverse range of roles across the country. Together, they spend nearly $30.6 billion annually (ABS 2013b).
Local governments across the country are significant local and regional employers, offering employment in a wide range of occupations. As providers of diverse local services and infrastructure, local government plays a key role in shaping local communities and a strong leadership role in contributing to the wellbeing of the nation’s citizens. Indeed, in many rural and remote communities, local government is often the primary economic driver and the only level of government providing essential social and community services.
Given the key role played by local government in Australia’s inter-governmental system, surprisingly little is known about the sector’s national employment profile. The best data available comes from the Australian Bureau of Statistics (ABS) Census of Population and Housing (the ABS Census), but this is only available every five years in line with Census collection dates. Additionally, each Australian state and territory government has tended to collect its own local government data for a range of different purposes. Different data collection approaches and the diverse range of priorities and concerns throughout the jurisdictions have made it impossible to aggregate these data in order to achieve a national profile of the local government workforce. The absence of a national picture has impacted on the capacity of the local government sector to determine current and future workforce needs and priorities. This is in stark contrast to other sectors that have been able to use national data to effectively attract and retain skilled and talented staff, attract funding for skills development and advocacy, and address skill shortages.
The scarcity of easily accessible and accurate data on the composition of the local government workforce presents challenges for building the capacity of the local government workforce and for innovation both across the sector and within local governments. It also limits the ability of local governments to identify opportunities to foster innovation through cross-sectoral and inter-governmental collaborations in regional development. Workforce development and productivity are also key elements in improving local government sustainability and its long-term capacity to deliver required services and infrastructure.
The fragmentation of the local government sector has contributed to this dilemma – the local government sector has tended to present itself as a collection of individual employers spread across six states and the Northern Territory, with an abundance of representative, professional and employee groups all playing a role. This has resulted in the absence of a cohesive and united local government voice, impacting on the sector’s success in accessing assistance packages to address skill shortages and the like.
1.2 National Workforce Strategy 2013–20
In 2008, the (then) Local Government and Planning Ministers’ Council (LGPMC) and the Prime Minister agreed on the need for a national local government workforce strategy to address skills shortages and enhance the professionalism of local government.
Consequently, a National Workforce Strategy was developed for the Australian Centre of Excellence for Local Government (ACELG) by Local Government Managers Australia (LGMA) National Office – one of ACELG’s five consortium partners (LGMA & ACELG 2013). ACELG was requested by the former

3
1. INTRODUCTION
LGPMC to develop a complementary National Minimum Data Set covering workforce characteristics and the participation of women in local government.
Funding for both projects was provided by the Australian Government in 2011 through the Local Government Reform Fund. The projects involved extensive consultation with local government organisations; federal, state and Northern Territory (NT) agencies; and other key sector stakeholders.
The Workforce Strategy seeks to address the workforce challenges faced by the sector and to demonstrate the significance of the local government workforce within the Australian economy and society. The Strategy provides the basis for developing workforce capacity and capability to meet the challenges to 2020 and beyond. The report contains eight strategies for workforce retention, attraction and development that can be implemented by local governments according to their particular circumstances and needs.
Eight Strategies and Actions
Improving workforce planning and development
Promoting local government as place-based employer of choice
Retaining and attracting a diverse workforce
Creating a contemporary workplace
Investing in skills
Improving productivity and leveraging technology
Maximising management and leadership
Implementation and collaboration (LGMA & ACELG 2013).
The Workforce Strategy recognises that a key element in implementing the strategy will be the development of robust arrangements for local government workforce data collection and analysis; the monitoring of progress towards achieving the agreed national objectives; and further development of supportive programs. As a result, it was agreed with state and NT governments to conduct a survey of the Australian local government workforce in order to provide a national detailed snapshot of the occupations, qualifications, gender distribution, age distribution, Indigenous participation, training, turnover, skill shortages, vacancies and other characteristics of the local government workforce.
1.3 The Australian Local Government Workforce and Employment Survey
In 2012–13, ACELG undertook a Survey of local governments across the country seeking information and data to support the Workforce Strategy and a complementary strategy for women in local government.
The Survey involved extensive consultation with key stakeholders in all jurisdictions, an examination of the data collection methods currently used by local government agencies and associations, and a review of the data collected from these sources and by other organisations, most notably the ABS.
The Survey, in conjunction with data from the 2011 ABS Census, provides a foundation of workforce data that will be used to project and model the sector’s future skills and development requirements.

4
1. INTRODUCTION
1.4 This Report
This report provides a summary of key local government workforce data and identifies the most significant challenges and opportunities for local government to inform the future development of the Australian local government workforce. Data about the status of the national local government workforce have been drawn from the Survey, the ABS, and other sources such as existing state and territory based workforce surveys (NSW DLG 2010; LGAQ 2010).
Data from the ABS 2011 Census account for over 156,000 persons, or about 80% of the 192,500-strong local government workforce estimated by the June 2011 ABS Employment and Earnings, Public Sector Survey. The Census data have been derived using the Employed Persons, Place of Work database and Public/Private Employer Indicator (GNGP) -3 (Local Government) within TableBuilder Pro.
This Report should be read in conjunction with the National Workforce Strategy.

2. Profile of the local government workforce

6
2. PROFILE OF THE LOCAL GOVERNMENT WORKFORCE
2. Profile of the local government workforce
2.1 Local government employees
The nearly 200,000 employees of local government work throughout Australia – within cities, regions, and through to the most remote parts of the country. In regional and rural Australia, local government is a significant employer both in absolute terms and in comparison to other sectors. Whilst employees of local government nationally are evenly split between men and women, there are large differences in gender distribution across states and occupation streams, reflecting the different roles local governments play across diverse communities, and due to entrenched gender roles in some occupations.
The local government workforce is ageing and is, on average, older than the national all-industries Australian workforce. However, male local government employees are disproportionally older than female local government employees.
Although the majority of council employees are employed on a full-time basis nationally, there are again striking differences in the distribution of part-time and full-time workers by jurisdiction and gender. This is because of variations in local government activities in different jurisdictions, and the gender composition of key industries such as health care/early childhood education (employing more women) and engineering/building roles (employing proportionally more men).
The employees of local government in Australia are described in more detail in Sections 2.1.1–2.1.5 below.
2.1.1 Total employment
The ABS estimated that the total local government workforce was 192,500 in 2013 (ABS 2013a). The councils that responded to the Survey employ 67,291 staff, or approximately 29% of the total national workforce.
2.1.2 Local government employment compared to other industry sectors
Local government employees are everywhere around Australia, and in particular local governments are key employers in regional and remote areas. A higher proportion of the local government workforce is employed in regional and rural areas compared to state, federal and Northern Territory governments, as well as important regional and remote employment industries (LGMA & ACELG 2013).1 Local governments are therefore important employers in rural and regional areas and the economic strength of these regions is increased by the capacity of local governments. Not only is the national local government workforce significant in numerical terms compared with other levels of government and other sectors, it also offers a range of high quality jobs and long term career opportunities across Australia. Employment in a regional or rural local government has the potential to offer significant flow on effects: it offers opportunities for on-going training and career path development; it will keep a family in the area and a part of the community; and it presents opportunities to attract health, education, transport and community services and infrastructure to the local area.
Figure 1 (ABS 2011) shows that, in comparison with other industries, only agriculture and mining have a higher proportion of their workforce employed in rural areas. Although health care, social assistance and education are important employing industries in regional and rural areas, employment in these sectors is more concentrated in urban centres compared to local government.
1 Calculated by ACELG utilising Australian Bureau of Statistics 2011 Census of Population and Housing – see ABS (2011).

7
2. PROFILE OF THE LOCAL GOVERNMENT WORKFORCE
The local government sector would do well to promote the important role it plays in regional development and in shaping local communities through the presence of its workforce in regional Australia.
Figure 1: Key industry workforce distribution by urban, regional and rural areas
On average, five per cent of the workforce in each local government area (LGA) is employed by local government. In regional and rural LGAs, local government is an even more significant employer. Over 60 regional and rural councils across the country employ at least 10% of the local workforce. In 25 regional and rural LGAs, local governments employ more than 20% of the workforce. In seven LGAs, over half the workforce is employed by local governments. In addition to its other functions, local government is playing a major role as an employer in these areas. In fact, in 17 regional and rural communities, local government is the largest employing industry sector (ABS 2011).
Given the high presence of local government in regional and rural Australia, and the fact that in many locations local government is the only level of government present in the area, local government’s mantra should be: strengthen the regions by strengthening local government.
2.1.3 Gender of employees in local government
Of the surveyed councils, 53% of employees were female and 47% were male. ABS Census data report 54% of local government employees being male and 46% of being female which is almost exactly the opposite proportions (ABS 2011). The difference in results between the two data sources could be a result of the survey data not being representative by state or council type (as illustrated in Table 12 and Table 13 in Appendix E), and error resulting from low levels of item response to questions in this part of the survey (see note at Appendix B).
Local government employment by gender differs between states. For example, in Victoria, 61% of local government employees are women compared to 39% in Queensland. These differences are
41%
71%
82%
26%
5%
53% 54%
41%
24%
16%
41% 38% 38%
36%
18%
5% 2%
33%
57%
9% 10%
0%
10%
20%
30%
40%
50%
60%
70%
80%
90%
Local Government State Government FederalGovernment
Mining Agriculture Health Care andSocial Assistance
Education
Urban Regional Rural and Remote

8
2. PROFILE OF THE LOCAL GOVERNMENT WORKFORCE
largely due to local governments in these two jurisdictions employing workers across a different range of occupations according to their strategic priorities and legislative requirements, and because there are some occupations in which either men or women are over-represented. Local governments in Victoria, for example, have a high level of expenditure on early childhood education (as operators of 30% of publicly funded child care facilities in the state (MAV & CCC 2005), social security, and welfare compared to other states (Dollery, Kortt & Grant 2013, p. 54). The largely female workforce within these service industries contributes to Victoria’s higher than average percentage of women in the workforce. Local governments in the Northern Territory, Queensland, Tasmania and New South Wales employ a higher proportion of men (above the national average), which can in part be explained by higher spending on transport, mining, manufacturing, construction and housing (Dollery, Kortt & Grant 2013, p. 54). Table 1 below shows the variation between Survey and ABS Census employment data (ABS 2011) by gender across the jurisdictions.
Table 1: Employment by gender, breakdown by jurisdiction
ACELG Survey ABS Census
State % male % female % male % female
NSW 52.6% 47.4% 60.2% 39.8%
WA 47.9% 52.1% 51.3% 48.7%
Victoria 37.3% 62.7% 39.1% 60.9%
Northern Territory 61.1% 38.9% 56.1% 43.9%
Queensland 61.0% 39.0% 60.8% 39.2%
South Australia 53.5% 46.5% 55.6% 44.4%
Tasmania 52.2% 47.8% 59.2% 40.8%
Following consultations with key local government stakeholders, ACELG has divided local government occupations into four streams, as follows:
Corporate services/governance: includes finance, customer service, IT, councillor support,
strategy and policy, community engagement, communications, contracts, procurement
Engineering/infrastructure: includes traffic, engineering and technical services, roads,
waste, design and architecture etc.
Human/community services: includes human resources, community development,
organisational performance, libraries, child care, recreation – including pools etc.
Planning and environment: includes strategic planning, land use, regulatory services
including rangers, parking officers etc., development, town planners, natural resource
management, environment and sustainability.
The difference in the number of men and women employed in local government according to the occupation streams in which they are employed can be clearly seen in Figure 2 (ABS 2011) below. Men predominate in engineering/infrastructure (90% of employees) and planning/environment

9
2. PROFILE OF THE LOCAL GOVERNMENT WORKFORCE
occupations (76% of employees), whilst women are more likely than men to be in corporate services/governance (65% of employees) and human/community services (78% of employees).
Figure 2: Occupation streams of local government employees by gender
These data demonstrates that there are tremendous opportunities to increase gender diversity in the engineering/infrastructure stream, where females are significantly under-represented with a presence of less than 10%. Engineering in local government offers good career prospects for female engineers. ACELG is aware that the Institute of Public Works Engineering Australia (IPWEA) is keen to address this imbalance, and ACELG and IPWEA are developing programs directed towards attracting more females into the engineering/infrastructure stream.
2.1.4 An ageing workforce
The local government workforce is ageing and, on average, is older compared with other government and industry sectors. As a large number of workers approach retirement at the same time, there are implications for local government in the areas of knowledge retention, recruitment, and replacement. According to the ABS Census, 37% of the local government workforce is aged 50 years or over, compared to the Australian labour force average of 29%. Correspondingly, the proportion of local government employees aged less than 35 years is much lower than for the Australian average. This suggests there is room for local government to be doing more to attract younger people to join its workforce. Figure 3 below compares across the ACELG Survey and ABS Census (2011) the proportion of the local government workforce in each age group (according to both the Survey and ABS Census) to the all-industry average workforce age distribution.
35.5%
90.3%
22.2%
75.5%
64.5%
9.7%
77.8%
24.5%
0%
10%
20%
30%
40%
50%
60%
70%
80%
90%
100%
Corporate services /governance
Engineering /infrastructure
Human / communityservices
Planning /environment
Male Female

10
2. PROFILE OF THE LOCAL GOVERNMENT WORKFORCE
Figure 3: ACELG Survey and ABS Census local government workforce by age
The ageing profile for local government workers is not the same for men and women. On average, male employees are older than female employees. ABS Census data (ABS 2011) show 41% of the men working in local government are aged 50 years or more compared to just 32% of women. Results from the Survey also reflect the disproportionally high amount of men aged 50 years and over, with the proportion of male and female local government employees by age illustrated in Figure 4 below.
Figure 4: Proportion of male and female local government employees by age
The ageing workforce is also unevenly distributed across the range of occupations represented in the local government workforce. Table 2 shows the occupations in local government with the highest and lowest numbers of employees aged 50 years or over as reported in the ACELG Survey. A high proportion of employees aged 50 years or more are labourers/plant operators and works/infrastructure managers. These positions involve manual labour and a certain level of fitness
6.6%
15.5%
36.8%
28.7%
12.3%
7.2%
17.8%
38.4%
26.3%
10.4% 13.1%
22.3%
35.5%
20.0%
9.1%
0%
5%
10%
15%
20%
25%
30%
35%
40%
45%
18-24 25-34 35-49 50-59 60+
ACELG Survey - LG Workforce
ABS Census 2011 - LG Workforce
ABS Census 2011 - National All-industries Workforce
7.5%
16.4%
33.6%
28.0%
12.3%
2.4%
8.6%
20.3%
34.7%
22.2%
8.9%
5.3%
0%
5%
10%
15%
20%
25%
30%
35%
40%
18 - 24 25 -34 35 - 49 50 - 59 60+ Age not known
Male Female

11
2. PROFILE OF THE LOCAL GOVERNMENT WORKFORCE
to perform the physical aspects of the job. As this cohort of workers ages, it may impact on their ability to continue to perform these functions at the same level, with some perhaps requiring redeployment and retraining. The ageing cohort of CEO/general manager also suggests that local government needs to be thinking about how to attract, retain and develop the next generation of highly skilled senior leaders.
Table 2: Local government employees aged 50 years or more by occupation
Occupations with the highest proportion of employees aged 50 years or more
Occupations with the lowest proportion of employees aged 50 years or more
CEO/general manager
Labourers/plant operators
Community transport operators/bus drivers
Home and community care/child care/community services
Works/infrastructure managers
Finance/payroll.
Communications/media
Urban planners/environment
Community engagement
Lifeguards/fitness instructors/pool attendants
IT/GIS
Greenkeepers
Arts/culture.
Table 3 below shows the 25 occupations with the highest proportion of workers aged 50 years and over according to the ABS 2011 Census data. Generally, these roles are in health care services, hospitality, labouring, and machine operating areas. Again, the comments about the implications of ageing workers in the labouring and CEO/general manager occupations apply here.
Table 3: Twenty-five occupations with highest proportion of workers aged 50+
ABS Census Occupation: % aged 50+
Miscellaneous Labourers 73.0
Legislators 70.1
Caretakers 68.7
Diversional Therapists 65.7
Bus and Coach Drivers 59.0
Registered Nurses 58.4
Delivery Drivers 58.1
Chief Executives and Managing Directors 57.9
Road and Rail Drivers 57.5
Carers and Aides 56.4
Aged and Disabled Carers 56.3
Agricultural, Forestry and Horticultural Plant Operators 56.0
12
2. PROFILE OF THE LOCAL GOVERNMENT WORKFORCE
ABS Census Occupation: % aged 50+
Nursing Support and Personal Care Workers 55.7
Truck Drivers 54.5
Storepersons 54.1
General Managers 53.9
Commercial Cleaners 53.5
Other Mobile Plant Operators 53.0
Cleaners and Laundry Workers 52.4
Earthmoving Plant Operators 52.3
Kitchenhands 51.8
Handypersons 51.6
Gallery, Museum and Tour Guides 51.5
Other Building and Engineering Technicians 51.5
Transport Services Managers 50.0
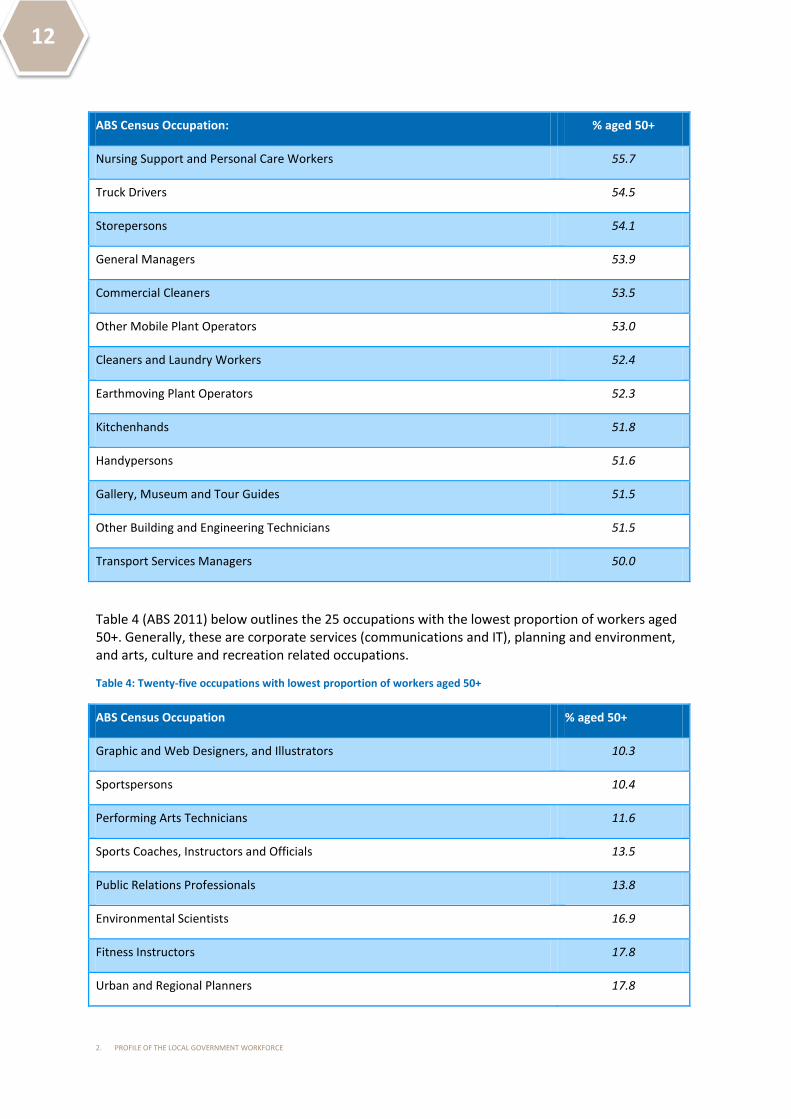
Table 4 (ABS 2011) below outlines the 25 occupations with the lowest proportion of workers aged 50+. Generally, these are corporate services (communications and IT), planning and environment, and arts, culture and recreation related occupations.
Table 4: Twenty-five occupations with lowest proportion of workers aged 50+
ABS Census Occupation % aged 50+
Graphic and Web Designers, and Illustrators 10.3
Sportspersons 10.4
Performing Arts Technicians 11.6
Sports Coaches, Instructors and Officials 13.5
Public Relations Professionals 13.8
Environmental Scientists 16.9
Fitness Instructors 17.8
Urban and Regional Planners 17.8

13
2. PROFILE OF THE LOCAL GOVERNMENT WORKFORCE
ABS Census Occupation % aged 50+
Computer Network Professionals 18.0
Advertising and Marketing Professionals 18.0
ICT Support Technicians 18.3
ICT Professionals not further defined 19.0
Human Resource Professionals 19.0
Conference and Event Organisers 20.6
Software and Applications Programmers 20.8
Architects and Landscape Architects 21.0
Electrical Distribution Trades Workers 21.3
Education Advisers and Reviewers 21.8
Database and Systems Administrators, and ICT Security Specialists 22.6
Early Childhood (Pre-primary School) Teachers 23.2
Electricians 24.4
Greenkeepers 24.6
Amusement, Fitness and Sports Centre Managers 24.9
Other Health Diagnostic and Promotion Professionals 25.0
Intelligence and Policy Analysts 25.0
A table showing all occupations by age of employee, based on the ACELG Survey data can be found at Appendix B.

14
2. PROFILE OF THE LOCAL GOVERNMENT WORKFORCE
2.1.5 Basis of employment
Councils were asked in the Survey to nominate how many of their employees work full-time, part-time and casual. Nationally, more than half (57%) of all employees are full-time, a quarter (24%) are part-time, and around a fifth (19%) are casual (Figure 5 – ACELG Survey).
Figure 5: ACELG Survey local government workforce by employment status
Data from the ABS 2011 Census indicate that the proportion of full-time employees is higher than indicated in the ACELG Survey, at close to 70%. However, differences in how Census employment data are collected, in terms of employment status categories and definitions, means the ACELG survey data are not directly comparable. The number of casual local government employees cannot be obtained from ABS Census data. Figure 6 (ABS 2011) shows the proportion of local government employees working full time, part time or away from work on the day of the Census in 2011.
Figure 6: ABS Census local government workforce by employment status
Figure 7 (ABS 2011) below shows how the employment status of the local government workforce compares to other industries and the all-industry average.
56.8% 24.3%
18.9% Full time
Part time
Casual
69.7%
24.3%
6.0%
Full time
Part time
Away from work

15
2. PROFILE OF THE LOCAL GOVERNMENT WORKFORCE
Figure 7: Employment status of local government employees compared to other industries
Nearly 40% of female employees in local government are employed part time, compared to 11% of male employees. Correspondingly, 83% of men are working full time compared to 54% of women. Figure 8 (ABS 2011) shows the employment statuses for local government employees by gender.
Figure 8: Employment status of local government employees by gender
6.4%
11.3%
15.7%
17.7%
17.9%
18.6%
19.3%
20.7%
22.2%
24.3%
24.3%
24.4%
26.1%
30.5%
30.8%
40.2%
40.5%
43.5%
45.2%
47.4%
55.2%
85.3%
83.3%
79.6%
75.1%
76.6%
77.4%
75.6%
72.5%
73.2%
69.7%
71.7%
69.3%
69.6%
63.3%
64.6%
54.8%
54.3%
49.8%
49.3%
47.2%
39.0%
8.3%
5.3%
4.7%
7.2%
5.5%
4.0%
5.2%
6.8%
4.6%
6.0%
4.0%
6.3%
4.3%
6.2%
4.7%
5.0%
5.2%
6.7%
5.5%
5.4%
5.8%
0% 20% 40% 60% 80% 100%
Mining
Electricity, Gas, Water and Waste Services
Manufacturing
Public Administration and Safety
Construction
Wholesale Trade
Financial and Insurance Services
Transport, Postal and Warehousing
Information Media and Telecommunications
Local Government
Professional, Scientific and Technical Services
Agriculture, Forestry and Fishing
Rental, Hiring and Real Estate Services
All Industries
Other Services
Education and Training
Administrative and Support Services
Health Care and Social Assistance
Arts and Recreation Services
Retail Trade
Accommodation and Food Services
Employed, worked part-time Employed, worked full-time Employed, away from work
83.2%
11% 5%
54.1%
39.3%
6.5%
0%
20%
40%
60%
80%
100%
Employed, worked full-time
Employed, worked part-time
Employed, away fromwork
Male Female

16
2. PROFILE OF THE LOCAL GOVERNMENT WORKFORCE
There may be an argument for increasing the number of flexible work arrangements, including access to part-time work, as part of a strategy to attract and maintain women in the local government workforce at higher management levels (see Section 2.2). Currently, local government levels of part-time employment amongst female employees is close to the industry average as can be seen in Figure 9 (ABS 2011) below.
Figure 9: Employment status of women in local government and all industries
The pattern of hours worked by local government employees varies by state and territory. In part this is because of the gender composition of the workforce. Victoria, with its larger female workforce (61%), has a higher proportion of employees working part-time. Queensland and New South Wales (where 60% of the local government workforce are male), have a very low proportion working part-time. The differences between jurisdictions, in terms of the range hours worked by their employees, can be seen in Figure 10 (ABS 2011) below. The high percentage of part-time workers in the Northern Territory is due to the high proportion of staff employed under employment schemes.
15.1%
23.6%
26.6%
27.9%
31.8%
32.4%
33.7%
34.6%
35.7%
36.9%
39.3%
41.6%
44.2%
44.3%
45.6%
47.4%
47.9%
48.2%
55.1%
58.2%
62.3%
78.1%
70.4%
65.2%
65.6%
62.5%
63.1%
61.3%
60.7%
57.4%
58.2%
54.1%
51.1%
50.5%
48.9%
49.1%
47.3%
47.1%
44.7%
39.0%
36.0%
31.7%
6.7%
6.0%
8.3%
6.5%
5.7%
4.4%
5.1%
4.7%
6.9%
4.9%
6.5%
7.3%
5.3%
6.7%
5.4%
5.3%
5.0%
7.1%
5.9%
5.8%
6.1%
0% 10% 20% 30% 40% 50% 60% 70% 80% 90% 100%
Mining
Electricity, Gas, Water and Waste Services
Public Administration and Safety
Financial and Insurance Services
Information Media and Telecommunications
Wholesale Trade
Manufacturing
Rental, Hiring and Real Estate Services
Transport, Postal and Warehousing
Professional, Scientific and Technical Services
Local Government
Agriculture, Forestry and Fishing
Construction
All Industries
Education and Training
Administrative and Support Services
Other Services
Health Care and Social Assistance
Arts and Recreation Services
Retail Trade
Accommodation and Food Services
Employed, worked part-time Employed, worked full-time Employed, away from work

17
2. PROFILE OF THE LOCAL GOVERNMENT WORKFORCE
Figure 10: ABS Census employee hours by jurisdiction
8%
11%
4%
7%
6%
7%
12%
2%
5%
18%
10%
15%
11%
11%
13%
13%
6%
8%
3%
6%
4%
4%
6%
5%
9%
15%
8%
10%
13%
13%
12%
7%
71%
48%
74%
62%
66%
65%
56%
74%
0% 10% 20% 30% 40% 50% 60% 70% 80% 90% 100%
NSW
Victoria
Qld
WA
SA
Tas
NT
ACT
0-9hrs 10-19hrs 20-24hrs 25-34hrs 35-40hrs

18
2. PROFILE OF THE LOCAL GOVERNMENT WORKFORCE
2.2 Women in Local Government
According to the ACELG Survey approximately one third of all councillors and mayors are women. An even smaller proportion of council CEOs are women (11%). The proportion of women in management positions increases as the managerial level falls, with large differences according to the occupation stream in which they are working. In occupations with a traditionally higher concentration of women, there are more women in management.
2.2.1 Women as elected representatives
At the last round of local government elections, there were 10,183 candidates competing for 3,944 councillor positions nationally (NSW Electoral Commission 2012).2 Women accounted for just 32% of all candidates and were elected to 30% of all councillor positions. This very low figure demonstrates that there remain barriers to female political participation in local government, and that the sector needs to develop more effective strategies for achieving candidate gender equity. Further research is required to determine why fewer women are putting themselves forward for election in order to develop strategies to make local government more attractive to prospective female candidates. Figure 11 (NSW Electoral Commission 2012) below shows the differences in gender distribution of elected members by state.
Figure 11: Currently serving elected members by gender
Nationally, 24% of all mayoral candidates were women, with 23% elected to mayoral positions. Women do quite well if they stand, with the data suggesting that if more women put themselves up for election for mayoral positions there would be a commensurate increase in the proportion of female mayors.
2 2014 ACELG analysis based on State Electoral Commission data for the most recent local government election in each
jurisdiction.
67.8% 73.0% 73.0%
65.9%
74.6% 70.8%
31.9% 30.6% 27.0%
34.1%
25.4% 29.2%
0%
10%
20%
30%
40%
50%
60%
70%
80%
WesternAustralia
New SouthWales
South Australia Victoria Tasmania Queensland
Currently serving elected members by Gender
Male Female

19
2. PROFILE OF THE LOCAL GOVERNMENT WORKFORCE
2.2.2 Women in Management
In the ACELG Survey, councils were asked if their current CEO is male or female. Of the 110 councils answering this question, 89% had male CEOs and 11% a female CEO.
Councils were also asked to nominate the number of male and female employees at each of the following levels of management:
Level 2 - Directors/senior executive (report to CEO and have managers/team leaders report to them)
Level 3 - Senior Managers/Managers (Report to Level 2 and AND have Level 4 report to them)
Level 4 - Coordinators/Line managers/Team leaders (Report to Level 3 OR 2 AND have staff report to them)
Three quarters (75%) of local government directors, CEOs and managing directors are male and only 25% are female. The proportion of women in leadership roles increases for managers (33%) and coordinators (43%) as can been seen in Figure 12 (ACLEG Survey).
Figure 12: ACELG Survey managerial level occupation by gender (n=110 councils)
The number of women in management positions varies according to the occupation stream in which they are working. The Survey found that, women in all leadership roles are over-represented in human and community services (63%), and under-represented in engineering/infrastructure (15%) and planning/environment (36%) (Figure 13). This suggests that there is a case for local government to address gender equity in these workforce streams.
ACELG recently commissioned research in Western Australia which examined aspects of leadership in local government, including factors affecting the recruitment of CEOs (Hutchinson, Walker & McKenzie 2014). The research found that, when recruiting a CEO, mayors look for someone with extensive experience at a similar level in another local government, with a technical background in financing and legislation. As mayors are looking for someone with lengthy experience in a similar role, they are recruiting from the same pool of older men. Given that younger people, women, Indigenous people, and people with culturally and linguistically diverse backgrounds are under-represented in leadership positions and therefore not part of the recruitment pool, the process perpetually retains the status quo.
74.7%
67.4%
56.9%
25.3%
32.6%
43.1%
0%
10%
20%
30%
40%
50%
60%
70%
80%
Directors Managers Coordinators
Male Female

20
2. PROFILE OF THE LOCAL GOVERNMENT WORKFORCE
Figure 13: ACELG Survey managerial level by gender in four occupation streams (n=110 councils)
Although the local government workforce is ageing, there are opportunities over the next five to ten years to support local government to lead the public sector with respect to providing quality employment opportunities for women. As discussed in more detail in32 Section 3.3.1, there are a high number of highly educated women currently in middle management. As the more senior male cohort approaches retirement age, career progression opportunities will likely open up for women to move into senior management roles in local government if they are supported with continued flexible work opportunities and if councils are encouraged to recruit capable women who might not already be in similar roles. The prominence of female employees in key local government service provision occupations (Figure 14 – ACELG Survey) coupled with the sector’s expanding service delivery role underscore the important contribution of women to essential local government services.
2.2.3 What women in local government are doing
The occupations in local government with the highest proportions of women working in them can be seen in in Figure 14 (ABS 2011) below.
54.0%
84.6%
37.2%
64.0%
46.0%
15.4%
62.8%
36.0%
0%
20%
40%
60%
80%
100%
CorporateServices/Governance
Engineering/Infrastructure Human and CommunityServices
Environment/Planning
Male Female

21
2. PROFILE OF THE LOCAL GOVERNMENT WORKFORCE
Figure 14: Occupations in local government with the highest proportions of women employed
74.8%
74.8%
75.0%
75.6%
76.0%
78.3%
79.0%
80.6%
81.2%
81.5%
84.0%
84.6%
84.8%
85.6%
85.7%
85.7%
86.6%
87.1%
88.0%
89.3%
90.5%
94.1%
94.5%
96.4%
97.8%
98.3%
98.5%
100.0%
0% 10% 20% 30% 40% 50% 60% 70% 80% 90% 100%
Hospitality Workers
Sales, Marketing and Public Relations Professionals
Education Professionals
Miscellaneous Technicians and Trades Workers
Health and Welfare Support Workers
Human Resource and Training Professionals
Miscellaneous Sales Support Workers
Personal Service and Travel Workers
Food Trades Workers
Accounting Clerks and Bookkeepers
Miscellaneous Education Professionals
Call or Contact Centre Information Clerks
Food Preparation Assistants
General Clerks
Checkout Operators and Office Cashiers
Education, Health and Welfare Services Managers
Health Therapy Professionals
Carers and Aides
Numerical Clerks
Keyboard Operators
Personal Carers and Assistants
Education Aides
Receptionists
Child Carers
School Teachers
Midwifery and Nursing Professionals
Personal Assistants and Secretaries
Hospitality, Retail and Service Managers
Female Male

3. Workforce issues

23
3. WORKFORCE ISSUES
3. Workforce issues Only a small proportion of local governments have an established workforce plan, although the majority say they are working towards implementing one. There are a number of significant and immediate challenges facing the sector nationally—including the ageing workforce, skill shortages and training needs—which require workforce planning to address. Many councils responding to the Survey identified limited human resource and workforce planning resources, and a lack of skills audits as barriers to developing their workforce strategically. The need for strengthened capacity and action on workforce planning and development has been recognised in the National Workforce Strategy.
3.1 Workforce planning
In the ACELG Survey, collectively a quarter of local governments reported either having an established workforce plan (10%) or being in the process of implementing one (17%), while the majority of local governments (61%) reported that they were developing a plan. The remaining 12% reported that they have no current plan to develop a workforce strategy (Table 5 – ACELG Survey).
Table 5: ACELG Survey workforce planning status (n=107 councils)
Which of the following best describes your council’s workforce planning status? %
Have an established workforce plan which is in place throughout the council. 10.0
Have developed and are implementing our work force plan 17.3
Have substantially completed a workforce plan 14.5
Have commenced work on a workforce plan 46.4
Not planning to do a workforce plan at present 11.8
In New South Wales and Western Australia, where workforce plans are mandatory for local government, all local governments responding to the Survey have or are developing a plan. The requirement for a workforce plan was introduced earlier in New South Wales (2009) compared to Western Australia (2013), and consequently, workforce planning is more developed in New South Wales. Currently 68% of local governments in New South Wales have established or are implementing a workforce plan, compared with the national average of 17%. This can be seen in Figure 15 below (ACELG Survey).

24
3. WORKFORCE ISSUES
Figure 15: ACLEG Survey workforce planning status by jurisdiction (n=106 councils)
3
In the Survey councils were asked to describe, in their own words, what they considered to be the top three challenges they face in workforce development. These responses were thematically coded and are initially reported quantitatively.
The foremost challenge is the ageing workforce and the high levels of impending retirements (19%). Other issues relating to the ageing workforce included knowledge management/transfer (11%), the difficulty in attracting younger workers to council (10%), and the investment required in new machinery/tools due to the decreasing physical capacity of workforce (10%). Challenges relating to skills shortages (19%), recruitment competition (19%), and competition with city councils (11%) are also key concerns. Identified challenges to workforce development relating to human resource management included a lack of workforce planning resources (18%), staff retention (15%), leadership development (15%), and succession planning (10%). Figure 16 (ACELG Survey) shows the proportion of local governments that nominated each issue.
3 Note: Tasmania has not been included in Figure 15 because of an insufficient number of responses.
67.9%
6.7%
24.1%
33.3%
32.1%
93.3%
58.6%
33.3%
75.0%
58.3%
17.2%
33.4%
25.0%
41.7%
0% 10% 20% 30% 40% 50% 60% 70% 80% 90% 100%
NSW
WA
VIC
NT
QLD
SA
Established/ Implementing Subtantially completed/Commenced Not planning to

25
3. WORKFORCE ISSUES
Figure 16: What does you organisation consider as the ‘biggest challenge’ facing your council in workforce development over the next 12 months (n=62 councils; Multiple answers possible).
Nearly one in five councils mentioned “legislative requirements/training/skills not available” as an issue. Local governments may not always be able to access the skills and qualifications needed for specific roles, either because training is not available locally (for regional and rural councils) or, more broadly, because state legislation requires qualifications which are no longer available or not transferrable from other jurisdictions. This seems to be a problem in Victoria particularly, where:
“the level of qualification required to be the Municipal Building Surveyor under the Victorian Building
Act precludes many possible candidates and the need to register and be qualified by the Victorian
Building commission prevents the easy transfer of most inter-state applications”
Western Australia seems to have a similar issue with qualified Environmental Health Officers, with one survey response noting that “WA no longer offers this specialist training”.
Responses indicating limited resources for human resources/workforce planning (18%) and a lack of organisational capacity to conduct skills audits to inform future training needs (10%) suggest that councils are struggling to resource critical internal workforce planning and systems.
“If additional finances are invested in workforce development, budget cuts must occur in other areas
of the business. Equally, the need to limit FTEs reduces council’s ability to place sufficient emphasis on
coaching, mentoring and on the job training”
Staff retention was mentioned by 15% of councils responding to this question, and there is clearly an issue around competition for skilled and semi-skilled staff in some areas, as noted by one respondent:
19.4%
19.4%
19.4%
17.7%
14.5%
14.5%
12.9%
11.3%
11.2%
9.7%
9.7%
9.7%
9.7%
9.7%
6.5%
6.5%
4.8%
0% 2% 4% 6% 8% 10% 12% 14% 16% 18% 20%
Ageing workforce/impending retirement
Legislative requirements/Training/skills not…
Competition for recruitment
Limited HR/Workforce planning resources
Staff retention
Leadership/development at team leader and…
Insufficient funds/councils not able to afford…
Knowledge management/transfer
Competition with city councils
Succession planning
Attracting younger workers
Population growth/increased expectations
Development of a skills audit to inform future…
Investment in equipment for ageing workforce
High cost of living/housing locally
Lack of consistant, sector wide data
Threat of amalgamation

26
3. WORKFORCE ISSUES
“Retention of staff with semi-professional skill levels [is a challenge] as opportunities at mine sites and
support industries continue to offer competitive remuneration packages”
However, other factors can come into play as well, particularly in regional areas:
“Job shedding by the… government sees partners and family members forced to seek work interstate”
Leadership was another issue mentioned by one in six councils – specifically the need to develop leadership skills in staff at all levels:
“Leadership, building effective leadership training into our organisation at all levels”
“Building leadership skills with coaching and mentoring programs”
“Leadership development of 3rd and 4th level managers and supervisors”
Other factors mentioned included the threat of amalgamations, the high cost of living/housing in rural and remote areas, and competition for staff with metropolitan councils. There is also the need not just to attract staff, but to get the right person for the job:
“As our shire is considered a hyper-growth council, it just does not need to attract professional staff
per se, but professionals who can help transform the shire into a modern and professional
metropolitan council.”
Of note here, is the predominance of issues that have been identified as strategic priorities in the National Workforce Strategy.
3.2 Diversity
Strategy three in the National Workforce Strategy has the objective of retaining and attracting a diverse workforce that reflects the demographics of local communities. In order to strengthen the data available and provide a baseline, councils were asked a number of questions designed to measure the extent to which diversity targets are being set across the local government workforce and benchmark the rate at which those targets are being met. However, diversity data was poorly reported by councils in the survey, presumably because they do not have in place an administrative mechanism to collect data about employee attributes.
First, councils were asked, for each diversity category – that is, Indigenous, disability, and culturally and linguistically diverse (CALD) – to nominate how many employees they currently have by gender, and whether they are full-time, part-time or casual. Although 110 councils completed these questions, anecdotal feedback suggests that respondents who were not sure of the number of employees in each category simply answered ‘zero’. Additionally, the total staff figures reported at this question are considerably lower than reported at a previous question (Section 2.1.1), suggesting additional problems with the validity of these data. Therefore, the Survey data on these diversity groups have not been reported for Indigenous and CALD employees, but instead, the ABS 2011 Census data has been used. In the case of disability, the Survey results have been reported as comparable data from the ABS 2011 Census are not available. Caution should therefore be exercised when reviewing the disability data provided in this report.
3.2.1 Indigenous
In 2008, the Council of Australian Governments (CoAG) agreed on six targets to address the disadvantage faced by Indigenous Australians in life expectancy, child mortality, education and

27
3. WORKFORCE ISSUES
employment (CoAG 2013). As part of this agenda, the federal and all state and territory governments (except Tasmania) committed to increasing Indigenous employment in the public sector to 2.6% by 2015 (APSC 2013). Nationally, 4.6% of local government employees identified as Indigenous in 2011, already exceeding the 2.6% CoAG target.
The public sector is an important employer of Indigenous people, employing 12.5% of Indigenous workers nationally, making it the second largest industry employer of Aboriginal and Torres Strait Islanders after health care and social assistance (14.6%). Other important industries employing Indigenous people include education and training (9%), construction (8%) and mining (3.6%) (ABS 2011).
Local governments employ a large number of Aboriginal and Torres Strait Islander people. Whilst local government employees represent only 9% of the total public service workforce in Australia, 22% of all Indigenous public sector workers are employed by local government (ABS 2011). Local government employs a higher proportion of Aboriginal and Torres Strait Islander people than federal government (1.6%) and state/territory governments (1.9%) (ABS 2011). By way of comparison, nationally, 3.1% of employees in mining and 2.7% of employees in all public administration (including the three tiers of government) are Indigenous (ABS 2011).
The story of Indigenous employment in local government is more complex at the jurisdictional level. In the Northern Territory, over 50% of local government employees are Indigenous. In South Australia (1.7%) and Victoria (0.6 %) the proportion of Indigenous employees is lower than the CoAG target of 2.6%. The Northern Territory and Queensland employ a larger proportion of Aboriginal and Torres Strait Islander workers than in their population as a whole. Figure 17 (ABS 2011) shows a comparison of the proportion of employees in local government identifying as Indigenous to the proportion of the total Indigenous population in each state and the Northern Territory.
Figure 17: Proportion of local government Indigenous employees and Indigenous adult population by jurisdiction
In the Census year 2011, around 20% of the Indigenous local government workforce were employed under Community Development Employment Projects (CDEP) which are subsidised by the federal government and subjected to frequent review and policy change, making them a less secure and sustainable form of employment. Indigenous persons employed under CDEP are particularly
2.5%
0.7%
3.6%
1.9%
3.1%
4.0%
26.8%
2.9%
0.6%
7.1%
1.7%
3.7%
2.7%
55.3%
0% 10% 20% 30% 40% 50% 60%
New SouthWales
Victoria
Queensland
South Australia
WesternAustralia
Tasmania
NorthernTerritory
Percent Indigenous employment in local government workforce Jurisdiction Indigenous population

28
3. WORKFORCE ISSUES
concentrated in the Northern Territory (36% of Indigenous local government employees) and Western Australia (35% of Indigenous local government employees).
Across Australia, almost two thirds of Indigenous employees in local government are men, and Indigenous men are much more likely to be employed full-time than Indigenous women. As with the overall local government workforce, the balance of male to female Indigenous workers also varies by jurisdiction. For example, in Victoria almost 60% of the Indigenous workforce is female, whilst in Queensland this figure is much lower at around 34%. Figure 18 (ABS 2011) shows the proportion of male and female Indigenous employees working full time and part time in the states and Northern Territory.4
Figure 18: ABS Census Indigenous workforce by gender by employment status by jurisdiction
Compared to non-Indigenous employees, Aboriginal and/or Torres Strait Islander people in local government are slightly more likely to be working fewer hours per week, as in Figure 19 (ABS 2011) below.
4 The Australian Capital Territory has been excluded as the Census only records three full time Aboriginal employees of
local government.
59.1%
34.0%
50.7% 48.3%
36.7%
60.8%
31.3%
7.2%
7.3%
15.6% 12.2%
26.6%
7.2%
29.1%
20.9%
26.2%
24.5% 26.5%
12.4%
16.5%
19.3%
12.8%
32.5%
9.1% 12.9%
24.3% 15.5%
20.3%
0%
10%
20%
30%
40%
50%
60%
70%
80%
90%
100%
New South Wales Victoria Queensland South Australia Western Australia Tasmania Northern Territory
Male full time Male part time Female full time Female part time

29
3. WORKFORCE ISSUES
Figure 19: Percentage of Indigenous and non-Indigenous local government employees by hours worked week of the ABS 2011 Census
Aboriginal and/or Torres Strait Islander employees of local government nationally are over-represented in some occupations, including health and welfare support workers; labourers; cleaners and laundry workers; construction and mining labourers; and farm, forestry and garden workers (ABS 2011). Figure 20 (ABS 2011) below shows the proportion of the local government Indigenous and non-Indigenous workforce in each of these occupations as a proportion of the total local government Indigenous and non-Indigenous workforce.
Figure 20: Percentage of local government workforce by occupation
While local government is leading the public and other sectors in Indigenous employment and far exceeding CoAG targets, the changes to CDEP and other employment programs have the potential to jeopardise these figures. There are also opportunities to create more stable positions and better
3.6
% 7
.2%
12
.0%
10
.9%
32
.9%
17
.0%
5.7
%
7.9
%
2.9
%
4.8
%
6.9
%
8.2
%
8.8
%
35
.3%
16
.8%
10
.9%
7.2
%
1.2
% 4
.7%
7.0
%
8.4
%
8.8
%
35
.2%
16
.7%
10
.7%
7.2
%
1.2
%
0%
5%
10%
15%
20%
25%
30%
35%
40%
0 1-15 16-24 25-34 35-39 40 41-48 49 and over not stated
Indigenous Non-Indigneous All local government
7.0%
9.6%
3.4%
7.1%
11.5%
2.5%
4.6%
1.5%
3.1% 2.0%
0%
2%
4%
6%
8%
10%
12%
14%
Health and WelfareSupport Workers
Miscellaneous andnfd Labourers
Cleaners andLaundry Workers
Construction andMining Labourers
Farm, forestry andgarden workers
% of LG Indigenous workforce % of LG non-Indigenous workforce

30
3. WORKFORCE ISSUES
career opportunities for Indigenous employees, as currently there are few Indigenous people in local government leadership positions.
3.2.2 Disability
Councils reported having 801 employees nationally with a disability although, as discussed above, these survey data are considered to be incomplete and the numbers would seem to be under-reported (Table 6 – ACELG Survey).
Table 6: Disability status by gender by employment status by jurisdiction
State Male F/T Female F/T Male P/T Female P/T Male Casual Female Casual
NSW 54 22 6 4 7 5
WA 33 15 5 19 3 8
Vic 100 99 100 100 99 100
NT 1 1 0 0 0 0
QLD 10 2 0 1 0 1
SA 3 0 1 2 0 0
Total 201 139 112 126 109 114
The ABS Census only collects data for persons with a severe disability requiring assistance. Accordingly, useful comparisons with the ACELG Survey data cannot be made.
3.2.3 Culturally and Linguistically Diverse (CALD)
According to the ABS 2011 Census, 11% of employees in local government in Australia speak a language other than English at home. The proportion of women employees of local government who speak a language other than English at home (11.5%) is close to the proportion of men (10.9%). By way of comparison, 24% of all employed persons nationally across all industries speak a language other than English at home. Figure 21 (ABS 2011) shows the proportion of local government employees and employed people in all industries that speak a language other than English at home. In the Northern Territory, the relatively high proportion of Indigenous employees in local government is reflected in the large proportion of speakers of a language other than English at home.

31
3. WORKFORCE ISSUES
Figure 21: Proportion of local government employees speaking a language other than English at home by jurisdiction, compared to All Industries
Although we have not compared local government’s performance with other sectors, it is clear that local government could be doing more to attract CALD employees to ensure its workforce better reflects the broader population.
3.2.4 Diversity Targets
Councils were asked in the Survey whether they have diversity targets in place, whether they are working towards introducing targets, or whether they have no plans for diversity targets.
The majority of councils (70%) have no plans to implement diversity targets for their workforce. Of the 107 local governments answering this question, only eight (7%) have diversity targets in place, though a further 25 (23%) reported that they are working towards introducing diversity targets (Figure 22 – ACELG Survey).
Figure 22: Councils with diversity targets (n=107 councils)
22.7%
21.8%
9.8%
13.3%
14.6%
4.4%
19.2%
24.0%
10.0%
13.1%
8.2%
7.4%
10.5%
2.5%
51.1%
11.2%
0% 10% 20% 30% 40% 50% 60%
New South Wales
Victoria
Queensland
South Australia
Western Australia
Tasmania
Northern Territory
Australia
Local Government All industries
7.3%
22.7%
70.0%
In place
Working towards
No plans

32
3. WORKFORCE ISSUES
Given the generally low levels of employment of people from CALD communities in local government, this is concerning.
3.3 Education and Training
The National Workforce Strategy recognises the importance of investing in skills for workforce development. In general, employees of local governments have higher levels of educational attainment than the all-industries workforce across Australia, with female employees of local government holding more university level qualifications than male employees. Although the Survey results in this area are incomplete, the Survey results suggest that local governments are spending only a small amount on training (as a proportion of total payroll), and that there are relatively few apprentices in the key occupations that are experiencing skills shortages.
Based on data from the Survey, local governments are carrying an average of 19 unfilled vacancies per council. The turnover rate able to be calculated from the Survey data shows that local governments have only a slightly higher staff turnover than the all-industry Australian average.
The education and training of local government employees and skills shortages being experienced by councils are discussed in more detail below.
3.3.1 Education
Many councils do not collect or maintain information about the education level of their employees, and others were only able to provide information about some of their employees. Educational attainment information is provided for only about 10% of total employees in councils that completed the Survey. Therefore, ABS Census data has been used to report on the education levels of local government employees.
Women employed by local governments are, on average, more highly educated than men. Nearly a third (30 per cent) of female employees hold a bachelor’s degree or higher qualification, compared to 21 per cent of male employees. As can be seen in Figure 23 (ABS 2011), compared to employees of all industries, local government employees generally have higher levels of education.
4.3% 2.7%
14.0% 10.9%
30.2%
34.7%
4.7% 5.0%
19.8%
15.4%
21.1%
30.5%
2.9% 1.4%
10.9%
6.5%
14.6%
54.9%
0%
10%
20%
30%
40%
50%
60%
Postgraduate DegreeLevel
Graduate Diploma andGraduate Certificate
Level
Bachelor Degree Level Advanced Diplomaand Diploma Level
Certificate Level High School Only
Male - LG Female - LG All industries
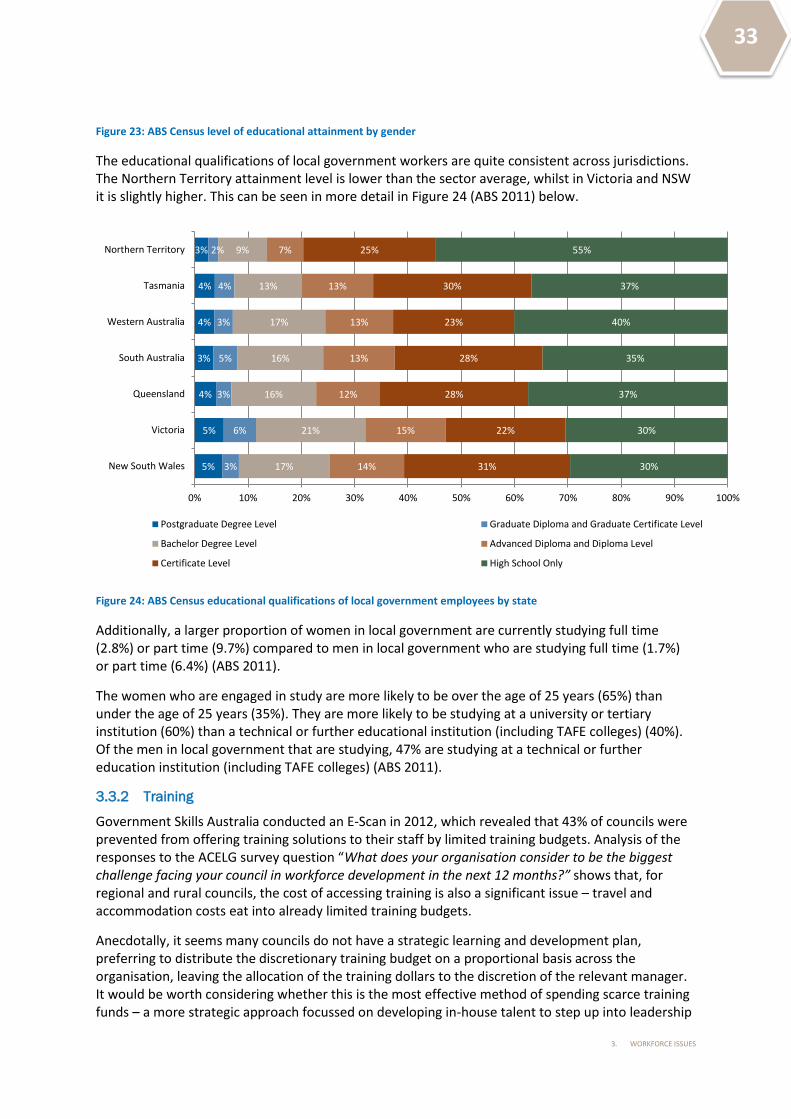
33
3. WORKFORCE ISSUES
Figure 23: ABS Census level of educational attainment by gender
The educational qualifications of local government workers are quite consistent across jurisdictions. The Northern Territory attainment level is lower than the sector average, whilst in Victoria and NSW it is slightly higher. This can be seen in more detail in Figure 24 (ABS 2011) below.
Figure 24: ABS Census educational qualifications of local government employees by state
Additionally, a larger proportion of women in local government are currently studying full time (2.8%) or part time (9.7%) compared to men in local government who are studying full time (1.7%) or part time (6.4%) (ABS 2011).
The women who are engaged in study are more likely to be over the age of 25 years (65%) than under the age of 25 years (35%). They are more likely to be studying at a university or tertiary institution (60%) than a technical or further educational institution (including TAFE colleges) (40%). Of the men in local government that are studying, 47% are studying at a technical or further education institution (including TAFE colleges) (ABS 2011).
3.3.2 Training
Government Skills Australia conducted an E-Scan in 2012, which revealed that 43% of councils were prevented from offering training solutions to their staff by limited training budgets. Analysis of the responses to the ACELG survey question “What does your organisation consider to be the biggest challenge facing your council in workforce development in the next 12 months?” shows that, for regional and rural councils, the cost of accessing training is also a significant issue – travel and accommodation costs eat into already limited training budgets.
Anecdotally, it seems many councils do not have a strategic learning and development plan, preferring to distribute the discretionary training budget on a proportional basis across the organisation, leaving the allocation of the training dollars to the discretion of the relevant manager. It would be worth considering whether this is the most effective method of spending scarce training funds – a more strategic approach focussed on developing in-house talent to step up into leadership
5%
5%
4%
3%
4%
4%
3%
3%
6%
3%
5%
3%
4%
2%
17%
21%
16%
16%
17%
13%
9%
14%
15%
12%
13%
13%
13%
7%
31%
22%
28%
28%
23%
30%
25%
30%
30%
37%
35%
40%
37%
55%
0% 10% 20% 30% 40% 50% 60% 70% 80% 90% 100%
New South Wales
Victoria
Queensland
South Australia
Western Australia
Tasmania
Northern Territory
Postgraduate Degree Level Graduate Diploma and Graduate Certificate Level
Bachelor Degree Level Advanced Diploma and Diploma Level
Certificate Level High School Only

34
3. WORKFORCE ISSUES
positions, or on further developing current skills so employees are able to move flexibly between occupations experiencing skills shortages, would arguably return better results.
Training budget
Councils were asked to provide their total annual training budget for the financial year 2011–12, including any separate allocation for training related travel if appropriate and their total annual payroll for the same period.
Only 43 councils provided information about their training budget and payroll. On average, these councils spent 1.1% (with a range of 0.04% to 3.5%) of their payroll budget on training.
Training provided
Councils were asked to provide numbers of employees to whom they had provided mandatory and discretionary training in the previous financial year, by occupation.
Mandatory training was defined as that which staff required in order to continue being employable in their position. Discretionary training was defined as council support, either financially or in kind, including study leave or other flexible arrangements for employees, to continue their studies. Note that studies could include trainees and council-employed apprenticeships, and VET, university or professional development courses including short courses and conferences.
Only 40 councils provided data in response to this question and most data was incomplete, with as few as two councils answering some parts of the question. As a consequence, Table 7 (ACELG Survey) below is not representative of all training in local government; it merely provides a snapshot of the training received by employees only for those councils that answered this part of the Survey.
Table 7: Occupations in local government receiving the highest proportions of mandatory training
Occupation % received
mandatory training
Golf Course Manager/staff 50.9
Tree Lopping / Wood Chipping Worker 48.1
Health Inspector 29.3
Airport Manager/Officer/Groundsman 28.6
Occupational Health and Safety Officer 26.9
Natural resource management manager/coordinator 22.6
Childcare Director/ Manager 21.4
Pool Manager/ Assistant Pool Manager/ Pool Attendant 20.7
Cemetery Officer / Curator / Worker / Grave Digger 20.6
Social Planner 20.4
Works Supervisor 20.0

35
3. WORKFORCE ISSUES
Occupation % received
mandatory training
Plant Operator – Other 19.7
Recreation Services Manager / Centre Manager 19.6
Parks & Gardens Leading Hand / Team Leader / Ganger 19.6
Natural resource management officer 19.5
Plant Operator – Grader Driver 19.4
Customer Services Manager/Coordinator 18.8
A table showing the Survey results for the number of employees in each occupation that received training can be found at Appendix C.
3.3.3 Apprenticeships
Councils were asked whether they directly employed apprentices. They were told not to include apprentices employed through group training schemes or contract suppliers.
Of the 98 councils answering this question, 55% reported not directly employing apprentices. The remaining 44 councils directly employed apprentices. In areas experiencing skills shortages, councils employ a total of 178 apprentices (on average approximately four each). The distribution of apprentices employed by councils in areas of skills shortage can be found at Table 8 (ACELG Survey).
Table 8: Number of local government-employed apprentices in areas of skills shortage
State
Co
un
cils that e
mp
loy
app
ren
tices
Apprenticeship types
Electrician
Plu
mb
er
Gasfitte
r
We
lde
r
Sign W
riter
Mo
tor
me
chan
ic
Die
sel/p
lant
me
chan
ic
Carp
en
ter
Gard
en
er/
gree
nke
ep
er/
ho
rticultu
ralist
Oth
er trad
e
Total
NSW 17 11 15 0 2 0 7 13 8 30 7 93
WA 11 0 0 0 0 0 3 2 0 10 2 17
Vic 9 0 0 0 0 0 1 1 1 19 1 23
NT 2 0 0 0 0 0 1 0 0 1 3 5
QLD 3 10 2 0 7 0 7 5 1 4 1 37
Tas 1 0 0 0 0 0 0 0 0 2 0 2

36
3. WORKFORCE ISSUES
State
Co
un
cils that e
mp
loy
app
ren
tices
Apprenticeship types
Electrician
Plu
mb
er
Gasfitte
r
We
lde
r
Sign W
riter
Mo
tor
me
chan
ic
Die
sel/p
lant
me
chan
ic
Carp
en
ter
Gard
en
er/
gree
nke
ep
er/
ho
rticultu
ralist
Oth
er trad
e
Total
SA 1 0 0 0 0 0 1 0 0 0 0 1
Total 44 21 17 0 9 0 20 21 10 66 14 178
The apprentices were employed and being trained in:
Motor mechanic
Gardener/greenkeeper
IT
Construction
Accurate information about the employment of apprentices in local government cannot be obtained from the ABS or National Centre for Education Research (NCVER) because the data collection methodology in each case is unsuitable to describe apprenticeships in local government.
3.3.4 Vacancies and Skills Shortages
Councils were asked a number of questions about vacancies in order to identify those occupations in which there are local, regional or national skill shortages. By quantifying the extent of skills shortages in local government, the sector may be able to attract funding to provide more training in those occupations.
Noting limitations in this data5, but taking it at face value, councils reported a total of 2,081 current vacancies at the time of the Survey, an average of 19 per council for the 109 councils answering this question Table 9 – ACLEG Survey).
5 In the wording of the five survey questions relating to vacancies, ‘current vacancies’ [(a) in Table 9 was intended to refer
to the sum of vacancies currently active, i.e. where council is actively seeking to fill the vacancy [the sum of (b), (c), and (d) in Table 9]. Positions vacant but not currently being advertised [(e) in Table 9 below] was intended to refer to those positions which sit on councils books but, for strategic, organisational or economic reasons, for which councils are not currently seeking to fill the vacancy. It is clear from the data that there are reliability issues, with some councils reporting (e) as a sub-set of (a), and others as additional to (a). As a consequence, the ‘total’ row of Table 9 cannot be summed and it is impossible to know to what degree there is double counting of some vacancies.

37
3. WORKFORCE ISSUES
Table 9: Vacancies in local government
State Number of councils
providing data
Current Vacancies (a)
Active positions – vacant less
than 6 months (b)
Active positions –
vacant for 6-12 months (c)
Active positions – vacant for
more than 12 months (d)
Positions vacant but
not currently being
advertised (e)
NSW 28 793 371 101 105 338
WA 29 285 158 19 4 136
VIC 30 592 385 34 13 288
NT 6 38 31 2 0 5
QLD 4 286 125 77 84 95
Tas 1 2 2 0 0 0
SA 11 85 42 0 0 28
Total 109 2,081 1,114 233 206 890
Respondents were asked to specify those positions which had been vacant for more than six months. Vacancies were highest among the following occupations:
Engineering (16% of responses)
Design/survey/drafting (10%)
Childcare/early childhood development (10%)
Director/senior management (10%)
Planner (7%)
Leisure/pools/gym attendant (6%)
Ganger/general hand (5%).
These findings are supported by Government Skills Australia’s 2012 E-scan which identified engineers, planners, childcare staff, environmental health workers, surveyors and managers as the most difficult occupations to recruit. The Commonwealth Department of Employment (formerly Department of Education, Employment and Workplace Relations [DEEWR]) also identifies these occupations as national skills shortage areas in several states and territories, with many relevant across multiple industries and not just local government (DEEWR 2013). This means that, in areas where local government has difficulty recruiting staff due to skills shortages, it is also often in competition with other industries for these workers.
This points to the need for local government to differentiate itself from other sectors, perhaps promoting itself as an employer of choice that provides flexible working conditions, career development opportunities, and the chance to contribute to civic life and community wellbeing. This promotion would require many councils to re-calibrate their already strong relationships with universities and schools, and broaden their understanding of these institutions to include potential future employees. A number of state-based local government associations across the country have

38
3. WORKFORCE ISSUES
conducted campaigns highlighting the benefits of a career in local government, for example the Local Government Association of South Australia’s ‘Shape Your World’ and ‘Careers in Council – Get Closer’ initiatives (LGA SA n.d.).
3.4 Staff turnover
Councils were asked to provide age and gender information for all staff that had commenced work with the council or had ceased employment with the council in the previous financial year.
3.4.1 Separations
Although approximately two-thirds of all separations were of workers aged between 21 and 49 years, the proportion of separations in each age group roughly matches the age profile of the local government workforce (Table 10 – ACELG Survey). As the workforce ages and a higher proportion of employees approach retirement, it would benefit local governments to increase the proportion of younger employees who maintain their employment with council.
Table 10: Separations in local government
Separations Male Female Total
AGE Number % of male
Number % of female
Number % of total
Under 21 173 7.5 157 5.8 330 6.5
21 - 34 728 31.4 967 35.5 1695 33.6
35 - 49 683 29.4 921 33.8 1604 31.8
50+ 738 31.8 682 25.0 1420 28.1
TOTAL 2,322 2,727 5,049
3.4.2 New Starters
Survey respondents reported that more people had commenced work at councils (6,196) (Table 11 – ACELG Survey) than had left them (5,049 in the separations table - Table 10 (ACELG Survey) – above).
Table 11: New starters in local government
New starters Male Female Total
AGE Number % of male Number % of female Number % of total
Under 21 301 11.5 425 11.9 726 11.7
21 - 34 934 35.8 1,244 34.7 2,178 35.2
35 - 49 869 33.3 1,274 35.5 2,143 34.6
50+ 504 19.3 645 18.0 1,149 18.5
Total 2,608 3,588 6,196
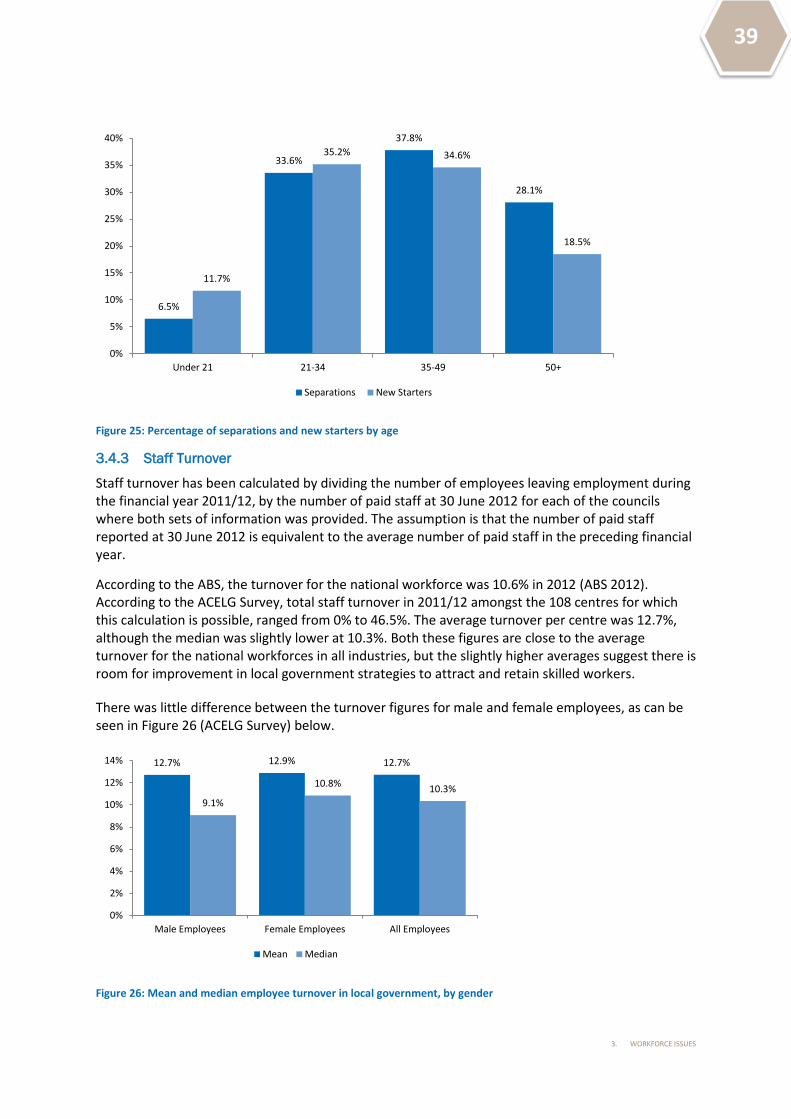
39
3. WORKFORCE ISSUES
Figure 25: Percentage of separations and new starters by age
3.4.3 Staff Turnover
Staff turnover has been calculated by dividing the number of employees leaving employment during the financial year 2011/12, by the number of paid staff at 30 June 2012 for each of the councils where both sets of information was provided. The assumption is that the number of paid staff reported at 30 June 2012 is equivalent to the average number of paid staff in the preceding financial year.
According to the ABS, the turnover for the national workforce was 10.6% in 2012 (ABS 2012). According to the ACELG Survey, total staff turnover in 2011/12 amongst the 108 centres for which this calculation is possible, ranged from 0% to 46.5%. The average turnover per centre was 12.7%, although the median was slightly lower at 10.3%. Both these figures are close to the average turnover for the national workforces in all industries, but the slightly higher averages suggest there is room for improvement in local government strategies to attract and retain skilled workers.
There was little difference between the turnover figures for male and female employees, as can be seen in Figure 26 (ACELG Survey) below.
Figure 26: Mean and median employee turnover in local government, by gender
6.5%
33.6%
37.8%
28.1%
11.7%
35.2% 34.6%
18.5%
0%
5%
10%
15%
20%
25%
30%
35%
40%
Under 21 21-34 35-49 50+
Separations New Starters
12.7% 12.9% 12.7%
9.1%
10.8% 10.3%
0%
2%
4%
6%
8%
10%
12%
14%
Male Employees Female Employees All Employees
Mean Median

40
3. WORKFORCE ISSUES
3.4.4 Local Government Staff Mobility
Changes to ABS reporting of Census data and the new ability to link records between the 2006 and 2011 Census of Population and Housing allows analysis of the retention and attraction of staff to local government. Nearly half (49.1%) of people employed in local government at the ABS 2006 Census were still working in local government at the time of the ABS 2011 Census. A small number (1.5% of 2006 local government employees) had moved into federal government employment; 5.2% had moved into state/territory government employment; and 26.3% had taken jobs in the private sector.
Very similar proportions of people entered local government employment from the other levels of government or the private sector. Of the people employed in local government in 2011, 45.3% were working there in 2006; 1.6% came from federal government employment; 4.9% came from state/territory government; and a third (33.0%) had come from the public sector (ABS 2011). The remaining 25.2% of local government employees in 2011 were not working in 2006, either because they were unemployed or had not yet entered the workforce.

4. Conclusion

42
4. CONCLUSION
4. Conclusion As noted in the introduction to this report, the local government sector in Australia is a significant employer, particularly in regional, rural and remote areas. Local government offers employment across a wide range of occupations. Local government needs a skilled, capable and innovative workforce to ensure it can fulfil its very broad service delivery, place-shaping, and community leadership roles. The findings of the ACELG Survey and analysis of ABS Census data outlined in this report has sought to fill current gaps in knowledge about the local government workforce. This report is intended to complement, and be read in conjunction with, the National Workforce Strategy prepared for ACELG by LGMA National in 2012.
4.1 Key Findings
Some of the key findings detailed in this report are summarised in the points below.
Local government employees are everywhere – From the city to the bush, local governments are key employers everywhere. A higher proportion of the local government workforce is employed in regional and rural areas compared to other levels of government and important regional and remote employing industries. Given the significance of local government to the Australian regional and rural workforce and the fact that, in many locations, local government is the only level of government present in the area, strengthening the local government sector represents an excellent opportunity to secure and strengthen the economic, environmental and social foundations of rural and regional communities across the breadth of the country.
Gender of local government employees – Local government nationally employs a slightly higher proportion of men than women. However, there are significant jurisdictional differences. There is a need to increase gender diversity in the engineering/infrastructure occupation stream, where females are significantly under-represented with a presence of less than 10%. Providing more flexible employment opportunities in key occupations, attracting, training and retaining skilled female employees, and re-imagining existing relationships with local schools and tertiary institutions may assist in establishing gender equity in the sector.
An ageing workforce – The local government workforce is ageing, and is older compared with other government and industry sectors. Male employees are older than female employees, with a higher proportion of male employees aged 50 years or more. The ageing cohort of CEOs and general managers also suggests local government needs to be thinking about how to develop, attract and retain the next generation of senior leaders.
Education levels – Women working in local government are more highly educated than their male counterparts. When considered in the context of an ageing cohort of CEOs and general managers, this suggests there may be opportunities to address gender imbalance in senior leadership ranks by developing talented mid-level female managers and enabling career progression opportunities.
Women as elected representatives – Only one third of councillors and mayors are women, and an even smaller proportion (11%) of council CEOs/general managers are women. Women accounted for just 32% of candidates at the last round of local government elections. Local government and political organisations have a long way to go before they achieve candidate gender equity. Further research is required to determine what the barriers might be to female political participation in local government.
Workforce planning – Not surprisingly, the development of workforce plans is more common in jurisdictions where workforce planning is mandatory. The biggest workforce challenge facing local government is an ageing workforce and the high levels of impending retirements.

43
4. CONCLUSION
Differences in how local governments with voluntary and mandatory workforce planning respond to the ageing workforce challenge will be a key indicator of the success of workforce planning initiatives.
Indigenous employees – While local government is leading the public and private sectors in Indigenous employment and currently far exceeding CoAG targets, the changes to Community Development Employment Projects (CDEP) and other employment programs has the potential to jeopardise this standing. There are opportunities to create more stable positions and better career opportunities for local government Indigenous employees, as currently there are few Indigenous people in leadership positions.
Training and development – A more strategic approach to training and development focussed on developing in-house talent to step into leadership positions, and on developing the skills of current employees so they are able to move flexibly between occupations experiencing skills shortages would yield positive outcomes.
Vacancies and skill shortages – Local government is experiencing skills shortages in areas commonly identified by other sectors and industries. This means that, in areas where local government experiences difficulties in recruiting , it is likely to be in competition with other industries for staff. Local government can learn valuable lessons from human resources strategies in other sectors by differentiating itself as an employer of choice and encouraging and promoting flexible working conditions, career development opportunities, and the chance to contribute to civic life and community wellbeing. The evidence suggests that flexible working conditions and career development is likely to contribute to a more equitable and diverse workforce that better represents the diverse communities served by local governments around the country.

44
4. CONCLUSION
4.2 ACELG’s response
Along with others in the local government sector, ACELG intends to play a leading role in responding to some of the findings outlined in this report and continue to implement the National Strategy through its research and program activities. To date, a number of key actions have been taken that can be built upon into the future. Some of these initiatives include:
Research into the factors impacting on the attraction and retention of CEOs and senior managers in rural-remote and Indigenous local government and a “how to” guide for recruitment, retention and performance management of CEOs and senior managers in remote locations
Research into the qualities, experiences and attributes Western Australian councils seek from prospective CEOs, and the formal and informal policies and processes councils use to identify and recruit suitable candidates
An upcoming guide on mature talent management
Ongoing activities around Indigenous employment in Australian local government.
ACELG looks forward to continuing to work with key stakeholders to implement the National Strategy and welcomes comments on this report, which can be directed to:
Melissa Gibbs Deputy Director, Australian Centre of Excellence for Local Government [email protected] + 61 2 9514 4890

6. References

46
5. REFERENCES
5. References Australian Bureau of Statistics (ABS) 2011, 2011 Census of population and housing, TableBuilder Pro, ABS, Canberra, viewed 4 February 2015, <http://www.abs.gov.au/ausstats/[email protected]/productsbyCatalogue/BDEC4CD3C1D75B6ACA257C43001322AF?OpenDocument>. Australian Bureau of Statistics 2012, Labour mobility, February 2012, cat. no. 6209.0, ABS, Canberra, viewed 4 February 2015, <http://www.abs.gov.au/ausstats/[email protected]/ProductsbyReleaseDate/62603745FABBDD59CA257BCD0016600B?OpenDocument>. Australian Bureau of Statistics 2013a, Employment and earnings, public sector, Australia, 2012–13, cat. no. 6248.0.55.002, ABS, Canberra, viewed 4 February 2015, <http://www.abs.gov.au/AUSSTATS/[email protected]/allprimarymainfeatures/ED0C80045E5C3D90CA257D8E000F5466?opendocument>. Australian Bureau of Statistics 2013b, Government finance statistics, Australia, 2011-12, cat. no. 5512.0, ABS, Canberra, viewed 4 February 2015, <http://www.abs.gov.au/AUSSTATS/[email protected]/allprimarymainfeatures/321F06233DD633F0CA257CE50012DA2C?opendocument>. Australian Public Service Commission (APSC) 2013, Indigenous employment strategy, 2012– 2016, APSC, Canberra. Council of Australian Governments (COAG) n.d., Closing the gap in indigenous disadvantage, reform agenda, CoAG, viewed 16 October 2013, <http://www.coag.gov.au/closing_the_gap_in_indigenous_disadvantage>. Department of Education, Employment and Workplace Relations (DEEWR) 2013, National skills shortage list, 2012–2013, DEEWR, Canberra. Department of Regional Australia, Local Government, Arts and Sport (DRALGAS ) 2012, 2009–10 Local government national report, DRALGAS, Canberra. Dollery,B., Kortt, M. & Grant, B. 2013, Funding the future, Federation Press, Glebe . Hutchison, J., Walker, E. & McKenzie, F.H. 2014, Leadership in local government: Factors affecting the appointment of CEOs, Australian Centre of Excellence for Local Government (ACELG), University of Technology, Sydney. Local Government Association of Queensland (LGAQ) 2010, Queensland local government workforce census, LGAQ, viewed 16 October 2013, <http://www.lgaq.ans.au>. Local Government Association of South Australia (LGA SA) n.d., Careers in councils, LGA SA, viewed 4 February 2015, <http://www.lga.sa.gov.au/careersincouncil>.

47
5. REFERENCES
Local Government Managers Australia (LGMA) and Australian Centre of Excellence for Local Government (ACELG), University of Technology, Sydney 2013, Future-proofing local government: National workforce strategy 2013–2020, ACELG, Sydney. Municipal Association of Victoria (MAV) and Community Child Care (CCC) 2005, Local government supporting child care across Victoria, a discussion document, MAV, Melbourne. NSW Division of Local Government (NSW DLG) 2010, Census of local government employees, NSW DLG, Sydney, viewed 16 October 2013, <http://www.dlg.nsw.gov.au/dlg/dlghome/documents/Information>. NSW Electoral Commission 2012, Statistics, NSW Electoral Commission, viewed 4 February 2015, <http://www.pastvtr.elections.nsw.gov.au/LGE2012/lge-statistics.htm>.
Appendix AACLG Classifications

49
ACLG CLASSIFICATIONS
Appendix A ACLG Classifications
Step 1 Step 2 Step 3 Identifiers Category
URBAN (U) Capital City (CC) UCC
Population more than 20 000
Metropolitan Developed (D) Part of an urban centre of more than 1 000 000 or population density more than 600/sq km
Small (S) Medium (M) Large (L) Very Large (V)
up to 30 000 30 001-70 000 70 001-120 000 more than 120 000
UDS UDM UDL UDV
OR
Population density more than 30 persons per sq km
Regional Towns/City (R) Part of an urban centre with population less than 1 000 000 and predominantly urban in nature
Small (S) Medium (M) Large (L) Very Large (V)
up to 30 000 30 001-70 000 70 001-120 000 more than 120 000
URS URM URL URV
OR
90 per cent or more of LGA population is urban
Fringe (F) A developing LGA on the margin of a developed or regional urban centre
Small (S) Medium (M) Large (L) Very Large (V)
up to 30 000 30 001-70 000 70 001-120 000 more than 120 000
UFS UFM UFL UFV
RURAL (R)
An LGA with population less than 20 000
Significant Growth (SG) Average annual population growth more than 3 per cent, population more than 5 000 and not remote
Not applicable RSG
AND
Population density less than 30 persons per sq km
Agricultural (A) Small (S) Medium (M) Large (L) Very Large (V)
up to 2 000 2 001-5 000 5 001-10 000 10 001-20 000
RAS RAM RAL RAV
AND
Less than 90 per cent of LGA population is urban
Remote (T) Extra Small (X) Small (S) Medium (M) Large (L)
up to 400 401-1 000 1 001-3 000 3 001-20 000
RTX RTS RTM RTL

Appendix BOccupations by age

51
OCCUPATIONS BY AGE
Appendix B Occupations by age Table showing percentage of workers aged over 60 by occupation (greater than 10% flagged in red).
Please note: the response rates to the matrix of survey questions that provide data for this table are inconsistent and generally low. Of the 154 councils that completed the survey, between 5% and 77% of councils have provided data at each of the questions. On average, of the councils that completed the survey, only 38% (or 58 councils) have attempted these questions. This data should therefore be treated with caution.
Age 18 – 34
%
25 – 34
%
35- 49
%
50 – 59
%
60+
%
Accountant 1.79 30.75 41.19 21.19 5.07
Aged Care Coordinator/Officer 5.75 24.43 30.46 29.31 10.06
Airport Manager/Officer/Groundsman 0.00 0.00 39.29 39.29 21.43
Animal Control Officer 0.68 23.65 48.65 21.62 5.41
Architect/landscape architect 2.30 26.44 43.68 22.99 4.60
Asset Manager 0.00 8.67 42.00 38.00 11.33
Builder/Building Assistant 5.88 16.18 38.24 30.88 8.82
Building Inspector (including plumbing) 0.00 16.67 35.51 34.78 13.04
Building Surveyor 2.94 19.85 36.40 26.84 13.97
Buildings and property coordinator/officer 1.53 16.41 43.13 25.95 12.98
Caravan Park Operator 0.00 0.00 32.00 36.00 32.00
Carpenter 4.96 17.36 27.27 38.84 11.57
Cemetery Officer / Curator / Worker / Grave Digger 0.00 21.92 41.10 26.03 10.96
CEO 0.00 1.61 23.39 55.65 19.35
CEO /General manager 0.00 4.35 43.48 52.17 0.00
Childcare Coordinator/Team Leader 3.65 25.11 40.18 24.20 6.85
Childcare Director/ Manager 0.00 8.00 44.00 32.00 16.00
Childcare Worker 21.43 27.80 26.43 16.60 7.74

52
OCCUPATIONS BY AGE
Age 18 – 34
%
25 – 34
%
35- 49
%
50 – 59
%
60+
%
Cleaner 1.47 8.50 29.62 34.60 25.81
Communications Manager/coordinator 0.00 26.15 49.23 21.54 3.08
Communications/media officer 4.32 48.11 38.38 7.03 2.16
Communications/social media officer 9.38 40.63 40.63 6.25 3.13
Community Arts/Cultural Coordinator 4.92 23.77 41.80 24.59 4.92
Community Centre Coordinator/Officer 4.55 13.64 36.36 29.09 16.36
Community Development Coordinator/Officer 3.67 27.68 37.57 23.45 7.63
Community Engagement Manager/coordinator 1.89 16.98 56.60 20.75 3.77
Community Engagement officer 13.33 27.50 36.67 19.17 3.33
Community Housing Coordinator/Officer 15.79 26.32 52.63 0.00 5.26
Community safety Coordinator/Officer 3.49 11.63 38.37 23.26 23.26
Community Services Coordinator/Community Information Officer
4.17 16.67 40.28 33.33 5.56
Community Services Manager 0.00 4.05 47.30 36.49 12.16
Community Transport/Bus Driver 1.98 2.97 20.79 38.61 35.64
CWMS/Water/Sewerage team leader/worker 6.96 32.61 21.30 22.61 16.52
Community/immunisation/maternal and child health Nurse
0.14 6.90 30.03 41.09 21.84
Construction/Drainage Worker 4.44 16.38 34.13 31.40 13.65
Contracts Management officer 0.90 18.92 43.24 27.03 9.91
Corporate Services/governance admin officer 7.47 25.98 38.43 20.28 7.83
Corporate services/governance director 0.00 1.79 37.50 46.43 14.29
Corporate Services/governance manager 1.43 2.86 54.29 28.57 12.86
Cultural Awareness/Indigenous Support Officer 2.70 18.92 35.14 32.43 10.81
Customer Services Manager/Coordinator 1.65 14.05 42.15 34.71 7.44

53
OCCUPATIONS BY AGE
Age 18 – 34
%
25 – 34
%
35- 49
%
50 – 59
%
60+
%
Customer Services Officer/Cashier/Reception/Call Centre Officer
12.36 19.82 36.65 22.82 8.34
Draftsperson /Technical Officer 9.03 23.47 34.66 23.10 9.75
Driver/Carter 1.51 11.32 35.85 30.57 20.75
Economic/Business Development Manager/Officer 2.31 24.28 41.04 26.01 6.36
Electrician/other electrical trades 12.82 22.22 34.19 23.93 6.84
Emergency management manager/coordinator 0.00 12.90 41.94 29.03 16.13
Engineering/infrastructure admin officer 10.18 19.27 38.18 23.64 8.73
Engineering/infrastructure director 29.79 1.06 27.66 30.85 10.64
Environment/Sustainability manager/coordinator 1.20 20.48 54.22 16.87 7.23
Environment/sustainability officer 2.32 35.52 45.17 11.97 5.02
Environmental Health Manager 0.00 20.90 43.28 25.37 10.45
Environmental Health Officer* 8.89 38.81 33.15 11.59 7.55
Environmental Services Administration Officer 8.38 22.35 41.90 22.35 5.03
Environmental Services Director 4.76 0.00 33.33 61.90 0.00
Environmental Services Manager 0.00 8.00 44.00 44.00 4.00
Events coordinator/officer 13.46 35.10 33.65 13.94 3.85
Executive Assistant/Personal Assistant 4.29 18.37 38.57 28.37 10.41
Finance Director 0.00 0.00 47.06 41.18 11.76
Finance Manager 1.89 6.60 51.89 33.02 6.60
Finance Officer 7.51 19.27 37.57 24.86 10.79
Fire Prevention/Security Officer 1.52 18.18 39.39 27.27 13.64
Garbage Tip/Resource recovery worker 4.10 14.46 37.83 26.51 17.11
Gardener/groundsman/sporting fields curator 7.62 21.31 37.05 25.51 8.50

54
OCCUPATIONS BY AGE
Age 18 – 34
%
25 – 34
%
35- 49
%
50 – 59
%
60+
%
General hand/labourer 10.78 20.79 32.78 23.21 12.43
Golf Course Manager/staff 15.69 23.53 37.25 17.65 5.88
Governance manager/advisor/officer 1.55 24.81 36.43 27.91 9.30
HACC Home & Community Care Officer 2.46 10.21 28.52 34.04 24.77
HACC Home Handyman 4.08 6.12 16.33 36.73 36.73
HACC Manager/ coordinator 3.19 15.96 37.23 30.85 12.77
HACC Respite Worker 0.76 6.84 24.71 36.50 31.18
Handyman/ Lockmaster / Caretaker 0.00 0.00 31.25 39.58 29.17
Health Inspector 2.99 17.91 47.76 25.37 5.97
Horticulturist / Arborist 5.51 21.05 41.60 25.06 6.77
Human Resources / Payroll Officer 9.75 36.82 38.27 11.55 3.61
Human Resources Manager 0.00 8.79 49.45 31.87 9.89
Human Services coordinator/officer 6.54 18.69 31.78 30.84 12.15
Human Services Director / Manager 0.00 0.00 50.00 45.00 5.00
Human/community services admin 8.76 19.03 39.27 27.19 5.74
Human/community services director 0.00 0.00 26.32 63.16 10.53
Infrastructure /Works Director 0.00 0.00 39.58 47.92 12.50
IT / GIS Officer/Business analyst 5.86 26.88 44.44 18.77 4.05
IT Manager/coordinator 0.00 11.56 53.06 31.97 3.40
Kindergarten director/manager 3.45 17.24 34.48 34.48 10.34
Kindergarten teacher/assistant 5.90 21.64 42.95 20.00 9.51
Lawyer / Legal staff 5.13 25.64 43.59 17.95 7.69
Librarian 5.86 13.00 35.34 34.07 11.73
Library Manager 0.00 3.64 31.82 48.18 16.36
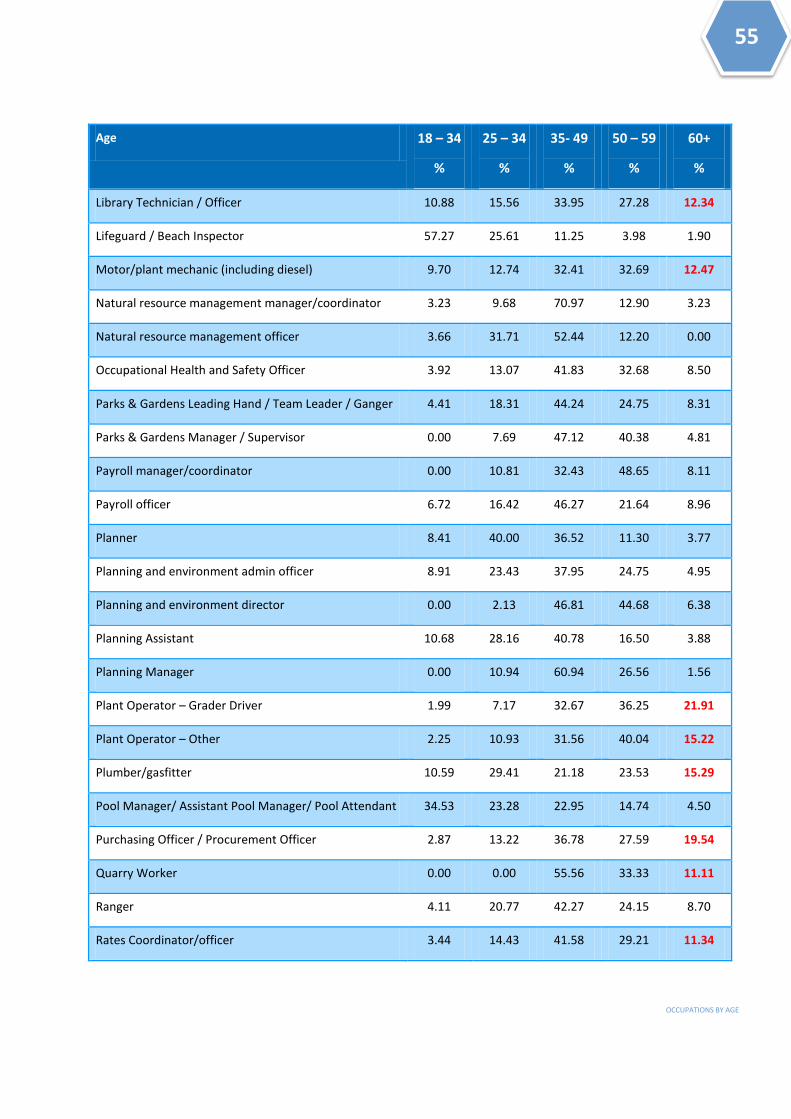
55
OCCUPATIONS BY AGE
Age 18 – 34
%
25 – 34
%
35- 49
%
50 – 59
%
60+
%
Library Technician / Officer 10.88 15.56 33.95 27.28 12.34
Lifeguard / Beach Inspector 57.27 25.61 11.25 3.98 1.90
Motor/plant mechanic (including diesel) 9.70 12.74 32.41 32.69 12.47
Natural resource management manager/coordinator 3.23 9.68 70.97 12.90 3.23
Natural resource management officer 3.66 31.71 52.44 12.20 0.00
Occupational Health and Safety Officer 3.92 13.07 41.83 32.68 8.50
Parks & Gardens Leading Hand / Team Leader / Ganger 4.41 18.31 44.24 24.75 8.31
Parks & Gardens Manager / Supervisor 0.00 7.69 47.12 40.38 4.81
Payroll manager/coordinator 0.00 10.81 32.43 48.65 8.11
Payroll officer 6.72 16.42 46.27 21.64 8.96
Planner 8.41 40.00 36.52 11.30 3.77
Planning and environment admin officer 8.91 23.43 37.95 24.75 4.95
Planning and environment director 0.00 2.13 46.81 44.68 6.38
Planning Assistant 10.68 28.16 40.78 16.50 3.88
Planning Manager 0.00 10.94 60.94 26.56 1.56
Plant Operator – Grader Driver 1.99 7.17 32.67 36.25 21.91
Plant Operator – Other 2.25 10.93 31.56 40.04 15.22
Plumber/gasfitter 10.59 29.41 21.18 23.53 15.29
Pool Manager/ Assistant Pool Manager/ Pool Attendant 34.53 23.28 22.95 14.74 4.50
Purchasing Officer / Procurement Officer 2.87 13.22 36.78 27.59 19.54
Quarry Worker 0.00 0.00 55.56 33.33 11.11
Ranger 4.11 20.77 42.27 24.15 8.70
Rates Coordinator/officer 3.44 14.43 41.58 29.21 11.34
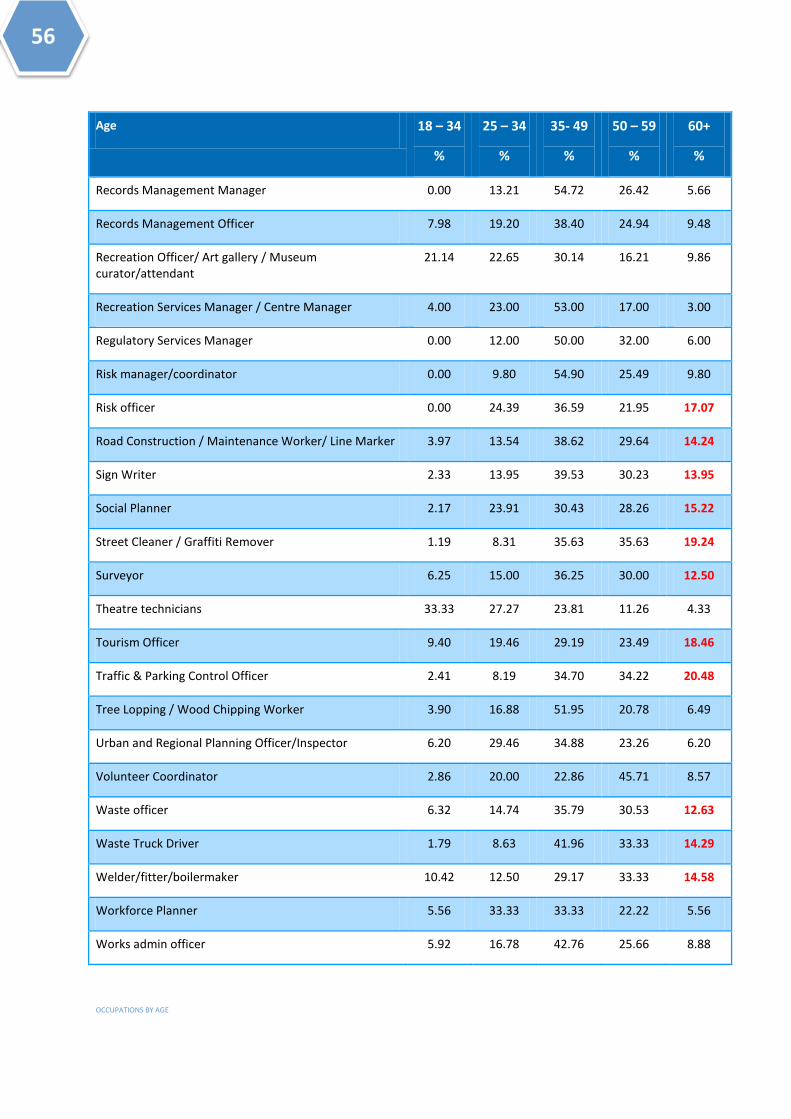
56
OCCUPATIONS BY AGE
Age 18 – 34
%
25 – 34
%
35- 49
%
50 – 59
%
60+
%
Records Management Manager 0.00 13.21 54.72 26.42 5.66
Records Management Officer 7.98 19.20 38.40 24.94 9.48
Recreation Officer/ Art gallery / Museum curator/attendant
21.14 22.65 30.14 16.21 9.86
Recreation Services Manager / Centre Manager 4.00 23.00 53.00 17.00 3.00
Regulatory Services Manager 0.00 12.00 50.00 32.00 6.00
Risk manager/coordinator 0.00 9.80 54.90 25.49 9.80
Risk officer 0.00 24.39 36.59 21.95 17.07
Road Construction / Maintenance Worker/ Line Marker 3.97 13.54 38.62 29.64 14.24
Sign Writer 2.33 13.95 39.53 30.23 13.95
Social Planner 2.17 23.91 30.43 28.26 15.22
Street Cleaner / Graffiti Remover 1.19 8.31 35.63 35.63 19.24
Surveyor 6.25 15.00 36.25 30.00 12.50
Theatre technicians 33.33 27.27 23.81 11.26 4.33
Tourism Officer 9.40 19.46 29.19 23.49 18.46
Traffic & Parking Control Officer 2.41 8.19 34.70 34.22 20.48
Tree Lopping / Wood Chipping Worker 3.90 16.88 51.95 20.78 6.49
Urban and Regional Planning Officer/Inspector 6.20 29.46 34.88 23.26 6.20
Volunteer Coordinator 2.86 20.00 22.86 45.71 8.57
Waste officer 6.32 14.74 35.79 30.53 12.63
Waste Truck Driver 1.79 8.63 41.96 33.33 14.29
Welder/fitter/boilermaker 10.42 12.50 29.17 33.33 14.58
Workforce Planner 5.56 33.33 33.33 22.22 5.56
Works admin officer 5.92 16.78 42.76 25.66 8.88

57
OCCUPATIONS BY AGE
Age 18 – 34
%
25 – 34
%
35- 49
%
50 – 59
%
60+
%
Works Leading Hand / Team Leader / Ganger 2.82 9.79 31.26 43.50 12.62
Works Supervisor 0.00 2.65 32.35 47.06 17.94
Works/Civil Engineer - roads, bridges, stormwater etc. 7.82 22.55 37.82 21.64 10.18
Works/Engineering Manager 1.12 5.59 43.02 37.99 12.29
Youth Coordinator / Officer / Worker 14.89 42.86 34.04 6.08 2.13

Appendix CEmployees in each occupationthat received training in 2011-12

59
EMPLOYEES IN EACH OCCUPATION THAT RECEIVED TRAINING IN 2011-12
Appendix C Employees in each occupation that received
training in 2011-12 Mandatory Training Discretionary Training
Male Female Total Male Female Total
Accountant 15 16 31 36 31 67
Aged Care Coordinator/Officer in at your council at present 4 10 14 6 15 21
Airport Manager/Officer/Groundsman 7 1 8 1 0 1
Animal Control Officer 4 6 10 7 6 13
Architect/landscape architect 5 4 9 7 6 13
Asset Manager 15 2 17 22 3 25
Builder/Building Assistant 1 1 2 2 0 2
Building Inspector (including plumbing 12 0 12 15 0 15
Building Surveyor 29 2 31 56 3 59
Buildings and property coordinator/officer 15 11 26 27 20 47
Caravan Park Operator 4 0 4 4 0 4
Carpenter 13 1 14 9 0 9
Cemetery Officer / Curator / Worker / Grave Digger 12 3 15 7 3 10
CEO 9 1 10 14 1 15
CEO/ General manager (Deputy) 1 1 2 5 1 6
Childcare Coordinator/Team Leader 0 24 24 0 44 44
Childcare Director/ Manager 0 12 12 0 9 9
Childcare Worker 6 115 121 7 149 156
Cleaner 9 28 37 12 9 21
Communications Manager/coordinator 0 4 4 1 13 14
Communications/media officer 4 9 13 6 23 29
Communications/social media officer 1 1 2 0 2 2
Community Arts/Cultural Coordinator 2 1 3 4 3 7

60
EMPLOYEES IN EACH OCCUPATION THAT RECEIVED TRAINING IN 2011-12
Community Centre Coordinator/Officer 1 8 9 1 16 17
Community Development Coordinator/Officer 2 13 15 8 33 41
Community Engagement Manager/coordinator 1 1 2 1 3 4
Community Engagement officer 4 6 10 4 12 16
Community Housing Coordinator/Officer 0 0 0 1 0 1
Community safety Coordinator/Officer 0 1 1 2 2 4
Community Services Coordinator/Community Information Officer
3 7 10 2 9 11
Community Services Manager 3 10 13 5 8 13
Community Transport/Bus Driver 6 1 7 11 1 12
CWMS/Water/Sewerage team leader/worker 19 0 19 4 0 4
Community/immunisation/maternal and child health Nurse 0 94 94 0 101 101
Construction/Drainage Worker 25 0 25 29 0 29
Contracts Management officer 4 3 7 7 9 16
Corporate Services/governance admin officer 10 28 38 4 39 43
Corporate services/governance director 7 1 8 10 1 11
Corporate Services/governance manager 5 3 8 1 3 4
Cultural Awareness/Indigenous Support Officer 1 4 5 1 7 8
Customer Services Manager/Coordinator 3 21 24 7 26 33
Customer Services Officer/Cashier/Reception/Call Centre Officer
18 139 157 12 171 183
Draftsperson /Technical Officer 37 8 45 50 10 60
Driver/Carter 7 2 9 2 0 2
Economic/Business Development Manager/Officer 6 15 21 12 14 26
Electrician/other electrical trades 8 0 8 4 0 4
Emergency management manager/coordinator 6 4 10 4 6 10
Engineering/infrastructure admin officer 20 23 43 25 24 49
Engineering/infrastructure director 6 0 6 13 0 13

61
EMPLOYEES IN EACH OCCUPATION THAT RECEIVED TRAINING IN 2011-12
Environment/Sustainability manager/coordinator 6 8 14 7 8 15
Environment/sustainability officer 9 23 32 20 35 55
Environmental Health Manager 6 2 8 11 3 14
Environmental Health Officer* 18 14 32 20 24 44
Environmental Services Administration Officer 0 3 3 0 9 9
Environmental Services Director 0 1 1 1 0 1
Environmental Services Manager 4 0 4 2 0 2
Events coordinator/officer 2 12 14 2 18 20
Executive Assistant/Personal Assistant 2 38 40 2 66 68
Finance Director 2 0 2 4 0 4
Finance Manager 11 2 13 14 6 20
Finance Officer 6 32 38 12 51 63
Fire Prevention/Security Officer 3 0 3 4 1 5
Garbage Tip/Resource recovery worker 55 5 60 23 4 27
Gardener/groundsman/sporting fields curator 146 19 165 132 11 143
General hand/labourer 112 2 114 47 7 54
Golf Course Manager/staff 24 4 28 15 1 16
Governance manager/advisor/officer 5 8 13 9 15 24
HACC Home & Community Care Officer 21 89 110 21 145 166
HACC Home Handyman 3 0 3 7 0 7
HACC Manager/ coordinator 1 9 10 3 22 25
HACC Respite Worker 0 32 32 0 35 35
Handyman/ Lockmaster / Caretaker 8 0 8 12 0 12
Health Inspector 7 15 22 10 4 14
Horticulturist / Arborist 48 12 60 76 18 94
Human Resources / Payroll Officer 3 37 40 8 39 47
Human Resources Manager 3 4 7 8 15 23

62
EMPLOYEES IN EACH OCCUPATION THAT RECEIVED TRAINING IN 2011-12
Human Services coordinator/officer 2 11 13 3 12 15
Human Services Director / Manager 0 2 2 0 7 7
Human/community services admin 0 51 51 2 42 44
Human/community services director 0 3 3 1 7 8
Infrastructure /Works Director 3 0 3 6 1 7
IT / GIS Officer/Business analyst 41 20 61 53 27 80
IT Manager/coordinator 8 3 11 21 6 27
Kindergarten director/manager 0 2 2 0 3 3
Kindergarten teacher/assistant 0 20 20 0 21 21
Lawyer / Legal staff 1 2 3 3 3 6
Librarian 12 44 56 4 54 58
Library Manager 1 7 8 3 20 23
Library Technician / Officer 20 65 85 24 111 135
Lifeguard / Beach Inspector 56 21 77 45 39 84
Motor/plant mechanic (including diesel) 39 1 40 37 0 37
Natural resource management manager/coordinator 5 2 7 6 1 7
Natural resource management officer 11 5 16 11 3 14
Occupational Health and Safety Officer 11 31 42 14 13 27
Parks & Gardens Leading Hand / Team Leader / Ganger 101 17 118 63 8 71
Parks & Gardens Manager / Supervisor 28 0 28 25 3 28
Payroll manager/coordinator 1 2 3 5 6 11
Payroll officer 4 10 14 3 13 16
Planner 41 35 76 55 57 112
Planning and environment admin officer 1 42 43 2 32 34
Planning and environment director 7 0 7 8 1 9
Planning Assistant 1 1 2 3 8 11
Planning Manager 12 2 14 13 8 21

63
EMPLOYEES IN EACH OCCUPATION THAT RECEIVED TRAINING IN 2011-12
Plant Operator – Grader Driver 45 6 51 15 1 16
Plant Operator – Other 178 22 200 74 1 75
Plumber/gasfitter 13 0 13 5 0 5
Pool Manager/ Assistant Pool Manager/ Pool Attendant 80 105 185 46 55 101
Purchasing Officer / Procurement Officer 9 5 14 9 11 20
Quarry Worker 0 0 0 0 0 0
Ranger 50 16 66 56 14 70
Rates Coordinator/officer 9 18 27 5 27 32
Records Management Manager 2 3 5 4 12 16
Records Management Officer 2 33 35 6 45 51
Recreation Officer/ Art gallery / Museum curator/attendant 50 99 149 45 73 118
Recreation Services Manager / Centre Manager 9 11 20 11 14 25
Regulatory Services Manager 1 1 2 6 1 7
Risk manager/coordinator 2 4 6 5 4 9
Risk officer 2 4 6 4 4 8
Road Construction / Maintenance Worker/ Line Marker 116 0 116 95 0 95
Sign Writer 2 0 2 0 0 0
Social Planner 2 8 10 4 8 12
Street Cleaner / Graffiti Remover 51 1 52 28 0 28
Surveyor 10 0 10 7 2 9
Theatre technicians 16 11 27 6 1 7
Tourism Officer 4 38 42 2 18 20
Traffic & Parking Control Officer 40 18 58 36 35 71
Tree Lopping / Wood Chipping Worker 37 1 38 6 0 6
Urban and Regional Planning Officer/Inspector 15 7 22 19 20 39
Volunteer Coordinator 1 4 5 0 6 6
Waste officer 10 6 16 10 8 18

64
EMPLOYEES IN EACH OCCUPATION THAT RECEIVED TRAINING IN 2011-12
Waste Truck Driver 26 0 26 24 0 24
Welder/fitter/boilermaker 8 0 8 1 0 1
Workforce Planner 0 1 1 0 1 1
Works admin officer 12 19 31 21 22 43
Works Leading Hand / Team Leader / Ganger 83 2 85 56 2 58
Works Supervisor 67 2 69 51 1 52
Works/Civil Engineer - roads, bridges, stormwater etc. 83 9 92 37 7 44
Works/Engineering Manager 17 1 18 25 2 27
Youth Coordinator / Officer / Worker 10 25 35 14 31 45

Appendix DQuestionnaire

66
QUESTIONNAIRE
Appendix D Questionnaire
1a. Q Does your council currently have an elected council?
Yes No - we are under administration
If under administration you will skip the following 3 questions
1b. This question is designed to measure the age and gender of elected representatives across
the country.
Q Please complete the table for all of your elected representatives, including Mayors - by gender and age.
For example if you had 2 male councillors aged 65+ put a two in the box under Male next to 65+. Where you have no councillors in that category put a 0 in the box. Remember you must have a response in every box. You may not know the ages of your councillors – try asking the governance officer or CEO’s office for more information
Male Female
Up to 24
25 - 44
45 - 64
65+
Don't know age
1c. This question is designed to measure the gender of Mayors across the country.
Q Is your Mayor male or female?
Please indicate whether your mayor is male or female by selecting the appropriate option in the drop down box
Male Female
Gender
1d. This question is designed to measure the election method of Mayors across the country.
Q Is your Mayor popularly elected?
Please indicate whether your mayor is popularly elected by selecting the appropriate option in the drop down box.
Popularly elected Other
Method of election

67
QUESTIONNAIRE
2a. This question is designed to measure the total number of local government employees
across the country, and will also be used as the basis for your own analysis of your
workforce data.
Q What was the total number of staff (headcount) on your council's payroll at 30th June 2012?
Please include full time, part time and casual staff as well as those on leave including long service and maternity leave. All staff active on the payroll should be included, including seasonal workers (i.e. pool attendants etc.) and staff on contracts. Please do not include contractors, agency staff or group apprentices. Total staff ____________________
2b. This question is designed to measure the total number of local government employees
across the country by gender, and will also be used as the basis for your own analysis of your
workforce data.
Q And of (number at 2a) how many in total were male and how many were female?(headcount)
Please include full time, part time and casual staff as well as those on leave including long service and maternity leave. All staff active on the payroll should be included, including seasonal workers (i.e. pool attendants etc.) and staff on contracts. Please do not include contractors, agency staff or group apprentices. Male ____________________ Female __________________
3. This question is designed to measure the level of education across the LG workforce, and
data will be used to support the local government sectors applications for funds to meet the
Council of Australian Governments (COAG) agreement to increase VET and University
qualification levels in Local Government.
Q For each qualification level listed, please provide the number of your workforce who have achieved that education level, by gender.
Where you do not know the level of education for employees please include them in the "Not Known" category - making sure that your total equals (number at 2a) employees.
Male Female
Postgraduate qualification (UNI)
Bachelor Degree (UNI)
Advanced Certificate/Diploma (UNI)
Diploma/Advanced diploma (VET)
Certificate 3 or 4 (VET)
Certificate 1 or 2 (VET)
High School only
Not known

68
QUESTIONNAIRE
The following questions are occupation based and require that you have information on council staff by occupation on hand. There is a separate excel spreadsheet designed to help you to align your
position titles to the occupation list. Note that not all occupations are listed and you may not be able
to fit all staff in the list – that is OK.
4. This question and will help to identify occupations across the sector and help to identify
training and employment needs.
Q Which of the following occupations do you have at your council?
Please select each occupation you have one or more employees in at your council at present. Include temporarily vacant positions. Refer to your excel tool for more details about the occupations.
Stream Position
a 1 Accountant
c 2 Aged Care Coordinator/Officer
b 3 Airport Manager/Officer/Groundsman
d 4 Animal Control Officer
b 5 Architect/landscape architect
b 6 Asset Manager
d 7 Builder/Building Assistant
d 8 Building Inspector (including plumbing)
d 9 Building Surveyor
d 10 Buildings and property coordinator/officer
b 11 Caravan Park Operator
b 12 Carpenter
b 13 Cemetery Officer / Curator / Worker / Grave Digger
a 14 Chief Executive Officer (CEO)/General manager
a 15 Chief Executive Officer (CEO)/General manager (Deputy)
c 16 Childcare Coordinator/Team Leader
c 17 Childcare Director/ Manager
c 18 Childcare Worker
b 19 Cleaner
a 20 Communications Manager/coordinator
a 21 Communications/media officer

69
QUESTIONNAIRE
Stream Position
a 22 Communications/social media officer
c 23 Community Arts/Cultural Coordinator
c 24 Community Centre Coordinator/Officer
c 25 Community Development Coordinator/Officer
c 26 Community Engagement Manager/coordinator
c 27 Community Engagement officer
c 28 Community Housing Coordinator/Officer
c 29 Community safety/Crime Prevention Coordinator/Officer
c 30 Community Services Coordinator/Community Information Officer
c 31 Community Services Manager
c 32 Community Transport/Bus Driver
b 33 Community Wastewater Management System (CWMS)/Water/Sewerage team
leader/worker
d 34 Community/immunisation/maternal and child health Nurse
b 35 Construction/Drainage Worker
a 36 Contracts Management officer
a 37 Corporate Services/governance admin officer
a 38 Corporate services/governance director
a 39 Corporate Services/governance manager
c 40 Cultural Awareness / Indigenous Support Officer
a 41 Customer Services Manager/Coordinator
a 42 Customer Services Officer/Cashier/Reception/Call Centre Officer
b 43 Draftsperson /Technical Officer
b 44 Driver/Carter
c 45 Economic/Business Development Manager / Officer
b 46 Electrician/ other electrical trades
d 47 Emergency management manager/coordinator
d 48 Engineering/infrastructure admin officer

70
QUESTIONNAIRE
Stream Position
d 49 Engineering/infrastructure director
d 50 Environment/Sustainability manager/coordinator
d 51 Environment/sustainability officer
d 52 Environmental Health Manager
d 53 Environmental Health Officer
d 54 Environmental Services Administration Officer
d 55 Environmental Services Director
d 56 Environmental Services Manager
a 57 Events coordinator/officer
a 58 Executive Assistant / Personal Assistant
a 59 Finance Director
a 60 Finance Manager
a 61 Finance Officer
d 62 Fire Prevention/Security Officer
b 63 Garbage Tip/Resource recovery worker
b 64 Gardener/groundsman/sporting fields curator
b 65 General hand/labourer
b 66 Golf Course Manager/staff
a 67 Governance manager/advisor/officer
c 68 HACC Home & Community Care Officer
c 69 HACC Home Handyman
c 70 HACC Manager/ coordinator
c 71 HACC Respite Worker
b 72 Handyman/ Lockmaster / Caretaker
d 73 Health Inspector
b 74 Horticulturist / Arborist
c 75 Human Resources / Payroll Officer
c 76 Human Resources Manager

71
QUESTIONNAIRE
Stream Position
c 77 Human Services coordinator/officer
c 78 Human Services Director / Manager
c 79 Human/community services admin
c 80 Human/community services director
b 81 Infrastructure /Works Director
a 82 IT / GIS Officer/Business analyst
a 83 IT Manager/coordinator
c 84 Kindergarten director/manager
c 85 Kindergarten teacher/assistant
a 86 Lawyer / Legal staff
c 87 Librarian
c 88 Library Manager
c 89 Library Technician / Officer
c 90 Lifeguard / Beach Inspector
b 91 Motor/plant mechanic (including diesel)
d 92 Natural resource management manager/coordinator
d 93 Natural resource management officer
a 94 Occupational Health and Safety Officer
b 95 Parks & Gardens Leading Hand / Team Leader / Ganger
b
96 Parks & Gardens Manager / Supervisor
a 97 Payroll manager/coordinator
a 98 Payroll officer
d 99 Planner
a 100 Planning and environment admin officer
d 101 Planning and environment director
d 102 Planning Assistant
d 103 Planning Manager

72
QUESTIONNAIRE
Stream Position
b 104 Plant Operator – Grader Driver
b 105 Plant Operator – Other
b 106 Plumber/gasfitter
c 107 Pool Manager/ Assistant Pool Manager/ Pool Attendant
a 108 Purchasing Officer / Procurement Officer
b 109 Quarry Worker
d 110 Ranger
a 111 Rates Coordinator/officer
a 112 Records Management Manager
a 113 Records Management Officer
c 114 Recreation Officer/ Art gallery / Museum curator/attendant
c 115 Recreation Services Manager / Centre Manager
d 116 Regulatory Services Manager
a 117 Risk manager/coordinator
a 118 Risk officer
b 119 Road Construction / Maintenance Worker/ Line Marker
b 120 Sign Writer
c 121 Social Planner
b 122 Street Cleaner / Graffiti Remover
b 123 Surveyor
b 124 Theatre technicians
c 125 Tourism Officer
d 126 Traffic & Parking Control Officer
b 127 Tree Lopping / Wood Chipping Worker
d 128 Urban and Regional Planning Officer/Inspector
c 129 Volunteer Coordinator
c 130 Waste officer
b 131 Waste Truck Driver
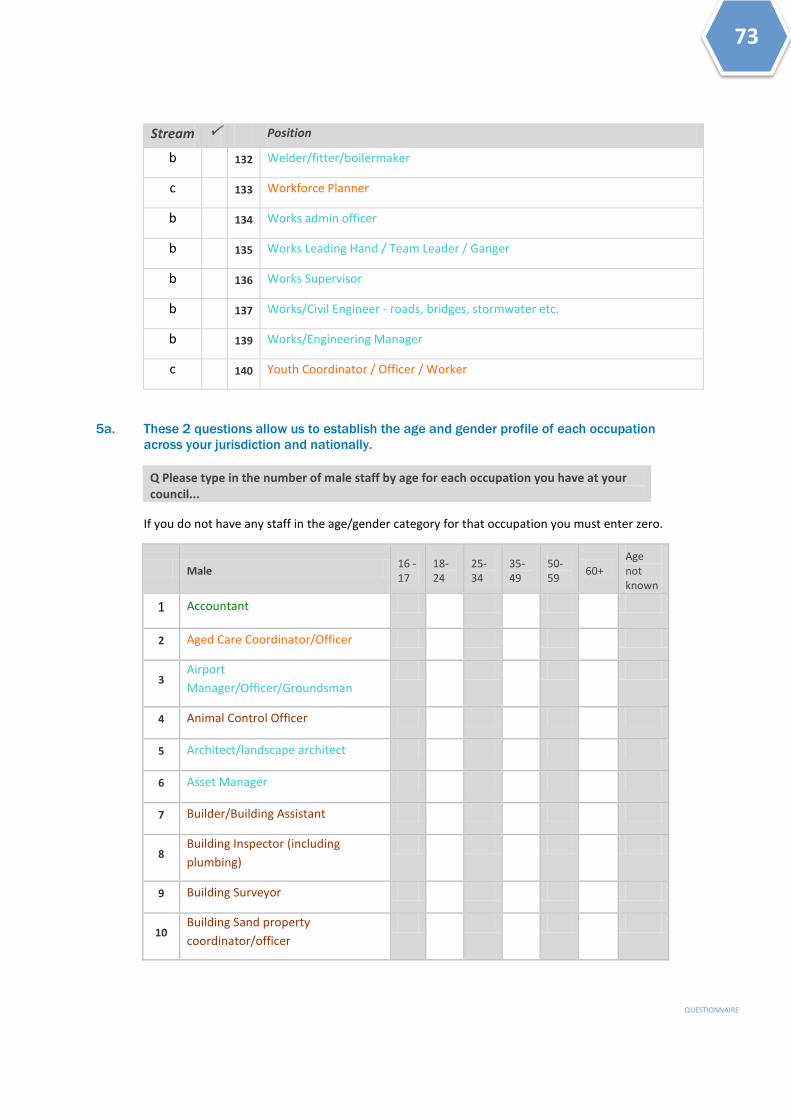
73
QUESTIONNAIRE
Stream Position
b 132 Welder/fitter/boilermaker
c 133 Workforce Planner
b 134 Works admin officer
b 135 Works Leading Hand / Team Leader / Ganger
b 136 Works Supervisor
b 137 Works/Civil Engineer - roads, bridges, stormwater etc.
b 139 Works/Engineering Manager
c 140 Youth Coordinator / Officer / Worker
5a. These 2 questions allow us to establish the age and gender profile of each occupation
across your jurisdiction and nationally.
Q Please type in the number of male staff by age for each occupation you have at your council...
If you do not have any staff in the age/gender category for that occupation you must enter zero.
Male 16 - 17
18-24
25-34
35-49
50-59
60+ Age not known
1 Accountant
2 Aged Care Coordinator/Officer
3 Airport
Manager/Officer/Groundsman
4 Animal Control Officer
5 Architect/landscape architect
6 Asset Manager
7 Builder/Building Assistant
8 Building Inspector (including
plumbing)
9 Building Surveyor
10 Building Sand property
coordinator/officer

74
QUESTIONNAIRE
Male 16 - 17
18-24
25-34
35-49
50-59
60+ Age not known
11 Caravan Park Operator
12 Carpenter
13 Cemetery Officer / Curator /
Worker / Grave Digger
14 Chief Executive Officer
(CEO)/General manager
15 Chief Executive Officer
(CEO)/General manager (Deputy)
16 Childcare Coordinator/Team Leader
17 Childcare Director/ Manager
18 Childcare Worker
19 Cleaner
20 Communications
Manager/coordinator
21 Communications/media officer
22 Communications/social media
officer
23 Community Arts/Cultural
Coordinator
24 Community Centre
Coordinator/Officer
25 Community Development
Coordinator/Officer
26 Community Engagement
Manager/coordinator
27 Community Engagement officer
28 Community Housing
Coordinator/Officer
29 Community safety/Crime
Prevention Coordinator/Officer
30 Community Services
Coordinator/Community

75
QUESTIONNAIRE
Male 16 - 17
18-24
25-34
35-49
50-59
60+ Age not known
Information Officer
31 Community Services Manager
32 Community Transport/Bus Driver
33
Community Wastewater
Management System
(CWMS)/Water/Sewerage team
leader/worker
34 Community/immunisation/maternal
and child health Nurse
35 Construction/Drainage Worker
36 Contracts Management officer
37 Corporate Services/governance
admin officer
38 Corporate services/governance
director
39 Corporate Services/governance
manager
40 Cultural Awareness / Indigenous
Support Officer
41 Customer Services
Manager/Coordinator
42
Customer Services
Officer/Cashier/Reception/Call
Centre Officer
43 Draftsperson /Technical Officer
44 Driver/Carter
45 Economic/Business Development
Manager / Officer
46 Electrician/ other electrical trades
47 Emergency management
manager/coordinator
48 Engineering/infrastructure admin

76
QUESTIONNAIRE
Male 16 - 17
18-24
25-34
35-49
50-59
60+ Age not known
officer
49 Engineering/infrastructure director
50 Environment/Sustainability
manager/coordinator
51 Environment/sustainability officer
52 Environmental Health Manager
53 Environmental Health Officer
54 Environmental Services
Administration Officer
55 Environmental Services Director
56 Environmental Services Manager
57 Events coordinator/officer
58 Executive Assistant / Personal
Assistant
59 Finance Director
60 Finance Manager
61 Finance Officer
62 Fire Prevention/Security Officer
63 Garbage Tip/Resource recovery
worker
64 Gardener/groundsman/sporting
fields curator
65 General hand/labourer
66 Golf Course Manager/staff
67 Governance
manager/advisor/officer
68 HACC Home & Community Care
Officer
69 HACC Home Handyman

77
QUESTIONNAIRE
Male 16 - 17
18-24
25-34
35-49
50-59
60+ Age not known
70 HACC Manager/ coordinator
71 HACC Respite Worker
72 Handyman/ Lockmaster / Caretaker
73 Health Inspector
74 Horticulturist / Arborist
75 Human Resources / Payroll Officer
76 Human Resources Manager
77 Human Services coordinator/officer
78 Human Services Director / Manager
79 Human/community services admin
80 Human/community services
director
81 Infrastructure /Works Director
82 IT / GIS Officer/Business analyst
83 IT Manager/coordinator
84 Kindergarten director/manager
85 Kindergarten teacher/assistant
86 Lawyer / Legal staff
87 Librarian
88 Library Manager
89 Library Technician / Officer
90 Lifeguard / Beach Inspector
91 Motor/plant mechanic (including
diesel)
92 Natural resource management
manager/coordinator
93 Natural resource management

78
QUESTIONNAIRE
Male 16 - 17
18-24
25-34
35-49
50-59
60+ Age not known
officer
94 Occupational Health and Safety
Officer
95 Parks & Gardens Leading Hand /
Team Leader / Ganger
96 Parks & Gardens Manager /
Supervisor
97 Payroll manager/coordinator
98 Payroll officer
99 Planner
100 Planning and environment admin
officer
101 Planning and environment director
102 Planning Assistant
103 Planning Manager
104 Plant Operator – Grader Driver
105 Plant Operator – Other
106 Plumber/gasfitter
107 Pool Manager/ Assistant Pool
Manager/ Pool Attendant
108 Purchasing Officer / Procurement
Officer
109 Quarry Worker
110 Ranger
111 Rates Coordinator/officer
112 Records Management Manager
113 Records Management Officer
114 Recreation Officer/ Art gallery /
Museum curator/attendant

79
QUESTIONNAIRE
Male 16 - 17
18-24
25-34
35-49
50-59
60+ Age not known
115 Recreation Services Manager /
Centre Manager
116 Regulatory Services Manager
117 Risk manager/coordinator
118 Risk officer
119 Road Construction / Maintenance
Worker/ Line Marker
120 Sign Writer
121 Social Planner
122 Street Cleaner / Graffiti Remover
123 Surveyor
124 Theatre technicians
125 Tourism Officer
126 Traffic & Parking Control Officer
127 Tree Lopping / Wood Chipping
Worker
128 Urban and Regional Planning
Officer/Inspector
129 Volunteer Coordinator
130 Waste officer
131 Waste Truck Driver
132 Welder/fitter/boilermaker
133 Workforce Planner
134 Works admin officer
135 Works Leading Hand / Team Leader
/ Ganger
136 Works Supervisor
137 Works/Civil Engineer - roads,

80
QUESTIONNAIRE
Male 16 - 17
18-24
25-34
35-49
50-59
60+ Age not known
bridges, stormwater etc.
139 Works/Engineering Manager
140 Youth Coordinator / Officer /
Worker
5b. These 2 questions allow us to establish the age and gender profile of each occupation
across your jurisdiction and nationally.
Q Please type in the number of female staff by age for each occupation you have at your council...
If you do not have any staff in the age/gender category for that occupation you must enter zero.
Female 16 - 17
18-24
25-34
35-49
50-59
60+ Age not known
1 Accountant
2 Aged Care Coordinator/Officer
3 Airport
Manager/Officer/Groundsman
4 Animal Control Officer
5 Architect/landscape architect
6 Asset Manager
7 Builder/Building Assistant
8 Building Inspector (including
plumbing)
9 Building Surveyor
10 Building Sand property
coordinator/officer
11 Caravan Park Operator
12 Carpenter
13 Cemetery Officer / Curator /
Worker / Grave Digger

81
QUESTIONNAIRE
Female 16 - 17
18-24
25-34
35-49
50-59
60+ Age not known
14 Chief Executive Officer
(CEO)/General manager
15 Chief Executive Officer
(CEO)/General manager (Deputy)
16 Childcare Coordinator/Team Leader
17 Childcare Director/ Manager
18 Childcare Worker
19 Cleaner
20 Communications
Manager/coordinator
Position
21 Communications/media officer
22 Communications/social media
officer
23 Community Arts/Cultural
Coordinator
24 Community Centre
Coordinator/Officer
25 Community Development
Coordinator/Officer
26 Community Engagement
Manager/coordinator
27 Community Engagement officer
28 Community Housing
Coordinator/Officer
29 Community safety/Crime
Prevention Coordinator/Officer
30
Community Services
Coordinator/Community
Information Officer
31 Community Services Manager
82
QUESTIONNAIRE
Female 16 - 17
18-24
25-34
35-49
50-59
60+ Age not known
32 Community Transport/Bus Driver
33
Community Wastewater
Management System
(CWMS)/Water/Sewerage team
leader/worker
34 Community/immunisation/maternal
and child health Nurse
35 Construction/Drainage Worker
36 Contracts Management officer
37 Corporate Services/governance
admin officer
38 Corporate services/governance
director
39 Corporate Services/governance
manager
40 Cultural Awareness / Indigenous
Support Officer
41 Customer Services
Manager/Coordinator
42
Customer Services
Officer/Cashier/Reception/Call
Centre Officer
43 Draftsperson /Technical Officer
44 Driver/Carter
45 Economic/Business Development
Manager / Officer
46 Electrician/ other electrical trades
47 Emergency management
manager/coordinator
48 Engineering/infrastructure admin
officer
49 Engineering/infrastructure director
50 Environment/Sustainability

83
QUESTIONNAIRE
Female 16 - 17
18-24
25-34
35-49
50-59
60+ Age not known
manager/coordinator
51 Environment/sustainability officer
52 Environmental Health Manager
53 Environmental Health Officer
54 Environmental Services
Administration Officer
55 Environmental Services Director
56 Environmental Services Manager
57 Events coordinator/officer
58 Executive Assistant / Personal
Assistant
59 Finance Director
60 Finance Manager
61 Finance Officer
62 Fire Prevention/Security Officer
63 Garbage Tip/Resource recovery
worker
64 Gardener/groundsman/sporting
fields curator
65 General hand/labourer
66 Golf Course Manager/staff
67 Governance
manager/advisor/officer
68 HACC Home & Community Care
Officer
69 HACC Home Handyman
70 HACC Manager/ coordinator
71 HACC Respite Worker

84
QUESTIONNAIRE
Female 16 - 17
18-24
25-34
35-49
50-59
60+ Age not known
72 Handyman/ Lockmaster / Caretaker
73 Health Inspector
74 Horticulturist / Arborist
75 Human Resources / Payroll Officer
76 Human Resources Manager
77 Human Services coordinator/officer
7 Human Services Director / Manager
79 Human/community services admin
80 Human/community services
director
81 Infrastructure /Works Director
82 IT / GIS Officer/Business analyst
83 IT Manager/coordinator
84 Kindergarten director/manager
85 Kindergarten teacher/assistant
86 Lawyer / Legal staff
87 Librarian
88 Library Manager
89 Library Technician / Officer
90 Lifeguard / Beach Inspector
91 Motor/plant mechanic (including
diesel)
92 Natural resource management
manager/coordinator
93 Natural resource management
officer
94 Occupational Health and Safety
Officer

85
QUESTIONNAIRE
Female 16 - 17
18-24
25-34
35-49
50-59
60+ Age not known
95 Parks & Gardens Leading Hand /
Team Leader / Ganger
96 Parks & Gardens Manager /
Supervisor
97 Payroll manager/coordinator
98 Payroll officer
99 Planner
100 Planning and environment admin
officer
101 Planning and environment director
102 Planning Assistant
103 Planning Manager
104 Plant Operator – Grader Driver
105 Plant Operator – Other
106 Plumber/gasfitter
107 Pool Manager/ Assistant Pool
Manager/ Pool Attendant
108 Purchasing Officer / Procurement
Officer
109 Quarry Worker
110 Ranger
111 Rates Coordinator/officer
112 Records Management Manager
113 Records Management Officer
114 Recreation Officer/ Art gallery /
Museum curator/attendant
115 Recreation Services Manager /
Centre Manager
116 Regulatory Services Manager

86
QUESTIONNAIRE
Female 16 - 17
18-24
25-34
35-49
50-59
60+ Age not known
117 Risk manager/coordinator
118 Risk officer
119 Road Construction / Maintenance
Worker/ Line Marker
120 Sign Writer
121 Social Planner
122 Street Cleaner / Graffiti Remover
123 Surveyor
124 Theatre technicians
125 Tourism Officer
126 Traffic & Parking Control Officer
127 Tree Lopping / Wood Chipping
Worker
128 Urban and Regional Planning
Officer/Inspector
129 Volunteer Coordinator
130 Waste officer
131 Waste Truck Driver
132 Welder/fitter/boilermaker
133 Workforce Planner
134 Works admin officer
135 Works Leading Hand / Team Leader
/ Ganger
136 Works Supervisor
137 Works/Civil Engineer - roads,
bridges, stormwater etc.
139 Works/Engineering Manager
140 Youth Coordinator / Officer /
Worker

87
QUESTIONNAIRE
6a/6b The following two questions will measure staff turnover by age and gender.
TIP: This question refers to staff who have joined or left council, and does not refer to internal
promotions, secondments or transfers.
Q How many people commenced work in those occupations in the last 12 months?
For each occupation listed please report the number of new starters in the past 12 months. Put zero in boxes where you have no new starters.
Male new starters Female new starters
Under 21
21-34
35-49
50+ Under 21
21-34
35-49
50+
1 Accountant
2 Aged Care Coordinator/Officer
3 Airport
Manager/Officer/Groundsman
4 Animal Control Officer
5 Architect/landscape architect
6 Asset Manager
7 Builder/Building Assistant
8 Building Inspector (including
plumbing)
9 Building Surveyor
10 Building Sand property
coordinator/officer
11 Caravan Park Operator
12 Carpenter
13 Cemetery Officer / Curator /
Worker / Grave Digger
14 Chief Executive Officer
(CEO)/General manager
15 Chief Executive Officer
(CEO)/General manager (Deputy)
16 Childcare Coordinator/Team Leader

88
QUESTIONNAIRE
Male new starters Female new starters
Under 21
21-34
35-49
50+ Under 21
21-34
35-49
50+
17 Childcare Director/ Manager
18 Childcare Worker
19 Cleaner
20 Communications
Manager/coordinator
21 Communications/media officer
22 Communications/social media
officer
23 Community Arts/Cultural
Coordinator
24 Community Centre
Coordinator/Officer
25 Community Development
Coordinator/Officer
26 Community Engagement
Manager/coordinator
27 Community Engagement officer
28 Community Housing
Coordinator/Officer
29 Community safety/Crime
Prevention Coordinator/Officer
30
Community Services
Coordinator/Community
Information Officer
31 Community Services Manager
32 Community Transport/Bus Driver
33
Community Wastewater
Management System
(CWMS)/Water/Sewerage team
leader/worker
34 Community/immunisation/maternal
and child health Nurse

89
QUESTIONNAIRE
Male new starters Female new starters
Under 21
21-34
35-49
50+ Under 21
21-34
35-49
50+
35 Construction/Drainage Worker
36 Contracts Management officer
37 Corporate Services/governance
admin officer
38 Corporate services/governance
director
39 Corporate Services/governance
manager
40 Cultural Awareness / Indigenous
Support Officer
41 Customer Services
Manager/Coordinator
42
Customer Services
Officer/Cashier/Reception/Call
Centre Officer
43 Draftsperson /Technical Officer
44 Driver/Carter
45 Economic/Business Development
Manager / Officer
46 Electrician/ other electrical trades
47 Emergency management
manager/coordinator
48 Engineering/infrastructure admin
officer
49 Engineering/infrastructure director
50 Environment/Sustainability
manager/coordinator
51 Environment/sustainability officer
52 Environmental Health Manager
53 Environmental Health Officer

90
QUESTIONNAIRE
Male new starters Female new starters
Under 21
21-34
35-49
50+ Under 21
21-34
35-49
50+
54 Environmental Services
Administration Officer
55 Environmental Services Director
56 Environmental Services Manager
57 Events coordinator/officer
58 Executive Assistant / Personal
Assistant
59 Finance Director
60 Finance Manager
61 Finance Officer
62 Fire Prevention/Security Officer
63 Garbage Tip/Resource recovery
worker
64 Gardener/groundsman/sporting
fields curator
65 General hand/labourer
66 Golf Course Manager/staff
67 Governance
manager/advisor/officer
68 HACC Home & Community Care
Officer
69 HACC Home Handyman
70 HACC Manager/ coordinator
71 HACC Respite Worker
72 Handyman/ Lockmaster / Caretaker
73 Health Inspector
74 Horticulturist / Arborist
75 Human Resources / Payroll Officer
91
QUESTIONNAIRE
Male new starters Female new starters
Under 21
21-34
35-49
50+ Under 21
21-34
35-49
50+
76 Human Resources Manager
77 Human Services coordinator/officer
78 Human Services Director / Manager
79 Human/community services admin
80 Human/community services
director
81 Infrastructure /Works Director
82 IT / GIS Officer/Business analyst
83 IT Manager/coordinator
84 Kindergarten director/manager
85 Kindergarten teacher/assistant
86 Lawyer / Legal staff
87 Librarian
88 Library Manager
89 Library Technician / Officer
90 Lifeguard / Beach Inspector
91 Motor/plant mechanic (including
diesel)
92 Natural resource management
manager/coordinator
93 Natural resource management
officer
94 Occupational Health and Safety
Officer
95 Parks & Gardens Leading Hand /
Team Leader / Ganger
96 Parks & Gardens Manager /
Supervisor

92
QUESTIONNAIRE
Male new starters Female new starters
Under 21
21-34
35-49
50+ Under 21
21-34
35-49
50+
97 Payroll manager/coordinator
98 Payroll officer
99 Planner
100 Planning and environment admin
officer
101 Planning and environment director
102 Planning Assistant
103 Planning Manager
104 Plant Operator – Grader Driver
105 Plant Operator – Other
106 Plumber/gasfitter
107 Pool Manager/ Assistant Pool
Manager/ Pool Attendant
108 Purchasing Officer / Procurement
Officer
109 Quarry Worker
110 Ranger
111 Rates Coordinator/officer
112 Records Management Manager
113 Records Management Officer
114 Recreation Officer/ Art gallery /
Museum curator/attendant
115 Recreation Services Manager /
Centre Manager
116 Regulatory Services Manager
117 Risk manager/coordinator
118 Risk officer

93
QUESTIONNAIRE
Male new starters Female new starters
Under 21
21-34
35-49
50+ Under 21
21-34
35-49
50+
119 Road Construction / Maintenance
Worker/ Line Marker
120 Sign Writer
121 Social Planner
122 Street Cleaner / Graffiti Remover
123 Surveyor
124 Theatre technicians
125 Tourism Officer
126 Traffic & Parking Control Officer
127 Tree Lopping / Wood Chipping
Worker
128 Urban and Regional Planning
Officer/Inspector
129 Volunteer Coordinator
130 Waste officer
131 Waste Truck Driver
132 Welder/fitter/boilermaker
133 Workforce Planner
134 Works admin officer
135 Works Leading Hand / Team Leader
/ Ganger
136 Works Supervisor
137 Works/Civil Engineer - roads,
bridges, stormwater etc.
139 Works/Engineering Manager
140 Youth Coordinator / Officer /
Worker

94
QUESTIONNAIRE
Male new starters Female new starters
Under 21
21-34
35-49
50+ Under 21
21-34
35-49
50+
141 Works/Civil Engineer - roads,
bridges, stormwater etc
142 Works/Engineering Manager
143 Youth Coordinator / Officer /
Worker
6c/6d. Q How many people left work in those occupations in the last 12 months?
For each occupation listed please report the number of who left those positions for any reason, including retirement, left the organisation etc in the past 12 months. Put zero in boxes where you have no separations.
Male separations Female separations
Under 21
21-34
35-49
50+ Under 21
21-34
35-49
50+
1 Accountant
2 Aged Care Coordinator/Officer
3 Airport
Manager/Officer/Groundsman
4 Animal Control Officer
5 Architect/landscape architect
6 Asset Manager
7 Builder/Building Assistant
8 Building Inspector (including
plumbing)
9 Building Surveyor
10 Building Sand property
coordinator/officer
11 Caravan Park Operator
12 Carpenter
13 Cemetery Officer / Curator /
95
QUESTIONNAIRE
Male separations Female separations
Under 21
21-34
35-49
50+ Under 21
21-34
35-49
50+
Worker / Grave Digger
14 Chief Executive Officer
(CEO)/General manager
15 Chief Executive Officer
(CEO)/General manager (Deputy)
16 Childcare Coordinator/Team Leader
17 Childcare Director/ Manager
18 Childcare Worker
19 Cleaner
20 Communications
Manager/coordinator
Position
21 Communications/media officer
22 Communications/social media
officer
23 Community Arts/Cultural
Coordinator
24 Community Centre
Coordinator/Officer
25 Community Development
Coordinator/Officer
26 Community Engagement
Manager/coordinator
27 Community Engagement officer
28 Community Housing
Coordinator/Officer
29 Community safety/Crime
Prevention Coordinator/Officer
30
Community Services
Coordinator/Community
Information Officer

96
QUESTIONNAIRE
Male separations Female separations
Under 21
21-34
35-49
50+ Under 21
21-34
35-49
50+
31 Community Services Manager
32 Community Transport/Bus Driver
33
Community Wastewater
Management System
(CWMS)/Water/Sewerage team
leader/worker
34 Community/immunisation/maternal
and child health Nurse
35 Construction/Drainage Worker
36 Contracts Management officer
37 Corporate Services/governance
admin officer
38 Corporate services/governance
director
39 Corporate Services/governance
manager
40 Cultural Awareness / Indigenous
Support Officer
41 Customer Services
Manager/Coordinator
42
Customer Services
Officer/Cashier/Reception/Call
Centre Officer
43 Draftsperson /Technical Officer
44 Driver/Carter
45 Economic/Business Development
Manager / Officer
46 Electrician/ other electrical trades
47 Emergency management
manager/coordinator
48 Engineering/infrastructure admin
officer

97
QUESTIONNAIRE
Male separations Female separations
Under 21
21-34
35-49
50+ Under 21
21-34
35-49
50+
49 Engineering/infrastructure director
50 Environment/Sustainability
manager/coordinator
51 Environment/sustainability officer
52 Environmental Health Manager
53 Environmental Health Officer
54 Environmental Services
Administration Officer
55 Environmental Services Director
56 Environmental Services Manager
57 Events coordinator/officer
58 Executive Assistant / Personal
Assistant
59 Finance Director
60 Finance Manager
61 Finance Officer
62 Fire Prevention/Security Officer
63 Garbage Tip/Resource recovery
worker
64 Gardener/groundsman/sporting
fields curator
65 General hand/labourer
66 Golf Course Manager/staff
67 Governance
manager/advisor/officer
68 HACC Home & Community Care
Officer
69 HACC Home Handyman

98
QUESTIONNAIRE
Male separations Female separations
Under 21
21-34
35-49
50+ Under 21
21-34
35-49
50+
70 HACC Manager/ coordinator
71 HACC Respite Worker
72 Handyman/ Lockmaster / Caretaker
73 Health Inspector
74 Horticulturist / Arborist
75 Human Resources / Payroll Officer
76 Human Resources Manager
77 Human Services coordinator/officer
78 Human Services Director / Manager
79 Human/community services admin
80 Human/community services
director
81 Infrastructure /Works Director
82 IT / GIS Officer/Business analyst
83 IT Manager/coordinator
84 Kindergarten director/manager
85 Kindergarten teacher/assistant
86 Lawyer / Legal staff
87 Librarian
88 Library Manager
89 Library Technician / Officer
90 Lifeguard / Beach Inspector
91 Motor/plant mechanic (including
diesel)
92 Natural resource management
manager/coordinator

99
QUESTIONNAIRE
Male separations Female separations
Under 21
21-34
35-49
50+ Under 21
21-34
35-49
50+
93 Natural resource management
officer
94 Occupational Health and Safety
Officer
95 Parks & Gardens Leading Hand /
Team Leader / Ganger
96 Parks & Gardens Manager /
Supervisor
97 Payroll manager/coordinator
98 Payroll officer
99 Planner
100 Planning and environment admin
officer
101 Planning and environment director
102 Planning Assistant
103 Planning Manager
104 Plant Operator – Grader Driver
105 Plant Operator – Other
106 Plumber/gasfitter
107 Pool Manager/ Assistant Pool
Manager/ Pool Attendant
108 Purchasing Officer / Procurement
Officer
109 Quarry Worker
110 Ranger
111 Rates Coordinator/officer
112 Records Management Manager
113 Records Management Officer

100
QUESTIONNAIRE
Male separations Female separations
Under 21
21-34
35-49
50+ Under 21
21-34
35-49
50+
114 Recreation Officer/ Art gallery /
Museum curator/attendant
115 Recreation Services Manager /
Centre Manager
116 Regulatory Services Manager
117 Risk manager/coordinator
118 Risk officer
119 Road Construction / Maintenance
Worker/ Line Marker
120 Sign Writer
121 Social Planner
122 Street Cleaner / Graffiti Remover
123 Surveyor
124 Theatre technicians
125 Tourism Officer
126 Traffic & Parking Control Officer
127 Tree Lopping / Wood Chipping
Worker
128 Urban and Regional Planning
Officer/Inspector
129 Volunteer Coordinator
130 Waste officer
131 Waste Truck Driver
132 Welder/fitter/boilermaker
133 Workforce Planner
134 Works admin officer
135 Works Leading Hand / Team Leader
/ Ganger

101
QUESTIONNAIRE
Male separations Female separations
Under 21
21-34
35-49
50+ Under 21
21-34
35-49
50+
136 Works Supervisor
137 Works/Civil Engineer - roads,
bridges, stormwater etc.
139 Works/Engineering Manager
140 Youth Coordinator / Officer /
Worker
7a. The next three questions will identify the size and shape of the apprenticeship market for
local government, and measure training levels in occupations experiencing skills shortages.
As well, they will identify gaps between apprenticeship commencements and completions in
critical trade occupations.
Q Does your council directly employ any apprentices?
Note that "directly employed" Apprentices does not include those supplied through contract or other arrangements.
Yes, we directly employ apprentices No, we do not directly employ apprentices - You will skip the next 3 questions Not able to access that information
7b. Q You said that council directly employed apprentices. How many directly employed apprentices do you have in each of the following trades?
If none enter zero (0) in the box.
Number of directly employed apprentices
Electrician
Plumber
Gasfitter
Welder
Sign Writer
Motor mechanic
Diesel/plant mechanic
Carpenter
Gardener/greenkeeper/horticulturalist
Other
7c. Q In the last financial year did any of your council employed apprentices leave their apprenticeship before completing it?
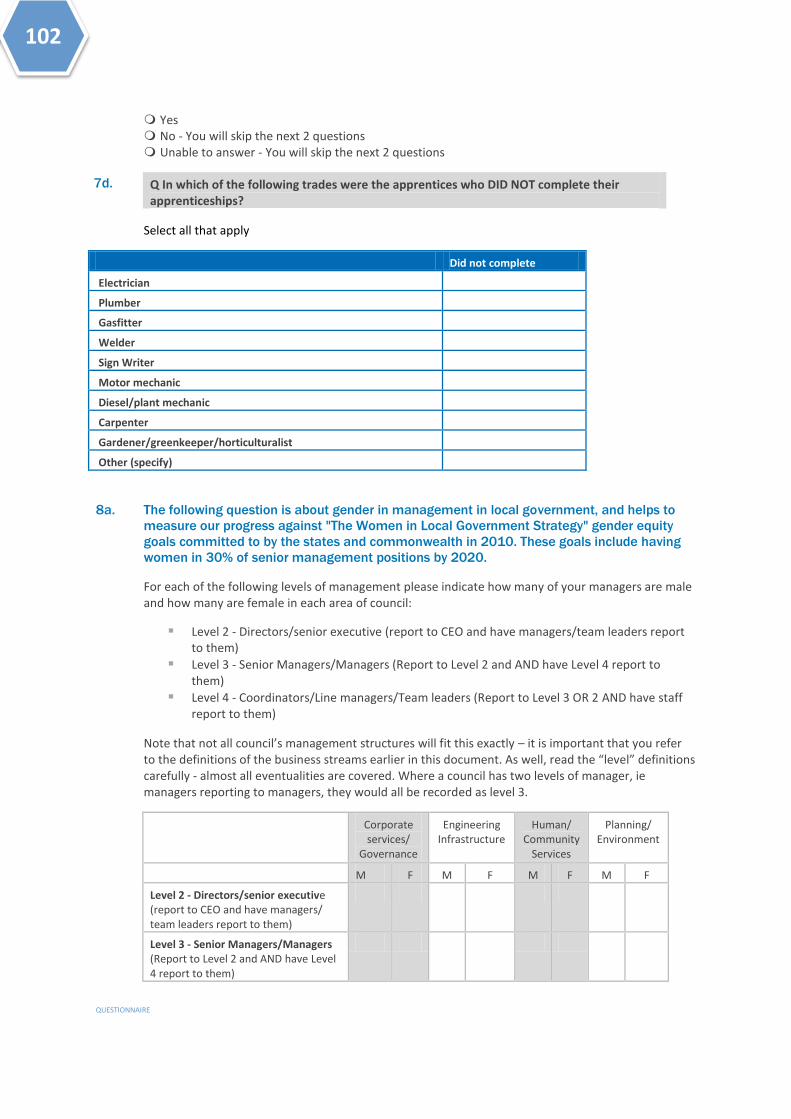
102
QUESTIONNAIRE
Yes No - You will skip the next 2 questions Unable to answer - You will skip the next 2 questions
7d. Q In which of the following trades were the apprentices who DID NOT complete their apprenticeships?
Select all that apply
Did not complete
Electrician
Plumber
Gasfitter
Welder
Sign Writer
Motor mechanic
Diesel/plant mechanic
Carpenter
Gardener/greenkeeper/horticulturalist
Other (specify)
8a. The following question is about gender in management in local government, and helps to
measure our progress against "The Women in Local Government Strategy" gender equity
goals committed to by the states and commonwealth in 2010. These goals include having
women in 30% of senior management positions by 2020.
For each of the following levels of management please indicate how many of your managers are male and how many are female in each area of council:
Level 2 - Directors/senior executive (report to CEO and have managers/team leaders report to them)
Level 3 - Senior Managers/Managers (Report to Level 2 and AND have Level 4 report to them)
Level 4 - Coordinators/Line managers/Team leaders (Report to Level 3 OR 2 AND have staff report to them)
Note that not all council’s management structures will fit this exactly – it is important that you refer to the definitions of the business streams earlier in this document. As well, read the “level” definitions carefully - almost all eventualities are covered. Where a council has two levels of manager, ie managers reporting to managers, they would all be recorded as level 3.
Corporate services/
Governance
Engineering Infrastructure
Human/ Community
Services
Planning/ Environment
M F M F M F M F
Level 2 - Directors/senior executive (report to CEO and have managers/ team leaders report to them)
Level 3 - Senior Managers/Managers (Report to Level 2 and AND have Level 4 report to them)

103
QUESTIONNAIRE
Level 4 – Coordinators/Line managers/Team leaders (Report to Level 3 OR 2 AND have staff report to them)
8b. Q Is your current CEO (including acting CEO if relevant) male or female?
Male Female
9a. This question is designed to measure the level of training support provided by local
government across critical occupations. Councils will be able to benchmark their training
expenditure per employee.
Q In the past financial year, how many staff, by occupation did council support, either financially or in kind including study leave or other flexible arrangements, to continue their studies?
Note that studies could include trainees and council employed apprenticeships, VET, university or professional development courses including short courses and conferences, as well as internal training. In kind support may include study leave etc.
Mandatory training is that which is required for the continuation of employment – ie tickets, certificates, first aid etc. Discretionary training is not required but deemed to be appropriate for the staff member because of the position they hold or their career direction.
Note: please enter as much data here as possible. If councils collects no training data centrally there will be an option to record that and skip past this question.
Male - Mandatory training
Female - Mandatory training
Male - Discretionary training/study
Female - Discretionary training/study
1 Accountant
2 Aged Care Coordinator/Officer
3 Airport
Manager/Officer/Groundsman
4 Animal Control Officer
5 Architect/landscape architect
6 Asset Manager
7 Builder/Building Assistant
8 Building Inspector (including
plumbing)
9 Building Surveyor

104
QUESTIONNAIRE
Male - Mandatory training
Female - Mandatory training
Male - Discretionary training/study
Female - Discretionary training/study
10 Buildings and property
coordinator/officer
11 Caravan Park Operator
12 Carpenter
13 Cemetery Officer / Curator /
Worker / Grave Digger
14 Chief Executive Officer
(CEO)/General manager
15 Chief Executive Officer
(CEO)/General manager (Deputy)
16 Childcare Coordinator/Team Leader
17 Childcare Director/ Manager
18 Childcare Worker
19 Cleaner
20 Communications
Manager/coordinator
21 Communications/media officer
22 Communications/social media
officer
23 Community Arts/Cultural
Coordinator
24 Community Centre
Coordinator/Officer
25 Community Development
Coordinator/Officer
26 Community Engagement
Manager/coordinator
27 Community Engagement officer
28 Community Housing
Coordinator/Officer
29 Community safety/Crime
Prevention Coordinator/Officer

105
QUESTIONNAIRE
Male - Mandatory training
Female - Mandatory training
Male - Discretionary training/study
Female - Discretionary training/study
30
Community Services
Coordinator/Community
Information Officer
31 Community Services Manager
32 Community Transport/Bus Driver
33
Community Wastewater
Management System
(CWMS)/Water/Sewerage team
leader/worker
34 Community/immunisation/maternal
and child health Nurse
35 Construction/Drainage Worker
36 Contracts Management officer
37 Corporate Services/governance
admin officer
38 Corporate services/governance
director
39 Corporate Services/governance
manager
40 Cultural Awareness / Indigenous
Support Officer
41 Customer Services
Manager/Coordinator
42
Customer Services
Officer/Cashier/Reception/Call
Centre Officer
43 Draftsperson /Technical Officer
44 Driver/Carter
45 Economic/Business Development
Manager / Officer
46 Electrician/ other electrical trades
47 Emergency management
manager/coordinator

106
QUESTIONNAIRE
Male - Mandatory training
Female - Mandatory training
Male - Discretionary training/study
Female - Discretionary training/study
48 Engineering/infrastructure admin
officer
49 Engineering/infrastructure director
50 Environment/Sustainability
manager/coordinator
51 Environment/sustainability officer
52 Environmental Health Manager
53 Environmental Health Officer
54 Environmental Services
Administration Officer
55 Environmental Services Director
56 Environmental Services Manager
57 Events coordinator/officer
58 Executive Assistant / Personal
Assistant
59 Finance Director
60 Finance Manager
61 Finance Officer
62 Fire Prevention/Security Officer
63 Garbage Tip/Resource recovery
worker
64 Gardener/groundsman/sporting
fields curator
65 General hand/labourer
66 Golf Course Manager/staff
67 Governance
manager/advisor/officer
68 HACC Home & Community Care
Officer
69 HACC Home Handyman

107
QUESTIONNAIRE
Male - Mandatory training
Female - Mandatory training
Male - Discretionary training/study
Female - Discretionary training/study
70 HACC Manager/ coordinator
71 HACC Respite Worker
72 Handyman/ Lockmaster / Caretaker
73 Health Inspector
74 Horticulturist / Arborist
75 Human Resources / Payroll Officer
76 Human Resources Manager
77 Human Services coordinator/officer
78 Human Services Director / Manager
79 Human/community services admin
80 Human/community services
director
81 Infrastructure /Works Director
82 IT / GIS Officer/Business analyst
83 IT Manager/coordinator
84 Kindergarten director/manager
85 Kindergarten teacher/assistant
86 Lawyer / Legal staff
87 Librarian
88 Library Manager
89 Library Technician / Officer
90 Lifeguard / Beach Inspector
91 Motor/plant mechanic (including
diesel)
92 Natural resource management
manager/coordinator
93 Natural resource management

108
QUESTIONNAIRE
Male - Mandatory training
Female - Mandatory training
Male - Discretionary training/study
Female - Discretionary training/study
officer
94 Occupational Health and Safety
Officer
95 Parks & Gardens Leading Hand /
Team Leader / Ganger
96 Parks & Gardens Manager /
Supervisor
97 Payroll manager/coordinator
98 Payroll officer
99 Planner
100 Planning and environment admin
officer
101 Planning and environment director
102 Planning Assistant
103 Planning Manager
104 Plant Operator – Grader Driver
105 Plant Operator – Other
106 Plumber/gasfitter
107 Pool Manager/ Assistant Pool
Manager/ Pool Attendant
108 Purchasing Officer / Procurement
Officer
109 Quarry Worker
110 Ranger
111 Rates Coordinator/officer
112 Records Management Manager
113 Records Management Officer
114 Recreation Officer/ Art gallery /
Museum curator/attendant
109
QUESTIONNAIRE
Male - Mandatory training
Female - Mandatory training
Male - Discretionary training/study
Female - Discretionary training/study
115 Recreation Services Manager /
Centre Manager
116 Regulatory Services Manager
117 Risk manager/coordinator
118 Risk officer
119 Road Construction / Maintenance
Worker/ Line Marker
120 Sign Writer
121 Social Planner
122 Street Cleaner / Graffiti Remover
123 Surveyor
124 Theatre technicians
125 Tourism Officer
126 Traffic & Parking Control Officer
127 Tree Lopping / Wood Chipping
Worker
128 Urban and Regional Planning
Officer/Inspector
129 Volunteer Coordinator
130 Waste officer
131 Waste Truck Driver
132 Welder/fitter/boilermaker
133 Workforce Planner
134 Works admin officer
135 Works Leading Hand / Team Leader
/ Ganger
136 Works Supervisor
137 Works/Civil Engineer - roads,
110
QUESTIONNAIRE
Male - Mandatory training
Female - Mandatory training
Male - Discretionary training/study
Female - Discretionary training/study
bridges, stormwater etc.
139 Works/Engineering Manager
140 Youth Coordinator / Officer /
Worker
9b. Q Please enter council's total annual training budget (2011/12), including all training, internal and external, across the organisation.
Note that if you have one, the training travel budget would be a separate line item and not just a notional proportion of the total training budget. The training travel budget would include travel and accommodation costs associated with attending training, including travel to conferences etc. If you don’t have separate line item for training travel please type in 0
Training budget $ ____________________ Training related travel budget if relevant $ ____________________
9c. Q Please enter the total annual payroll for the last financial year (2011/12) (as supplied for the Grants Commission or the ABS Earnings Survey)
Enter number in whole dollars only
Total wages $ ____________________
10a. The following question will help to identify those occupations in which there are local,
regional or national skills shortages. By quantifying the extent of the skills shortage local
government may be able to attract funding to provide more training in those occupations.
Q Please write in the total number of positions vacant at your council at present, including any that are vacant but not currently being advertised.
A refers to all positions classed as vacant. B,C and D refer to vacancies currently active, that is council is seeking to fill them. E refers to positions which sit on councils books but are not currently being pursued, for strategic, organisational or economic reasons.
Positions that are not filled because of difficulty in attracting candidates must fit into B, C or D.
Note that B, C, D and E must add up to A.
A Total number of positions currently vacant ____________________ B Active positions vacant for less than 6 months ____________________ C Active positions vacant for 6 - 12 months ____________________ D Active positions vacant for more than 12 months ____________________
E Positions vacant but not currently being advertised ____________________
10b. Q You said that you had xxx positions you had been trying to fill for 6 – 12 months, please give up to 3 examples of the positions you are unable to fill.

111
QUESTIONNAIRE
Please write one position in each text box - up to three.
Position 1 ____________________ Position 2 ____________________ Position 3 ____________________
10c. Q You said that you had xxx positions that had been vacant for more than 12 months. Please give up to 3 examples of those positions.
Please write one position in each text box - up to three.
Position 1 ____________________ Position 2 ____________________ Position 3 ____________________
11a. The next set of questions will measure the progress in workforce planning across the sector.
Q Which of the following best describes your council's workforce planning status:
Not planning to do a workforce plan at present Have commenced work on a workforce plan Have substantially completed a workforce plan Have developed and are implementing our work force plan
Have an established workforce plan which is in place throughout the council.
12a. The next three questions are designed to measure the extent to which diversity targets are
being set across the LG workforce and benchmark the rate at which those targets are being
met.
This question measures actual employment type by target groups.
Q How many employees do you have in each of these diversity groups?
For each diversity category, please type in how many employees you currently have by gender and whether they are full time, part time or casual. If you have FTE data for each diversity group please enter that as well, otherwise put zero (0) in each of the boxes you do not have an answer for.
Note that staff could fall into more that one category, and may be double counted if appropriate. Note that the bottom row requires data for all staff – eg. the total number of male full time staff at council, etc.
Full time Part time Casual FTE if known
Male Female Male Female Male Female Male Female
Indigenous
Disability
(CALD) Culturally and linguistically diverse
Total staff
12b. This questions measures how many councils actually have diversity targets
Q Does your council have diversity targets?

112
QUESTIONNAIRE
Please select the appropriate answer.
Yes - in place
We are working towards having diversity targets
No - we have no plans to implement diversity targets at present
12c. This question measure diversity targets across local government.
Q In real numbers what is your target for each of these diversity groups?
For each diversity category, please type in how many employees you currently have by gender and whether they are full time, part time or casual. If you have FTE data for each diversity group please enter that as well, otherwise put zero (0) in each of the boxes you do not have an answer for.
Total head count Total FTE (if known)
Indigenous
Disability
CALD (Culturally and linguistically diverse)
Total Full time staff
13. This question explores emerging workforce development issues, and will be used as a
benchmark against which to track workforce development issues over time.
Q What does your organisation consider to be the biggest challenge facing your council in workforce development in the next 12 months?
Please write in your response – be as specific as possible.
14. Please use this space to make comments about the ALGWECensus - how did you find using
it? How could we make it better?

Appendix EMethodology of the Survey

114
METHODOLOGY OF THE SURVEY
Appendix E Methodology of the Survey
Pilot
The scope of the data to be collected in the survey was agreed by state and territory agencies, local government associations, and employee representative and professional associations. The Survey data collection tool developed by ACELG was piloted with a number of councils across the country, ranging in size and capacity from 150 to 1,500 employees. Pilot councils were selected to represent a cross section of Australian councils by size, geographic location and capacity. Whilst some of the pilot councils had sophisticated HR/workforce systems with which they could gather the data, others collected the data manually.
The main purpose of the pilot was to ensure that the data collection tool was easy to use, and whether the wording of the questions and project information was clear and unambiguous. The pilots were attended by the Survey’s project coordinator to ensure that feedback was directly received. Feedback from the pilot surveys was incorporated into the final data collection tool.
The pilot councils are listed in Table 12 below.
Table 12: Pilot Councils
State Council
New South Wales Palerang
Rockdale
Queensland Sunshine Coast
Townsville
Victoria Golden Plains
Western Australia Stirling Council
Capel Shire
South Australia Barossa
ACELG would like to thank the councils who participated in the pilot for recognising the importance of this project and giving their time and expertise to the pilot process.
Data collection
The Survey was conducted nationally using Vovici web survey software between 30 November 2012 and 21 January 2013, with a paper copy of the survey questions provided in advance to local governments for initial data collection. The survey was supported by an information website, written instructions, and both online and telephone support. Along with the invitation to participate, links to the survey were sent by email to every council in Australia, addressed to the Chief Executive Officer (CEO)/general manager.

115
METHODOLOGY OF THE SURVEY
Response rate
154 local governments across metropolitan, regional, rural and remote Australia participated in the survey, which equates to an average national response rate of 27%. The response rate varied considerably by state, with higher proportions of councils answering the survey within jurisdictions where participation was encouraged by the state/territory agency responsible for local government (WA, VIC, SA and NT) or the local government association (NSW). The lower proportion of responses from Queensland and Tasmania reduced the representativeness of the data for these jurisdictions. Table 13 shows the response rate by state/territory and the range and average number of staff per local government.
Table 13: Profile of participating local governments by state
Regional, rural or remote local governments had a lower survey response rate compared to those in metropolitan and urban fringe locations. Local governments that responded to the survey are allocated according to a 5 category version of the Australian Classification of Local Governments (ACLG) category listing (2009) and compared to the distribution of all local governments in Table 14 below. A complete listing of the ACLG category listing is provided at Appendix A.
Table 14: Categorisation of ALGWE Census respondents using ACLG category listing
LGs in Survey Total LGs in Australia
% of LGs represented in
Survey
Capital City/Metropolitan (CC; D) 40 102 39.2%
Urban Fringe (F) 18 37 48.6%
Regional towns/cities (R) 40 116 34.5%
Rural Agricultural (SG; A) 47 241 19.5%
Rural Remote (T) 9 69 13.0%
Total 154 565 100%
Although 154 councils completed the survey, there were a number of questions skipped by a large number of respondents. The unit non-response rate correlated positively with the increased complexity of the questions, suggesting that the burden of some questions was very high. Without further investigation, it is impossible to be conclusive about the nature of the burden for each of these questions on respondents. However, it seems likely that many local governments did not have
State/
Territory
Answered Survey
Total
LGs
% of
LGs
No. of staff
(Largest)
No. of staff (Smallest)
No. of staff (Total)
Average staff per
LG
NSW 42 155 27.1 1,789 60 21,114 503
WA 44 139 31.7 1,115 12 10564 240
VIC 38 79 48.1 2,433 61 25,172 662
NT 7 16 43.8 462 15 1476 211
QLD 6 75 8.0 1,676 143 4,840 807
TAS 2 29 6.9 312 245 557 279
SA 15 69 21.7 952 18 3,567 238
Total 154 562 27.4 67,291 437

116
METHODOLOGY OF THE SURVEY
the workforce data available in the form requested which impacted their capacity to answer the questions easily and accurately.