PROFILE OF CSU EmployEES - California State University · EmployEE profilE 2012 | Dear CSU Friends,...
30
www.calstate.edu CSU EMPLOYEES PROFILE OF FALL 2012
Transcript of PROFILE OF CSU EmployEES - California State University · EmployEE profilE 2012 | Dear CSU Friends,...

www.calstate.edu
CSU EmployEESPROFILE OF
F A L L 2 0 1 2

EmployEE profilE 2012 |
Dear CSU Friends,
I am pleased to announce that the Fall 2012 Profile of CSU Employees1 is now available.
The Profile is intended as an easy-to-use reference for demographic information on CSU
employees at all 23 campuses plus the Chancellor’s Office. For historical data on CSU
employees, I encourage you to refer to previous editions of the Employee Profile, the chapter
on faculty and staff in the CSU Statistical Abstract2, and faculty historical employment data3.
Because of significant changes to the CSU’s external reporting requirements, the data
source and methodology used to collect and organize employee data has changed. As a
consequence, employee occupational groupings have been realigned, and the new groupings,
in general, should not be directly compared to the groups reported in prior Employee Profiles.
I welcome your comments and questions about the Employee Profile or other data. We are
always striving to improve the usefulness of our published data on CSU employees.
Sincerely,
Gail E. BrooksVice Chancellor, Human ResourcesOffice of the ChancellorThe California State University401 Golden ShoreLong Beach, CA 90802-4210
Please send comments and questions to: [email protected]
1 This report and other data on CSU employees are available online: www.calstate.edu/hr/employee-profile/archive.shtml2 To view historical data on faculty and staff see: www.calstate.edu/as/abstract.shtml3 www.calstate.edu/HR/facsumrep.shtml
Note: Percentages may not add to 100 percent because of rounding.
Published
PROFILE OF CSU EMPLOYEESFALL 2012

EmployEE profilE 2012 |
EmployEES By oCCUpATioNAl GroUp AND CAmpUS
1 Headcount of Employees by Occupational Group, Fall 2012 and Prior Year
1 Occupational Profile of Full-Time Employees (Headcount), Fall 2012
2 Staffing by Campus, Fall 2012
3 Headcount of Employees by Campus, Fall 2012 and Prior Year
EmployEES By GENDEr AND ETHNiCiTy
4 Employee Headcount by Gender and Ethnicity, Fall 2012
5 Total Employee Headcount by Gender and Ethnicity, Fall 2012, Prior Year, and
Five Years Earlier
6 Percent of Full-Time Employees within Occupational Groups by Gender & Ethnicity,
Fall 2012
7 Occupational Profile of Full-Time Employee Headcount by Gender and Ethnicity,
Fall 2012
8 Occupational Profile of Full-Time Employee Headcount by Ethnicity, Fall 2012
9 Headcount of Full-Time Employees by Occupational Group and Ethnicity,
Fall 2012 and Five Years Earlier
AGE DiSTriBUTioN of CSU EmployEES
10 Age Distribution of Full-Time Employee Headcount by Faculty Status, Fall 2012
10 Age Distribution of Full-Time Employee Headcount by Gender and Minority Status,
Fall 2012
11 Percentage of Full-Time Employees by Age Group, Fall 2012
12 Minority Employees as Percent of Full-Time Employees by Age Group and Job Category
(Headcount), Fall 2012
12 Female Employees as Percent of Full-Time Employees by Age Group and Job Category
(Headcount), Fall 2012
TABLE OF CONTENTS - CSU STAFFING

EmployEE profilE 2012 |
GENDEr AND ETHNiCiTy
14 Full-Time Faculty by Rank, Gender, and Ethnicity (Headcount), Fall 2012 and
Five Years Earlier
15 Full-Time Faculty by Tenure Status, Gender, and Ethnicity (Headcount), Fall 2012 and
Five Years Earlier
16 Headcount of Part-Time Faculty by Gender and Ethnicity, Fall 2012
TENUrE STATUS
17 Headcount of Full-Time Faculty with Tenure, with Doctorate, by Rank, Fall 2012
17 Headcount of Full-Time Faculty by Tenure Status and Ethnicity, Fall 2012 and
Five Years Earlier
NEW fACUlTy
18 New Full-Time, Tenure-Track Faculty by Rank (Headcount), Fall 2012 and
Five Years Earlier
promoTioNS & TENUrE
19 Promotions Among Full-Time Faculty (Headcount), Fall 2012 and Prior Year
19 Number of Faculty Granted Tenure (Headcount), Fall 2012
SEpArATioNS
20 Separations Among Full-Time Faculty by Cause and Appointment Status (Headcount),
2011-12 and 2010-11
SAlAry
21 Average Salaries for Full-Time Faculty by Rank and Appointment Type (Headcount),
Fall 2012
CAmpUS
22 Headcount of Full-Time Faculty by Rank and Campus, Fall 2012
TECHNiCAl NoTES AND GloSSAry
23 – 25 Technical Notes and Glossary
TABLE OF CONTENTS - CSU FACULTY

CSU STAFFIng Fall 2012
The California State University employs over 44,000 faculty and staff statewide. The tables below present information on the numbers of faculty and staff employed in various occupational categories, as well as the numbers employed at each campus. Due to significant changes to reporting requirements for IPEDS (Integrated Postsecondary Education Data System), beginning in 2012, reporting groups have been realigned and cannot be compared directly to groups reported in prior Employee Profiles. Employee reporting has been aligned with the 2010 Standard Occupational Classifications published by the National Bureau of Labor Standards.
Faculty totals throughout this section include research fellows funded by external grants (21 full-time and 8 part-time).
2012 employee headcounts are affected by the change in the 2012 data source, timing of the fall snapshot, and selection criteria for the occupational groups.
note: Percentages may not add to 100 percent because of rounding.

EmployEE profilE 2012 | 1
Management
Construction / Maintenance / Transportation
Service Occupations
Office / Administrative Support
Professional / Technical Occupations
Faculty
34.4%
35.6%
4.2%5.0%
6.4%
14.3%
*Refer to Technical notes and glossary for the definitions of the Occupational groups.
EMPLOYEES BY OCCUPATIONAL GROUP AND CAMPUS
Headcount of employees by occupational Group*, fall 2012 and prior year
fall 2012 Data Source: Integrated Postsecondary Education Data System (IPEDS), Oracle / PeopleSoft
(new occupational Groups) Full-Time Part-Time Total
Faculty 11,369 10,907 22,276Professional / Technical Occupations 10,998 991 11,989Office / Administrative Support 4,573 366 4,939Service Occupations 2,058 111 2,169Construction / Maintenance / Transportation 1,593 35 1,628Management 1,354 9 1,363
GRAND TOTALS 31,945 12,419 44,364 fall 2011 Data Source: Campus Information Retrieval System (CIRS) (previous occupational Groups) Full-Time Part-Time Total
Faculty 11,329 10,581 21,910Other Professional 9,558 792 10,350Clerical & Secretarial 4,000 335 4,335Technical & Paraprofessional 2,540 237 2,777Service/Maintenance 1,979 102 2,081Executive, Administrative, & Managerial 1,493 10 1,503Skilled Crafts 979 3 982
GRAND TOTALS 31,878 12,060 43,938
note: Table includes all employees with the exception of student employees, other intermittent or casual employees, and faculty teaching in extension, special sessions, and summer sessions.
occupational profile of full time employees (Headcount), fall 2012

EmployEE profilE 2012 | 2
EMPLOYEES BY OCCUPATIONAL GROUP AND CAMPUS
staffinG by campus, fall 2012
Headcount Full-Time
Total Full-Time Part-Time Equivalents (FTE)
Bakersfield 867 699 168 777.1
Channel Islands 747 567 180 658.0
Chico 1,777 1,306 471 1,538.1
Dominguez Hills 1,294 824 470 1,010.3
East Bay 1,509 1,027 482 1,255.8
Fresno 2,099 1,509 590 1,736.7
Fullerton 3,294 2,211 1,083 2,699.9
Humboldt 1,207 873 334 1,026.9
Long Beach 3,372 2,375 997 2,820.3
Los Angeles 2,005 1,414 591 1,681.7
Maritime Academy 239 212 27 226.4
Monterey Bay 821 587 234 700.7
Northridge 3,429 2,388 1,041 2,847.0
Pomona 2,092 1,493 599 1,788.7
Sacramento 2,520 1,847 673 2,130.7
San Bernardino 1,739 1,321 418 1,515.7
San Diego 2,967 2,282 685 2,567.1
San Francisco 3,229 2,202 1,027 2,647.9
San José 3,080 1,973 1,107 2,483.8
San Luis Obispo 2,284 1,908 376 2,101.2
San Marcos 1,181 852 329 1,003.2
Sonoma 1,176 863 313 999.4
Stanislaus 916 705 211 791.4
Chancellor’s Office 520 507 13 515.9
TOTAL 44,364 31,945 12,419 37,523.8 note: Table includes all employees with the exception of student employees, other intermittent or casual employees, and faculty teaching in extension, special sessions, and summer sessions.

EmployEE profilE 2012 | 3
Full-TimeFALL 2012
Part-Time grand Total
EMPLOYEES BY OCCUPATIONAL GROUP AND CAMPUS
Headcount of employees by campus, fall 2012 and prior year
Campus Faculty Staff Faculty Staff Fall 2012 Fall 2011
Bakersfield 244 455 126 42 867 861
Channel Islands 152 415 160 20 747 659
Chico 481 825 385 86 1,777 1,805
Dominguez Hills 267 557 434 36 1,294 1,292
East Bay 305 722 399 83 1,509 1,456
Fresno 642 867 551 39 2,099 2,013
Fullerton 891 1,320 1,019 64 3,294 3,196
Humboldt 265 608 267 67 1,207 1,173
Long Beach 945 1,430 882 115 3,372 3,482
Los Angeles 560 854 539 52 2,005 2,000
Maritime Academy 56 156 17 10 239 225
Monterey Bay 170 417 196 38 821 754
Northridge 885 1,503 949 92 3,429 3,374
Pomona 529 964 537 62 2,092 2,075
Sacramento 671 1,176 605 68 2,520 2,543
San Bernardino 445 876 376 42 1,739 1,683
San Diego 813 1,469 581 104 2,967 3,065
San Francisco 803 1,399 823 204 3,229 3,074
San José 697 1,276 1,025 82 3,080 3,119
San Luis Obispo 734 1,174 312 64 2,284 2,314
San Marcos 289 563 289 40 1,181 1,165
Sonoma 251 612 251 62 1,176 1,167
Stanislaus 274 431 184 27 916 907
Chancellor’s Office 507 13 520 536
TOTAL 11,369 20,576 10,907 1,512 44,364 43,938
notes: Staff excludes instructional faculty personnel. Table includes all employees with the exception of student employees, other intermittent or casual employees, and faculty teaching in extension, special sessions, and summer sessions.

EmployEE profilE 2012 | 4
26.7%
22.5%
17.7%
29.3%
3.7%
27.8%
20.2%
16.0%
31.5%
4.6%
All Employees
30.4%
14.2%
11.5%
37.2%
6.8%
Part-TimeFull-Time
Race/Ethnicity/Gender Unknown
White Female
Minority Female
Minority Male
White Male
EMPLOYEES BY GENDER AND ETHNICITY
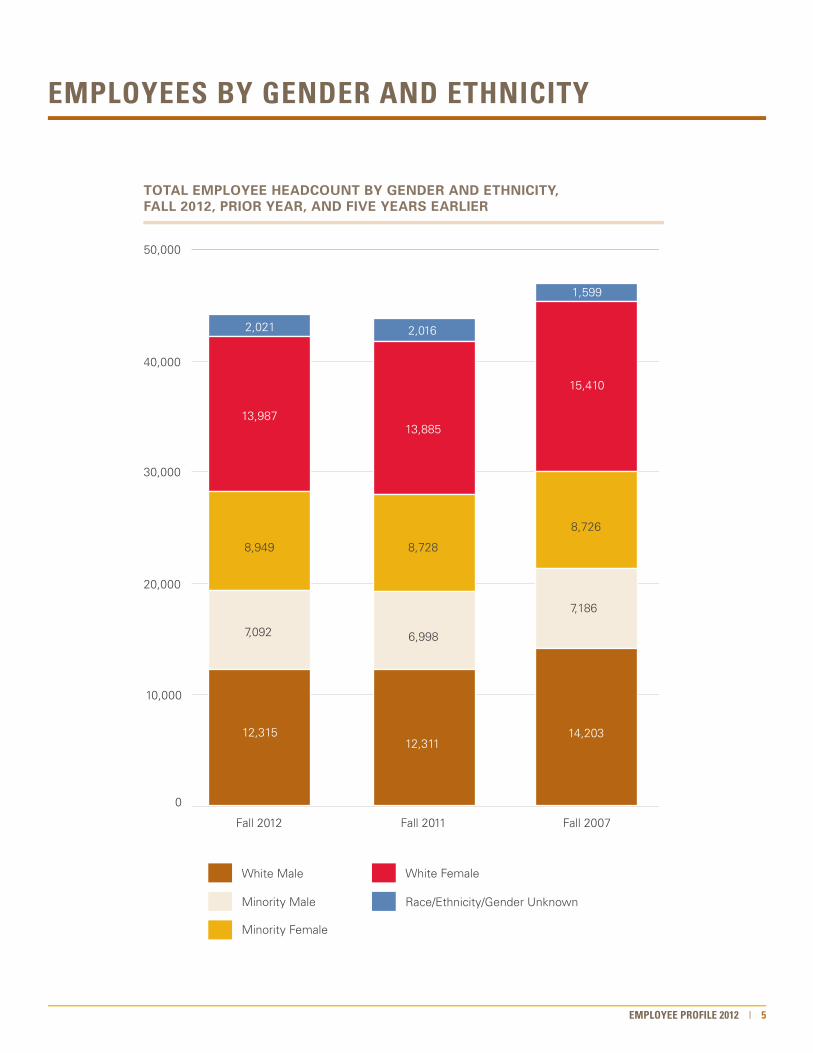
Pages 4 through 9 provide information on the gender and ethnicity of CSU employees. Pages 4 and 5 include data for all employees (both full-time and part-time), while the remaining pages provide detailed information on only full-time employees.
employee Headcount by Gender and etHnicity, fall 2012
fall 2012
Full-Time Part-Time All Employees
White Male 8,544 3,771 12,315Minority Male 5,662 1,430 7,092Minority Female 7,189 1,760 8,949White Female 9,373 4,614 13,987Race/Ethnicity/Gender Unknown 1,177 844 2,021
TOTAL 31,945 12,419 44,364 Total Minority 12,851 3,190 16,041Total White 17,917 8,385 26,302Total Female 16,562 6,374 22,936Total Male 14,206 5,201 19,407Total Unknown 1,177 844 2,021
note: Table includes all employees with the exception of student employees, other intermittent or casual employees, and faculty teaching in extension, special sessions, and summer sessions. gender was not stated for 6 employees.
EmployEE profilE 2012 | 5
total employee Headcount by Gender and etHnicity, fall 2012, prior year, and five years earlier
Race/Ethnicity/Gender Unknown
White Female
Minority Female
Minority Male
White Male
Fall 2012
12,315
7,092
8,949
13,987
2,021
Fall 2011
12,311
6,998
8,728
13,885
2,016
Fall 2007
14,203
7,186
8,726
15,410
1,599
0
10,000
20,000
30,000
40,000
50,000
EMPLOYEES BY GENDER AND ETHNICITY

EmployEE profilE 2012 | 6
percent of full-time employees witHin occupational Groups* by Gender & etHnicity, fall 2012
3.7%
7.3%
44.7%
39.3%
4.9%
Office/Administrative
Support
40.1%
51.7%
2.8%
3.5% 1.9%
Construction/Maintenance/Transportation
13.4%
31.0%
15.9%36.2%
3.5%
FacultyProfessional/
TechnicalOccupations
26.4%
30.9%
16.4%
22.3%
4.0%
Management14.2%36.0%
31.5%
3.4%14.9%
ServiceOccupations
43.4%
21.5%
8.6%
3.5%
23.0%
Race/Ethnicity/Gender Unknown
White Male
White Female
Minority Male
Minority Female
* Refer to Technical notes and glossary for the definitions of the Occupational groups.
EMPLOYEES BY GENDER AND ETHNICITY

EmployEE profilE 2012 | 7
occupational profile of full-time employee Headcount by Gender and etHnicity, fall 2012
Management
Construction / Maintenance / Transportation
Service Occupations
Office / Administrative Support
Professional / Technical Occupations
Faculty
MinorityFemale
21.3%
28.5%
40.5%
6.6%0.4% 2.8%
WhiteFemale
37.6%19.2%
36.3%
1.9%0.5% 4.6%
31.9%
5.9%
31.8%
15.8%
WhiteMale 48.1%
2.6%
28.7%
5.2%
9.6%5.7%
11.3%3.4%
MinorityMale
EMPLOYEES BY GENDER AND ETHNICITY

EmployEE profilE 2012 | 8
occupational profile of full-time employee Headcount by etHnicity, fall 2012
Black orAfrican
American
20.3%
36.8%
21.7%
11.0%
5.0%5.2%
17.0%
45.3%
14.2%
15.1%
6.6% 1.9%
Native Hawaiian/
Other PacificIslander
37.3%
39.5%
11.4%
6.0%
2.9% 3.0%
Asian
18.2%
33.6%23.6%
15.0%
7.3% 2.4%
Hispanic
25.2%
44.1%
19.1%
4.0%3.6% 4.0%
Two or MoreEthnicities/
Races
31.3%
33.2%
18.7%
7.5%
7.5% 1.9%
AmericanIndian/
Alaska Native
42.6%11.3%
32.7%
3.5%
4.9% 5.1%
White
Management
Construction / Maintenance / Transportation
Service Occupations
Office / Administrative Support
Professional / Technical Occupations
Faculty
EMPLOYEES BY GENDER AND ETHNICITY

EmployEE profilE 2012 | 9
Headcount of full-time employees by occupational Group* and etHnicity, fall 2012 and five years earlier fall 2012
Faculty 11,369 67 1,759 425 981 18 399 83 7,637
Professional / Technical 10,998 71 1,861 771 1,811 48 437 145 5,854 Occupations
Office/ Administrative Support 4,573 40 536 454 1,275 15 165 63 2,025
Service Occupations 2,058 16 283 231 808 16 72 13 619
Construction/ Maintenance/ 1,593 16 136 104 394 7 54 12 870 Transportation
Management 1,354 4 140 108 127 2 44 13 916
TOTAL 31,945 214 4,715 2,093 5,396 106 1,171 329 17,921
fall 2007
Faculty 12,063 75 1,733 475 983 8,440 357
Other Professional 9,447 90 1,652 707 1,419 5,322 257
Clerical & Secretarial 4,470 39 514 495 1,096 2,199 127
Technical & Paraprofessional 2,818 22 368 210 497 1,662 59
Service/Maintenance 2,048 15 299 264 820 589 61
Executive, Administrative, & 1,526 6 141 117 147 1,094 21 Managerial
Skilled Crafts 1,029 18 81 69 224 623 14
TOTAL 33,401 265 4,788 2,337 5,186 19,929 896
*Refer to Technical notes and glossary for the definitions of the Occupational groups.
Total
Total
Black or African
American
Black or African
American
American Indian or
Alaska Native
American Indian or
Alaska Native
Asian
Asian
Hispanic
Hispanic
White
White
Native Hawaiian or
Other Pacific Islander
Two or More
Ethnicities/Race
Race/Ethnicity
Unknown
Race/Ethnicity
Unknown
EMPLOYEES BY OCCUPATIONAL GROUP AND ETHNICITY

EmployEE profilE 2012 | 10
The following tables provide information on the age distribution of full-time employees by faculty and staff status, gender, and ethnicity.
aGe distribution of full-time employees by faculty and staff status, fall 2012
Age
Headcount % Headcount % Headcount %
60+ 2,751 13.4% 2,674 23.5% 5,425 17.0%
50-59 6,483 31.5% 3,481 30.6% 9,964 31.2%
40-49 5,012 24.4% 3,317 29.2% 8,329 26.1%
30-39 4,508 21.9% 1,803 15.9% 6,311 19.8%
Under 30 1,822 8.9% 94 0.8% 1,916 6.0%
TOTAL 20,576 100.0% 11,369 100.0% 31,945 100.0%
AveRAGe AGe 46.9 51.2 48.4
* Staff excludes instructional faculty personnel.
aGe distribution of full-time employees by Gender and minority status, fall 2012
Age
Headcount % Headcount % Headcount % Headcount %
60+ 2,810 19.0% 2,614 15.3% 1,541 12.0% 5,424 17.0%
50-59 4,539 30.7% 5,423 31.6% 3,554 27.7% 9,962 31.2%
40-49 4,020 27.2% 4,307 25.1% 3,583 27.9% 8,327 26.1%
30-39 2,747 18.6% 3,563 20.8% 3,130 24.4% 6,310 19.8%
Under 30 687 4.6% 1,229 7.2% 1,045 8.1% 1,916 6.0%
TOTAL 14,803 100.0% 17,136 100.0% 12,853 100.0% 31,939 100.0%
AveRAGe AGe 49.2 47.7 46.1 48.4
note: gender was not stated for 6 employees.
Staff*
Male Female Minorities Total
Faculty Total
AGE DISTRIBUTION OF CSU EMPLOYEES

EmployEE profilE 2012 | 11
percentaGe of full-time employees by aGe Group, fall 2012
0
5
10
15
20
25
30
35
TotalMinoritiesFemaleMale
19.0
%
30.7
%
27.2
%
4.6%
18.6
%
27.3
%
18.9
%
15.3
%
8.1%
27.7
%
28.2
%
24.8
%
12.0
%
27.7
%
27.9
%
24.4
%
17.0
%
31.2
%
26.1
%
19.8
%
26.3
%
19.8
%
6.0%
7.2%
20.8
%
25.1
%
31.6
%
25.4
%
20.6
%
Under 30 30-39 40-49 60+50-59
Under 30
30-39
40-49
50-59
60+
AGE DISTRIBUTION OF CSU EMPLOYEES

EmployEE profilE 2012 | 12
minority employees as percent of full-time employeesby aGe Group and Job cateGory (Headcount), fall 2012
Technical All Full-Time Support & Managerial Faculty Employees
60+ 45.5 28.1 22.0 28.4
50-59 48.2 33.8 27.8 35.7
40-49 56.2 46.2 32.5 43.0
30-39 61.0 50.9 37.1 49.6
Under 30 61.8 49.6 33.0 54.5
All Ages 53.7% 41.3% 29.3% 40.2%
E.g., In the “60 and above” age group of Full-Time Support employees, 45.5 percent are minorities.
female employees as percent of full-time employeesby aGe Group and Job cateGory (Headcount), fall 2012
Technical All Full-Time
Support & Managerial Faculty Employees
60+ 59.0 56.7 38.5 48.2
50-59 56.5 60.6 46.2 54.4
40-49 52.6 55.0 48.1 51.7
30-39 58.6 58.1 51.9 56.5
Under 30 66.7 61.9 61.7 64.1
All Ages 57.5% 58.2% 46.0% 53.6%
E.g., In the “60 and above” age group of Full-Time Support employees, 59.0 percent are female.
* Support includes persons in the following employee categories: Construction / Maintenance / Transportation, Office / Administrative Support, Service Occupations. ** Professional Technical & Managerial includes persons in the following employee categories: Management and Professional / Technical Occupations.
*
*
**
Professional
Professional
**
AGE DISTRIBUTION OF CSU EMPLOYEES

EmployEE profilE 2012 | 13
CSU FACULTY Fall 2012
The California State University employs approximately 22,000 total faculty. The diverse composition of CSU faculty also reflects the general characteristics of California’s population. This section of the profile focuses primarily on the 11,300-plus full-time faculty in the CSU. More than 82 percent of the CSU full-time faculty are tenured or on the tenure track.Faculty totals throughout this section exclude research fellows funded by external grants ( 21 full-time and 8 part-time)who were included as faculty in the totals in the Employees by Occupational group sections.
2012 employee headcounts are affected by the change in the 2012 data source, timing of the fall snapshot, and selection criteria for the occupational groups.
note: Percentages may not add to 100 percent because of rounding.

EmployEE profilE 2012 | 14
The following tables present information on the gender and ethnicity of CSU full-time faculty in fall 2012, as well as five years earlier. In fall 2012, over 29 percent of full-time CSU faculty were ethnic minorities and over 44 percent were female. (In fall 2007, over 27 percent of full-time CSU faculty were ethnic minorities and over 42 percent
were female.)
full-time faculty* by rank, Gender, and etHnicity (Headcount), fall 2012 and five years earlier Race/ Ethnicity/ % of White White Gender Grand fall 2012 Male Male Female Female Unknown Total Total
Professor 2,030 813 494 1,231 96 4,664 41.1
Associate Professor 896 458 415 826 91 2,686 23.7
Assistant Professor 545 354 382 590 133 2,004 17.7
Instructor 3 0 0 0 0 3 0.0
Tenure-Track Subtotal 3,474 1,625 1,291 2,647 320 9,357 82.5
Lecturer 631 175 234 873 78 1,991 17.5
All Full-Time 4,105 1,800 1,525 3,520 398 11,348 100*Excludes 21 full-time research fellows funded by external grants.
Race/ Ethnicity/ % of White White Gender Grand fall 2007 Male Male Female Female Unknown Total Total
Professor 2,151 763 367 1,167 55 4,503 37.3
Associate Professor 951 406 342 817 79 2,595 21.5
Assistant Professor 924 449 503 861 161 2,898 24.0
Instructor 4 1 0 2 0 7 0.1
Tenure-Track Subtotal 4,030 1,619 1,212 2,847 295 10,003 82.9
Lecturer 687 208 227 876 62 2,060 17.1
All Full-Time 4,717 1,827 1,439 3,723 357 12,063 100
Minorities
Minorities
GENDER AND ETHNICITY
EmployEE profilE 2012 | 15
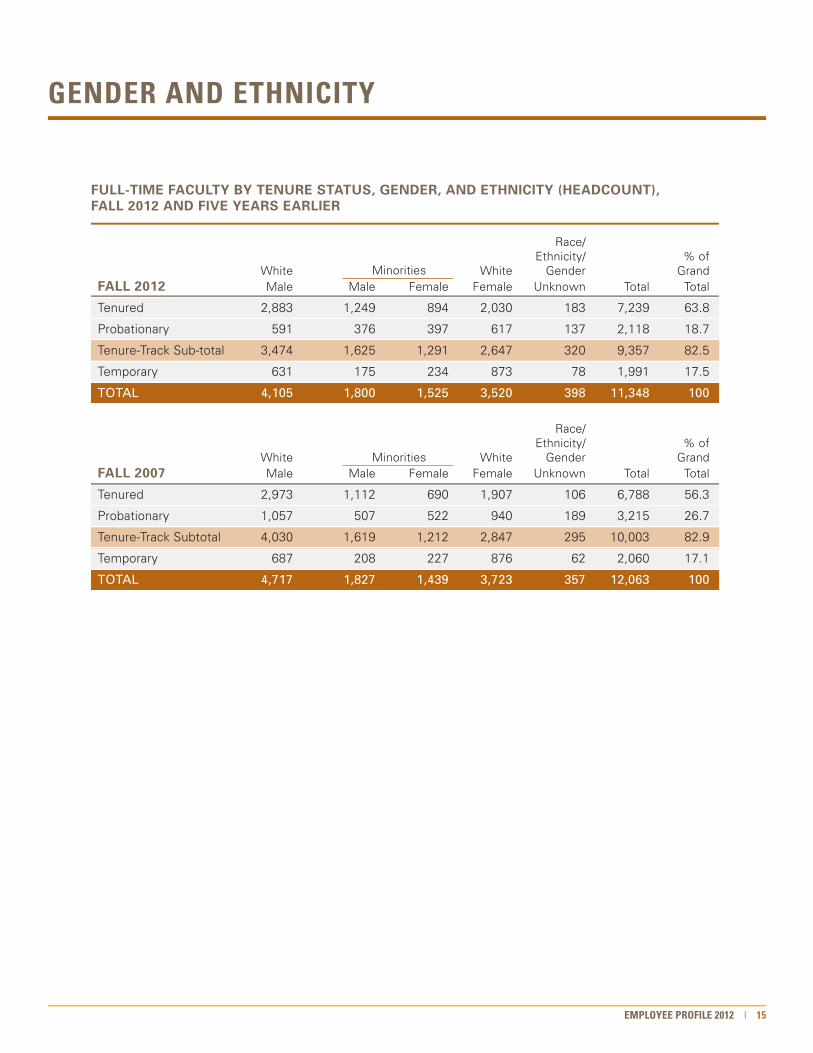
full-time faculty by tenure status, Gender, and etHnicity (Headcount), fall 2012 and five years earlier
Race/ Ethnicity/ % of White White Gender Grand fall 2012 Male Male Female Female Unknown Total Total
Tenured 2,883 1,249 894 2,030 183 7,239 63.8
Probationary 591 376 397 617 137 2,118 18.7
Tenure-Track Sub-total 3,474 1,625 1,291 2,647 320 9,357 82.5
Temporary 631 175 234 873 78 1,991 17.5
TOTAL 4,105 1,800 1,525 3,520 398 11,348 100
Race/ Ethnicity/ % of White White Gender Grand fall 2007 Male Male Female Female Unknown Total Total
Tenured 2,973 1,112 690 1,907 106 6,788 56.3
Probationary 1,057 507 522 940 189 3,215 26.7
Tenure-Track Subtotal 4,030 1,619 1,212 2,847 295 10,003 82.9
Temporary 687 208 227 876 62 2,060 17.1
TOTAL 4,717 1,827 1,439 3,723 357 12,063 100
Minorities
Minorities
GENDER AND ETHNICITY

EmployEE profilE 2012 | 16
Headcount of part-time faculty by Gender and etHnicity, fall 2012
Female 5,779 229 36 583 502 3,985 12 57 375
Male 5,108 193 28 519 478 3,488 12 21 369
Unknown 12 0 0 1 1 6 0 0 4
TOTAL 10,899 422 64 1,103 981 7,479 24 78 748
Total
Black or African
American
American Indian or
Alaska Native Asian Hispanic White
Native Hawaiian or
Other Pacific Islander
Two or More
Races
Race/Ethnicity
Unknown
GENDER AND ETHNICITY

EmployEE profilE 2012 | 17
The following tables present tenure status data for full-time faculty by academic rank and ethnicity.
Headcount of full-time faculty witH tenure, witH doctorate, by rank, fall 2012
Total Total % Total %
Professor 4,664 4,644 99.6 4,075 87.4
Associate Professor 2,686 2,512 93.5 2,295 85.4
Assistant Professor 2,004 82 4.1 1,665 83.1
Instructor 3 1 0.0 0 0.0
Tenure-Track Subtotal 9,357 7,239 77.4 8,035 85.9
Lecturer 1,991 0 0.0 520 26.1
ALL FuLL-Time 11,348 7,239 63.8% 8,555 75.4%
Headcount of full-time faculty by tenure status and etHnicity, fall 2012 and five years earlier
fall 2012
Tenured 7,239 280 42 1,132 634 4,913 12 43 183
Probationary 2,118 81 15 478 181 1,208 1 17 137
Temporary 1,991 62 10 146 163 1,504 5 23 78
TOTAL 11,348 423 67 1,756 978 7,625 18 83 398
fall 2007
Tenured 6,788 263 39 943 557 4,880 106
Probationary 3,215 134 23 594 278 1,997 189
Temporary 2,060 78 13 196 148 1,563 62
TOTAL 12,063 475 75 1,733 983 8,440 357
Total
Total
Asian
Asian
Hispanic
Hispanic
Race/Ethnicity
Unknown
Race/Ethnicity
Unknown
Black or African
American
Black or African
American
American Indian or
Alaska Native
American Indian or
Alaska Native
White
White
Native Hawaiian or
Other Pacific Islander
Two or More
Races
With Tenure With Doctorate
GENDER AND ETHNICITY

EmployEE profilE 2012 | 18
The CSU hired 382 new tenure track faculty in fall 2012. The majority of these faculty were offered appointments at the rank of Assistant Professor, but faculty were hired in all academic ranks. More information on new faculty hired by the CSU is available in the annual report on the CSU Faculty Recruitment Survey. This report contains detailed information on faculty recruitment, faculty demographics, and salaries offered to new faculty.
new full-time, tenure-track faculty by rank (Headcount), fall 2012 and five years earlier
fall 2012 Total Male Female Minorities
Professor 11 7 4 3
Associate Professor 17 7 10 4
Assistant Professor 354 171 183 115
Instructor 0 0 0 0
GRAND TOTAL 382 185 197 122
fall 2007 Total Male Female Minorities
Professor 35 20 15 9
Associate Professor 88 54 34 23
Assistant Professor 729 362 367 229
Instructor 0 0 0 0
GRAND TOTAL 852 436 416 261
Source: CSU Annual Reports on Faculty Recruitment Survey
NEW FACULTY

EmployEE profilE 2012 | 19
The following tables present data on the number of full-time faculty unit employees who were promoted to a higher academic rank effective fall 2011 and fall 2012 and the number of faculty who earned tenure effective fall 2012. These data include promotions and awards of tenure to instructional faculty as well as non-instructional members of the faculty bargaining unit (librarians and counselor faculty).
promotions amonG full-time faculty (Headcount), fall 2012 and prior year
Promotion To: Fall 2011 Fall 2012
Professor 361 377
Associate Professor 397 473
Assistant Professor 1 5
TOTAL 759 855
Unknown 10 8
Ranks include equivalent ranks for librarians and counselor faculty. Source: CIRS Compendium Report g01
number of faculty Granted tenure (Headcount), fall 2012*
TOTAL 528
Source: Data from custom report run using CIRS (Campus Information Retrieval System) data program prodpgm(pdc9520a/b)
*Includes those granted tenure between 7/1/12 and 12/31/12
PROMOTIONS AND TENURE

EmployEE profilE 2012 | 20
The tables below present information on tenured/tenure track and full-time temporary faculty who separated from CSU employment in 2011-2012 and in the prior year. In 2011-12, 58 percent of the separations were retirements.
separations amonG full-time faculty by cause and appointment status (Headcount), 2011-12 and 2010-11
Full-Time Headcount
2011-12 (2010-11) Number %* Number %* Number %* Number %* Number %*
Tenured 7,114 327 4.6 13 0.2 71 1.0 0 0.0 411 5.8
Probationary 2,348 16 0.7 0 0.0 105 4.5 11 0.5 132 5.6
Temporary 1,867 30 1.6 2 0.1 18 1.0 49 2.6 99 5.3
TOTAL 11,329 373 3.3 15 0.1 194 1.7 60 0.5 642 5.7
Full-Time Headcount
2010-11 (2009-10) Number %* Number %* Number %* Number %* Number %*
Tenured 6,992 298 4.3 22 0.3 58 0.8 2 0.0 380 5.4
Probationary 2,526 11 0.4 3 0.1 104 4.1 11 0.4 129 5.1
Temporary 1,709 48 2.8 1 0.1 17 1.0 47 2.8 113 6.6
TOTAL 11,227 357 3.2 26 0.2 179 1.6 60 0.5 622 5.5
*Separations as percent of full-time employees within each tenure status (tenured, probationary, temporary, or total faculty). Notes: Tables on faculty separations exclude all temporary faculty with part-time appointments. Retiring faculty who enter FERP are included, but FERP faculty who exited the program during the years reported are excluded. Reappointed lecturers are also excluded. Source: CIRS Compendium Report K19
Retirement
Retirement
Death
Death
Resignation
Resignation
Not Rehired
Not Rehired
Total Separations
Total Separations
SEPARATIONS

EmployEE profilE 2012 | 21
averaGe salaries* for full-time faculty by rank and appointment type (Headcount), fall 2012
Rank Headcount Average Salaries Headcount Average Salaries
Professor 4,220 $93,644 444 $116,111
Associate Professor 2,600 $75,482 86 $93,906
Assistant Professor 1,992 $68,129 12 $84,019
Instructor 3 $63,756 0 $0
Lecturer 1,856 $55,245 135 $75,421
ALL FuLL -Time FACuLTY 10,671 $77,769 677 $104,607
*Only includes base salaries; additional compensation earned through additional appointments, such as extra quarter assignments and summer sessions, are not included. Note: In the 2007 and prior editions of the Profile of CSU Employees, 12-month faculty salaries were adjusted using a conversion factor of 9/11 and then combined with academic year salaries to provide average salaries by rank on an academic year basis. Beginning in 2008, in an effort to provide more detailed information about salaries, the academic year and 12-month salaries are reported separately and without any adjustments.
Academic Year 12-Month
SALARY

EmployEE profilE 2012 | 22
Headcount of full-time faculty by rank and campus, fall 2012
Associate Assistant Tenure-Track All
Campus Professor Professor Professor Instructor Subtotal Lecturer Full-Time
Bakersfield 82 62 28 172 72 244
Channel Islands 34 36 13 83 69 152
Chico 234 107 76 417 64 481
Dominguez Hills 82 72 32 186 81 267
East Bay 116 98 62 276 29 305
Fresno 230 149 111 490 148 638
Fullerton 276 220 205 701 190 891
Humboldt 120 62 29 211 54 265
Long Beach 400 185 168 753 192 945
Los Angeles 277 118 92 487 73 560
Maritime Academy 22 4 16 3 45 11 56
Monterey Bay 53 31 32 116 54 170
Northridge 365 201 194 760 124 884
Pomona 254 106 98 458 66 524
Sacramento 298 184 91 573 98 671
San Bernardino 224 73 60 357 88 445
San Diego 345 238 99 682 131 813
San Francisco 307 219 169 695 99 794
San José 325 163 132 620 77 697
San Luis Obispo 281 182 145 608 126 734
San Marcos 97 68 57 222 67 289
Sonoma 126 54 42 222 27 249
Stanislaus 116 54 53 223 51 274
TOTAL 4,664 2,686 2,004 3 9,357 1,991 11,348
CAMPUS

EmployEE profilE 2012 | 23
This reference booklet contains fall 2012 snapshot information on employees at all 23 campuses and
the Chancellor’s Office. All tables and charts in the Employee Profile exclude student employees, other
intermittent or casual employees, and faculty teaching in extension, special sessions and summer sessions.
Employees are included regardless of the source of funds used to pay their salaries. due to significant changes to reporting requirements for ipeds (integrated postsecondary education data system), beginning in 2012, reporting groups have been realigned and cannot be compared directly to groups reported in prior employee profiles. employee reporting has been aligned with the 2010 standard occupational classifications published by the national bureau of labor standards. Data presented in
this report were obtained from the following sources:
1. ipEDS Database, oracle / peopleSoft - 2012 year data
construction / maintenance / transportation Consolidates two IPEDS reporting groups: 1. Natural Resources, Construction, and Maintenance Occupations; 2. Production, Transportation and Material Moving Occupations. Includes electricians, mechanics, carpenters, painters, agricultural workers, gardeners, equipment technicians, equipment operators, etc. Most employees in this group were previously reported in the Skilled Crafts group; of the remainder, most were previously reported in the Technical and Paraprofessional or Service/Maintenance groups.
faculty All regular instructional faculty, including department chairs and lecturers. Excludes librarians, coaches, and counselors. Also excludes extension or summer session faculty.
manaGement* Includes executives, vice presidents, directors, managers, deans and other management personnel with primary (and major) responsibility for management of the institution or recognized subdivision or department, etc. Employees in the Management group customarily and regularly direct the work of others and perform work directly related to management policies or general business operations (supervisors are no longer included in this group). All employees in the Management group are classified by the CSU as either Executives or members of the Management Personnel Plan. Employees in this group were previously reported in the Executive, Administrative and Managerial group.
office / administrative support Includes departmental secretaries; payroll, receiving and account clerks; administrative assistants and coordinators; accounting technicians, data entry operators, credential analysts and evaluators; property clerks; police dispatchers, etc. Most employees in this group were previously reported in the Clerical and Secretarial group; of the remainder, most were formerly reported in the Technical and Paraprofessional or Service/Maintenance groups.
professional / tecHnical occupations Consolidates six IPEDS reporting groups: 1. Community Service, Legal, Arts, and Media Occupations; 2. Business and Financial Operations Occupations; 3. Healthcare Practitioner and Technical Occupations; 4. Computer, Engineering, and Science Occupations; 5. Non-Postsecondary Teaching; 6. Librarians, curators, and archivists. Most employees in these six groups were previously reported either as Professional or Technical and Paraprofessional.
*Employees in CSU’s Management Personnel Plan (MPP) are assigned to IPEDS occupational groups based on their job responsibilities. Besides the Management group, MPP employees are distributed across several other occupational groups.
TECHNICAL NOTES AND GLOSSARY

EmployEE profilE 2012 | 24
service occupations Includes custodians, grounds workers, police officers, food service workers parking officers, etc. Most employees in this group were previously reported in the Service/Maintenance group; of the remainder, most were previously reported in the Other Professional or Technical and Paraprofessional groups.
2. Campus information retrieval System (CirS) - prior years data
clerical & secretarial Includes departmental secretaries; payroll, receiving and account clerks; etc.
executive, administrative, & manaGerial* Includes executives, vice presidents, directors, managers, deans, accounting supervisors, employment supervisors and any other management personnel with primary (and major) responsibility for management of the institution or recognized subdivision or department, etc. or any other supervisory personnel with responsibility for professional employees. Employees in the Executive, Administrative, and Managerial group customarily and regularly direct the work of others and perform work directly related to management policies or general business operations or supervise the work of professional employees and perform work similar to that of those they supervise. All employees in the Executive, Administrative & Managerial group are classified by the CSU as either Executives or members of the Management Personnel Plan.
faculty All regular instructional faculty, including department chairs and lecturers. Excludes librarians, coaches, and counselors (counted among “Other Professional”). Also excludes extension or summer session faculty.
otHer professional Includes employees whose jobs require a college education or comparable experience; excludes faculty and individuals meeting the IPEDS definition of Executive, Administrative, & Managerial employees.
service/ maintenance Includes custodians, gardeners, laborers, campus guards etc.
skilled crafts Includes electricians, mechanics, carpenters, etc.
tecHnical & paraprofessional Includes employees whose jobs require skills acquired in a junior college or equivalent on-the-job training, such as computer operators, instructional support, and equipment technicians.
3. CSU faculty recruitment Survey
new faculty Instructional faculty members appointed to tenure-track positions and scheduled to begin service during the 2012/13 academic year, as reported by campuses in the annual CSU Faculty Recruitment Survey. Includes all employees newly appointed to tenure-track positions at the reporting campus, including those who previously held tenure-track appointments elsewhere in the CSU or temporary appointments at the reporting campus or other CSU campuses. Does not include employees appointed as tenure-track librarians or counselors.
*Employees in CSU’s Management Personnel Plan (MPP) are assigned to IPEDS occupational groups based on their job responsibilities. Besides the Executive, Administrative & Managerial group, MPP employees are distributed across several other occupational groups (predominantly Other Professional).
TECHNICAL NOTES AND GLOSSARY

EmployEE profilE 2012 | 25
ferp faculty Refers to faculty employees who participate in the Faculty Early Retirement Program. fte positions Refers to the total “full-time equivalent positions” filled by all full-time and part-time employees. full time Individuals employed “100% time”; includes full time employees on leave with pay. lecturer Includes all instructional faculty with temporary appointments (non-tenure track). minority Includes employees who reported an ethnic/racial background other than “White.” Individuals who did not report an ethnic/racial background are counted in an “Race/Ethnicity/Gender Unknown” category. part-time Includes employees whose assignments at a given campus are less than “100% time.” Individuals employed simultaneously at two campuses are counted as two employees. probationary faculty Tenure-track faculty employees who have not been awarded tenure. Includes individuals serving a “terminal” year. race/etHnicity/Gender unknown Includes all employees who did not self-report a racial/ethnic background and/or gender. staff employees Refers to all employees who are not “faculty” as defined above. support Includes employees in the following categories: Clerical & Secretarial, Technical & Paraprofessional, Skilled Crafts, and Service/Maintenance. temporary faculty Members of the faculty bargaining unit with temporary appointments (non-tenure track). Include lecturers, temporary librarians, faculty coaches, and temporary faculty counselors. tenured faculty Tenure-track faculty employees who have been awarded tenure. total Data shown throughout this report exclude student employees, intermittent employees and extension and summer session faculty.
Questions about the data in the Employee Profile should be directed to [email protected].
TECHNICAL NOTES AND GLOSSARY