PROFICIENCY TESTING 2013 - FAVV-AFSCA · IBRgB and batch 2 for PT IBRgE) and LAB7 into LAB7.1...
37
PT2013IBRSER 1/37 This report can’t be reproduced, except in complete form, without the permission of the CODA-CERVA: CVD-ERA CODA-CERVA Veterinary and Agrochemical Research Centre Groeselenberg 99 – B 1180 Brussels (Ukkel) Tel: +32 (0)2 379 04 11 Fax : + 32 (0)2 379 06 70 http: // www.coda-cerva.be 172-PT PROFICIENCY TESTING 2013 INFECTIOUS BOVINE RHINOTRACHEITIS (IBR) Detection of IBRgB- and IBRgE-specific antibodies in serum by Enzyme Linked Immunosorbent Assay (ELISA) OPERATIONAL UNIT COORDINATION OF VETERINARY DIAGNOSIS EPIDEMIOLOGY AND RISK ASSESSMENT (CVD-ERA) DATE BEGIN PT: 10 JUNE 2013 DATE REPORT: 27 JANUARY 2014
Transcript of PROFICIENCY TESTING 2013 - FAVV-AFSCA · IBRgB and batch 2 for PT IBRgE) and LAB7 into LAB7.1...

PT2013IBRSER 1/37This report can’t be reproduced, except in complete form, without the permission of the CODA-CERVA: CVD-ERA
CODA-CERVAVeterinary and Agrochemical Research Centre
Groeselenberg 99 – B 1180 Brussels (Ukkel)
Tel: +32 (0)2 379 04 11
Fax : + 32 (0)2 379 06 70
http: // www.coda-cerva.be
172-PT
PROFICIENCY TESTING 2013
INFECTIOUS BOVINE RHINOTRACHEITIS (IBR)
Detection of IBRgB- and IBRgE-specific antibodies in serum by
Enzyme Linked Immunosorbent Assay (ELISA)
OPERATIONAL UNIT
COORDINATION OF VETERINARY DIAGNOSIS
EPIDEMIOLOGY AND RISK ASSESSMENT
(CVD-ERA)
DATE BEGIN PT: 10 JUNE 2013
DATE REPORT: 27 JANUARY 2014

CODA-CERVA
172-PT
PT2013IBRSER 2/37This report can’t be reproduced, except in complete form, without the permission of the CODA-CERVA: CVD-ERA
I. Introduction
Details relevant to the proficiency test (PT) are available in the Procedure PRO/2.5/01 ‘Beheer van de proficiency testenop het CODA-CERVA-Ukkel/Gestion des essais d’aptitude au CODA-CERVA-Uccle’, which is summarized in the ‘Manualfor the participant’.
II. Aim
The aim of this PT was to evaluate the ability of the participating laboratories to identify the absence or presence ofIBRgB- and/or IBRgE-specific antibodies in bovine serum by ELISA.
III. Materials and methods
III.1. Conduct of diagnostic tests
In the framework of this PT, predefined reference serum samples must be analyzed by means of an ELISA test. Theprocedures for the ELISA tests must be fully described in the SOPs of the participating laboratories.
III.2. Reference samples
III.2.1. IBRgB reference samples
Replicates of 6 reference serum samples of bovine origin, either free from detectable IBRgB-specific antibodies (n = 2;coded ‘PT2013IBRgBSERNS1’ and ‘PT2013IBRgBSERNS2’) or containing detectable IBRgB-specific antibodies (n = 4;coded ‘PT2013IBRgBSERPS1’, ‘PT2013IBRgBSERPS2’, ‘PT2013IBRgBSERPS3’ and ‘PT2013IBRgBSERPS4’), wereused. In total, 180 aliquots were distributed to 9 participating laboratories. All participants received 20 aliquots: 3 aliquotsof the reference serum samples PT2013IBRgBSERPS1, PT2013IBRgBSERPS2, PT2013IBRgBSERPS3 andPT2013IBRgBSERPS4, and 4 aliquots of the reference serum samples PT2013IBRgBSERNS1 andPT2013IBRgBSERNS2. The positions of the reference serum samples in the sent blocks were randomized for eachparticipant (Table 4).
For each reference serum sample, a certificate containing the status of the sample (= ‘golden standard’) was made. Thestatus of the reference serum samples was based on (i) the historical background of the animals and (ii) the resultsobtained during pre-verification using the HerdChek IBRgB antibody ELISA test from IDEXX, the indirect ELISA test fromLSI (LSIVET serum IBR screening) and a seroneutralisation assay (SN). The reference serum samplesPT2013IBRgBSERNS1 and PT2013IBRgBSERNS2 were obtained from 2 animals from a Belgian I4-certified farm (IBR-free without vaccination). The reference serum samples PT2013IBRgBSERPS1 and PT2013IBRgBSERPS2 wereobtained from 2 different vaccinated but uninfected animals. Hereby, the reference serum sample PT2013IBRgBSERPS1was a 1/128 dilution of the original serum. The reference serum samples PT2013IBRgBSERPS3 andPT2013IBRgBSERPS4 were a 1/4 and a 1/32 dilution, respectively, of 2 different sera from experimentally infected butnon-vaccinated animals. For each reference serum sample, the same qualitative result was obtained with all test methodsused. Taken together, the reference serum samples PT2013IBRgBSERNS1 and PT2013IBRgBSERNS2 were consideredas negative sera, and the reference serum samples PT2013IBRgBSERPS1, PT2013IBRgBSERPS2,PT2013IBRgBSERPS3 and PT2013IBRgBSERPS4 as strong positive sera in IBRgB ELISA (but rather weak positive inSN).
After aliquoting the different reference serum samples, a homogeneity check was performed on 10 aliquots of eachreference serum sample using the HerdChek IBRgB antibody ELISA test from IDEXX, hereby obtaining the samequalitative result for all 10 aliquots of the same reference serum sample. Consequently, all reference serum samples wereconsidered as reliable samples in order to evaluate the ability of laboratories to correctly identify the absence or presenceof IBRgB-specific antibodies in bovine serum. In addition, 3 aliquots of each reference serum sample were tested after thePT in order to confirm their stability and status (post-verification) using the HerdChek IBRgB antibody ELISA test fromIDEXX.
Remark: For the PT IBRgB, an additional panel consisting of 12 serum samples with variable qualitative results in ELISAbut negative in SN, the reference test (golden standard) for the detection of IBRgB-specific antibodies in serum, was sent

CODA-CERVA
172-PT
PT2013IBRSER 3/37This report can’t be reproduced, except in complete form, without the permission of the CODA-CERVA: CVD-ERA
to the 9 participating laboratories along with the regular IBRgB PT samples. Since this was out of scope of this PTaccording to ISO 17043, a description of these additional serum samples as well as the qualitative and quantitative dataanalysis is summarized in Annex 3.
III.2.2. IBRgE reference samples
Replicates of 6 reference serum samples of bovine origin, either free from detectable IBRgE-specific antibodies (n = 3;coded ‘PT2013IBRgESERNS1’, ‘PT2013IBRgESERNS2’ and ‘PT2013IBRgESERNS3’) or containing detectable IBRgE-specific antibodies (n=3, coded ‘PT2013IBRgESERPS1’, ‘PT2013IBRgESERPS2’ and ‘PT2013IBRgESERPS3’), wereused. In total, 180 aliquots were distributed to 9 different participating laboratories. All participants received 20 aliquots: 3aliquots of the reference serum samples PT2013IBRgESERNS1, PT2013IBRgESERNS2, PT2013IBRgESERNS3 andPT2013IBRgESERPS3, and 4 aliquots of the reference serum samples PT2013IBRgESERPS1 andPT2013IBRgESERPS2. The positions of the reference serum samples in the sent blocks were randomized for eachparticipant (Table 5).
For each reference serum sample, a certificate containing the status of the sample (= ‘golden standard’) was made. Thestatus of the reference serum samples was based on (i) the historical background of the animals and (ii) the resultsobtained during pre-verification using the HerdChek IBRgE antibody ELISA test from IDEXX. The reference serumsample PT2013IBRgESERNS1 (=PT2013IBRgBSERNS1) was from an animal from a Belgian I4-certified farm (IBR-freewithout vaccination), whereas the reference serum samples PT2013IBRgESERNS2 and PT2013IBRgESERNS3(=PT2013IBRgBSERPS2) were from vaccinated but uninfected animals. The reference serum samplesPT2013IBRgESERPS1 (=PT2013IBRgBSERPS3), PT2013IBRgESERPS2 and PT2013IBRgESERPS3(=PT2013IBRgBSERPS4) were derived from 2 different experimentally infected but non-vaccinated animals. Hereby, thereference serum sample PT2013IBRgESERPS1 was a 1/4 dilution of a serum collected from one animal, whereas thereference serum samples PT2013IBRgESERPS2 and PT2013IBRgESERPS3 were a 1/16 and a 1/32 dilution,respectively, of a serum obtained from another animal. Taken together, the reference serum samplesPT2013IBRgESERNS1, PT2013IBRgESERNS2 and PT2013IBRgESERNS3 were considered as negative sera, thereference serum sample PT2013IBRgESERPS1 as a strong positive serum, and the reference serum samplesPT2013IBRgESERPS2 and PT2013IBRgESERPS3 as (weak) positive sera in IBRgE ELISA.
After aliquoting the different reference serum samples, a homogeneity check was performed on 10 aliquots of eachreference serum sample using the HerdChek IBRgE antibody ELISA test from IDEXX, hereby obtaining the samequalitative result for all 10 aliquots of the same reference serum sample. Consequently, all reference serum samples wereconsidered as reliable samples in order to evaluate the ability of laboratories to correctly identify the absence or presenceof IBRgE-specific antibodies in bovine serum. In addition, 3 aliquots of each reference serum sample were tested after thePT in order to confirm their stability and status (post-verification) using the HerdChek IBRgE antibody ELISA test fromIDEXX.
III.3. Classification of results, level of agreement and threshold for qualification
III.3.1. Classification of results
Results provided by the participating laboratories are categorized as success when the reported result matches with theassigned status or failure when the reported result does not match with the assigned status.
III.3.2. Level of agreement
The level of agreement achieved by the participating laboratories is expressed as the percentage of success for the 20aliquots of reference samples used for either the PT IBRgB or the PT IBRgE.
III.3.3. Threshold for qualification
Following the procedure, a participating laboratory is only qualified if the level of agreement for the 20 aliquots of referencesamples is at least 95% for the PT IBRgB and 90% for the PT IBRgE.

CODA-CERVA
172-PT
PT2013IBRSER 4/37This report can’t be reproduced, except in complete form, without the permission of the CODA-CERVA: CVD-ERA
IV. Results
For confidentiality reasons, the participating laboratories are quoted anonymously and the concordance table is safely keptat the operational unit CVD-ERA of CODA-CERVA.
IV.1. Transfer and start of the analyses of the reference samples
LAB1 until LAB8 participated in both the PT IBRgB and the PT IBRgE and hence received 40 aliquots of reference serumsamples (20 for the PT IBRgB and 20 for the PT IBRgE). LAB9 only participated in the PT IBRgB, whereas LAB10 onlyparticipated in the PT IBRgE. LAB9 and LAB10 hence received 20 aliquots of reference serum samples. The referenceserum samples were sent frozen (dry ice) to each of the participating laboratories by national or international courier on10th of June 2013. LAB1, LAB2, LAB3 and LAB4 acknowledged receipt of the samples on the same day, whereas theother laboratories received the samples on 11th (LAB6, LAB8 and LAB9) or 12th (LAB5, LAB7 and LAB10) of June 2013.All participating laboratories confirmed that the reference serum samples were still frozen upon receipt. Analyses wereperformed between 11th and 28th of June 2013 (Table 1).
IV.2. Dates at which results were returned to the operational unit CVD-ERA
Results from the participating laboratories were submitted to the operational unit CVD-ERA between 18th and 28th of June2013 (Table 1). All participants hereby respected the deadline of 28th of June 2013.
Table 1. Overview of the dates on which (i) the reference serum samples were received and analyzed by the participating laboratories,and (ii) the obtained results were submitted to the operational unit CVD-ERA of CODA-CERVA.
Laboratory Reference samplesreceived
Start of analysisgB
Start of analysisgE
Submission of theresults (Excel file)
LAB1 10/06/2013 11/06/2013 14/06/2013 20/06/2013
LAB2 10/06/2013 12/06/2013 12/06/2013 25/06/2013
LAB3 10/06/2013 14 & 18/06/2013 (#) 12/06/2013 21/06/2013
LAB4 10/06/2013 10 & 13/06/2013 (#) 12/06/2013 18/06/2013
LAB5 12/06/2013 14 & 21/06/2013 (#) 14/06/2013 (°) 25/06/2013
LAB6 11/06/2013 25/06/2013 24/06/2013 28/06/2013
LAB7 12/06/2013 28/06/2013 19 & 26/06/2013 (°) 28/06/2013
LAB8 11/06/2013 14/06/2013 19/06/2013 20/06/2013
LAB9 11/06/2013 20/06/2013 NA 25/06/2013
LAB10 12/06/2013 NA 25/06/2013 28/06/2013
Legend: NA = not applicable; (#) = this laboratory tested ELISA kits from 2 different producers; (°) = thislaboratory tested different batches of the same ELISA kit
IV.3. Compliance with the procedure
All participating laboratories have provided a duly dated and signed copy of the results.
IV.4. Qualitative data analysis
LAB3, LAB4, LAB5 and LAB7 submitted 2 sets of results for the PT IBRgB and/or the PT IBRgE since they analysed the20 aliquots of reference serum samples using ELISA kits from different producers and/or different batches of the sameELISA kit. In order to analyse the provided data, these 4 laboratories have been divided into different sublaboratories,namely: LAB3 into LAB3.1 (kit 1 for PT IBRgB) and LAB3.2 (kit 2 for PT IBRgB), LAB4 into LAB4.1 (kit 1 for PT IBRgB)and LAB4.2 (kit 2 for PT IBRgB), LAB5 into LAB5.1 (kit 1 for PT IBRgB and batch1 for PT IBRgE) and LAB5.2 (kit 2 for PTIBRgB and batch 2 for PT IBRgE) and LAB7 into LAB7.1 (batch 1 for PT IBRgE) and LAB7.2 (batch 2 for PT IBRgE).

CODA-CERVA
172-PT
PT2013IBRSER 5/37This report can’t be reproduced, except in complete form, without the permission of the CODA-CERVA: CVD-ERA
IV.4.1. Level of agreement
Qualitative data analysis showed that:
(i) For the detection of IBRgB-specific antibodies, 7 out of 9 participating laboratories (LAB1, LAB2, LAB3, LAB4,LAB5, LAB6 and LAB8) provided qualitative results that were in full agreement with the assigned status of thereference serum samples (100% of agreement). Hereby, LAB3, LAB4 and LAB5 used each 2 ELISA kits fromdifferent producers. In contrast, LAB7 misclassified 3 aliquots (85% of agreement) and LAB9 misclassified 2aliquots (90% of agreement) of reference serum samples (Table 2).
(ii) For the detection of IBRgE-specific antibodies, all 9 participating laboratories provided qualitative results thatwere in full agreement with the assigned status of the reference serum samples (100% of agreement). Hereby,LAB5 and LAB7 used 2 different batches of the same ELISA kit (Table 3).
Table 2. Agreement between the results obtained by the participating laboratories (LABNR) and the status of the IBRgB referenceserum samples assigned by CODA-CERVA. All participating laboratories received 20 aliquots of IBRgB reference serum samples.Results are presented as absolute values and percentages (in parentheses).
LABNR
1 2 3.1 3.2 4.1 4.2 5.1 5.2 6
Failure 0 ( 0.0) 0 ( 0.0) 0 ( 0.0) 0 ( 0.0) 0 ( 0.0) 0 ( 0.0) 0 ( 0.0) 0 ( 0.0) 0 ( 0.0)
Success 20 (100.0) 20 (100.0) 20 (100.0) 20 (100.0) 20 (100.0) 20 (100.0) 20 (100.0) 20 (100.0) 20 (100.0)
LABNR
7 8 9
Failure 3 ( 15.0) 0 ( 0.0) 2 (10.0)
Success 17 (85.0) 20 (100.0) 18 (90.0)
Table 3. Agreement between the results obtained by the participating laboratories (LABNR) and the status of the IBRgE referenceserum samples assigned by CODA-CERVA. All participating laboratories received 20 aliquots of IBRgE reference serum samples.Results are presented as absolute values and percentages (in parentheses).
LABNR
1 2 3 4 5.1 5.2 6 7.1 7.2
Failure 0 ( 0.0) 0 ( 0.0) 0 ( 0.0) 0 ( 0.0) 0 ( 0.0) 0 ( 0.0) 0 ( 0.0) 0 ( 0.0) 0 ( 0.0)
Success 20 (100.0) 20 (100.0) 20 (100.0) 20 (100.0) 20 (100.0) 20 (100.0) 20 (100.0) 20 (100.0) 20 (100.0)
LABNR
8 10
Failure 0 ( 0.0) 0 ( 0.0)
Success 20 (100.0) 20 (100.0)
A quantitative data analysis (including box plots) is shown for educational purposes in Annex 1 and Annex 2.
IV.4.2. Variability among participating laboratories
Only a small variability between laboratories could be observed at the qualitative data level:
(i) For the detection of IBRgB-specific antibodies, no variability between LAB1, LAB2, LAB3, LAB4, LAB5, LAB6and LAB8 could be observed since these participants correctly identified all reference serum samples. Hereby,LAB3, LAB4 and LAB5 obtained identical qualitative results using 2 ELISA kits from different producers. Incontrast, LAB7 misclassified all 3 aliquots of the reference serum sample PT2013IBRgBSERPS1 (3x NI instead

CODA-CERVA
172-PT
PT2013IBRSER 6/37This report can’t be reproduced, except in complete form, without the permission of the CODA-CERVA: CVD-ERA
of POS), whereas LAB9 misclassified 2 out of 3 aliquots of the reference serum sample PT2013IBRgBSERPS2(1x NI and 1x NEG instead of POS).
(ii) For the detection of IBRgE-specific antibodies, no variability between laboratories could be observed since allparticipants correctly identified all reference serum samples. Hereby, LAB5 and LAB7 analysed the referenceserum samples using 2 different batches of the same ELISA kit.
For each participating laboratory, the obtained results and the assigned statuses for the reference serum samples areshown in Table 4 for the PT IBRgB and in Table 5 for the PT IBRgE.

CODA-CERVA
172-PT
PT2013IBRSER 7/37This report can’t be reproduced, except in complete form, without the permission of the CODA-CERVA: CVD-ERA
Table 4. The responses (RESULT) of the participating laboratories (LABNR) with the identification of the IBRgB reference serumsamples (SAMPLE), the positions of the IBRgB reference serum samples as placed in the block (LABPOSIT), and the status assignedby CODA-CERVA (STATUS). NEG: negative; POS: positive; NI: non-interpretable.
LABNR LABPOSIT SAMPLE STATUS RESULT SUCCESS
1 1 1 PT2013IBRgBSERNS1 NEG NEG 12 1 2 PT2013IBRgBSERPS1 POS POS 13 1 3 PT2013IBRgBSERNS1 NEG NEG 14 1 4 PT2013IBRgBSERPS2 POS POS 15 1 5 PT2013IBRgBSERNS1 NEG NEG 16 1 6 PT2013IBRgBSERPS2 POS POS 17 1 7 PT2013IBRgBSERNS1 NEG NEG 18 1 8 PT2013IBRgBSERPS2 POS POS 19 1 9 PT2013IBRgBSERNS2 NEG NEG 1
10 1 10 PT2013IBRgBSERPS3 POS POS 111 1 11 PT2013IBRgBSERNS2 NEG NEG 112 1 12 PT2013IBRgBSERPS3 POS POS 113 1 13 PT2013IBRgBSERNS2 NEG NEG 114 1 14 PT2013IBRgBSERPS3 POS POS 115 1 15 PT2013IBRgBSERNS2 NEG NEG 116 1 16 PT2013IBRgBSERPS4 POS POS 117 1 17 PT2013IBRgBSERPS1 POS POS 118 1 18 PT2013IBRgBSERPS4 POS POS 119 1 19 PT2013IBRgBSERPS1 POS POS 120 1 20 PT2013IBRgBSERPS4 POS POS 121 2 1 PT2013IBRgBSERPS4 POS POS 122 2 2 PT2013IBRgBSERNS1 NEG NEG 123 2 3 PT2013IBRgBSERPS1 POS POS 124 2 4 PT2013IBRgBSERNS1 NEG NEG 125 2 5 PT2013IBRgBSERPS2 POS POS 126 2 6 PT2013IBRgBSERNS1 NEG NEG 127 2 7 PT2013IBRgBSERPS2 POS POS 128 2 8 PT2013IBRgBSERNS1 NEG NEG 129 2 9 PT2013IBRgBSERPS2 POS POS 130 2 10 PT2013IBRgBSERNS2 NEG NEG 131 2 11 PT2013IBRgBSERPS3 POS POS 132 2 12 PT2013IBRgBSERNS2 NEG NEG 133 2 13 PT2013IBRgBSERPS3 POS POS 134 2 14 PT2013IBRgBSERNS2 NEG NEG 135 2 15 PT2013IBRgBSERPS3 POS POS 136 2 16 PT2013IBRgBSERNS2 NEG NEG 137 2 17 PT2013IBRgBSERPS4 POS POS 138 2 18 PT2013IBRgBSERPS1 POS POS 139 2 19 PT2013IBRgBSERPS4 POS POS 140 2 20 PT2013IBRgBSERPS1 POS POS 1

CODA-CERVA
172-PT
PT2013IBRSER 8/37This report can’t be reproduced, except in complete form, without the permission of the CODA-CERVA: CVD-ERA
Table 4. (CONTINUED)
LABNR LABPOSIT SAMPLE STATUS RESULT SUCCESS
41 3.1 1 PT2013IBRgBSERPS1 POS POS 142 3.1 2 PT2013IBRgBSERPS4 POS POS 143 3.1 3 PT2013IBRgBSERNS1 NEG NEG 144 3.1 4 PT2013IBRgBSERPS1 POS POS 145 3.1 5 PT2013IBRgBSERNS1 NEG NEG 146 3.1 6 PT2013IBRgBSERPS2 POS POS 147 3.1 7 PT2013IBRgBSERNS1 NEG NEG 148 3.1 8 PT2013IBRgBSERPS2 POS POS 149 3.1 9 PT2013IBRgBSERNS1 NEG NEG 150 3.1 10 PT2013IBRgBSERPS2 POS POS 151 3.1 11 PT2013IBRgBSERNS2 NEG NEG 152 3.1 12 PT2013IBRgBSERPS3 POS POS 153 3.1 13 PT2013IBRgBSERNS2 NEG NEG 154 3.1 14 PT2013IBRgBSERPS3 POS POS 155 3.1 15 PT2013IBRgBSERNS2 NEG NEG 156 3.1 16 PT2013IBRgBSERPS3 POS POS 157 3.1 17 PT2013IBRgBSERNS2 NEG NEG 158 3.1 18 PT2013IBRgBSERPS4 POS POS 159 3.1 19 PT2013IBRgBSERPS1 POS POS 160 3.1 20 PT2013IBRgBSERPS4 POS POS 161 3.2 1 PT2013IBRgBSERPS1 POS POS 162 3.2 2 PT2013IBRgBSERPS4 POS POS 163 3.2 3 PT2013IBRgBSERNS1 NEG NEG 164 3.2 4 PT2013IBRgBSERPS1 POS POS 165 3.2 5 PT2013IBRgBSERNS1 NEG NEG 166 3.2 6 PT2013IBRgBSERPS2 POS POS 167 3.2 7 PT2013IBRgBSERNS1 NEG NEG 168 3.2 8 PT2013IBRgBSERPS2 POS POS 169 3.2 9 PT2013IBRgBSERNS1 NEG NEG 170 3.2 10 PT2013IBRgBSERPS2 POS POS 171 3.2 11 PT2013IBRgBSERNS2 NEG NEG 172 3.2 12 PT2013IBRgBSERPS3 POS POS 173 3.2 13 PT2013IBRgBSERNS2 NEG NEG 174 3.2 14 PT2013IBRgBSERPS3 POS POS 175 3.2 15 PT2013IBRgBSERNS2 NEG NEG 176 3.2 16 PT2013IBRgBSERPS3 POS POS 177 3.2 17 PT2013IBRgBSERNS2 NEG NEG 178 3.2 18 PT2013IBRgBSERPS4 POS POS 179 3.2 19 PT2013IBRgBSERPS1 POS POS 180 3.2 20 PT2013IBRgBSERPS4 POS POS 1

CODA-CERVA
172-PT
PT2013IBRSER 9/37This report can’t be reproduced, except in complete form, without the permission of the CODA-CERVA: CVD-ERA
Table 4. (CONTINUED)
LABNR LABPOSIT SAMPLE STATUS RESULT SUCCESS
81 4.1 1 PT2013IBRgBSERPS4 POS POS 182 4.1 2 PT2013IBRgBSERPS1 POS POS 183 4.1 3 PT2013IBRgBSERPS4 POS POS 184 4.1 4 PT2013IBRgBSERNS1 NEG NEG 185 4.1 5 PT2013IBRgBSERPS1 POS POS 186 4.1 6 PT2013IBRgBSERNS1 NEG NEG 187 4.1 7 PT2013IBRgBSERPS2 POS POS 188 4.1 8 PT2013IBRgBSERNS1 NEG NEG 189 4.1 9 PT2013IBRgBSERPS2 POS POS 190 4.1 10 PT2013IBRgBSERNS1 NEG NEG 191 4.1 11 PT2013IBRgBSERPS2 POS POS 192 4.1 12 PT2013IBRgBSERNS2 NEG NEG 193 4.1 13 PT2013IBRgBSERPS3 POS POS 194 4.1 14 PT2013IBRgBSERNS2 NEG NEG 195 4.1 15 PT2013IBRgBSERPS3 POS POS 196 4.1 16 PT2013IBRgBSERNS2 NEG NEG 197 4.1 17 PT2013IBRgBSERPS3 POS POS 198 4.1 18 PT2013IBRgBSERNS2 NEG NEG 199 4.1 19 PT2013IBRgBSERPS4 POS POS 1
100 4.1 20 PT2013IBRgBSERPS1 POS POS 1101 4.2 1 PT2013IBRgBSERPS4 POS POS 1102 4.2 2 PT2013IBRgBSERPS1 POS POS 1103 4.2 3 PT2013IBRgBSERPS4 POS POS 1104 4.2 4 PT2013IBRgBSERNS1 NEG NEG 1105 4.2 5 PT2013IBRgBSERPS1 POS POS 1106 4.2 6 PT2013IBRgBSERNS1 NEG NEG 1107 4.2 7 PT2013IBRgBSERPS2 POS POS 1108 4.2 8 PT2013IBRgBSERNS1 NEG NEG 1109 4.2 9 PT2013IBRgBSERPS2 POS POS 1110 4.2 10 PT2013IBRgBSERNS1 NEG NEG 1111 4.2 11 PT2013IBRgBSERPS2 POS POS 1112 4.2 12 PT2013IBRgBSERNS2 NEG NEG 1113 4.2 13 PT2013IBRgBSERPS3 POS POS 1114 4.2 14 PT2013IBRgBSERNS2 NEG NEG 1115 4.2 15 PT2013IBRgBSERPS3 POS POS 1116 4.2 16 PT2013IBRgBSERNS2 NEG NEG 1117 4.2 17 PT2013IBRgBSERPS3 POS POS 1118 4.2 18 PT2013IBRgBSERNS2 NEG NEG 1119 4.2 19 PT2013IBRgBSERPS4 POS POS 1120 4.2 20 PT2013IBRgBSERPS1 POS POS 1

CODA-CERVA
172-PT
PT2013IBRSER 10/37This report can’t be reproduced, except in complete form, without the permission of the CODA-CERVA: CVD-ERA
Table 4. (CONTINUED)
LABNR LABPOSIT SAMPLE STATUS RESULT SUCCESS
121 5.1 1 PT2013IBRgBSERPS1 POS POS 1122 5.1 2 PT2013IBRgBSERPS4 POS POS 1123 5.1 3 PT2013IBRgBSERPS1 POS POS 1124 5.1 4 PT2013IBRgBSERPS4 POS POS 1125 5.1 5 PT2013IBRgBSERNS1 NEG NEG 1126 5.1 6 PT2013IBRgBSERPS1 POS POS 1127 5.1 7 PT2013IBRgBSERNS1 NEG NEG 1128 5.1 8 PT2013IBRgBSERPS2 POS POS 1129 5.1 9 PT2013IBRgBSERNS1 NEG NEG 1130 5.1 10 PT2013IBRgBSERPS2 POS POS 1131 5.1 11 PT2013IBRgBSERNS1 NEG NEG 1132 5.1 12 PT2013IBRgBSERPS2 POS POS 1133 5.1 13 PT2013IBRgBSERNS2 NEG NEG 1134 5.1 14 PT2013IBRgBSERPS3 POS POS 1135 5.1 15 PT2013IBRgBSERNS2 NEG NEG 1136 5.1 16 PT2013IBRgBSERPS3 POS POS 1137 5.1 17 PT2013IBRgBSERNS2 NEG NEG 1138 5.1 18 PT2013IBRgBSERPS3 POS POS 1139 5.1 19 PT2013IBRgBSERNS2 NEG NEG 1140 5.1 20 PT2013IBRgBSERPS4 POS POS 1141 5.2 1 PT2013IBRgBSERPS1 POS POS 1142 5.2 2 PT2013IBRgBSERPS4 POS POS 1143 5.2 3 PT2013IBRgBSERPS1 POS POS 1144 5.2 4 PT2013IBRgBSERPS4 POS POS 1145 5.2 5 PT2013IBRgBSERNS1 NEG NEG 1146 5.2 6 PT2013IBRgBSERPS1 POS POS 1147 5.2 7 PT2013IBRgBSERNS1 NEG NEG 1148 5.2 8 PT2013IBRgBSERPS2 POS POS 1149 5.2 9 PT2013IBRgBSERNS1 NEG NEG 1150 5.2 10 PT2013IBRgBSERPS2 POS POS 1151 5.2 11 PT2013IBRgBSERNS1 NEG NEG 1152 5.2 12 PT2013IBRgBSERPS2 POS POS 1153 5.2 13 PT2013IBRgBSERNS2 NEG NEG 1154 5.2 14 PT2013IBRgBSERPS3 POS POS 1155 5.2 15 PT2013IBRgBSERNS2 NEG NEG 1156 5.2 16 PT2013IBRgBSERPS3 POS POS 1157 5.2 17 PT2013IBRgBSERNS2 NEG NEG 1158 5.2 18 PT2013IBRgBSERPS3 POS POS 1159 5.2 19 PT2013IBRgBSERNS2 NEG NEG 1160 5.2 20 PT2013IBRgBSERPS4 POS POS 1

CODA-CERVA
172-PT
PT2013IBRSER 11/37This report can’t be reproduced, except in complete form, without the permission of the CODA-CERVA: CVD-ERA
Table 4. (CONTINUED)
LABNR LABPOSIT SAMPLE STATUS RESULT SUCCESS
161 6 1 PT2013IBRgBSERPS4 POS POS 1162 6 2 PT2013IBRgBSERPS1 POS POS 1163 6 3 PT2013IBRgBSERPS4 POS POS 1164 6 4 PT2013IBRgBSERPS1 POS POS 1165 6 5 PT2013IBRgBSERPS4 POS POS 1166 6 6 PT2013IBRgBSERNS1 NEG NEG 1167 6 7 PT2013IBRgBSERPS1 POS POS 1168 6 8 PT2013IBRgBSERNS1 NEG NEG 1169 6 9 PT2013IBRgBSERPS2 POS POS 1170 6 10 PT2013IBRgBSERNS1 NEG NEG 1171 6 11 PT2013IBRgBSERPS2 POS POS 1172 6 12 PT2013IBRgBSERNS1 NEG NEG 1173 6 13 PT2013IBRgBSERPS2 POS POS 1174 6 14 PT2013IBRgBSERNS2 NEG NEG 1175 6 15 PT2013IBRgBSERPS3 POS POS 1176 6 16 PT2013IBRgBSERNS2 NEG NEG 1177 6 17 PT2013IBRgBSERPS3 POS POS 1178 6 18 PT2013IBRgBSERNS2 NEG NEG 1179 6 19 PT2013IBRgBSERPS3 POS POS 1180 6 20 PT2013IBRgBSERNS2 NEG NEG 1181 7 1 PT2013IBRgBSERNS2 NEG NEG 1182 7 2 PT2013IBRgBSERPS4 POS POS 1183 7 3 PT2013IBRgBSERPS1 POS NI 0184 7 4 PT2013IBRgBSERPS4 POS POS 1185 7 5 PT2013IBRgBSERPS1 POS NI 0186 7 6 PT2013IBRgBSERPS4 POS POS 1187 7 7 PT2013IBRgBSERNS1 NEG NEG 1188 7 8 PT2013IBRgBSERPS1 POS NI 0189 7 9 PT2013IBRgBSERNS1 NEG NEG 1190 7 10 PT2013IBRgBSERPS2 POS POS 1191 7 11 PT2013IBRgBSERNS1 NEG NEG 1192 7 12 PT2013IBRgBSERPS2 POS POS 1193 7 13 PT2013IBRgBSERNS1 NEG NEG 1194 7 14 PT2013IBRgBSERPS2 POS POS 1195 7 15 PT2013IBRgBSERNS2 NEG NEG 1196 7 16 PT2013IBRgBSERPS3 POS POS 1197 7 17 PT2013IBRgBSERNS2 NEG NEG 1198 7 18 PT2013IBRgBSERPS3 POS POS 1199 7 19 PT2013IBRgBSERNS2 NEG NEG 1200 7 20 PT2013IBRgBSERPS3 POS POS 1

CODA-CERVA
172-PT
PT2013IBRSER 12/37This report can’t be reproduced, except in complete form, without the permission of the CODA-CERVA: CVD-ERA
Table 4. (CONTINUED)
LABNR LABPOSIT SAMPLE STATUS RESULT SUCCESS
201 8 1 PT2013IBRgBSERPS3 POS POS 1202 8 2 PT2013IBRgBSERNS2 NEG NEG 1203 8 3 PT2013IBRgBSERPS4 POS POS 1204 8 4 PT2013IBRgBSERPS1 POS POS 1205 8 5 PT2013IBRgBSERPS4 POS POS 1206 8 6 PT2013IBRgBSERPS1 POS POS 1207 8 7 PT2013IBRgBSERPS4 POS POS 1208 8 8 PT2013IBRgBSERNS1 NEG NEG 1209 8 9 PT2013IBRgBSERPS1 POS POS 1210 8 10 PT2013IBRgBSERNS1 NEG NEG 1211 8 11 PT2013IBRgBSERPS2 POS POS 1212 8 12 PT2013IBRgBSERNS1 NEG NEG 1213 8 13 PT2013IBRgBSERPS2 POS POS 1214 8 14 PT2013IBRgBSERNS1 NEG NEG 1215 8 15 PT2013IBRgBSERPS2 POS POS 1216 8 16 PT2013IBRgBSERNS2 NEG NEG 1217 8 17 PT2013IBRgBSERPS3 POS POS 1218 8 18 PT2013IBRgBSERNS2 NEG NEG 1219 8 19 PT2013IBRgBSERPS3 POS POS 1220 8 20 PT2013IBRgBSERNS2 NEG NEG 1221 9 1 PT2013IBRgBSERNS2 NEG NEG 1222 9 2 PT2013IBRgBSERPS3 POS POS 1223 9 3 PT2013IBRgBSERNS2 NEG NEG 1224 9 4 PT2013IBRgBSERPS4 POS POS 1225 9 5 PT2013IBRgBSERPS1 POS POS 1226 9 6 PT2013IBRgBSERPS4 POS POS 1227 9 7 PT2013IBRgBSERPS1 POS POS 1228 9 8 PT2013IBRgBSERPS4 POS POS 1229 9 9 PT2013IBRgBSERNS1 NEG NEG 1230 9 10 PT2013IBRgBSERPS1 POS POS 1231 9 11 PT2013IBRgBSERNS1 NEG NEG 1232 9 12 PT2013IBRgBSERPS2 POS POS 1233 9 13 PT2013IBRgBSERNS1 NEG NEG 1234 9 14 PT2013IBRgBSERPS2 POS NI 0235 9 15 PT2013IBRgBSERNS1 NEG NEG 1236 9 16 PT2013IBRgBSERPS2 POS NEG 0237 9 17 PT2013IBRgBSERNS2 NEG NEG 1238 9 18 PT2013IBRgBSERPS3 POS POS 1239 9 19 PT2013IBRgBSERNS2 NEG NEG 1240 9 20 PT2013IBRgBSERPS3 POS POS 1

CODA-CERVA
172-PT
PT2013IBRSER 13/37This report can’t be reproduced, except in complete form, without the permission of the CODA-CERVA: CVD-ERA
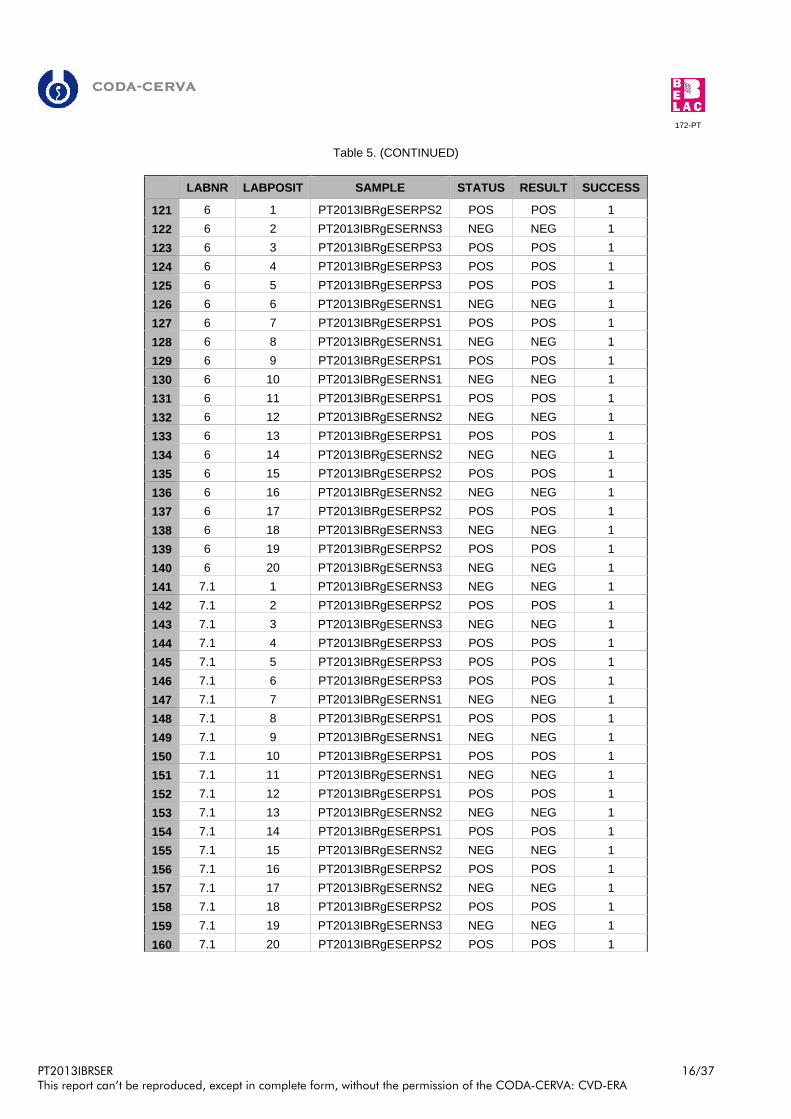
Table 5. The responses (RESULT) of the participating laboratories (LABNR) with the identification of the IBRgE reference serumsamples (SAMPLE), the positions of the IBRgE reference serum samples as placed in the block (LABPOSIT), and the status assignedby CODA-CERVA (STATUS). NEG: negative; POS: positive.
LABNR LABPOSIT SAMPLE STATUS RESULT SUCCESS
1 1 1 PT2013IBRgESERNS1 NEG NEG 12 1 2 PT2013IBRgESERPS1 POS POS 13 1 3 PT2013IBRgESERNS1 NEG NEG 14 1 4 PT2013IBRgESERPS1 POS POS 15 1 5 PT2013IBRgESERNS1 NEG NEG 16 1 6 PT2013IBRgESERPS1 POS POS 17 1 7 PT2013IBRgESERNS2 NEG NEG 18 1 8 PT2013IBRgESERPS1 POS POS 19 1 9 PT2013IBRgESERNS2 NEG NEG 1
10 1 10 PT2013IBRgESERPS2 POS POS 111 1 11 PT2013IBRgESERNS2 NEG NEG 112 1 12 PT2013IBRgESERPS2 POS POS 113 1 13 PT2013IBRgESERNS3 NEG NEG 114 1 14 PT2013IBRgESERPS2 POS POS 115 1 15 PT2013IBRgESERNS3 NEG NEG 116 1 16 PT2013IBRgESERPS2 POS POS 117 1 17 PT2013IBRgESERNS3 NEG NEG 118 1 18 PT2013IBRgESERPS3 POS POS 119 1 19 PT2013IBRgESERPS3 POS POS 120 1 20 PT2013IBRgESERPS3 POS POS 121 2 1 PT2013IBRgESERPS3 POS POS 122 2 2 PT2013IBRgESERNS1 NEG NEG 123 2 3 PT2013IBRgESERPS1 POS POS 124 2 4 PT2013IBRgESERNS1 NEG NEG 125 2 5 PT2013IBRgESERPS1 POS POS 126 2 6 PT2013IBRgESERNS1 NEG NEG 127 2 7 PT2013IBRgESERPS1 POS POS 128 2 8 PT2013IBRgESERNS2 NEG NEG 129 2 9 PT2013IBRgESERPS1 POS POS 130 2 10 PT2013IBRgESERNS2 NEG NEG 131 2 11 PT2013IBRgESERPS2 POS POS 132 2 12 PT2013IBRgESERNS2 NEG NEG 133 2 13 PT2013IBRgESERPS2 POS POS 134 2 14 PT2013IBRgESERNS3 NEG NEG 135 2 15 PT2013IBRgESERPS2 POS POS 136 2 16 PT2013IBRgESERNS3 NEG NEG 137 2 17 PT2013IBRgESERPS2 POS POS 138 2 18 PT2013IBRgESERNS3 NEG NEG 139 2 19 PT2013IBRgESERPS3 POS POS 140 2 20 PT2013IBRgESERPS3 POS POS 1

CODA-CERVA
172-PT
PT2013IBRSER 14/37This report can’t be reproduced, except in complete form, without the permission of the CODA-CERVA: CVD-ERA
Table 5. (CONTINUED)
LABNR LABPOSIT SAMPLE STATUS RESULT SUCCESS
41 3 1 PT2013IBRgESERPS3 POS POS 142 3 2 PT2013IBRgESERPS3 POS POS 143 3 3 PT2013IBRgESERNS1 NEG NEG 144 3 4 PT2013IBRgESERPS1 POS POS 145 3 5 PT2013IBRgESERNS1 NEG NEG 146 3 6 PT2013IBRgESERPS1 POS POS 147 3 7 PT2013IBRgESERNS1 NEG NEG 148 3 8 PT2013IBRgESERPS1 POS POS 149 3 9 PT2013IBRgESERNS2 NEG NEG 150 3 10 PT2013IBRgESERPS1 POS POS 151 3 11 PT2013IBRgESERNS2 NEG NEG 152 3 12 PT2013IBRgESERPS2 POS POS 153 3 13 PT2013IBRgESERNS2 NEG NEG 154 3 14 PT2013IBRgESERPS2 POS POS 155 3 15 PT2013IBRgESERNS3 NEG NEG 156 3 16 PT2013IBRgESERPS2 POS POS 157 3 17 PT2013IBRgESERNS3 NEG NEG 158 3 18 PT2013IBRgESERPS2 POS POS 159 3 19 PT2013IBRgESERNS3 NEG NEG 160 3 20 PT2013IBRgESERPS3 POS POS 161 4 1 PT2013IBRgESERPS3 POS POS 162 4 2 PT2013IBRgESERPS3 POS POS 163 4 3 PT2013IBRgESERPS3 POS POS 164 4 4 PT2013IBRgESERNS1 NEG NEG 165 4 5 PT2013IBRgESERPS1 POS POS 166 4 6 PT2013IBRgESERNS1 NEG NEG 167 4 7 PT2013IBRgESERPS1 POS POS 168 4 8 PT2013IBRgESERNS1 NEG NEG 169 4 9 PT2013IBRgESERPS1 POS POS 170 4 10 PT2013IBRgESERNS2 NEG NEG 171 4 11 PT2013IBRgESERPS1 POS POS 172 4 12 PT2013IBRgESERNS2 NEG NEG 173 4 13 PT2013IBRgESERPS2 POS POS 174 4 14 PT2013IBRgESERNS2 NEG NEG 175 4 15 PT2013IBRgESERPS2 POS POS 176 4 16 PT2013IBRgESERNS3 NEG NEG 177 4 17 PT2013IBRgESERPS2 POS POS 178 4 18 PT2013IBRgESERNS3 NEG NEG 179 4 19 PT2013IBRgESERPS2 POS POS 180 4 20 PT2013IBRgESERNS3 NEG NEG 1

CODA-CERVA
172-PT
PT2013IBRSER 15/37This report can’t be reproduced, except in complete form, without the permission of the CODA-CERVA: CVD-ERA
Table 5. (CONTINUED)
LABNR LABPOSIT SAMPLE STATUS RESULT SUCCESS
81 5.1 1 PT2013IBRgESERNS3 NEG NEG 182 5.1 2 PT2013IBRgESERPS3 POS POS 183 5.1 3 PT2013IBRgESERPS3 POS POS 184 5.1 4 PT2013IBRgESERPS3 POS POS 185 5.1 5 PT2013IBRgESERNS1 NEG NEG 186 5.1 6 PT2013IBRgESERPS1 POS POS 187 5.1 7 PT2013IBRgESERNS1 NEG NEG 188 5.1 8 PT2013IBRgESERPS1 POS POS 189 5.1 9 PT2013IBRgESERNS1 NEG NEG 190 5.1 10 PT2013IBRgESERPS1 POS POS 191 5.1 11 PT2013IBRgESERNS2 NEG NEG 192 5.1 12 PT2013IBRgESERPS1 POS POS 193 5.1 13 PT2013IBRgESERNS2 NEG NEG 194 5.1 14 PT2013IBRgESERPS2 POS POS 195 5.1 15 PT2013IBRgESERNS2 NEG NEG 196 5.1 16 PT2013IBRgESERPS2 POS POS 197 5.1 17 PT2013IBRgESERNS3 NEG NEG 198 5.1 18 PT2013IBRgESERPS2 POS POS 199 5.1 19 PT2013IBRgESERNS3 NEG NEG 1
100 5.1 20 PT2013IBRgESERPS2 POS POS 1101 5.2 1 PT2013IBRgESERNS3 NEG NEG 1102 5.2 2 PT2013IBRgESERPS3 POS POS 1103 5.2 3 PT2013IBRgESERPS3 POS POS 1104 5.2 4 PT2013IBRgESERPS3 POS POS 1105 5.2 5 PT2013IBRgESERNS1 NEG NEG 1106 5.2 6 PT2013IBRgESERPS1 POS POS 1107 5.2 7 PT2013IBRgESERNS1 NEG NEG 1108 5.2 8 PT2013IBRgESERPS1 POS POS 1109 5.2 9 PT2013IBRgESERNS1 NEG NEG 1110 5.2 10 PT2013IBRgESERPS1 POS POS 1111 5.2 11 PT2013IBRgESERNS2 NEG NEG 1112 5.2 12 PT2013IBRgESERPS1 POS POS 1113 5.2 13 PT2013IBRgESERNS2 NEG NEG 1114 5.2 14 PT2013IBRgESERPS2 POS POS 1115 5.2 15 PT2013IBRgESERNS2 NEG NEG 1116 5.2 16 PT2013IBRgESERPS2 POS POS 1117 5.2 17 PT2013IBRgESERNS3 NEG NEG 1118 5.2 18 PT2013IBRgESERPS2 POS POS 1119 5.2 19 PT2013IBRgESERNS3 NEG NEG 1120 5.2 20 PT2013IBRgESERPS2 POS POS 1
CODA-CERVA
172-PT
PT2013IBRSER 16/37This report can’t be reproduced, except in complete form, without the permission of the CODA-CERVA: CVD-ERA
Table 5. (CONTINUED)
LABNR LABPOSIT SAMPLE STATUS RESULT SUCCESS
121 6 1 PT2013IBRgESERPS2 POS POS 1122 6 2 PT2013IBRgESERNS3 NEG NEG 1123 6 3 PT2013IBRgESERPS3 POS POS 1124 6 4 PT2013IBRgESERPS3 POS POS 1125 6 5 PT2013IBRgESERPS3 POS POS 1126 6 6 PT2013IBRgESERNS1 NEG NEG 1127 6 7 PT2013IBRgESERPS1 POS POS 1128 6 8 PT2013IBRgESERNS1 NEG NEG 1129 6 9 PT2013IBRgESERPS1 POS POS 1130 6 10 PT2013IBRgESERNS1 NEG NEG 1131 6 11 PT2013IBRgESERPS1 POS POS 1132 6 12 PT2013IBRgESERNS2 NEG NEG 1133 6 13 PT2013IBRgESERPS1 POS POS 1134 6 14 PT2013IBRgESERNS2 NEG NEG 1135 6 15 PT2013IBRgESERPS2 POS POS 1136 6 16 PT2013IBRgESERNS2 NEG NEG 1137 6 17 PT2013IBRgESERPS2 POS POS 1138 6 18 PT2013IBRgESERNS3 NEG NEG 1139 6 19 PT2013IBRgESERPS2 POS POS 1140 6 20 PT2013IBRgESERNS3 NEG NEG 1141 7.1 1 PT2013IBRgESERNS3 NEG NEG 1142 7.1 2 PT2013IBRgESERPS2 POS POS 1143 7.1 3 PT2013IBRgESERNS3 NEG NEG 1144 7.1 4 PT2013IBRgESERPS3 POS POS 1145 7.1 5 PT2013IBRgESERPS3 POS POS 1146 7.1 6 PT2013IBRgESERPS3 POS POS 1147 7.1 7 PT2013IBRgESERNS1 NEG NEG 1148 7.1 8 PT2013IBRgESERPS1 POS POS 1149 7.1 9 PT2013IBRgESERNS1 NEG NEG 1150 7.1 10 PT2013IBRgESERPS1 POS POS 1151 7.1 11 PT2013IBRgESERNS1 NEG NEG 1152 7.1 12 PT2013IBRgESERPS1 POS POS 1153 7.1 13 PT2013IBRgESERNS2 NEG NEG 1154 7.1 14 PT2013IBRgESERPS1 POS POS 1155 7.1 15 PT2013IBRgESERNS2 NEG NEG 1156 7.1 16 PT2013IBRgESERPS2 POS POS 1157 7.1 17 PT2013IBRgESERNS2 NEG NEG 1158 7.1 18 PT2013IBRgESERPS2 POS POS 1159 7.1 19 PT2013IBRgESERNS3 NEG NEG 1160 7.1 20 PT2013IBRgESERPS2 POS POS 1

CODA-CERVA
172-PT
PT2013IBRSER 17/37This report can’t be reproduced, except in complete form, without the permission of the CODA-CERVA: CVD-ERA
Table 5. (CONTINUED)
LABNR LABPOSIT SAMPLE STATUS RESULT SUCCESS
161 7.2 1 PT2013IBRgESERNS3 NEG NEG 1162 7.2 2 PT2013IBRgESERPS2 POS POS 1163 7.2 3 PT2013IBRgESERNS3 NEG NEG 1164 7.2 4 PT2013IBRgESERPS3 POS POS 1165 7.2 5 PT2013IBRgESERPS3 POS POS 1166 7.2 6 PT2013IBRgESERPS3 POS POS 1167 7.2 7 PT2013IBRgESERNS1 NEG NEG 1168 7.2 8 PT2013IBRgESERPS1 POS POS 1169 7.2 9 PT2013IBRgESERNS1 NEG NEG 1170 7.2 10 PT2013IBRgESERPS1 POS POS 1171 7.2 11 PT2013IBRgESERNS1 NEG NEG 1172 7.2 12 PT2013IBRgESERPS1 POS POS 1173 7.2 13 PT2013IBRgESERNS2 NEG NEG 1174 7.2 14 PT2013IBRgESERPS1 POS POS 1175 7.2 15 PT2013IBRgESERNS2 NEG NEG 1176 7.2 16 PT2013IBRgESERPS2 POS POS 1177 7.2 17 PT2013IBRgESERNS2 NEG NEG 1178 7.2 18 PT2013IBRgESERPS2 POS POS 1179 7.2 19 PT2013IBRgESERNS3 NEG NEG 1180 7.2 20 PT2013IBRgESERPS2 POS POS 1181 8 1 PT2013IBRgESERPS2 POS POS 1182 8 2 PT2013IBRgESERNS3 NEG NEG 1183 8 3 PT2013IBRgESERPS2 POS POS 1184 8 4 PT2013IBRgESERNS3 NEG NEG 1185 8 5 PT2013IBRgESERPS3 POS POS 1186 8 6 PT2013IBRgESERPS3 POS POS 1187 8 7 PT2013IBRgESERPS3 POS POS 1188 8 8 PT2013IBRgESERNS1 NEG NEG 1189 8 9 PT2013IBRgESERPS1 POS POS 1190 8 10 PT2013IBRgESERNS1 NEG NEG 1191 8 11 PT2013IBRgESERPS1 POS POS 1192 8 12 PT2013IBRgESERNS1 NEG NEG 1193 8 13 PT2013IBRgESERPS1 POS POS 1194 8 14 PT2013IBRgESERNS2 NEG NEG 1195 8 15 PT2013IBRgESERPS1 POS POS 1196 8 16 PT2013IBRgESERNS2 NEG NEG 1197 8 17 PT2013IBRgESERPS2 POS POS 1198 8 18 PT2013IBRgESERNS2 NEG NEG 1199 8 19 PT2013IBRgESERPS2 POS POS 1200 8 20 PT2013IBRgESERNS3 NEG NEG 1

CODA-CERVA
172-PT
PT2013IBRSER 18/37This report can’t be reproduced, except in complete form, without the permission of the CODA-CERVA: CVD-ERA
Table 5. (CONTINUED)
LABNR LABPOSIT SAMPLE STATUS RESULT SUCCESS
201 10 1 PT2013IBRgESERNS3 NEG NEG 1202 10 2 PT2013IBRgESERPS2 POS POS 1203 10 3 PT2013IBRgESERNS3 NEG NEG 1204 10 4 PT2013IBRgESERPS2 POS POS 1205 10 5 PT2013IBRgESERNS3 NEG NEG 1206 10 6 PT2013IBRgESERPS3 POS POS 1207 10 7 PT2013IBRgESERPS3 POS POS 1208 10 8 PT2013IBRgESERPS3 POS POS 1209 10 9 PT2013IBRgESERNS1 NEG NEG 1210 10 10 PT2013IBRgESERPS1 POS POS 1211 10 11 PT2013IBRgESERNS1 NEG NEG 1212 10 12 PT2013IBRgESERPS1 POS POS 1213 10 13 PT2013IBRgESERNS1 NEG NEG 1214 10 14 PT2013IBRgESERPS1 POS POS 1215 10 15 PT2013IBRgESERNS2 NEG NEG 1216 10 16 PT2013IBRgESERPS1 POS POS 1217 10 17 PT2013IBRgESERNS2 NEG NEG 1218 10 18 PT2013IBRgESERPS2 POS POS 1219 10 19 PT2013IBRgESERNS2 NEG NEG 1220 10 20 PT2013IBRgESERPS2 POS POS 1

CODA-CERVA
172-PT
PT2013IBRSER 19/37This report can’t be reproduced, except in complete form, without the permission of the CODA-CERVA: CVD-ERA
V. Discussion
The purpose of this PT was to assess performances of the participating laboratories when analyzing reference serumsamples of bovine origin for the detection of IBRgB- and/or IBRgE-specific antibodies by ELISA.
For the detection of IBRgB-specific antibodies in reference serum samples, 7 out of 9 participating laboratories (LAB1,LAB2, LAB3, LAB4, LAB5, LAB6 and LAB8) provided qualitative results that were in full agreement with the assignedstatus of the reference serum samples (100% of agreement). Both LAB3, LAB4 and LAB5 analysed the reference serumsamples using 2 ELISA kits from different producers, hereby obtaining identical qualitative results. In contrast, LAB7misclassified 3 aliquots of the reference serum sample PT2013IBRgBSERPS1 (85% of agreement), whereas LAB9misclassified 2 aliquots of the reference serum sample PT2013IBRgBSERPS2 (90% of agreement) (Table 2 and Table 4).One participating laboratory used an in-house developed IBRgB antibody ELISA kit, whereas the other participants usedIBRgB antibody ELISA kits from 4 different commercial kit producers. Hereby, different kits from the same producer anddifferent batches from the same ELISA kit were used: IDEXX (HerdChek IBR gB X2 Ab Test [IDEXX Switzerland AG] - 2batches: A321, A001; IBR gB Blocking Ab Test [IDEXX Montpellier SAS] - 1 batch: 2223), Synbiotics Europe (1 batch:13SIBR1BN211), LSI (1 batch: IBRG-005) and QIAGEN (1 batch: 12-11-7BHV). LAB1, LAB2, LAB3.1, LAB4.1 andLAB5.1 used the same IBRgB ELISA kit, hereby all performing the long incubation protocol. In addition, LAB1, LAB2,LAB3.1 and LAB4.1 used the same batch. Furthermore, also LAB3.2, LAB4.2 and LAB6 used the same IBRgB ELISA kit,all performing the short incubation protocol of the same batch.
For the detection of IBRgE-specific antibodies in reference serum samples, all participating laboratories providedqualitative results that were in full agreement with the assigned status of the reference serum samples (100% ofagreement). Both LAB5 and LAB7 obtained identical qualitative results using 2 different batches of the same ELISA kit(Table 3 and Table 5).The IBRgE participating laboratories used ELISA kits from 3 different producers as well as different batches from thesame ELISA kit: IDEXX (5 batches: KH521, AJ888, CJ201, AJ894, CJ220), LSI (1 batch: IBRGE-001) and ID.VET (1batch: 466). LAB1, LAB2, LAB3, LAB4, LAB5.1, LAB5.2, LAB7.1, LAB7.2 and LAB8 used the same IBRgE ELISA kit. Inaddition, LAB1 and LAB8 on the one hand, and LAB2, LAB3, LAB4 and LAB5.1 on the other hand, used the same batch.
VI. Conclusions
According to the procedure currently in force, the performance of a participating laboratory is satisfactory if at least 95%(PT IBRgB) or at least 90% (PT IBRgE) of the results provided by this laboratory is in agreement with the status of thereference serum samples assigned by CODA-CERVA (see III.3.3.). As a consequence: (i) 7 out of 9 laboratories thatparticipated in the PT IBRgB achieved a satisfactory performance for the detection of IBRgB-specific antibodies inreference serum samples of bovine origin by ELISA with all ELISA kits used, and (ii) all laboratories that participated in thePT IBRgE achieved a satisfactory performance for the detection of IBRgE-specific antibodies in reference serum samplesof bovine origin with all batches used. For the PT IBRgB, LAB7 and LAB9 did not reach the required 95% of agreement.
Head CVD-ERAYves Van der Stede

CODA-CERVA
172-PT
PT2013IBRSER 20/37This report can’t be reproduced, except in complete form, without the permission of the CODA-CERVA: CVD-ERA
Appendix
Names of the participating laboratories
Agence nationale de sécurité sanitaire de l'alimentation, de l'environnement et du travail (ANSES) (Sophia-Antipolis,
France)
Association Régionale de Santé et d'Identification Animales (ARSIA) (Ciney, Belgium)
Dierengezondheidszorg Vlaanderen (DGZ) (Torhout, Belgium)
Friedrich-Loeffler-Institut (FLI) (Greifswald-Insel-Riems, Germany)
Innovative Diagnostics (ID.VET) (Montpellier, France)
Laboratoire de Médecine Vétérinaire de l’Etat (LMVE) (Grand Duchy of Luxemburg)
Laboratoire Service International (LSI) (Lissieu, France)
State Veterinary Institute Zvolen (Zvolen, Slovakia)
Synbiotics Europe (Lyon, France)
Veterinary and Agrochemical Research Center (CODA-CERVA) (Ukkel, Belgium)

CODA-CERVA
PT2013IBRSER 21/37This report can’t be reproduced, except in complete form, without the permission of the CODA-CERVA: CVD-ERA
Annex 1: Quantitative data analysisBesides qualitative data analysis (positive, negative or non-interpretable result), also quantitative data analysis wasperformed using the statistical software programs R (box plots) and SAS 9.2. (summary statistics). All quantitative dataanalyses were performed on the normalized data, namely the percentages blocking calculated according to theinstructions for this PT: [1- (ODSample / mean OD Negative Kit Controls)] x 100.
The quantitative data analysis in this report was not used to evaluate the participants in this PT, but should only beconsidered as educational information for the participants in order to evaluate their performance and/or to standardizetheir different diagnostic tests.
I. Box plots
Box plots of the percentages blocking per reference serum sample and per participating (sub)laboratory were made usingthe statistical software R. Box plots for the (sub)laboratories participating in the PT IBRgB and the PT IBRgE are shown inFigure 1 and Figure 2, respectively.
Remark: To calculate the percentages blocking, the PT provider used the formula [1- (ODSample / mean OD Negative Kit Controls)] x100 for both the PT IBRgB and the PT IBRgE. Because LAB7 calculated the percentages blocking for the PT IBRgB usingthe formula [(mean ODNegative Kit Controls - ODSample) / (mean ODNegative Kit Controls - mean ODPositive Kit Controls)] x100, the cut-offs forthe IBRgB antibody ELISA kit used by LAB7 were adapted accordingly (26,4-44,0% instead of 30-50%).

CODA-CERVA
PT2013IBRSER 22/37This report can’t be reproduced, except in complete form, without the permission of the CODA-CERVA: CVD-ERA
Figure 1. Box plots showing the percentage blocking per IBRgB reference serum sample and per participating(sub)laboratory. Box plots represent the minimum value, the maximum value, the median, the lower (25%) and upper (75%) quartile,and possible outliers per sample and per laboratory. (Adapted) cut-off values applied by the participating laboratories are shown inpink (26,4-44%; LAB7), orange (35%; LAB3.2, LAB4.2, LAB6), black (45-50%; LAB8, LAB9), green (45-55%; LAB1, LAB2, LAB3.1,LAB4.1, LAB5.1), brown (55-65%; LAB5.2), respectively. LAB1, LAB2, LAB3.1, LAB4.1 and LAB5.1 performed the same incubationprotocol of the same IBRgB ELISA kit (2 different batches; LAB1, LAB2, LAB3.1 and LAB4.1 used the same batch). Also LAB3.2,LAB4.2 and LAB6 performed the same incubation protocol of the same IBRgB ELISA kit (1 batch).

CODA-CERVA
PT2013IBRSER 23/37This report can’t be reproduced, except in complete form, without the permission of the CODA-CERVA: CVD-ERA
Figure 2. Box plots showing the percentage blocking per IBRgE reference serum sample and per participating(sub)laboratory. Box plots represent the minimum value, the maximum value, the median, the lower (25%) and upper (75%) quartile,and possible outliers per sample and per laboratory. Cut-off values applied by the participating laboratories are shown in light green(30-40%; all participants except LAB10) and dark green (50-60%; LAB10), respectively. LAB1, LAB2, LAB3, LAB4, LAB5.1, LAB5.2,LAB7.1, LAB7.2 and LAB8 used the same IBRgE ELISA kit (same incubation protocol). In addition, LAB1 and LAB8 on the one hand,and LAB2, LAB3, LAB4 and LAB5.1 on the other hand, used the same batch.

CODA-CERVA
PT2013IBRSER 24/37This report can’t be reproduced, except in complete form, without the permission of the CODA-CERVA: CVD-ERA
II. Mandel’s h- and k-statistics (z-scores)
Based on ISO 5725-2 and ISO 13528, between-lab variability (reproducibility) and within-lab variability (repeatability) wereestimated through Mandel’s h- and k-statistics, respectively, using the statistical software SAS 9.2. Mandel’s h- and k-statistics were calculated per reference serum sample and per participating laboratory.
The h-statistic depends on the number of participants, whereas the k-statistic depends on both the number of participantsand the number of repeats per sample. When 30 participants or more are involved in a PT, a satisfactory between-lab andwithin-lab consistency is obtained when the (absolute) value for the h- and k-statistic is smaller than 2. An unsatisfactoryresult (a corrective action is required) is reached when the (absolute) value is larger than 3. (Absolute) values between 2and 3 indicate a questionable consistency. Importantly, in case of a smaller number of participants (which is the case inthis PT), other indicator values apply for Mandel’s h- and k-statistics (Table 1).
Table 1. Indicators for Mandel’s h- and k-statistics at the 5% significance level in function of the number of participating laboratories(p) and the number of repeats per sample (n) as described in ISO 5725-2.
p (# labs) hk
n (# repeats)2 3 4 5 6 7 8 9 10
3 1,15 1,65 1,53 1,45 1,40 1,37 1,34 1,32 1,30 1,294 1,42 1,76 1,59 1,50 1,44 1,40 1,37 1,35 1,33 1,315 1,57 1,81 1,62 1,53 1,46 1,42 1,39 1,36 1,34 1,326 1,66 1,85 1,64 1,54 1,48 1,43 1,40 1,37 1,35 1,337 1,71 1,87 1,66 1,55 1,49 1,44 1,41 1,38 1,36 1,348 1,75 1,88 1,67 1,56 1,50 1,45 1,41 1,38 1,36 1,349 1,78 1,90 1,68 1,57 1,50 1,45 1,42 1,39 1,36 1,35
10 1,80 1,90 1,68 1,57 1,50 1,46 1,42 1,39 1,37 1,3511 1,82 1,91 1,69 1,58 1,51 1,46 1,42 1,39 1,37 1,3512 1,83 1,92 1,69 1,58 1,51 1,46 1,42 1,40 1,37 1,3513 1,84 1,92 1,69 1,58 1,51 1,46 1,43 1,40 1,37 1,3514 1,85 1,92 1,70 1,59 1,52 1,47 1,43 1,40 1,37 1,3515 1,86 1,93 1,70 1,59 1,52 1,47 1,43 1,40 1,38 1,36
Based on Table 1, the maximum absolute value for Mandel’s h-statistic is 1,83 for the PT IBRgB (p=12) and 1,82 for thePT IBRgE (p=11). For the PT IBRgB, the maximum value for Mandel’s k-statistic is 1,69 for the reference serum samplesPT2013IBRgBSERPS1, PT2013IBRgBSERPS2, PT2013IBRgBSERPS3 and PT2013IBRgBSERPS4 (p=12 and n=3) and1,58 for the reference serum samples PT2013IBRgBSERNS1 and PT2013IBRgBSERNS2 (p=12 and n=4). For the PTIBRgE, the maximum value for Mandel’s k-statistic is 1,69 for the reference serum samples PT2013IBRgESERNS1,PT2013IBRgESERNS2, PT2013IBRgESERNS3 and PT2013IBRgESERPS3 (p=11 and n=3) and 1,58 for the referenceserum samples PT2013IBRgESERPS1 and PT2013IBRgESERPS2 (p=11 and n=4).
For the detection of IBRgB-specific antibodies, 9 out of 12 participating (sub)laboratories obtained a satisfactory between-laboratory consistency for all reference serum samples. This was not the case for LAB5.1, LAB7 and LAB9 which showedan increased value for Mandel’s h-statistic for at least 1 reference serum sample: LAB5.1 for the negative reference serumsample PT2013IBRgBSERNS1 (h=2,29), LAB7 for the positive reference serum samples PT2013IBRgBSERPS1 (h=-2,56), PT2013IBRgBSERPS3 (h=-2,38) and PT2013IBRgBSERPS4 (h=-2,81), and LAB9 for the positive reference serumsample PT2013IBRgBSERPS2 (h=-2,97). LAB1, LAB2, LAB3.1, LAB4.1 and LAB5.1 on the one hand, and LAB3.2,LAB4.2 and LAB6 on the other hand, performed the same incubation protocol of the same IBRgB ELISA kit. Hereby,LAB1, LAB2, LAB3.1 and LAB4.1 on the one hand, and LAB3.2, LAB4.2 and LAB6 on the other hand used the samebatch.Furthermore, 7 out of 12 participating (sub)laboratories obtained a satisfactory within-laboratory consistency for allreference serum samples. This was not the case for LAB1, LAB5.1, LAB6, LAB7 and LAB9 which showed an increasedvalue for Mandel’s k-statistic for at least 1 reference serum sample: LAB1 for the negative reference serum samplePT2013IBRgBSERNS1 (k=2,12), LAB5.1 for the negative reference serum sample PT2013IBRgBSERNS2 (k=2,53), LAB6for the positive reference serum sample PT2013IBRgBSERPS1 (k=2,14), LAB7 for the positive reference serum samplesPT2013IBRgBSERPS1 (k=2,25), and PT2013IBRgBSERPS4 (k=2,02), and LAB9 for the positive reference serumsamples PT2013IBRgBSERPS2 (k=3,44) and PT2013IBRgBSERPS3 (k=3,29).

CODA-CERVA
PT2013IBRSER 25/37This report can’t be reproduced, except in complete form, without the permission of the CODA-CERVA: CVD-ERA
For the detection of IBRgE-specific antibodies, 9 out of 11 participating (sub)laboratories obtained a satisfactory between-laboratory consistency for all reference serum samples. This was not the case for LAB6 and LAB10, which showed anincreased increased value for Mandel’s h-statistic for at least 1 reference serum sample: LAB6 for the positive referenceserum sample PT2013IBRgESERPS1 (h=-2,77) and LAB10 for the negative reference serum samplesPT2013IBRgESERNS2 (h=2,19) and PT2013IBRgESERNS3 (h=2,05) and for the positive reference serum samplesPT2013IBRgESERPS2 (h=2,62) and PT2013IBRgESERPS3 (h=2,62). LAB1, LAB2, LAB3, LAB4, LAB5.1, LAB5.2,LAB7.1, LAB7.2 and LAB8 used the same IBRgE ELISA kit (same incubation protocol). In addition, LAB1 and LAB8 on theone hand, and LAB2, LAB3, LAB4 and LAB5.1 on the other hand, used the same batch.Furthermore, 8 out of 11 participating (sub)laboratories obtained a satisfactory within-laboratory consistency for allreference serum samples. This was not the case for LAB2, LAB5.2 and LAB8, which showed an increased value forMandel’s k-statistic for at least 1 reference serum sample: LAB2 for the negative reference serum samplePT2013IBRgESERNS3 (k=2,33), LAB5.2 for the negative reference serum sample PT2013IBRgESERNS2 (k=1,75) andfor the positive reference serum sample PT2013IBRgESERPS2 (k=1,65), and LAB8 for the positive reference serumsample PT2013IBRgESERPS1 (k=2,07).
All data used for the calculations of Mandel’s h- and k-statistics for the PT IBRgB and the PT IBRgE can be found inAnnex 2.

CODA-CERVA
PT2013IBRSER 26/37This report can’t be reproduced, except in complete form, without the permission of the CODA-CERVA: CVD-ERA
III. ANOVA
Using a SAS macro encoding a general linear model (GLM) with laboratories as fixed effect and the normalized OD valuesas a dependent variable, it was investigated whether statistically significant differences exist (α=0,05) betweenparticipating laboratories and between different kits or batches used at the same laboratory. Comparisons were made atthe global level (all reference serum samples were analysed together), status level (all reference serum samples with thesame status were analysed together) and sample level (all reference serum samples were analysed individually). Sincecomparing quantitative results between participants or methods (e.g. different kits, batches or incubation protocols) ismost relevant at the status level (less variation than at a global level), we focused on the latter.
III.1. IBRgB
For the PT IBRgB, no statistically significant differences were observed between laboratories or between different kitsused at the same laboratory at a global level. However, statistically significant differences existed at both sample andstatus level.
At the status level, significant differences were only observed for the positive reference serum samples. LAB7 reportedpercentages blocking that were significantly lower than those reported by the other participants. LAB4.1, LAB1, LAB3.1and LAB2 reported percentages blocking that were significantly higher than those reported by LAB3.2, LAB9 and LAB7. Ofthose laboratories that tested 2 different IBRgB ELISA kits (LAB3, LAB4 and LAB5), only a significant difference wasobserved between LAB3.1 and LAB3.2, with lower percentages blocking for the latter.
III.2. IBRgE
For the PT IBRgE, no statistically significant differences were observed between laboratories or between different batchesused at the same laboratory at a global level. However, statistically significant differences existed at both sample andstatus level.
At the status level, significant differences were observed for both the negative and positive reference serum samples. Forthe negative reference serum samples, LAB10 reported percentages blocking that were significantly higher than thosereported by the other laboratories. For the positive reference serum samples, LAB10 reported percentages blocking thatwere significantly higher than those reported by LAB8 and LAB5.2. The percentages blocking obtained by LAB5 and LAB7using 2 different batches of the same IBRgE ELISA kit (LAB5.1 and LAB5.2, LAB7.1 and LAB7.2, respectively) did resultin significant differences for the negative but not for the positive reference serum samples. The percentages blocking forthe negative reference serum samples obtained by LAB5.1 and LAB7.1 were significantly higher than those obtained byLAB5.2 and LAB7.2, respectively.

CODA-CERVA
PT2013IBRSER 27/37This report can’t be reproduced, except in complete form, without the permission of the CODA-CERVA: CVD-ERA
Annex 2: Calculations of Mandel’s h- and k-statistics (based on % blocking)A. IBRgB
Sample Labnr n_i v_i x_i_m x_g_m between_lab_coeff
STDEV_repeat
STDEV_repro
STDEV_betweenlab
h k cv
PT2013IBRgBSERNS1 1 4 133,24 16,33 11,94 0,05 5,43 5,58 1,25 0,89 2,12 70,67
PT2013IBRgBSERNS1 2 4 2,82 10,28 11,94 0,05 5,43 5,58 1,25 -0,33 0,31 16,33
PT2013IBRgBSERNS1 3.1 4 5,33 9,07 11,94 0,05 5,43 5,58 1,25 -0,58 0,42 25,45
PT2013IBRgBSERNS1 3.2 4 7,28 7,11 11,94 0,05 5,43 5,58 1,25 -0,97 0,50 37,95
PT2013IBRgBSERNS1 4.1 4 23,71 8,51 11,94 0,05 5,43 5,58 1,25 -0,69 0,90 57,19
PT2013IBRgBSERNS1 4.2 4 53,74 7,67 11,94 0,05 5,43 5,58 1,25 -0,86 1,35 95,52
PT2013IBRgBSERNS1 5.1 4 38,67 23,29 11,94 0,05 5,43 5,58 1,25 2,29 1,14 26,70
PT2013IBRgBSERNS1 5.2 4 15,59 14,18 11,94 0,05 5,43 5,58 1,25 0,45 0,73 27,84
PT2013IBRgBSERNS1 6 4 12,47 14,27 11,94 0,05 5,43 5,58 1,25 0,47 0,65 24,75
PT2013IBRgBSERNS1 7 4 13,32 5,51 11,94 0,05 5,43 5,58 1,25 -1,30 0,67 66,20
PT2013IBRgBSERNS1 8 4 10,20 12,63 11,94 0,05 5,43 5,58 1,25 0,14 0,59 25,28
PT2013IBRgBSERNS1 9 4 38,06 14,37 11,94 0,05 5,43 5,58 1,25 0,49 1,14 42,94
PT2013IBRgBSERNS2 1 4 35,66 13,05 8,95 0,02 5,70 5,75 0,73 1,09 1,05 45,78
PT2013IBRgBSERNS2 2 4 2,59 4,44 8,95 0,02 5,70 5,75 0,73 -1,21 0,28 36,29
PT2013IBRgBSERNS2 3.1 4 1,81 6,27 8,95 0,02 5,70 5,75 0,73 -0,72 0,24 21,45
PT2013IBRgBSERNS2 3.2 4 2,42 9,98 8,95 0,02 5,70 5,75 0,73 0,27 0,27 15,59
PT2013IBRgBSERNS2 4.1 4 6,12 6,85 8,95 0,02 5,70 5,75 0,73 -0,56 0,43 36,10
PT2013IBRgBSERNS2 4.2 4 70,02 8,70 8,95 0,02 5,70 5,75 0,73 -0,07 1,47 96,18
PT2013IBRgBSERNS2 5.1 4 208,74 4,25 8,95 0,02 5,70 5,75 0,73 -1,26 2,53 340,17
PT2013IBRgBSERNS2 5.2 4 6,32 5,04 8,95 0,02 5,70 5,75 0,73 -1,04 0,44 49,88
PT2013IBRgBSERNS2 6 4 28,80 13,98 8,95 0,02 5,70 5,75 0,73 1,34 0,94 38,37
PT2013IBRgBSERNS2 7 4 12,74 7,95 8,95 0,02 5,70 5,75 0,73 -0,27 0,63 44,89
PT2013IBRgBSERNS2 8 4 0,63 13,30 8,95 0,02 5,70 5,75 0,73 1,16 0,14 5,99

CODA-CERVA
PT2013IBRSER 28/37This report can’t be reproduced, except in complete form, without the permission of the CODA-CERVA: CVD-ERA
Sample Labnr n_i v_i x_i_m x_g_m between_lab_coeff
STDEV_repeat
STDEV_repro
STDEV_betweenlab
h k cv
PT2013IBRgBSERNS2 9 4 14,37 13,63 8,95 0,02 5,70 5,75 0,73 1,25 0,66 27,81
PT2013IBRgBSERPS1 1 3 0,04 97,30 81,88 0,92 1,81 6,22 5,95 0,78 0,11 0,21
PT2013IBRgBSERPS1 2 3 0,04 97,20 81,88 0,92 1,81 6,22 5,95 0,78 0,11 0,21
PT2013IBRgBSERPS1 3.1 3 0,05 97,20 81,88 0,92 1,81 6,22 5,95 0,78 0,13 0,24
PT2013IBRgBSERPS1 3.2 3 2,65 65,18 81,88 0,92 1,81 6,22 5,95 -0,84 0,90 2,50
PT2013IBRgBSERPS1 4.1 3 0,09 97,67 81,88 0,92 1,81 6,22 5,95 0,80 0,17 0,31
PT2013IBRgBSERPS1 4.2 3 2,94 70,88 81,88 0,92 1,81 6,22 5,95 -0,56 0,95 2,42
PT2013IBRgBSERPS1 5.1 3 0,27 91,70 81,88 0,92 1,81 6,22 5,95 0,50 0,29 0,57
PT2013IBRgBSERPS1 5.2 3 0,12 89,44 81,88 0,92 1,81 6,22 5,95 0,38 0,19 0,38
PT2013IBRgBSERPS1 6 3 15,00 70,51 81,88 0,92 1,81 6,22 5,95 -0,58 2,14 5,49
PT2013IBRgBSERPS1 7 3 16,69 31,23 81,88 0,92 1,81 6,22 5,95 -2,56 2,25 13,08
PT2013IBRgBSERPS1 8 3 0,55 91,24 81,88 0,92 1,81 6,22 5,95 0,47 0,41 0,82
PT2013IBRgBSERPS1 9 3 0,95 82,94 81,88 0,92 1,81 6,22 5,95 0,05 0,54 1,18
PT2013IBRgBSERPS2 1 3 0,01 98,99 91,51 0,47 4,10 5,63 3,86 0,57 0,02 0,08
PT2013IBRgBSERPS2 2 3 0,00 98,63 91,51 0,47 4,10 5,63 3,86 0,55 0,00 0,01
PT2013IBRgBSERPS2 3.1 3 0,01 99,03 91,51 0,47 4,10 5,63 3,86 0,58 0,02 0,10
PT2013IBRgBSERPS2 3.2 3 0,08 94,69 91,51 0,47 4,10 5,63 3,86 0,24 0,07 0,30
PT2013IBRgBSERPS2 4.1 3 0,00 99,31 91,51 0,47 4,10 5,63 3,86 0,60 0,01 0,05
PT2013IBRgBSERPS2 4.2 3 1,81 95,14 91,51 0,47 4,10 5,63 3,86 0,28 0,33 1,42
PT2013IBRgBSERPS2 5.1 3 0,10 93,10 91,51 0,47 4,10 5,63 3,86 0,12 0,08 0,33
PT2013IBRgBSERPS2 5.2 3 0,01 91,15 91,51 0,47 4,10 5,63 3,86 -0,03 0,02 0,10
PT2013IBRgBSERPS2 6 3 0,00 95,61 91,51 0,47 4,10 5,63 3,86 0,31 0,01 0,05
PT2013IBRgBSERPS2 7 3 0,06 82,95 91,51 0,47 4,10 5,63 3,86 -0,66 0,06 0,29
PT2013IBRgBSERPS2 8 3 0,20 96,71 91,51 0,47 4,10 5,63 3,86 0,40 0,11 0,46
PT2013IBRgBSERPS2 9 3 199,87 52,81 91,51 0,47 4,10 5,63 3,86 -2,97 3,44 26,77
PT2013IBRgBSERPS3 1 3 0,01 98,78 92,85 0,58 1,81 2,80 2,14 0,83 0,06 0,11
PT2013IBRgBSERPS3 2 3 0,00 98,36 92,85 0,58 1,81 2,80 2,14 0,77 0,02 0,04

CODA-CERVA
PT2013IBRSER 29/37This report can’t be reproduced, except in complete form, without the permission of the CODA-CERVA: CVD-ERA
Sample Labnr n_i v_i x_i_m x_g_m between_lab_coeff
STDEV_repeat
STDEV_repro
STDEV_betweenlab
h k cv
PT2013IBRgBSERPS3 3.1 3 0,06 98,68 92,85 0,58 1,81 2,80 2,14 0,81 0,13 0,24
PT2013IBRgBSERPS3 3.2 3 1,11 93,28 92,85 0,58 1,81 2,80 2,14 0,06 0,58 1,13
PT2013IBRgBSERPS3 4.1 3 0,08 99,17 92,85 0,58 1,81 2,80 2,14 0,88 0,16 0,29
PT2013IBRgBSERPS3 4.2 3 1,69 94,18 92,85 0,58 1,81 2,80 2,14 0,19 0,72 1,38
PT2013IBRgBSERPS3 5.1 3 0,29 92,55 92,85 0,58 1,81 2,80 2,14 -0,04 0,30 0,58
PT2013IBRgBSERPS3 5.2 3 0,18 90,62 92,85 0,58 1,81 2,80 2,14 -0,31 0,24 0,47
PT2013IBRgBSERPS3 6 3 0,09 94,49 92,85 0,58 1,81 2,80 2,14 0,23 0,17 0,32
PT2013IBRgBSERPS3 7 3 0,02 75,77 92,85 0,58 1,81 2,80 2,14 -2,38 0,08 0,20
PT2013IBRgBSERPS3 8 3 0,34 96,11 92,85 0,58 1,81 2,80 2,14 0,45 0,32 0,60
PT2013IBRgBSERPS3 9 3 35,46 82,23 92,85 0,58 1,81 2,80 2,14 -1,48 3,29 7,24
PT2013IBRgBSERPS4 1 3 0,08 97,00 88,45 0,95 0,77 3,42 3,33 0,77 0,37 0,29
PT2013IBRgBSERPS4 2 3 0,01 96,56 88,45 0,95 0,77 3,42 3,33 0,73 0,14 0,11
PT2013IBRgBSERPS4 3.1 3 0,05 96,64 88,45 0,95 0,77 3,42 3,33 0,74 0,28 0,22
PT2013IBRgBSERPS4 3.2 3 0,41 83,29 88,45 0,95 0,77 3,42 3,33 -0,47 0,83 0,77
PT2013IBRgBSERPS4 4.1 3 0,04 97,23 88,45 0,95 0,77 3,42 3,33 0,79 0,27 0,21
PT2013IBRgBSERPS4 4.2 3 1,58 87,07 88,45 0,95 0,77 3,42 3,33 -0,12 1,64 1,44
PT2013IBRgBSERPS4 5.1 3 0,47 91,26 88,45 0,95 0,77 3,42 3,33 0,25 0,90 0,75
PT2013IBRgBSERPS4 5.2 3 0,36 88,91 88,45 0,95 0,77 3,42 3,33 0,04 0,79 0,68
PT2013IBRgBSERPS4 6 3 1,19 84,97 88,45 0,95 0,77 3,42 3,33 -0,31 1,42 1,28
PT2013IBRgBSERPS4 7 3 2,40 57,29 88,45 0,95 0,77 3,42 3,33 -2,81 2,02 2,70
PT2013IBRgBSERPS4 8 3 0,08 94,81 88,45 0,95 0,77 3,42 3,33 0,57 0,37 0,30
PT2013IBRgBSERPS4 9 3 0,36 86,35 88,45 0,95 0,77 3,42 3,33 -0,19 0,78 0,69
Legend: Labnr = number attributed to a laboratory during the PT; n_i = number of replicates; v_i = total variability (variance) in the normalized data (% blocking); x_i_m = mean of normalized data (%blocking); x_g_m = mean of normalized data (% blocking) obtained by all laboratories; between_lab_coeff = fraction of total variability due to differences between labs for each sample; STDEV_repeat =repeatability standard deviation over all laboratories; STDEV_repro = reproducibility standard deviation over all laboratories; STDEV_betweenlab = between-lab standard deviation over all laboratories; h-statistic = between-laboratory consistency; k-statistic = within-laboratory consistency; CV = variation coefficient in %. Values for Mandel’s h- and k-statistics shown in red/underlined/bold exceed thecorresponding limit value as determined in Annex 1 (Table 1).

CODA-CERVA
PT2013IBRSER 30/37This report can’t be reproduced, except in complete form, without the permission of the CODA-CERVA: CVD-ERA
B. IBRgE
Sample Labnr n_i v_i x_i_m x_g_m between_lab_coeff
STDEV_repeat
STDEV_repro
STDEV_betweenlab
h k cv
PT2013IBRgESERNS1 1 3 24,92 -13,75 -8,43 0,49 4,85 6,79 4,75 -0,35 1,03 -36,31
PT2013IBRgESERNS1 2 3 7,79 -11,63 -8,43 0,49 4,85 6,79 4,75 -0,21 0,58 -24,00
PT2013IBRgESERNS1 3 3 6,51 -7,32 -8,43 0,49 4,85 6,79 4,75 0,07 0,53 -34,84
PT2013IBRgESERNS1 4 3 41,96 -15,96 -8,43 0,49 4,85 6,79 4,75 -0,49 1,33 -40,58
PT2013IBRgESERNS1 5.1 3 17,77 -1,31 -8,43 0,49 4,85 6,79 4,75 0,47 0,87 -322,08
PT2013IBRgESERNS1 5.2 3 43,81 -32,21 -8,43 0,49 4,85 6,79 4,75 -1,56 1,36 -20,55
PT2013IBRgESERNS1 6 3 2,43 10,19 -8,43 0,49 4,85 6,79 4,75 1,22 0,32 15,30
PT2013IBRgESERNS1 7.1 3 58,05 3,31 -8,43 0,49 4,85 6,79 4,75 0,77 1,57 229,85
PT2013IBRgESERNS1 7.2 3 21,03 -13,32 -8,43 0,49 4,85 6,79 4,75 -0,32 0,95 -34,43
PT2013IBRgESERNS1 8 3 15,73 -28,77 -8,43 0,49 4,85 6,79 4,75 -1,33 0,82 -13,79
PT2013IBRgESERNS1 10 3 19,00 18,00 -8,43 0,49 4,85 6,79 4,75 1,73 0,90 24,22
PT2013IBRgESERNS2 1 3 4,30 -14,35 -10,56 0,42 4,63 6,08 3,94 -0,30 0,45 -14,44
PT2013IBRgESERNS2 2 3 3,75 -15,66 -10,56 0,42 4,63 6,08 3,94 -0,40 0,42 -12,37
PT2013IBRgESERNS2 3 3 26,50 -9,10 -10,56 0,42 4,63 6,08 3,94 0,11 1,11 -56,59
PT2013IBRgESERNS2 4 3 44,78 -11,60 -10,56 0,42 4,63 6,08 3,94 -0,08 1,45 -57,69
PT2013IBRgESERNS2 5.1 3 18,70 -8,39 -10,56 0,42 4,63 6,08 3,94 0,17 0,93 -51,56
PT2013IBRgESERNS2 5.2 3 65,37 -26,08 -10,56 0,42 4,63 6,08 3,94 -1,22 1,75 -31,00
PT2013IBRgESERNS2 6 3 7,48 -9,50 -10,56 0,42 4,63 6,08 3,94 0,08 0,59 -28,78
PT2013IBRgESERNS2 7.1 3 11,65 4,70 -10,56 0,42 4,63 6,08 3,94 1,20 0,74 72,56
PT2013IBRgESERNS2 7.2 3 12,39 -15,86 -10,56 0,42 4,63 6,08 3,94 -0,42 0,76 -22,19
PT2013IBRgESERNS2 8 3 34,11 -27,68 -10,56 0,42 4,63 6,08 3,94 -1,34 1,26 -21,10
PT2013IBRgESERNS2 10 3 6,33 17,33 -10,56 0,42 4,63 6,08 3,94 2,19 0,54 14,52
PT2013IBRgESERNS3 1 3 27,01 -17,43 -15,55 0,32 7,05 8,56 4,85 -0,12 0,74 -29,82
PT2013IBRgESERNS3 2 3 270,27 -29,92 -15,55 0,32 7,05 8,56 4,85 -0,91 2,33 -54,94
PT2013IBRgESERNS3 3 3 12,66 -16,32 -15,55 0,32 7,05 8,56 4,85 -0,05 0,50 -21,80
PT2013IBRgESERNS3 4 3 74,07 -16,48 -15,55 0,32 7,05 8,56 4,85 -0,06 1,22 -52,21

CODA-CERVA
PT2013IBRSER 31/37This report can’t be reproduced, except in complete form, without the permission of the CODA-CERVA: CVD-ERA
Sample Labnr n_i v_i x_i_m x_g_m between_lab_coeff
STDEV_repeat
STDEV_repro
STDEV_betweenlab
h k cv
PT2013IBRgESERNS3 5.1 3 8,90 -15,22 -15,55 0,32 7,05 8,56 4,85 0,02 0,42 -19,60
PT2013IBRgESERNS3 5.2 3 0,39 -37,52 -15,55 0,32 7,05 8,56 4,85 -1,38 0,09 -1,67
PT2013IBRgESERNS3 6 3 29,96 6,26 -15,55 0,32 7,05 8,56 4,85 1,38 0,78 87,44
PT2013IBRgESERNS3 7.1 3 61,42 -9,30 -15,55 0,32 7,05 8,56 4,85 0,39 1,11 -84,25
PT2013IBRgESERNS3 7.2 3 53,82 -22,49 -15,55 0,32 7,05 8,56 4,85 -0,44 1,04 -32,62
PT2013IBRgESERNS3 8 3 7,16 -29,66 -15,55 0,32 7,05 8,56 4,85 -0,89 0,38 -9,02
PT2013IBRgESERNS3 10 3 1,00 17,00 -15,55 0,32 7,05 8,56 4,85 2,05 0,14 5,88
PT2013IBRgESERPS1 1 4 0,18 92,25 91,30 0,86 0,49 1,32 1,22 0,24 0,86 0,45
PT2013IBRgESERPS1 2 4 0,00 92,56 91,30 0,86 0,49 1,32 1,22 0,32 0,00 0,00
PT2013IBRgESERPS1 3 4 0,02 93,77 91,30 0,86 0,49 1,32 1,22 0,64 0,25 0,13
PT2013IBRgESERPS1 4 4 0,09 93,11 91,30 0,86 0,49 1,32 1,22 0,47 0,62 0,32
PT2013IBRgESERPS1 5.1 4 0,14 91,51 91,30 0,86 0,49 1,32 1,22 0,05 0,78 0,41
PT2013IBRgESERPS1 5.2 4 0,01 90,10 91,30 0,86 0,49 1,32 1,22 -0,31 0,22 0,12
PT2013IBRgESERPS1 6 4 0,54 80,57 91,30 0,86 0,49 1,32 1,22 -2,77 1,51 0,91
PT2013IBRgESERPS1 7.1 4 0,36 93,64 91,30 0,86 0,49 1,32 1,22 0,61 1,23 0,64
PT2013IBRgESERPS1 7.2 4 0,00 92,42 91,30 0,86 0,49 1,32 1,22 0,29 0,11 0,06
PT2013IBRgESERPS1 8 4 1,02 89,63 91,30 0,86 0,49 1,32 1,22 -0,43 2,07 1,13
PT2013IBRgESERPS1 10 4 0,25 94,75 91,30 0,86 0,49 1,32 1,22 0,89 1,03 0,53
PT2013IBRgESERPS2 1 4 1,43 70,03 70,40 0,65 1,99 3,38 2,74 -0,04 0,60 1,71
PT2013IBRgESERPS2 2 4 1,37 69,07 70,40 0,65 1,99 3,38 2,74 -0,15 0,59 1,69
PT2013IBRgESERPS2 3 4 6,28 72,83 70,40 0,65 1,99 3,38 2,74 0,28 1,26 3,44
PT2013IBRgESERPS2 4 4 8,24 70,28 70,40 0,65 1,99 3,38 2,74 -0,01 1,44 4,08
PT2013IBRgESERPS2 5.1 4 2,39 66,40 70,40 0,65 1,99 3,38 2,74 -0,46 0,78 2,33
PT2013IBRgESERPS2 5.2 4 10,86 60,66 70,40 0,65 1,99 3,38 2,74 -1,12 1,65 5,43
PT2013IBRgESERPS2 6 4 0,17 72,96 70,40 0,65 1,99 3,38 2,74 0,29 0,20 0,56
PT2013IBRgESERPS2 7.1 4 4,53 70,05 70,40 0,65 1,99 3,38 2,74 -0,04 1,07 3,04
PT2013IBRgESERPS2 7.2 4 0,94 68,85 70,40 0,65 1,99 3,38 2,74 -0,18 0,49 1,41

CODA-CERVA
PT2013IBRSER 32/37This report can’t be reproduced, except in complete form, without the permission of the CODA-CERVA: CVD-ERA
Sample Labnr n_i v_i x_i_m x_g_m between_lab_coeff
STDEV_repeat
STDEV_repro
STDEV_betweenlab
h k cv
PT2013IBRgESERPS2 8 4 7,20 59,99 70,40 0,65 1,99 3,38 2,74 -1,20 1,35 4,47
PT2013IBRgESERPS2 10 4 0,25 93,25 70,40 0,65 1,99 3,38 2,74 2,62 0,25 0,54
PT2013IBRgESERPS3 1 3 1,64 62,06 61,62 0,76 1,97 4,01 3,49 0,04 0,65 2,06
PT2013IBRgESERPS3 2 3 5,48 58,76 61,62 0,76 1,97 4,01 3,49 -0,26 1,19 3,98
PT2013IBRgESERPS3 3 3 0,16 61,35 61,62 0,76 1,97 4,01 3,49 -0,02 0,20 0,65
PT2013IBRgESERPS3 4 3 1,19 58,76 61,62 0,76 1,97 4,01 3,49 -0,26 0,56 1,86
PT2013IBRgESERPS3 5.1 3 1,36 56,76 61,62 0,76 1,97 4,01 3,49 -0,44 0,59 2,05
PT2013IBRgESERPS3 5.2 3 9,08 47,73 61,62 0,76 1,97 4,01 3,49 -1,25 1,53 6,31
PT2013IBRgESERPS3 6 3 1,62 67,26 61,62 0,76 1,97 4,01 3,49 0,51 0,65 1,90
PT2013IBRgESERPS3 7.1 3 3,74 64,69 61,62 0,76 1,97 4,01 3,49 0,28 0,98 2,99
PT2013IBRgESERPS3 7.2 3 6,05 58,24 61,62 0,76 1,97 4,01 3,49 -0,30 1,25 4,22
PT2013IBRgESERPS3 8 3 9,84 51,53 61,62 0,76 1,97 4,01 3,49 -0,91 1,60 6,09PT2013IBRgESERPS3 10 3 2,33 90,67 61,62 0,76 1,97 4,01 3,49 2,62 0,78 1,68
Legend: Labnr = number attributed to a laboratory during the PT; n_i = number of replicates; v_i = total variability (variance) in the normalized data (% blocking); x_i_m = mean of normalized data (%blocking); x_g_m = mean of normalized data (% blocking) obtained by all laboratories; between_lab_coeff = fraction of total variability due to differences between labs for each sample; STDEV_repeat =repeatability standard deviation over all laboratories; STDEV_repro = reproducibility standard deviation over all laboratories; STDEV_betweenlab = between-lab standard deviation over all laboratories; h-statistic = between-laboratory consistency; k-statistic = within-laboratory consistency; CV = variation coefficient in %. Values for Mandel’s h- and k-statistics shown in red/underlined/bold exceed thecorresponding limit value as determined in Annex 1 (Table 1).

CODA-CERVA
PT2013IBRSER 33/37This report can’t be reproduced, except in complete form, without the permission of the CODA-CERVA: CVD-ERA
Annex 3: Qualitative and quantitative data analysis of theadditional panel IBRgB samplesFor the PT IBRgB, an additional panel consisting of serum samples with variable qualitative results in ELISA but allnegative in SN, the reference test (golden standard) for the detection of IBRgB-specific antibodies in serum, was sent tothe participating laboratories along with the regular IBRgB PT samples. The aim was to include serum samples that scoreweak positive and cut-off in ELISA in order to achieve more information about the analytical sensitivity of the used IBRgBELISA kits by the participating laboratories. This part was out of scope of this PT according to ISO 17043, and should onlybe considered as educational information for the participants. The data analysis of these additional serum samples wasthus not used to evaluate the participants in this PT.
I. Information about the additional IBRgB serum samplesIn total, 108 aliquots of these additional serum samples were distributed to the 9 laboratories participating in the PTIBRgB. All participants received 3 aliquots of 4 different serum samples of bovine origin (PT2013IBRgBSER-S1A,PT2013IBRgBSER-S1B, PT2013IBRgBSER-S1C, PT2013IBRgBSER-S1D), i.e. 12 aliquots in total. The positions of theserum samples in the sent blocks were randomized for each participant.
The serum samples PT2013IBRgBSER-S1A, PT2013IBRgBSER-S1B, PT2013IBRgBSER-S1C and PT2013IBRgBSER-S1D were a 1/32, a 1/64, a 1/128 and a 1/256 dilution, respectively, of the reference serum samplePT2013IBRgBSERPS2 (see III.2.1). During pre-verification, all 4 additional serum samples were negative using SN andthe indirect ELISA test from LSI (LSIVET serum IBR screening), whereas variable results were obtained using theHerdChek IBRgB antibody ELISA test from IDEXX (POS - POS - NI - NEG, respectively).
After aliquoting the different serum samples, a homogeneity check was performed on 10 aliquots of each serum sampleusing the HerdChek IBRgB antibody ELISA test from IDEXX. In addition, 3 aliquots of each serum sample were testedafter the PT in order to confirm their stability and status (post-verification) using the HerdChek IBRgB antibody ELISA testfrom IDEXX.
II. Qualitative data analysisThe qualitative results reported by the participating laboratories are summarized in Table 1.
Table 1. Overview of the qualitative results reported by the participating laboratories for the 12 aliquots of additional IBRgB serumsamples.
LAB1 LAB2 LAB3.1 LAB3.2 LAB4.1 LAB4.2 LAB5.1 LAB5.2 LAB6 LAB7 LAB8 LAB9 TOTAL GRAND TOTALPT2013IBRgBSER-S1A
POS 3 3 3 3 3 3 3 3 3 0 3 3 33NI 0 0 0 0 0 0 0 0 0 3 0 0 3NEG 0 0 0 0 0 0 0 0 0 0 0 0 0
PT2013IBRgBSER-S1BPOS 3 3 3 0 3 0 3 3 2 0 3 3 26NI 0 0 0 0 0 0 0 0 0 0 0 0 0NEG 0 0 0 3 0 3 0 0 1 3 0 0 10
PT2013IBRgBSER-S1CPOS 1 1 0 0 0 0 0 1 0 0 0 0 3NI 2 2 3 0 2 0 1 0 0 0 0 0 10NEG 0 0 0 3 1 3 2 2 3 3 3 3 23
PT2013IBRgBSER-S1DPOS 0 0 0 0 0 0 0 0 0 0 0 0 0NI 0 0 0 0 0 0 0 0 0 0 0 0 0NEG 3 3 3 3 3 3 3 3 3 3 3 3 36
TOTAL 12 12 12 12 12 12 12 12 12 12 12 12POS 7 7 6 3 6 3 6 7 5 0 6 6 62NI 2 2 3 0 2 0 1 0 0 3 0 0 13NEG 3 3 3 9 4 9 5 5 7 9 6 6 69
36
36
36
144
36

CODA-CERVA
PT2013IBRSER 34/37This report can’t be reproduced, except in complete form, without the permission of the CODA-CERVA: CVD-ERA
III. Quantitative data analysisThe quantitative data analysis was performed using the statistical software programs R (box plots) and SAS 9.2.(summary statistics), all as described in Annex 1.
III.1 Box plotsBox plots of the percentages blocking per additional IBRgB serum sample and per participating (sub)laboratory weremade using the statistical software R and are shown in Figure 1.
Figure 1. Box plots showing the percentage blocking per additional IBRgB serum sample and per participating(sub)laboratory. Box plots represent the minimum value, the maximum value, the median, the lower (25%) and upper (75%) quartile,and possible outliers per sample and per laboratory. (Adapted) cut-off values applied by the participating laboratories are shown inpink (26,4-44%; LAB7), orange (35%; LAB3.2, LAB4.2, LAB6), black (45-50%; LAB8, LAB9), green (45-55%; LAB1, LAB2, LAB3.1,LAB4.1, LAB5.1), brown (55-65%; LAB5.2), respectively. LAB1, LAB2, LAB3.1, LAB4.1 and LAB5.1 performed the same incubationprotocol of the same IBRgB ELISA kit (2 different batches; LAB1, LAB2, LAB3.1 and LAB4.1 used the same batch). Also LAB3.2,LAB4.2 and LAB6 performed the same incubation protocol of the same IBRgB ELISA kit (1 batch).

CODA-CERVA
PT2013IBRSER 35/37This report can’t be reproduced, except in complete form, without the permission of the CODA-CERVA: CVD-ERA
III.2 Mandel’s h- and k-statisticsBased on Table 1 in Annex 1, the maximum absolute value for Mandel’s h-statistic is 1,83 (p=12) and the maximum valuefor Mandel’s k-statistic is 1,69 for all serum samples (p=12 and n=3).
For the detection of IBRgB-specific antibodies in the additional serum samples, 11 out of 12 participating (sub)laboratoriesobtained a satisfactory between-laboratory consistency for all serum samples. This was not the case for LAB7 whichshowed an increased value for Mandel’s h-statistic for the serum sample PT2013IBRgBSER-S1A (h=-1,92).Furthermore, 9 out of 12 participating (sub)laboratories obtained a satisfactory within-laboratory consistency for all serumsamples. This was not the case for LAB4.2, LAB5.2 and LAB8 which showed an increased value for Mandel’s k-statisticfor at least 1 serum sample: LAB4.2 for the serum samples PT2013IBRgBSER-S1A (k=1,71), PT2013IBRgBSER-S1B(k=2,40) and PT2013IBRgBSER-S1C (k=1,88), LABB5.2 for the serum samples PT2013IBRgBSER-S1C (k=1,90) andPT2013IBRgBSER-S1D (k=1,86), and LAB8 for serum sample PT2013IBRgBSER-S1A (k=1,95).
III.3 ANOVAFor the additional IBRgB serum samples, there was a significant difference between the participating laboratories at aglobal level. LAB7 reported percentages blocking that were significantly lower than those reported by LAB1, LAB2,LAB3.1, LAB4.1, LAB5.1, LAB5.2, LAB8 and LAB9. Of those laboratories that tested 2 different IBRgB ELISA kits (LAB3,LAB4 and LAB5), significant differences were observed for LAB3 and LAB4, but not for LAB5. LAB3.1 and LAB4.1obtained percentages blocking that were significantly higher than those obtained by LAB3.2 and LAB4.2, respectively.

CODA-CERVA
PT2013IBRSER 36/37This report can’t be reproduced, except in complete form, without the permission of the CODA-CERVA: CVD-ERA
Table 2. Calculations of Mandel’s h- and k-statistics (based on % blocking) for the panel additional IBRgB serum samples.
Sample Labnr n_i v_i x_i_m x_g_m between_lab_coeff
STDEV_repeat
STDEV_repro
STDEV_betweenlab
h k cv
PT2013IBRgBSER-S1A 1 3 0,63 90,54 69,98 0,93 1,84 6,87 6,62 0,94 0,43 0,88
PT2013IBRgBSER-S1A 2 3 0,36 90,52 69,98 0,93 1,84 6,87 6,62 0,93 0,33 0,66
PT2013IBRgBSER-S1A 3.1 3 0,33 88,01 69,98 0,93 1,84 6,87 6,62 0,82 0,31 0,65
PT2013IBRgBSER-S1A 3.2 3 1,14 46,49 69,98 0,93 1,84 6,87 6,62 -1,07 0,58 2,30
PT2013IBRgBSER-S1A 4.1 3 0,25 86,71 69,98 0,93 1,84 6,87 6,62 0,76 0,27 0,57
PT2013IBRgBSER-S1A 4.2 3 9,89 44,95 69,98 0,93 1,84 6,87 6,62 -1,14 1,71 7,00
PT2013IBRgBSER-S1A 5.1 3 2,75 83,01 69,98 0,93 1,84 6,87 6,62 0,59 0,90 2,00
PT2013IBRgBSER-S1A 5.2 3 0,42 86,51 69,98 0,93 1,84 6,87 6,62 0,75 0,35 0,75
PT2013IBRgBSER-S1A 6 3 8,19 49,00 69,98 0,93 1,84 6,87 6,62 -0,95 1,55 5,84
PT2013IBRgBSER-S1A 7 3 0,89 27,86 69,98 0,93 1,84 6,87 6,62 -1,92 0,51 3,39
PT2013IBRgBSER-S1A 8 3 12,90 75,21 69,98 0,93 1,84 6,87 6,62 0,24 1,95 4,78
PT2013IBRgBSER-S1A 9 3 2,92 70,94 69,98 0,93 1,84 6,87 6,62 0,04 0,93 2,41
PT2013IBRgBSER-S1B 1 3 1,17 74,35 52,80 0,81 3,27 7,54 6,79 0,95 0,33 1,46
PT2013IBRgBSER-S1B 2 3 0,52 73,60 52,80 0,81 3,27 7,54 6,79 0,92 0,22 0,98
PT2013IBRgBSER-S1B 3.1 3 8,88 71,83 52,80 0,81 3,27 7,54 6,79 0,84 0,91 4,15
PT2013IBRgBSER-S1B 3.2 3 13,05 28,22 52,80 0,81 3,27 7,54 6,79 -1,09 1,11 12,80
PT2013IBRgBSER-S1B 4.1 3 7,02 64,84 52,80 0,81 3,27 7,54 6,79 0,53 0,81 4,09
PT2013IBRgBSER-S1B 4.2 3 61,54 22,62 52,80 0,81 3,27 7,54 6,79 -1,33 2,40 34,68
PT2013IBRgBSER-S1B 5.1 3 2,81 65,23 52,80 0,81 3,27 7,54 6,79 0,55 0,51 2,57
PT2013IBRgBSER-S1B 5.2 3 6,36 75,87 52,80 0,81 3,27 7,54 6,79 1,02 0,77 3,32
PT2013IBRgBSER-S1B 6 3 5,62 34,06 52,80 0,81 3,27 7,54 6,79 -0,83 0,73 6,96
PT2013IBRgBSER-S1B 7 3 9,18 12,40 52,80 0,81 3,27 7,54 6,79 -1,79 0,93 24,42
PT2013IBRgBSER-S1B 8 3 4,77 52,13 52,80 0,81 3,27 7,54 6,79 -0,03 0,67 4,19
PT2013IBRgBSER-S1B 9 3 7,12 58,45 52,80 0,81 3,27 7,54 6,79 0,25 0,82 4,56
PT2013IBRgBSER-S1C 1 3 0,94 54,05 37,23 0,58 4,23 6,53 4,98 1,01 0,23 1,79
PT2013IBRgBSER-S1C 2 3 6,12 53,95 37,23 0,58 4,23 6,53 4,98 1,00 0,59 4,59

CODA-CERVA
PT2013IBRSER 37/37This report can’t be reproduced, except in complete form, without the permission of the CODA-CERVA: CVD-ERA
Table 2. Calculations of Mandel’s h- and k-statistics (based on % blocking) for the panel additional IBRgB serum samples. (continued)
Sample Labnr n_i v_i x_i_m x_g_m between_lab_coeff
STDEV_repeat
STDEV_repro
STDEV_betweenlab
h k cv
PT2013IBRgBSER-S1C 3.1 3 0,99 48,43 37,23 0,58 4,23 6,53 4,98 0,67 0,24 2,06
PT2013IBRgBSER-S1C 3.2 3 5,31 18,46 37,23 0,58 4,23 6,53 4,98 -1,13 0,55 12,49
PT2013IBRgBSER-S1C 4.1 3 6,39 46,37 37,23 0,58 4,23 6,53 4,98 0,55 0,60 5,45
PT2013IBRgBSER-S1C 4.2 3 63,01 17,24 37,23 0,58 4,23 6,53 4,98 -1,20 1,88 46,06
PT2013IBRgBSER-S1C 5.1 3 12,59 44,71 37,23 0,58 4,23 6,53 4,98 0,45 0,84 7,94
PT2013IBRgBSER-S1C 5.2 3 64,43 55,36 37,23 0,58 4,23 6,53 4,98 1,09 1,90 14,50
PT2013IBRgBSER-S1C 6 3 32,51 18,16 37,23 0,58 4,23 6,53 4,98 -1,14 1,35 31,41
PT2013IBRgBSER-S1C 7 3 1,76 9,88 37,23 0,58 4,23 6,53 4,98 -1,64 0,31 13,43
PT2013IBRgBSER-S1C 8 3 17,63 36,57 37,23 0,58 4,23 6,53 4,98 -0,04 0,99 11,48
PT2013IBRgBSER-S1C 9 3 2,60 43,63 37,23 0,58 4,23 6,53 4,98 0,38 0,38 3,69
PT2013IBRgBSER-S1D 1 3 1,21 37,51 26,72 0,35 4,54 5,63 3,32 0,95 0,24 2,93
PT2013IBRgBSER-S1D 2 3 2,05 37,30 26,72 0,35 4,54 5,63 3,32 0,93 0,31 3,84
PT2013IBRgBSER-S1D 3.1 3 1,46 34,70 26,72 0,35 4,54 5,63 3,32 0,71 0,27 3,48
PT2013IBRgBSER-S1D 3.2 3 1,80 14,63 26,72 0,35 4,54 5,63 3,32 -1,07 0,30 9,16
PT2013IBRgBSER-S1D 4.1 3 7,06 32,56 26,72 0,35 4,54 5,63 3,32 0,52 0,59 8,16
PT2013IBRgBSER-S1D 4.2 3 25,71 15,16 26,72 0,35 4,54 5,63 3,32 -1,02 1,12 33,45
PT2013IBRgBSER-S1D 5.1 3 36,78 32,89 26,72 0,35 4,54 5,63 3,32 0,54 1,34 18,44
PT2013IBRgBSER-S1D 5.2 3 71,04 36,92 26,72 0,35 4,54 5,63 3,32 0,90 1,86 22,83
PT2013IBRgBSER-S1D 6 3 30,00 11,67 26,72 0,35 4,54 5,63 3,32 -1,33 1,21 46,95
PT2013IBRgBSER-S1D 7 3 4,47 6,95 26,72 0,35 4,54 5,63 3,32 -1,75 0,47 30,42
PT2013IBRgBSER-S1D 8 3 15,94 27,15 26,72 0,35 4,54 5,63 3,32 0,04 0,88 14,71
PT2013IBRgBSER-S1D 9 3 50,06 33,23 26,72 0,35 4,54 5,63 3,32 0,58 1,56 21,29
Legend: Labnr = number attributed to a laboratory during the PT; n_i = number of replicates; v_i = total variability (variance) in the normalized data (% blocking); x_i_m = mean of normalized data (%blocking); x_g_m = mean of normalized data (% blocking) obtained by all laboratories; between_lab_coeff = fraction of total variability due to differences between labs for each sample; STDEV_repeat =repeatability standard deviation over all laboratories; STDEV_repro = reproducibility standard deviation over all laboratories; STDEV_betweenlab = between-lab standard deviation over all laboratories; h-statistic = between-laboratory consistency; k-statistic = within-laboratory consistency; CV = variation coefficient in %. Values for Mandel’s h- and k-statistics shown in red/underlined/bold exceed thecorresponding limit value as determined in Annex 1 (Table 1).