![What Can a Professional Employer Organization (PEO) Do for Your Business? [Infographic]](https://static.fdocuments.net/doc/165x107/55a8ca411a28ab1f628b467f/what-can-a-professional-employer-organization-peo-do-for-your-business-infographic.jpg)
What Can a Professional Employer Organization (PEO) Do for Your Business? [Infographic]

2012 NCCI Holdings, Inc.
Professional Employer Organizations(PEO) and Workers Compensation
Implications for Ratemaking
Harry ShufordPractice Leader & Chief Economist, NCCI
Use of Workers Compensation Data for Workplace Safety and Health
Washington, DCJune 19-20, 2012

2012 NCCI Holdings, Inc.
1
Today’s Presentation
Background on PEOs and the Labor Market
PEO Services
State Regulation of PEOs
Background on PEOs and Workers Compensation
Regulation of PEOs in Workers Compensation
Objectives of Actuarial Ratemaking
Comparing WC Claims Experience – PEOs and All Other
• 2004 - 2009
• Broken down by industry group in policy year 2007
Preliminary Observations

2012 NCCI Holdings, Inc.
2
Background on PEOs
• PEO services
− employee benefits
− payroll
− workers’ compensation
− risk management
− recruiting
− training and development
• “Employer of record” for the leased workers from a PEO client
company

NAPEO Contends that PEOs Create Safer Work Environments
-Effective safety practices such as:• pre-employment drug tests,• loss control and safety procedures, • claims management of injuries, • safety training, • employee assistance plans, • back-to-work programs, and • drug-free workplace programs
- According to NAPEO many of these safety practices are new to the typical PEO client-a small to mid-sized business without the time, expertise, or resources to cater to worker safety concerns
PEOs in Workers Compensation a Good Thing?
3
Source: National Association of Professional Employer Organizations (NAPEO) ©NAPEO 2012. Used with permission.

2012 NCCI Holdings, Inc.
Licensing
4
The Number of States Requiring Licensing of PEOs Has Grown Steadily:

5
Licensing States Map 1991 & 1995
Added in 1995
Source: National Association of Professional Employer Organizations (NAPEO) ©NAPEO 2012. Used with permission.

Licensing States Map2000 & 2005
Added in 2000
Added in 2005
6
Source: National Association of Professional Employer Organizations (NAPEO) ©NAPEO 2012. Used with permission.

Licensing States List2012
Current StatusAL, AZ, AR, CO, CT, FL, HI, ID, IL, IN, KY, LA, ME, MI, MN, MT, NE, NV, NH, NJ, NM, NY, NC, ND, OH, OK, OR, RI, SC, TN, TX, UT, VT, VA, WV, WI
CA, PA
Added in 2012
7
Source: National Association of Professional Employer Organizations (NAPEO) ©NAPEO 2012. Used with permission.

2012 NCCI Holdings, Inc.
8
One to Two Percent of Insured Payroll in Voluntary Market Is from PEOsResidual Market Share Has Been Approximately Four Percent
There Was a Marked Decline over the Great Recession
CA, DE, MA, MI, MN, NJ, NY, NC, ND, OH,PA, WA, WI, and WY are excluded in voluntary market analysis AK, AL, AR, AZ, CT, DC, GA, ID, IL, IN, IA, KS, MS, MO, NE, NV, NH, NM, OR, SC, SD, TN, VT, VA, and WV are included in residual market analysis NCCI is not the residual market plan administrator in IN, TN, MO, and NE
1.7%2.0%
2.1%2.0% 1.9%
1.8%
6.7%
3.7%
4.3%
4.9%
4.2%
2.3%
1.0%1.2%
1.5%1.1% 1.1% 1.1%
0.0%
1.0%
2.0%
3.0%
4.0%
5.0%
6.0%
7.0%
8.0%
2004 2005 2006 2007 2008 2009
PEO
Pay
roll
Shar
e
Policy Year
Voluntary Market PEO Payroll Share in 37 NCCI Ratemaking States
Residual Market PEO Payroll Share in 25 NCCI Ratemaking States
Voluntary Market PEO Payroll Share in 25 NCCI Ratemaking States

2012 NCCI Holdings, Inc.
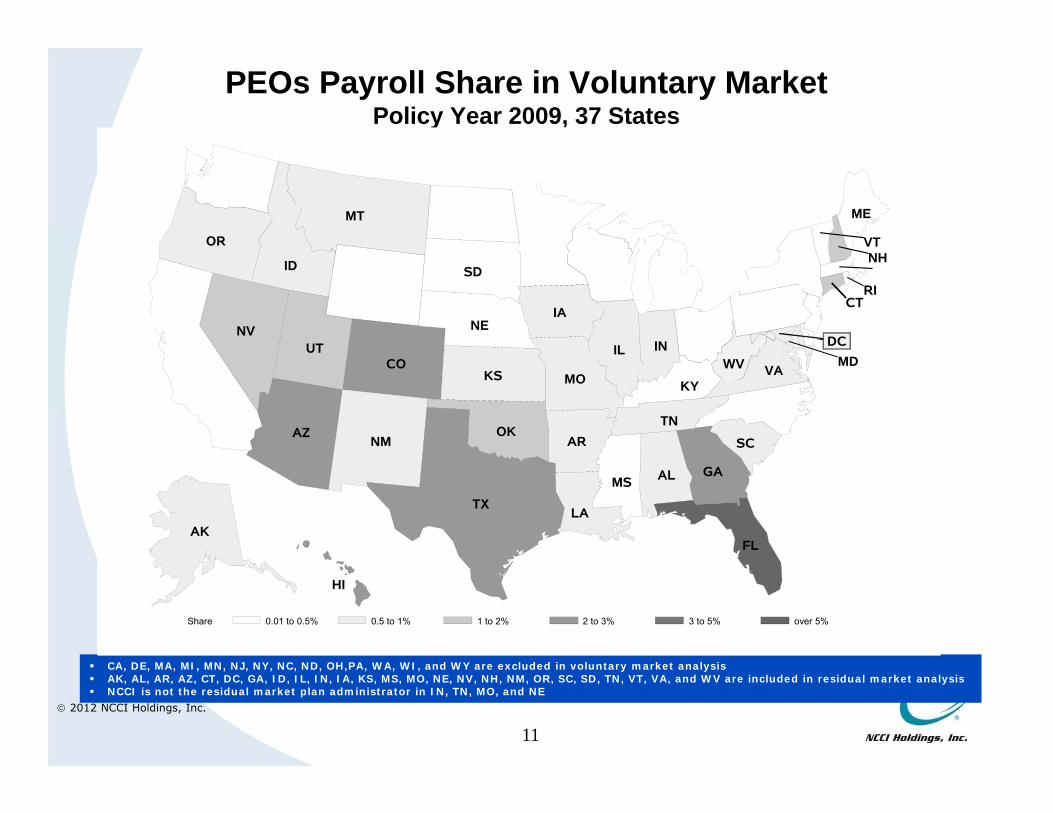
Workers Compensation Data Indicate thatThe Role of PEOs Varies Greatly Across States
and Between the Voluntary and Residual Markets
10
2012 NCCI Holdings, Inc.
11
PEOs Payroll Share in Voluntary MarketPolicy Year 2009, 37 States
CA, DE, MA, MI, MN, NJ, NY, NC, ND, OH,PA, WA, WI, and WY are excluded in voluntary market analysis AK, AL, AR, AZ, CT, DC, GA, ID, IL, IN, IA, KS, MS, MO, NE, NV, NH, NM, OR, SC, SD, TN, VT, VA, and WV are included in residual market analysis NCCI is not the residual market plan administrator in IN, TN, MO, and NE
Share 0.01 to 0.5% 0.5 to 1% 1 to 2% 2 to 3% 3 to 5% over 5%
AL
AK
AZ AR
CO
CT
FL
GA
HI
ID
IL IN
IA
KSKY
LA
ME
MD
MS
MO
MT
NENV
NH
NMOK
OR
RI
SC
SD
TN
TX
UT
VT
VAWV
DC

2012 NCCI Holdings, Inc.
13
PEOs Payroll Share in Residual MarketPolicy Year 2009, 25 States
Share 0.01 to 0.5% 0.5 to 1% 1 to 2% 2 to 3% 3 to 5% over 5%
AL
AK
AZ AR
CT
GA
ID
IL IN
IA
KS
MS
MO
NENV
NH
NM
OR
SC
SD
TN
VT
VAWVDC
CA, DE, MA, MI, MN, NJ, NY, NC, ND, OH,PA, WA, WI, and WY are excluded in voluntary market analysis AK, AL, AR, AZ, CT, DC, GA, ID, IL, IN, IA, KS, MS, MO, NE, NV, NH, NM, OR, SC, SD, TN, VT, VA, and WV are included in residual market analysis NCCI is not the residual market plan administrator in IN, TN, MO, and NE

2012 NCCI Holdings, Inc.
Workers Compensation Data Suggest thatthe PEO Market is Highly Concentrated
14

2012 NCCI Holdings, Inc.
15
National PEOs Account for the Majority PEO Activity
222.9
693.4
9.7 8.622.9
79.2
0.0
100.0
200.0
300.0
400.0
500.0
600.0
700.0
800.0
PEOs National PEOs
Number Workers per PEO Master Policy
Number of Workers per PEO Client
Number of Clients per PEO
Master PEO policy data is used National PEOs list was based on membership list at napeo.org in April, 2012 Source: NCCI, National Association of Professional Employer Organizations (NAPEO) ©NAPEO 2012. Used with permission.

2012 NCCI Holdings, Inc.
15 Largest PEO Companies Comprise Approximately Two Thirds Market;National PEOs Members Make up Majority of PEO Industry
Policy Year 2009 Data
48.8%
8.5%2.6%
Top 5
Next 5
Next 5
Other
PEO policy models – Master policy, MCP policies, Multiple PEO policies, and PEO direct employee policies are included National PEOs list was based on membership list at napeo.org in April, 2012 MCP policies may not have PEO information as named insured; NCCI 37 ratemaking states only Source: NCCI, National Association of Professional Employer Organizations (NAPEO) ©NAPEO 2012. Used with permission.
16

2012 NCCI Holdings, Inc.
Background on PEOs and Workers Compensation
17

2012 NCCI Holdings, Inc.
18
PEO State Regulation of PEOs:Workers Compensation
• In 1992, NCCI filed Item B-1276—Employee Leasing Arrangements to
provide rules and policy forms for employee arrangements in workers
compensation markets. Most states implemented, some states passed
modified versions, and some states have yet to implement.
• In July 2005, NCCI filed Item RM-W-8027 for residual market requiring
MCP* PEO policy model when underwriting PEO policy. Most states have
implemented.
• Overall, there is no national “NCCI rule” for underwriting policies of PEO
arrangements in the voluntary market.
MCP refers to multiple coordinated policy form; the MCP is described on the next slide

2012 NCCI Holdings, Inc.
19
PEO Policy Models• Master Policy
− A single policy that covers the leased workers of a PEO’s client companies with the
PEO as the primary insured; the client companies may be attached to the policy by
endorsement; may also cover PEO direct employees
• Multiple Coordinated Client Policies (MCP)
− A separate policy to cover the leased workers of single PEO client company with the
client as the primary insured
• Multiple PEO Policies
− A separate policy to cover the leased workers of single PEO client company with the
PEO as the primary insured making reference to the client company

2012 NCCI Holdings, Inc.
20
Recent Trends in the Voluntary Market: Multiple PEO Policy Has Been Substituting MCP for Client Policies
96.5%
97.0%
97.5%
98.0%
98.5%
99.0%
99.5%
100.0%
2004 2005 2006 2007 2008 2009
Multiple PEO PolicyMCP PolicyMaster PolicyPEO Direct Employee PolicyClient Direct Purchase PolicyNon-Leased Workers Client PolicyNon-PEO Policy

2012 NCCI Holdings, Inc.
21
Recent Trends in the Residual Market: Master Policy Share Has Declined Since 2005
88.0%
90.0%
92.0%
94.0%
96.0%
98.0%
100.0%
2004 2005 2006 2007 2008 2009
Multiple PEO PolicyMCP PolicyMaster PolicyPEO Direct Employee PolicyClient Direct Purchase PolicyNon-Leased Workers Client PolicyNon-PEO Policy

2012 NCCI Holdings, Inc.
22
Comparing PEO WC PoliciesIn All Cases
PEO Clients Appear to be Small Businesses
222.9
6.7 9.219.4
9.722.9
0.0
50.0
100.0
150.0
200.0
250.0
Master PEO Policy MCP Client Policy Multiple PEO Policy Non-PEO Policies
Average # Workers per Policy
Average # of Workers per Client
Average # of Clients per PEO

2012 NCCI Holdings, Inc.
In the Voluntary Market in 2009Most PEO Leased Workers Are Covered Under Master Policies
37 NCCI Ratemaking States
Master PEO Policy80.7%
Multiple PEO Policy13.7%
MCP Client Policy4.0%
PEO Direct Employee Policy1.5%
23

2012 NCCI Holdings, Inc.
25
In the Residual Market in 2009Many More Workers Are Covered Under MCP or Multiple PEO Policies
25 NCCI Ratemaking States
Master PEO Policy49.7%
Multiple PEO Policy18.7%
MCP Client Policy28.2%
PEO Direct Employee Policy3.5%

2012 NCCI Holdings, Inc.
26
Wide Variation Across States in the Voluntary MarketPEO Payroll Share by Policy Type
2009 Policy Year
VOL
0.0%
1.0%
2.0%
3.0%
4.0%
5.0%
6.0%
7.0%
09FL
42TX
02AZ
05CO
52HI
10GA
VOL 27NV
43UT
35OK
06CT
28NH
47WV
12IL
01AL
41TN
39SC
24MO
45VA
03AR
08DC
25MT
19MD
54AK
30NM
15KS
36OR
17LA
11ID
13IN
14IA
26NE
18ME
16KY
38RI
23MS
40SD
44VT
PEO Direct Employee Policy Master Policy MCP Client Policy Multiple PEO Policy
2012 NCCI Holdings, Inc.
28
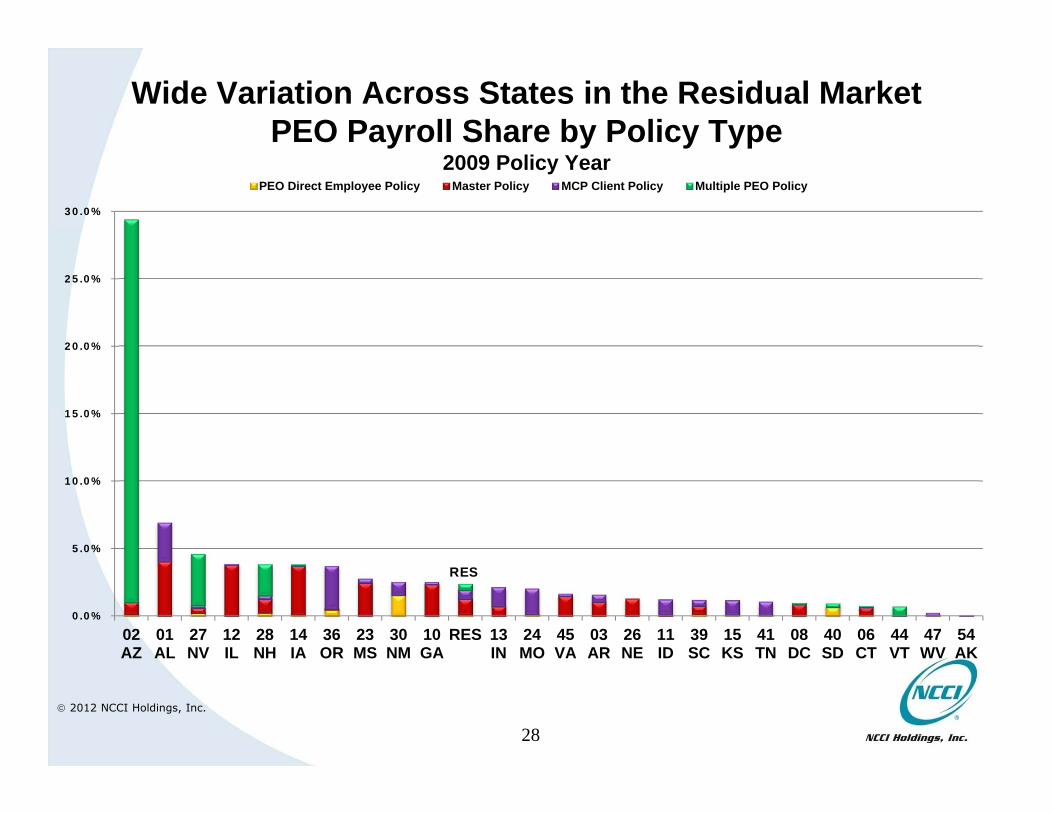
RES
0.0%
5.0%
10.0%
15.0%
20.0%
25.0%
30.0%
02AZ
01AL
27NV
12IL
28NH
14IA
36OR
23MS
30NM
10GA
RES 13IN
24MO
45VA
03AR
26NE
11ID
39SC
15KS
41TN
08DC
40SD
06CT
44VT
47WV
54AK
PEO Direct Employee Policy Master Policy MCP Client Policy Multiple PEO Policy
Wide Variation Across States in the Residual MarketPEO Payroll Share by Policy Type
2009 Policy Year

2012 NCCI Holdings, Inc.
29
Implications of PEOs for Workers Compensation Ratemaking
2012 NCCI Holdings, Inc.
30
Actuarial Ratemaking
Premium rates should be:
• Neither Excessive
• Nor Inadequate
• Nor Unfairly Discriminatory

2012 NCCI Holdings, Inc.
31
Actuarial Ratemaking
Aggregate Ratemaking:
• Neither Excessive
• Nor Inadequate
Requires Aggregated State Level Data
• Financial Call Data
2012 NCCI Holdings, Inc.
32
Actuarial Ratemaking
Class Ratemaking and Experience Rating:
• Nor Unfairly Discriminatory
Requires Detailed Claim Data by Individual Insured Employer
• Unit Data

2012 NCCI Holdings, Inc.
33
Potential Ratemaking Concerns Related to PEOsHow These Compare with Concerns in BLS Data
• Incorrectly Classified Payroll
[BLS – inaccurate counts of employment by occupation]
• Underreporting of Claims
[BLS SOII – Underreporting of injuries]
• Bulk Reporting of Claim Experience
[BLS SOII – Inability to Estimate Injury Rates by
Occupation/Industry]
• Difficulty in tracking the experience rating modification

2012 NCCI Holdings, Inc.
Does PEO Claim Experience Differ Materially from Non-PEO Experience?
34

2012 NCCI Holdings, Inc.
Market Segments• Voluntary market analysis includes 37 NCCI ratemaking states
• Residual market analysis includes 25 NCCI ratemaking states:
− 21 NCCI Plan states
− IN, TN, MO, and NE where NCCI is not the Plan Administrator
• “PEOs” in our data analysis refers to workers covered in PEO:− Master policy− MCP policies− Multiple PEO policies− PEO direct employees
CA, DE, MA, MI, MN, NJ, NY, NC, ND, OH,PA, WA, WI, and WY are excluded in voluntary market analysis AK, AL, AR, AZ, CT, DC, GA, ID, IL, IN, IA, KS, MS, MO, NE, NV, NH, NM, OR, SC, SD, TN, VT, VA, and WV are included in residual market analysis NCCI is not the residual market plan administrator in IN, TN, MO, and NE
35
2012 NCCI Holdings, Inc.
36
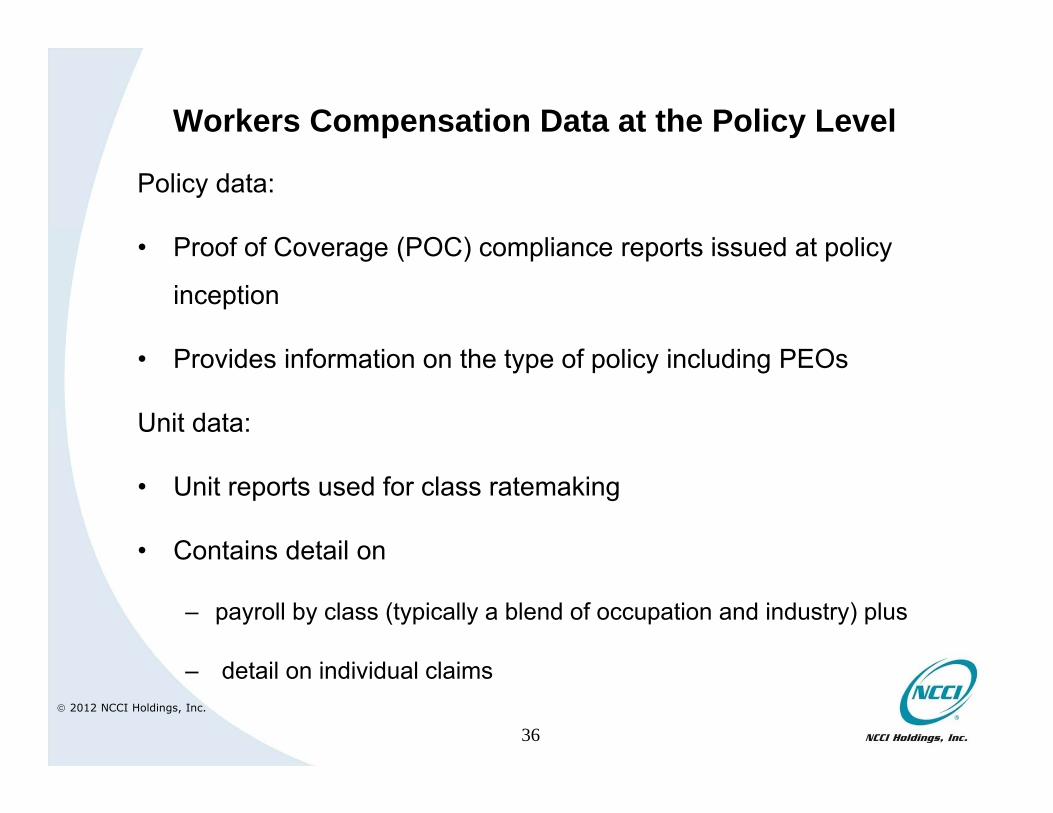
Workers Compensation Data at the Policy Level
Policy data:
• Proof of Coverage (POC) compliance reports issued at policy
inception
• Provides information on the type of policy including PEOs
Unit data:
• Unit reports used for class ratemaking
• Contains detail on
– payroll by class (typically a blend of occupation and industry) plus
– detail on individual claims

2012 NCCI Holdings, Inc.
37
Data Used in This Analysis
• NCCI policy and unit data in policy years 2004–2010
• Industry group level data in policy year 2007
• Losses are evaluated at 2nd report
• PEO policy type is as reported in the policy data

2012 NCCI Holdings, Inc.
PEO Loss Experience in Workers Compensation

2012 NCCI Holdings, Inc.
38
Loss Experience for 2004-2009: PEOs versus Non-PEO Policies

2012 NCCI Holdings, Inc.
39
Key Measures of Workers Compensation Loss Experience
EstimatedNumberofWorkersinThousands PayrollAWW ∗ 52 ∗ 1000LostTimeClaimsFrequency NumberofLostTimeClaimsNumberofWorkersinThousandsLostTimeClaimsSeverity IncurredLossesonLostTimeClaimsNumberofLostTimeClaimsLostTimeClaimsLossRatio IncurredLossesonLostTimeClaimsManualorModifiedPremium

2012 NCCI Holdings, Inc.
Loss Experience for 2004-2009: PEOs versus Non-PEO Policies
Frequency in the Voluntary Market
40

2012 NCCI Holdings, Inc.
42
In the Voluntary MarketFrequency Is Higher for PEOs than for Non-PEOS
Voluntary Market, 2004-2009, @2nd Report
0.0
2.0
4.0
6.0
8.0
10.0
12.0
14.0
16.0
18.0
2004 2005 2006 2007 2008 2009P
Lost
Tim
e C
laim
s Fr
eque
ncy
per 1
000
Wor
kers
Policy Year
Non-PEO Large Deductible Non-PEO Other than Large DeductiblePEOs Large Deductible PEOs Other than Large Deductible

2012 NCCI Holdings, Inc.
43
Loss Experience for 2004-2009: PEOs versus Non-PEO Policies
Voluntary Market – Large Deductible(Typically Master Policies for PEOs, Larger
Employers for Non-PEOs)

2012 NCCI Holdings, Inc.
44
In the Voluntary Market Frequency Has DeclinedBut PEOs Higher than Non-PEOs
Large Deductible Policies(Typically Master Policies for PEOs; Larger Employers for Non-PEOs)
2004-2009, @2nd Report
10.39.7
9.2 8.98.1 7.8
16.315.7
14.1
11.110.4
9.2
0.0
2.0
4.0
6.0
8.0
10.0
12.0
14.0
16.0
18.0
2004 2005 2006 2007 2008 2009P
Lost
Tim
e C
laim
s Fr
eque
ncy
per 1
000
Wor
kers
Policy Year
Lost Time Claims Frequency per 1000 WorkersNon-PEOs PEOs

2012 NCCI Holdings, Inc.
45
In the Voluntary Market Severity Trends for PEOs and Non-PEOs Are Comparable
Large Deductible Policies(Typically Master Policies for PEOs; Larger Employers for Non-PEOs)
2004-2009, @2nd Report
27.2 27.629.1
31.3
34.132.0
23.0
26.9 27.5
34.235.4
30.7
0.0
5.0
10.0
15.0
20.0
25.0
30.0
35.0
40.0
2004 2005 2006 2007 2008 2009P
Lost
Tim
e C
laim
s Se
verit
yin
Tho
usan
ds
Policy Year
Lost Time Claims Severity in ThousandsNon-PEOs PEOs

2012 NCCI Holdings, Inc.
46
In the Voluntary Market Manual Premium Loss Ratios for PEOs Have Increased Relative to Non-PEOs
Large Deductible Policies(Typically Master Policies for PEOs; Larger Employers for Non-PEOs)
2004-2009, @2nd Report
0.30
0.28 0.280.30
0.32 0.32
0.24
0.28 0.29
0.31
0.37
0.41
0.00
0.05
0.10
0.15
0.20
0.25
0.30
0.35
0.40
0.45
2004 2005 2006 2007 2008 2009P
Lost
Tim
e C
laim
s Lo
ss R
atio
by M
anua
l Pre
miu
m
Policy Year
Lost Time Claims Loss Ratio – Manual PremiumNon-PEOs PEOs

2012 NCCI Holdings, Inc.
47
In the Voluntary Market Modified Premium Loss Ratios for PEOs Have Been Lower than for Non-PEOs
Large Deductible Policies(Typically Master Policies for PEOs; Larger Employers for Non-PEOs)
2004-2009, @2nd Report
0.330.32
0.33
0.360.39
0.38
0.250.27
0.29
0.34
0.39
0.43
0.00
0.05
0.10
0.15
0.20
0.25
0.30
0.35
0.40
0.45
2004 2005 2006 2007 2008 2009P
Lost
Tim
e C
laim
s Lo
ss R
atio
by M
odifi
ed P
rem
ium
Policy Year
Lost Time Claims Loss Ratio – Modified PremiumNon-PEOs PEOs

2012 NCCI Holdings, Inc.
48
Loss Experience for 2004-2009: PEOs versus Standard Policies
Voluntary Market – Other than Large Deductible Policies
Typically Smaller Employers
2012 NCCI Holdings, Inc.
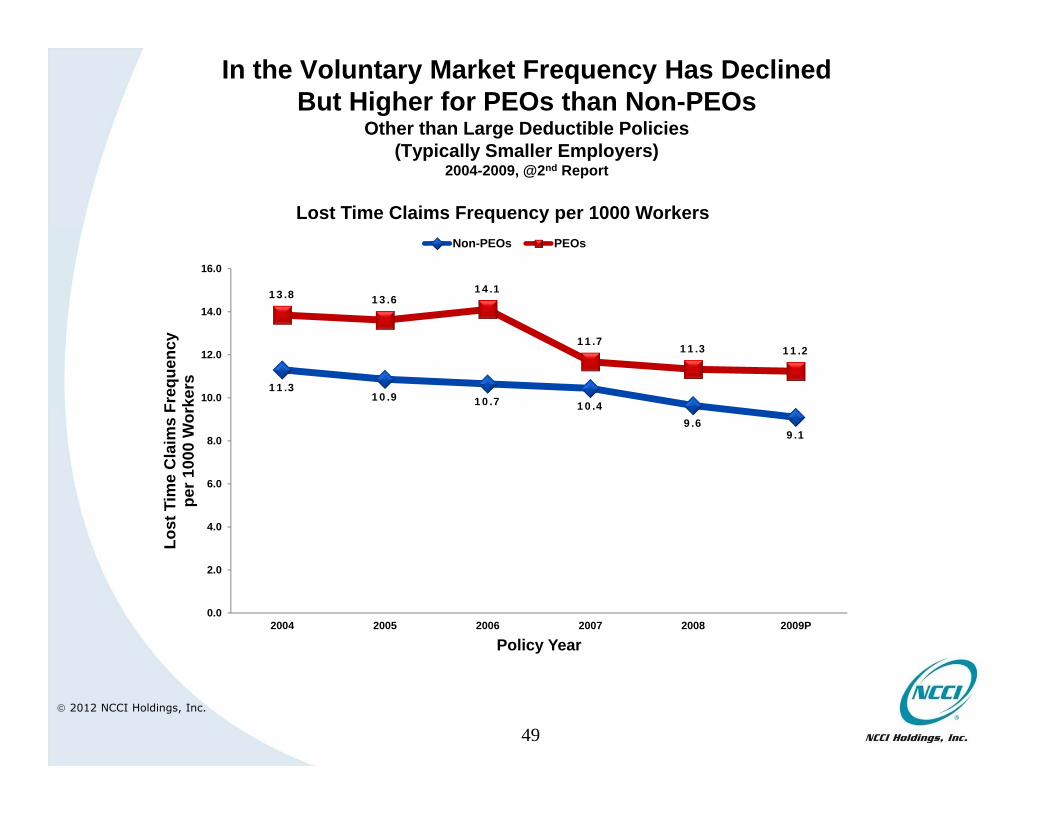
49
In the Voluntary Market Frequency Has DeclinedBut Higher for PEOs than Non-PEOs
Other than Large Deductible Policies(Typically Smaller Employers)
2004-2009, @2nd Report
11.310.9 10.7 10.4
9.69.1
13.8 13.614.1
11.711.3 11.2
0.0
2.0
4.0
6.0
8.0
10.0
12.0
14.0
16.0
2004 2005 2006 2007 2008 2009P
Lost
Tim
e C
laim
s Fr
eque
ncy
per 1
000
Wor
kers
Policy Year
Lost Time Claims Frequency per 1000 WorkersNon-PEOs PEOs

2012 NCCI Holdings, Inc.
50
In the Voluntary Market Severity Trends Are Comparable But Severity Lower for PEOs than Non-PEOs
Other than Large Deductible Policies(Typically Smaller Employers)
2004-2009, @2nd Report
29.430.7
32.534.3
37.236.2
26.2
29.430.4
28.1
32.533.4
0.0
5.0
10.0
15.0
20.0
25.0
30.0
35.0
40.0
2004 2005 2006 2007 2008 2009P
Lost
Tim
e C
laim
s Se
verit
yin
Tho
usan
ds
Policy Year
Lost Time Claims Severity in ThousandsNon-PEOs PEOs

2012 NCCI Holdings, Inc.
51
In the Voluntary Market Manual Premium Loss Ratio Trends Are Comparable for PEOs and Non-PEOs
Other than Large Deductible Policies(Typically Smaller Employers)
2004-2009, @2nd Report
0.34
0.33 0.34
0.36
0.39
0.39
0.32
0.34 0.35
0.29
0.36
0.42
0.00
0.05
0.10
0.15
0.20
0.25
0.30
0.35
0.40
0.45
0.50
2004 2005 2006 2007 2008 2009P
Lost
Tim
e C
laim
s Lo
ss R
atio
by M
anua
l Pre
miu
m
Policy Year
Lost Time Claims Loss Ratio – Manual PremiumNon-PEOs PEOs

2012 NCCI Holdings, Inc.
52
In the Voluntary Market Modified Premium Loss Ratio Trends Are Comparable for PEOs and Non-PEOs
Other than Large Deductible Policies(Typically Smaller Employers)
2004-2009, @2nd Report
0.36
0.35 0.35
0.38
0.41
0.41
0.32
0.36 0.36
0.31
0.38
0.43
0.00
0.05
0.10
0.15
0.20
0.25
0.30
0.35
0.40
0.45
0.50
2004 2005 2006 2007 2008 2009P
Lost
Tim
e C
laim
s Lo
ss R
atio
by M
odifi
ed P
rem
ium
Policy Year
Lost Time Claims Loss Ratio – Modified PremiumNon-PEO PEOs

2012 NCCI Holdings, Inc.
53
Loss Experience for 2004-2009: PEOs versus Standard Policies
Residual Market

2012 NCCI Holdings, Inc.
54
In the Residual Market Frequency Has Been Higher for PEOs than for Non-PEOs
Both Exhibit Slight Downtrends2004-2009, @2nd Report
22.3 21.9 21.9 21.620.0 20.1
30.5
28.026.7
29.0
25.727.0
0.0
5.0
10.0
15.0
20.0
25.0
30.0
35.0
2004 2005 2006 2007 2008 2009P
Lost
Tim
e C
laim
s Fr
eque
ncy
per 1
000
Wor
kers
Policy Year
Lost Time Claims Frequency per 1000 WorkersNon-PEOs PEOs

2012 NCCI Holdings, Inc.
55
In the Residual Market Severity Has Been Higher for Non-PEOs than for PEOs
Both Exhibit a Marked Uptrend*
2004-2009, @2nd Report
36.1
40.8
44.8
52.8
56.0
46.1
23.7
27.8 27.929.2
42.7
34.7
0.0
10.0
20.0
30.0
40.0
50.0
60.0
2004 2005 2006 2007 2008 2009P
Lost
Tim
e C
laim
s Se
verit
yin
Tho
usan
ds
Policy Year
Lost Time Claims Severity in ThousandsNon-PEOs PEOs
The data for 2009 is preliminary and reflects the impact of the recession on the results of that policy year

2012 NCCI Holdings, Inc.
56
In the Residual Market Manual Premium Loss Ratios Often Have Been Lower for PEOs than for Non-PEOs
2004-2009, @2nd Report
0.55 0.56 0.57
0.66
0.68
0.60
0.520.49 0.50
0.54
0.74
0.63
0.00
0.10
0.20
0.30
0.40
0.50
0.60
0.70
0.80
2004 2005 2006 2007 2008 2009P
Lost
Tim
e C
laim
s Lo
ss R
atio
by M
anua
l Pre
miu
m
Policy Year
Lost Time Claims Loss Ratio – Manual PremiumNon-PEOs PEOs

2012 NCCI Holdings, Inc.
57
In the Residual Market Modified Premium Loss Ratios Often Have Been Lower for PEOs than for Non-PEOs
2004-2009, @2nd Report
0.52 0.53 0.55
0.64
0.66
0.58
0.490.47 0.48
0.50
0.69
0.59
0.00
0.10
0.20
0.30
0.40
0.50
0.60
0.70
0.80
2004 2005 2006 2007 2008 2009P
Lost
Tim
e C
laim
s Lo
ss R
atio
by M
odifi
ed P
rem
ium
Policy Year
Lost Time Claims Loss Ratio – Modified PremiumNon-PEO PEOs

2012 NCCI Holdings, Inc.
58
Loss Experience for 2007 by Industry Group: PEO versus Non-PEO Policies
Voluntary Market

2012 NCCI Holdings, Inc.
59
In the Voluntary Market in 2007 Most PEO Leased Workers Were Covered Under Master Policies
Master PEO Policy75.3%
Multiple PEO Policy11.6%
MCP Client Policy12.4%
PEO Direct Employee Policy0.7%
CA, DE, MA, MI, MN, NJ, NY, NC, ND, OH,PA, WA, WI, and WY are excluded in voluntary market analysis AK, AL, AR, AZ, CT, DC, GA, ID, IL, IN, IA, KS, MS, MO, NE, NV, NH, NM, OR, SC, SD, TN, VT, VA, and WV are included in residual market analysis NCCI is not the residual market plan administrator in IN, TN, MO, and NE

2012 NCCI Holdings, Inc.
60
In the Voluntary Market PEO Mix of Clients Comparable to Non-PEO Mix
Share of Insured Payroll by Industry GroupVoluntary Market , Policy Year 2007, @2nd Report
0.0%
10.0%
20.0%
30.0%
40.0%
50.0%
60.0%
70.0%
Manufacturing Contracting Office &Clerical
Goods &Services
Miscellaneous
Shar
e of
Pay
roll
PEOs Non-PEOs
CA, DE, MA, MI, MN, NJ, NY, NC, ND, OH,PA, WA, WI, and WY are excluded in voluntary market analysis AK, AL, AR, AZ, CT, DC, GA, ID, IL, IN, IA, KS, MS, MO, NE, NV, NH, NM, OR, SC, SD, TN, VT, VA, and WV are included in residual market analysis NCCI is not the residual market plan administrator in IN, TN, MO, and NE

2012 NCCI Holdings, Inc.
61
In the Voluntary Market Lost-Time Claims Frequency by Industry GroupPEO Frequency Higher for Most Industry Groups
Voluntary Market , Policy Year 2007, @2nd Report
0.0
5.0
10.0
15.0
20.0
25.0
30.0
35.0
40.0
Manufacturing Contracting Office &Clerical
Goods &Services
Miscellaneous
Lost
Tim
e C
laim
s Fr
eque
ncy
per 1
000
Wor
kers
PEOs Non-PEOs
CA, DE, MA, MI, MN, NJ, NY, NC, ND, OH,PA, WA, WI, and WY are excluded in voluntary market analysis AK, AL, AR, AZ, CT, DC, GA, ID, IL, IN, IA, KS, MS, MO, NE, NV, NH, NM, OR, SC, SD, TN, VT, VA, and WV are included in residual market analysis NCCI is not the residual market plan administrator in IN, TN, MO, and NE

2012 NCCI Holdings, Inc.
62
In the Voluntary MarketLost-Time Claims Severity by Industry Group
PEO Severity Higher for MiscellaneousVoluntary Market , Policy Year 2007, @2nd Report
0.0
10.0
20.0
30.0
40.0
50.0
60.0
Manufacturing Contracting Office &Clerical
Goods &Services
Miscellaneous
Lost
Tim
e C
laim
s Se
verit
yin
Tho
usan
ds
PEOs Non-PEOs
CA, DE, MA, MI, MN, NJ, NY, NC, ND, OH,PA, WA, WI, and WY are excluded in voluntary market analysis AK, AL, AR, AZ, CT, DC, GA, ID, IL, IN, IA, KS, MS, MO, NE, NV, NH, NM, OR, SC, SD, TN, VT, VA, and WV are included in residual market analysis NCCI is not the residual market plan administrator in IN, TN, MO, and NE
2012 NCCI Holdings, Inc.
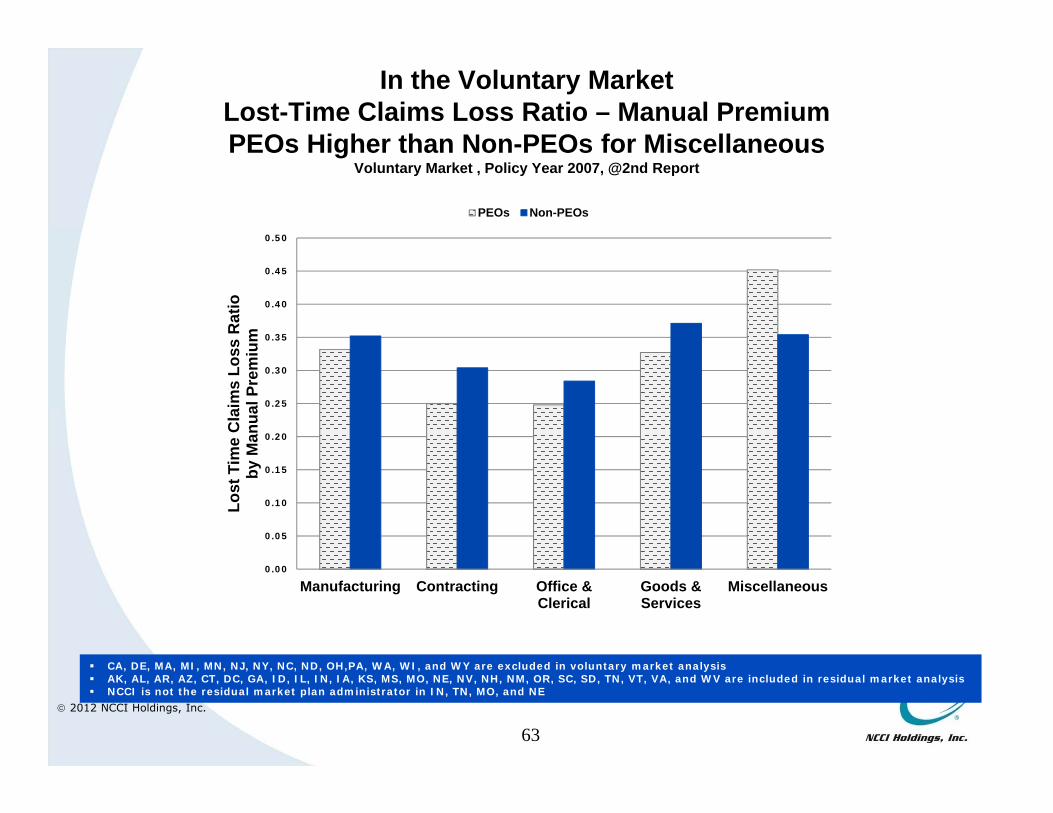
63
In the Voluntary MarketLost-Time Claims Loss Ratio – Manual PremiumPEOs Higher than Non-PEOs for Miscellaneous
Voluntary Market , Policy Year 2007, @2nd Report
0.00
0.05
0.10
0.15
0.20
0.25
0.30
0.35
0.40
0.45
0.50
Manufacturing Contracting Office &Clerical
Goods &Services
Miscellaneous
Lost
Tim
e C
laim
s Lo
ss R
atio
by M
anua
l Pre
miu
m
PEOs Non-PEOs
CA, DE, MA, MI, MN, NJ, NY, NC, ND, OH,PA, WA, WI, and WY are excluded in voluntary market analysis AK, AL, AR, AZ, CT, DC, GA, ID, IL, IN, IA, KS, MS, MO, NE, NV, NH, NM, OR, SC, SD, TN, VT, VA, and WV are included in residual market analysis NCCI is not the residual market plan administrator in IN, TN, MO, and NE

2012 NCCI Holdings, Inc.
64
In the Voluntary MarketLost-Time Claims Loss Ratio – Modified PremiumPEOs Higher than Non-PEOs for Miscellaneous
Voluntary Market , Policy Year 2007, @2nd Report
0.00
0.05
0.10
0.15
0.20
0.25
0.30
0.35
0.40
0.45
0.50
Manufacturing Contracting Office &Clerical
Goods &Services
Miscellaneous
Lost
Tim
e C
laim
s Lo
ss R
atio
by M
odifi
ed P
rem
ium
PEOs Non-PEO
CA, DE, MA, MI, MN, NJ, NY, NC, ND, OH,PA, WA, WI, and WY are excluded in voluntary market analysis AK, AL, AR, AZ, CT, DC, GA, ID, IL, IN, IA, KS, MS, MO, NE, NV, NH, NM, OR, SC, SD, TN, VT, VA, and WV are included in residual market analysis NCCI is not the residual market plan administrator in IN, TN, MO, and NE

2012 NCCI Holdings, Inc.
65
PEO Lost-Time Claims Indemnity Severity by Industry GroupVoluntary Market , Policy Year 2007, @2nd Report
0.0
10.0
20.0
30.0
40.0
50.0
60.0
Manufacturing Contracting Office &Clerical
Goods &Services
Miscellaneous
Lost
Tim
e C
laim
s In
dem
nity
Sev
erity
in T
hous
ands
PEOs Non-PEO
CA, DE, MA, MI, MN, NJ, NY, NC, ND, OH,PA, WA, WI, and WY are excluded in voluntary market analysis AK, AL, AR, AZ, CT, DC, GA, ID, IL, IN, IA, KS, MS, MO, NE, NV, NH, NM, OR, SC, SD, TN, VT, VA, and WV are included in residual market analysis NCCI is not the residual market plan administrator in IN, TN, MO, and NE

2012 NCCI Holdings, Inc.
66
PEO Lost-Time Claims Medical Severity by Industry GroupVoluntary Market , Policy Year 2007, @2nd Report
0.0
10.0
20.0
30.0
40.0
50.0
60.0
Manufacturing Contracting Office &Clerical
Goods &Services
Miscellaneous
Lost
Tim
e C
laim
s M
edic
al S
ever
ityin
Tho
usan
ds
PEOs Non-PEO
CA, DE, MA, MI, MN, NJ, NY, NC, ND, OH,PA, WA, WI, and WY are excluded in voluntary market analysis AK, AL, AR, AZ, CT, DC, GA, ID, IL, IN, IA, KS, MS, MO, NE, NV, NH, NM, OR, SC, SD, TN, VT, VA, and WV are included in residual market analysis NCCI is not the residual market plan administrator in IN, TN, MO, and NE

2012 NCCI Holdings, Inc.
67
Loss Experience for 2007 by Industry Group: PEO versus Non-PEO Policies
Residual Market

2012 NCCI Holdings, Inc.
68
In the Residual Market in 2007 Most Leased Workers Were Still Covered Under Master Policies
Master PEO Policy70.4%
Multiple PEO Policy7.3%
MCP Client Policy17.8%
PEO Direct Employee Policy4.4%
CA, DE, MA, MI, MN, NJ, NY, NC, ND, OH,PA, WA, WI, and WY are excluded in voluntary market analysis AK, AL, AR, AZ, CT, DC, GA, ID, IL, IN, IA, KS, MS, MO, NE, NV, NH, NM, OR, SC, SD, TN, VT, VA, and WV are included in residual market analysis NCCI is not the residual market plan administrator in IN, TN, MO, and NE

2012 NCCI Holdings, Inc.
69
In the Residual MarketPEOs Are Especially Prominent in Manufacturing
Share of PayrollPolicy Year 2007, @2nd Report
0.0%
10.0%
20.0%
30.0%
40.0%
50.0%
60.0%
Manufacturing Contracting Office &Clerical
Goods &Services
Miscellaneous
Shar
e of
Pay
roll
PEOs Non-PEOs
CA, DE, MA, MI, MN, NJ, NY, NC, ND, OH,PA, WA, WI, and WY are excluded in voluntary market analysis AK, AL, AR, AZ, CT, DC, GA, ID, IL, IN, IA, KS, MS, MO, NE, NV, NH, NM, OR, SC, SD, TN, VT, VA, and WV are included in residual market analysis NCCI is not the residual market plan administrator in IN, TN, MO, and NE

2012 NCCI Holdings, Inc.
70
In the Residual MarketPEO Frequency Higher than for Non-PEOs
Policy Year 2007, @2nd Report
0.0
10.0
20.0
30.0
40.0
50.0
60.0
70.0
80.0
Manufacturing Contracting Office &Clerical
Goods &Services
Miscellaneous
Lost
Tim
e C
laim
s Fr
eque
ncy
per 1
000
Wor
kers
PEOs Non-PEOs
CA, DE, MA, MI, MN, NJ, NY, NC, ND, OH,PA, WA, WI, and WY are excluded in voluntary market analysis AK, AL, AR, AZ, CT, DC, GA, ID, IL, IN, IA, KS, MS, MO, NE, NV, NH, NM, OR, SC, SD, TN, VT, VA, and WV are included in residual market analysis NCCI is not the residual market plan administrator in IN, TN, MO, and NE

2012 NCCI Holdings, Inc.
71
In the Residual MarketSeverity Was Lower for PEOs in All But Miscellaneous
Policy Year 2007, @2nd Report
0.0
10.0
20.0
30.0
40.0
50.0
60.0
70.0
80.0
90.0
Manufacturing Contracting Office &Clerical
Goods &Services
Miscellaneous
Lost
Tim
e C
laim
s Se
verit
yin
Tho
usan
ds
PEOs Non-PEOs
CA, DE, MA, MI, MN, NJ, NY, NC, ND, OH,PA, WA, WI, and WY are excluded in voluntary market analysis AK, AL, AR, AZ, CT, DC, GA, ID, IL, IN, IA, KS, MS, MO, NE, NV, NH, NM, OR, SC, SD, TN, VT, VA, and WV are included in residual market analysis NCCI is not the residual market plan administrator in IN, TN, MO, and NE
2012 NCCI Holdings, Inc.
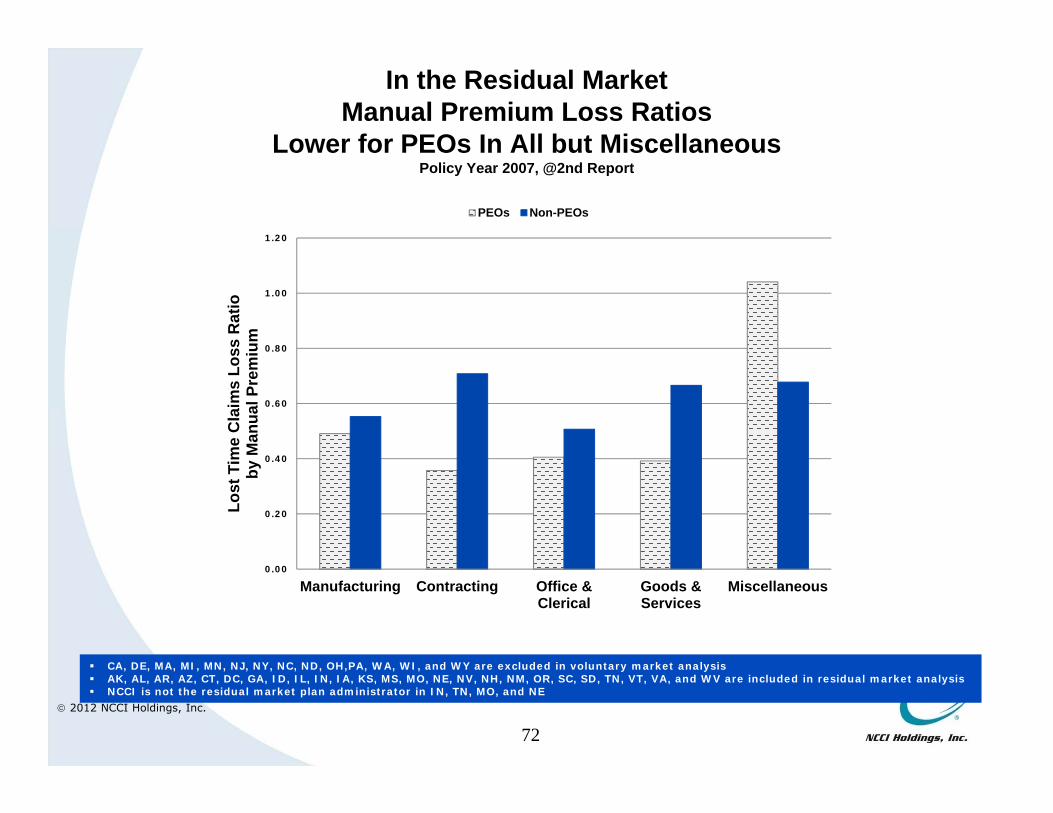
72
In the Residual MarketManual Premium Loss Ratios
Lower for PEOs In All but MiscellaneousPolicy Year 2007, @2nd Report
0.00
0.20
0.40
0.60
0.80
1.00
1.20
Manufacturing Contracting Office &Clerical
Goods &Services
Miscellaneous
Lost
Tim
e C
laim
s Lo
ss R
atio
by M
anua
l Pre
miu
m
PEOs Non-PEOs
CA, DE, MA, MI, MN, NJ, NY, NC, ND, OH,PA, WA, WI, and WY are excluded in voluntary market analysis AK, AL, AR, AZ, CT, DC, GA, ID, IL, IN, IA, KS, MS, MO, NE, NV, NH, NM, OR, SC, SD, TN, VT, VA, and WV are included in residual market analysis NCCI is not the residual market plan administrator in IN, TN, MO, and NE

2012 NCCI Holdings, Inc.
73
In the Residual MarketModified Premium Loss Ratios
Lower for PEOs In All but MiscellaneousPolicy Year 2007, @2nd Report
0.00
0.20
0.40
0.60
0.80
1.00
1.20
Manufacturing Contracting Office &Clerical
Goods &Services
Miscellaneous
Lost
Tim
e C
laim
s Lo
ss R
atio
by M
odifi
ed P
rem
ium
PEOs Non-PEO
CA, DE, MA, MI, MN, NJ, NY, NC, ND, OH,PA, WA, WI, and WY are excluded in voluntary market analysis AK, AL, AR, AZ, CT, DC, GA, ID, IL, IN, IA, KS, MS, MO, NE, NV, NH, NM, OR, SC, SD, TN, VT, VA, and WV are included in residual market analysis NCCI is not the residual market plan administrator in IN, TN, MO, and NE

2012 NCCI Holdings, Inc.
74
PEO Lost-Time Claims Indemnity Severity by Industry GroupResidual Market, Policy Year 2007, @2nd Report
0.0
10.0
20.0
30.0
40.0
50.0
60.0
70.0
80.0
90.0
Manufacturing Contracting Office &Clerical
Goods &Services
Miscellaneous
Lost
Tim
e C
laim
s In
dem
nity
Sev
erity
in T
hous
ands
PEOs Non-PEO
CA, DE, MA, MI, MN, NJ, NY, NC, ND, OH,PA, WA, WI, and WY are excluded in voluntary market analysis AK, AL, AR, AZ, CT, DC, GA, ID, IL, IN, IA, KS, MS, MO, NE, NV, NH, NM, OR, SC, SD, TN, VT, VA, and WV are included in residual market analysis NCCI is not the residual market plan administrator in IN, TN, MO, and NE

2012 NCCI Holdings, Inc.
75
PEO Lost-Time Claims Medical Severity by Industry GroupResidual Market, Policy Year 2007, @2nd Report
0.0
10.0
20.0
30.0
40.0
50.0
60.0
70.0
80.0
90.0
Manufacturing Contracting Office &Clerical
Goods &Services
Miscellaneous
Lost
Tim
e C
laim
s M
edic
al S
ever
ityin
Tho
usan
ds
PEOs Non-PEO
CA, DE, MA, MI, MN, NJ, NY, NC, ND, OH,PA, WA, WI, and WY are excluded in voluntary market analysis AK, AL, AR, AZ, CT, DC, GA, ID, IL, IN, IA, KS, MS, MO, NE, NV, NH, NM, OR, SC, SD, TN, VT, VA, and WV are included in residual market analysis NCCI is not the residual market plan administrator in IN, TN, MO, and NE

2012 NCCI Holdings, Inc.
Adverse PEO Experience in Miscellaneous Group
May Reflect Classes Of Employers Insured
76

2012 NCCI Holdings, Inc.
Industry Group Top Governing Class Code by Number of Unit Reports Description
Manufacturing 3632 MACHINE SHOP NOC
9521 HOUSE FURNISHINGS INSTALLATION NOC & UPHOLSTERING
4299 PRINTING
4484 PLASTICS MANUFACTURING: MOLDED PRODUCTS NOC
3681 TELEVISION, RADIO, TELEPHONE OR TELECOMMUNICATION DEVICE MFG. NOC
Contracting 5190 ELECTRICAL WIRING-WITHIN BUILDINGS & DRIVERS
3724 MACHINERY OR EQUIPMENT ERECTION OR REPAIR NOC & DRIVERS
5606 CONTRACTOR-EXECUTIVE SUPERVISOR OR CONSTRUCTION SUPERINTENDENT 1
5183 PLUMBING NOC & DRIVERS
5645 CARPENTRY-DETACHED ONE OR TWO FAMILY DWELLINGS
Office and Clerical 8810 CLERICAL OFFICE EMPLOYEES NOC
8742 SALESPERSONS, COLLECTORS OR MESSENGERS-OUTSIDE
8832 PHYSICIAN & CLERICAL
8833 HOSPITAL: PROFESSIONAL EMPLOYEES
8601 ARCHITECT OR ENGINEER- CONSULTING
Goods and Services 8017 STORE: RETAIL NOC
9015 BUILDINGS-OPERATION BY OWNER OR LESSEE
9014 BUILDINGS-OPERATION BY CONTRACTORS
8018 STORE: WHOLESALE NOC
9082 RESTAURANT NOC/CATERER
Miscellaneous 7229 TRUCKING-LONG DISTANCE HAULING-& DRIVERS
7228 TRUCKING-LOCAL HAULING ONLY-& DRIVERS
9102 PARK NOC-ALL EMPLOYEES & DRIVERS7219 TRUCKING: NOC-ALL EMPLOYEES & DRIVERS
7720 POLICE OFFICERS & DRIVERS
F-Class 6824 BOAT BUILDING OR REPAIR & DRIVERS
6826 MARINA & DRIVERS
6872 SHIP REPAIR CONVERSION-ALL OPERATIONS & DRIVERS
8709 STEVEDORING: TALLIERS AND CHECKING CLERKS ENGAGED IN CONNECTION WITH STEVE- DORE WORK
6843 SHIP BUILDING-IRON OR STEEL-NOC & DRIVERS
High Risk Classes Are Prominent PEO Miscellaneous Clients
CA, DE, MA, MI, MN, NJ, NY, NC, ND, OH,PA, WA, WI, and WY are excluded Policy years 2004-2010 77
2012 NCCI Holdings, Inc.
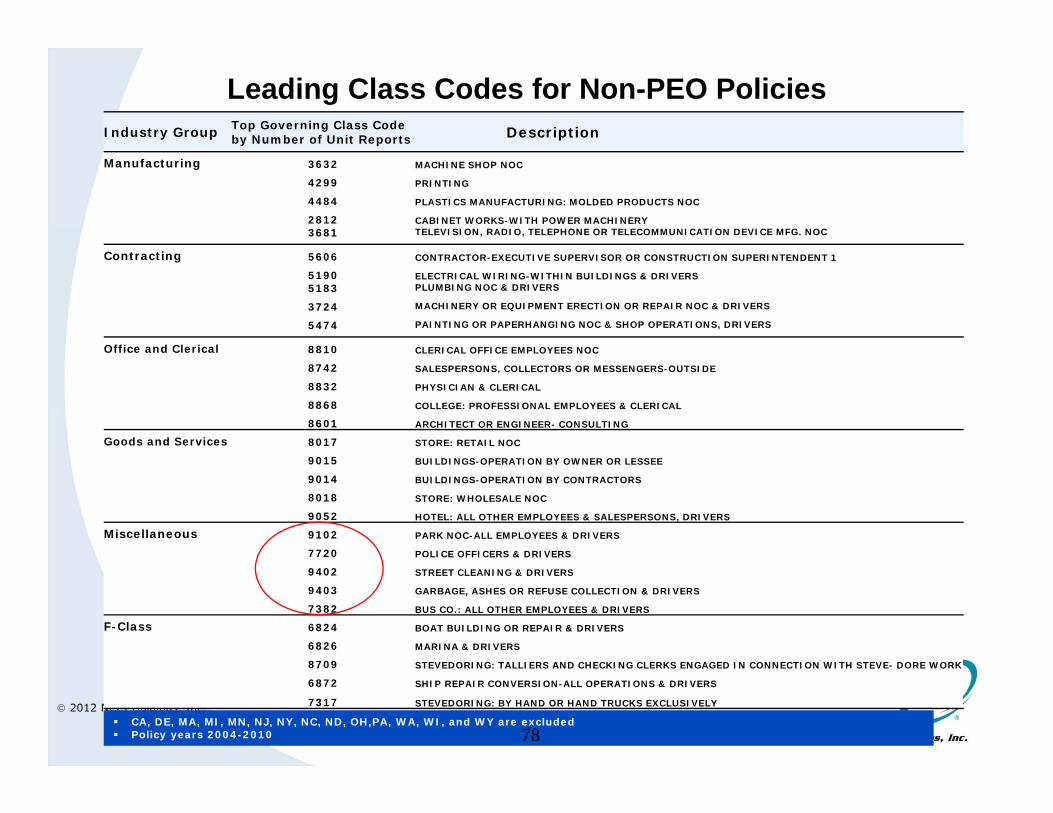
Leading Class Codes for Non-PEO PoliciesIndustry Group Top Governing Class Code
by Number of Unit Reports Description
Manufacturing 3632 MACHINE SHOP NOC
4299 PRINTING
4484 PLASTICS MANUFACTURING: MOLDED PRODUCTS NOC
2812 CABINET WORKS-WITH POWER MACHINERY3681 TELEVISION, RADIO, TELEPHONE OR TELECOMMUNICATION DEVICE MFG. NOC
Contracting 5606 CONTRACTOR-EXECUTIVE SUPERVISOR OR CONSTRUCTION SUPERINTENDENT 1
5190 ELECTRICAL WIRING-WITHIN BUILDINGS & DRIVERS5183 PLUMBING NOC & DRIVERS
3724 MACHINERY OR EQUIPMENT ERECTION OR REPAIR NOC & DRIVERS
5474 PAINTING OR PAPERHANGING NOC & SHOP OPERATIONS, DRIVERS
Office and Clerical 8810 CLERICAL OFFICE EMPLOYEES NOC
8742 SALESPERSONS, COLLECTORS OR MESSENGERS-OUTSIDE
8832 PHYSICIAN & CLERICAL
8868 COLLEGE: PROFESSIONAL EMPLOYEES & CLERICAL
8601 ARCHITECT OR ENGINEER- CONSULTING
Goods and Services 8017 STORE: RETAIL NOC
9015 BUILDINGS-OPERATION BY OWNER OR LESSEE
9014 BUILDINGS-OPERATION BY CONTRACTORS
8018 STORE: WHOLESALE NOC
9052 HOTEL: ALL OTHER EMPLOYEES & SALESPERSONS, DRIVERS
Miscellaneous 9102 PARK NOC-ALL EMPLOYEES & DRIVERS
7720 POLICE OFFICERS & DRIVERS
9402 STREET CLEANING & DRIVERS
9403 GARBAGE, ASHES OR REFUSE COLLECTION & DRIVERS
7382 BUS CO.: ALL OTHER EMPLOYEES & DRIVERS
F-Class 6824 BOAT BUILDING OR REPAIR & DRIVERS
6826 MARINA & DRIVERS
8709 STEVEDORING: TALLIERS AND CHECKING CLERKS ENGAGED IN CONNECTION WITH STEVE- DORE WORK
6872 SHIP REPAIR CONVERSION-ALL OPERATIONS & DRIVERS
7317 STEVEDORING: BY HAND OR HAND TRUCKS EXCLUSIVELY
CA, DE, MA, MI, MN, NJ, NY, NC, ND, OH,PA, WA, WI, and WY are excluded Policy years 2004-2010 78

2012 NCCI Holdings, Inc.
79
Modified Loss Ratios for 2007 by Industry Group: PEO versus Non-PEO Policies
Residual and Voluntary Markets
Loss Ratios Higher in Residual Market: PEOs and Non-PEOsLoss Ratios Moderately Higher in Residual Market: PEOs
Loss Ratios Materially Greater in Residual Market: Non-PEOs

2012 NCCI Holdings, Inc.
80
In the Voluntary MarketLost-Time Claims Loss Ratio – Modified PremiumPEOs Higher than Non-PEOs for Miscellaneous
Voluntary Market , Policy Year 2007, @2nd Report
0.00
0.20
0.40
0.60
0.80
1.00
1.20
Manufacturing Contracting Office &Clerical
Goods &Services
Miscellaneous
Lost
Tim
e C
laim
s Lo
ss R
atio
by M
odifi
ed P
rem
ium
PEOs Non-PEO
CA, DE, MA, MI, MN, NJ, NY, NC, ND, OH,PA, WA, WI, and WY are excluded in voluntary market analysis AK, AL, AR, AZ, CT, DC, GA, ID, IL, IN, IA, KS, MS, MO, NE, NV, NH, NM, OR, SC, SD, TN, VT, VA, and WV are included in residual market analysis NCCI is not the residual market plan administrator in IN, TN, MO, and NE

2012 NCCI Holdings, Inc.
81
In the Residual MarketModified Premium Loss Ratios
Lower for PEOs In All but MiscellaneousPolicy Year 2007, @2nd Report
0.00
0.20
0.40
0.60
0.80
1.00
1.20
Manufacturing Contracting Office &Clerical
Goods &Services
Miscellaneous
Lost
Tim
e C
laim
s Lo
ss R
atio
by M
odifi
ed P
rem
ium
PEOs Non-PEO
CA, DE, MA, MI, MN, NJ, NY, NC, ND, OH,PA, WA, WI, and WY are excluded in voluntary market analysis AK, AL, AR, AZ, CT, DC, GA, ID, IL, IN, IA, KS, MS, MO, NE, NV, NH, NM, OR, SC, SD, TN, VT, VA, and WV are included in residual market analysis NCCI is not the residual market plan administrator in IN, TN, MO, and NE

2012 NCCI Holdings, Inc.
Observations

2012 NCCI Holdings, Inc.
Observations
• Regulation of PEOs has increased steadily over the past 20 years
• Across all NCCI states in total, PEOs account for a relatively small share of all workers covered by workers compensation
• PEOs are responsible for a material portion of employment in some states; especially in residual markets
• Reported frequency is typically higher for PEO policies suggesting that there is no compelling evidence that PEOs underreport claims
• Comparable loss ratios for PEO and Non-PEO policies suggests that there is no compelling evidence of inappropriate reporting of payroll and premium
89
2012 NCCI Holdings, Inc.
Comments Or Questions?