Professional Development in Challenged Environments A Model for Effective PD.
22
Professional Professional Development in Development in Challenged Challenged Environments Environments A Model for Effective PD A Model for Effective PD
-
Upload
milo-porter -
Category
Documents
-
view
215 -
download
0
Transcript of Professional Development in Challenged Environments A Model for Effective PD.
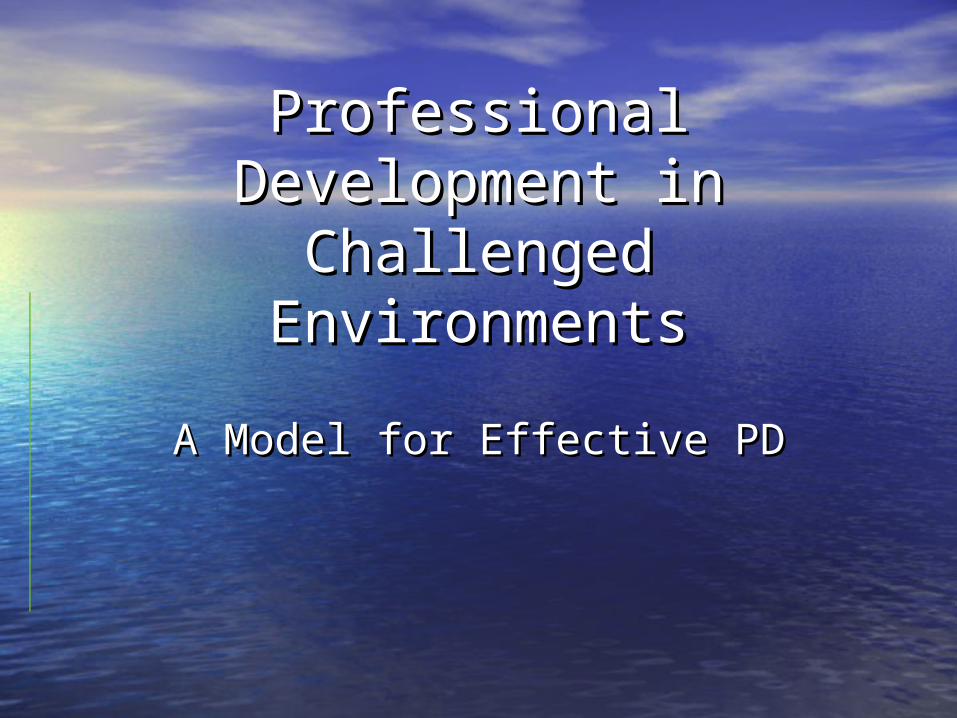
Professional Development Professional Development in Challenged in Challenged EnvironmentsEnvironments
A Model for Effective PDA Model for Effective PD

The DistrictsThe Districts
• District ADistrict A– 3 elementary schools3 elementary schools– 1 middle school1 middle school– 1 high school1 high school– 62% primary 62% primary
language not Englishlanguage not English
• District BDistrict B– 3 elementary schools3 elementary schools– 1 middle school 1 middle school
(closed)(closed)– 1 high school1 high school– 1 career/alternative 1 career/alternative
high schoolhigh school– 2 homeless shelters2 homeless shelters
90%+ socio-economically disadvantaged student body
90%+ socio-economically disadvantaged student body

Year 1 Math InstituteYear 1 Math Institute
•Closed middle schoolClosed middle school•November re-organization, November re-organization,
layoffslayoffs•4 New Principals4 New Principals•Substitutes in many Substitutes in many
classroomsclassrooms

Year 2 Math InstituteYear 2 Math Institute
•4 New principals4 New principals
•District starts school for 300 District starts school for 300 ELL studentsELL students
•January school closingJanuary school closing
•Superintendent leavesSuperintendent leaves
•Curriculum director leavesCurriculum director leaves

Year 3 Math InstituteYear 3 Math Institute
•2 New principals2 New principals
•Close school disperse ELL Close school disperse ELL studentsstudents
•Reorganize from 1-5, 6-8 to 1-6, Reorganize from 1-5, 6-8 to 1-6, 7-87-8
•Pink slip teachersPink slip teachers

Year 4 Math InstituteYear 4 Math Institute
•4 New principals4 New principals•Curriculum director leavesCurriculum director leaves•Superintendent leavesSuperintendent leaves•Take in 300 students from Take in 300 students from
alternative discipline charter alternative discipline charter high schoolhigh school

Results: ImplementationResults: Implementation
SAMPI Classroom Observations: Pre and Post Program Results
(n=28)
3.5
3.7
4
4.2
5.3
5.5
5.5
5.8
1 3 5 7
Overall Rating
Content
Implementation
Culture
Total Score (1=low; 7=high)Spring 2006
Fall 2004
Effect Size
Culture 0.80
Implementation 1.62
Content 1.95
Overall 1.79

Results: Math PedagogyResults: Math Pedagogy
PM3 Teacher Percent Improvement in Performance on the LMT:
Fall 2004 - Spring 2006
41.4
57.1
0
20
40
60
80
Fall 2004 Spring 2006
Pe
rce
nt
Co
rre
ct
Effect Size = 0.75
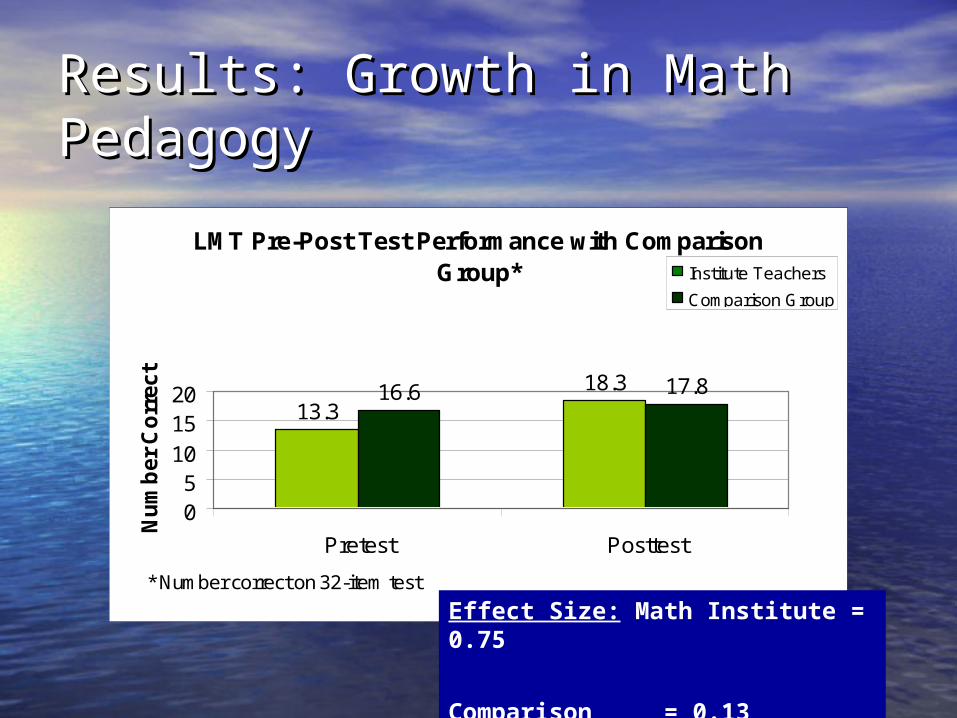
Results: Growth in Math Results: Growth in Math PedagogyPedagogy
LMT Pre-Post Test Performance with Comparison Group*
13.318.316.6 17.8
05
101520
Pretest Posttest
Nu
mb
er C
orr
ect
Institute Teachers
Comparison Group
* Number correct on 32-item test
Effect Size: Math Institute = 0.75
Comparison = 0.13

Results: Math Content Results: Math Content KnowledgeKnowledge
Michigan Teacher Certification Test Adapted Form:
Pre and Post Program Results
46.2
56.7
40.8
45.8
46.2
60
45.8
51.5
0 20 40 60 80 100
Statistics andProbability
Geometry
Algebra
Total
PercentSpring 2006
Fall 2004
Effect Size:
Total = 0.75
Algebra = 0.32
Geometry = 0.13
Stats/Prob = 0.0

Results: Math Content Results: Math Content KnowledgeKnowledge
NOTE: Comparison group did not grow in Stats/Prob and lost ground in Algebra
MTTC Mean Pre-Posttest Change PM3 and Comparison Group
0
0.344
-0.156
0.3130.06
0.23
0.74
1.5
-0.5
0
0.5
1
1.5
2
Statistics andProbability
Geometry Algebra Total
Nu
mb
er o
f It
ems
Comparison
PM3

Impact on StudentsImpact on Students
MEAP Math Trends District A
0
10
20
30
40
50
60
70
Gr 5 Gr 6 Gr 7 Gr 8
Per
cent
Pro
fici
ent
Winter 2003
Winter 2004
Winter 2005
Fall 2006
Fall 2007

Impact on StudentsImpact on StudentsMEAP Math Trends
District B
0
5
1015
20
25
30
3540
45
50
Gr 5 Gr 6 Gr 7 Gr 8
Per
cen
t P
rofi
cie
nt
Winter 2003
Winter 2004
Winter 2005
Fall 2006
Fall 2007


ISD/RESACenter/UMD
MSP District B
MSP District A
SchoolDistrict
Teachers
SchoolDistrict
Teachers
The Model

Structure of the InstituteStructure of the Institute
•50-60 teachers grades 4-8 50-60 teachers grades 4-8
•28 not HQ in Fall 2004 28 not HQ in Fall 2004
•2 not HQ by Fall 20072 not HQ by Fall 2007
•Monthly Institute sessionsMonthly Institute sessions
•Monthly grade level meetingsMonthly grade level meetings

Courses for TeachersCourses for Teachers
• Number, Operations, & Proportional Number, Operations, & Proportional ReasoningReasoning
• Algebra Algebra • GeometryGeometry• Data Analysis, Statistics & ProbabilityData Analysis, Statistics & Probability• Concepts in CalculusConcepts in Calculus• Improving Instruction in Rational Numbers Improving Instruction in Rational Numbers
& Proportionality& Proportionality• Improving Instruction in AlgebraImproving Instruction in Algebra• Improving Instruction in Geometry & Improving Instruction in Geometry &
MeasurementMeasurement

Partnerships at All LevelsPartnerships at All Levels
•TeachersTeachers
•Project management team, Project management team, including STEMincluding STEM
•EvaluatorsEvaluators

Philosophy of PDPhilosophy of PD
• Systemic approach: Whole districtSystemic approach: Whole district
• CoachingCoaching
• Monitor and adjustMonitor and adjust
• Long term, sustained, collaborative, school-Long term, sustained, collaborative, school-based, linked to curricula, focused on based, linked to curricula, focused on student learningstudent learning
• Teachers developing deeper understanding Teachers developing deeper understanding of math they teach at grade band they of math they teach at grade band they teachteach
Importance of CoachingImportance of Coaching
• Work at Institute with teachers then Work at Institute with teachers then return with them to classroomsreturn with them to classrooms
• Nurture collaboration through grade Nurture collaboration through grade level meetingslevel meetings
• Establish district curriculum for Establish district curriculum for Institute grade levelsInstitute grade levels

Impact on STEMImpact on STEM
• Importance of STEM’s understanding Importance of STEM’s understanding teacher thinking about mathematicsteacher thinking about mathematics
• Enhancing STEM’s understanding of Enhancing STEM’s understanding of student learningstudent learning
• Active listening to teachers’ stated Active listening to teachers’ stated needsneeds

What We LearnedWhat We Learned
““It is generally easier to get people to act It is generally easier to get people to act their way into a new way of thinking their way into a new way of thinking than it is to get them to think their way than it is to get them to think their way into a new way of acting.”into a new way of acting.”
Millard FullerMillard FullerFounder, Habitat for HumanityFounder, Habitat for Humanity