PROFECY – Processes, Features and Cycles of Inner ... Annex 13... · 2.2 The case study against...
66
PROFECY – Processes, Features and Cycles of Inner Peripheries in Europe (Inner Peripheries: National territories facing challenges of access to basic services of general interest) Applied Research Final Report Annex 13 Case Study Report Area Grecanica-Calabria (Italy) Version 07/12/2017
Transcript of PROFECY – Processes, Features and Cycles of Inner ... Annex 13... · 2.2 The case study against...

PROFECY – Processes, Features and Cycles of Inner
Peripheries in Europe
(Inner Peripheries: National territories facing challenges of access to basic services of general
interest)
Applied Research
Final Report
Annex 13 Case Study Report
Area Grecanica-Calabria (Italy)
Version 07/12/2017

This report is one of the deliverables of the PROFECY project. This Applied ResearchProject is conducted within the framework of the ESPON 2020 Cooperation Programme, partly financed by the European Regional Development Fund. The ESPON EGTC is the Single Beneficiary of the ESPON 2020 Cooperation Programme. The Single Operation within the programme is implemented by the ESPON EGTC and co-financed by the European Regional Development Fund, the EU Member States and the Partner States, Iceland, Liechtenstein, Norway and Switzerland. This delivery does not necessarily reflect the opinion of the members of the ESPON 2020 Monitoring Committee.
Authors Francesco Mantino and Barbara Forcina, Council for Agricultural Research and Economics (Italy) Advisory Group Project Support Team: Barbara Acreman and Zaira Piazza (Italy), Eedi Sepp (Estonia), Zsolt Szokolai, European Commission. ESPON EGTC: Marjan van Herwijnen (Project Expert), Laurent Frideres (HoU E&O), Ilona Raugze (Director), Piera Petruzzi (Outreach), Johannes Kiersch (Financial Expert).
Information on ESPON and its projects can be found on www.espon.eu. The web site provides the possibility to download and examine the most recent documents produced by finalised and ongoing ESPON projects. This delivery exists only in an electronic version. © ESPON, 2017 Printing, reproduction or quotation is authorised provided the source is acknowledged and a copy is forwarded to the ESPON EGTC in Luxembourg. Contact: [email protected]

ESPON 2020 i
a
PROFECY – Processes, Features and Cycles of Inner Peripheries in
Europe

ESPON 2020 ii
Table of contents Executive Summary ................................................................................................................... 1 1 Introduction of the case study background ....................................................................... 2
1.1 General information and location in European Space ...................................................... 2
1.2 IP delineation outcomes .................................................................................................... 6
1.3 Basic socio-economic characteristic ............................................................................... 10 2 Characteristics of the case study: Patterns and processes ............................................ 11
2.1 The evolution of IP case study region ............................................................................. 11
2.2 The case study against the region, country and Europe ................................................. 15
2.3 Internal structures and disparities inside case study region ........................................... 16
2.4 The case study as a subject of local, regional and state coping strategies .................... 19
2.5 Future scenarios .............................................................................................................. 25 3 Discussion ....................................................................................................................... 30 4 Conclusions ..................................................................................................................... 33 List of Tables ........................................................................................................................... 35 List of Figures .......................................................................................................................... 35 List of Maps ............................................................................................................................. 35 List of Annexes ........................................................................................................................ 46

ESPON 2020 iii
Abbreviations
CAP Common Agricultural Policy EC European Commission ESPON European Territorial Observatory Network EU European Union GDP Gross Domestic Product NGO Non-Governmental Organisation NUTS Nomenclature of Territorial Units for Statistics DG AGRI Directorate-General for Agriculture and Rural Development DG REGIO Directorate-General for Regional and Urban Policy EARDF European Agricultural Rural Development Fund ERDF European Regional Development Fund ESF European Social Fund LAG Local Action Group LAU Local Administrative Unit LEADER Liaison Entre Actions de Développement de l'Économique Rurale RDP Rural Development Plan SGIs Services of General Interest

ESPON 2020 1
Executive Summary Over the decades, the Grecanica area has experienced a gradual and enduring process of
peripheralisation marked by loss of population, employment and services and by
abandonment and deterioration of the territory. Although it is the whole region to suffer from
weak economy, the problem is particularly significant in the Grecanica area. In the
sourrounding areas, in fact, there is potential of competitiveness and relatively dynamic
economic conditions of specific sectors within specific territories. There is a demographic
decline as result of two different processes: first, an internal migration from mountains/hills to
coastline municipalities and second, the outmigration of the younger population that is
especially intense in inner villages. Internal disparities are also visible in natural resources
and the cultural heritage.
Key factors explaining peripherality in the area Grecanica are fundamentally two: a) the
weakness of local and regional institutions, and b) social relations based on patronage and
opportunistic relations. Both factors feed each other in a mechanism of mutual dependence.
Weak institutions in the Calabria case mean that public institutions (municipalities, national
park, provinces, mountain community, regional administrations) are unable to design a
comprehensive and effective strategy to promote the creation of local public goods, which are
necessary to change living and employment conditions for all inhabitants.
Different funds and policy tools have been implemented in the area: not only single measures
of Operational Programmes under ERDF/ESF and of Rural Development Plan under EARDF,
but also diverse forms of integrated territorial projects. The contribution of this mix of policies
to the process of peripheralisation is quite controversial. In general, there is a diffuse
consensus among local actors/experts on the lack of holistic visions by all these programmes.
On one side, these policies are strongly criticised for being too much fragmented in thousands
of small isolated interventions, not really well-targeted to local needs and ineffective,
consolidating a local conservative elite that blocks innovation and in the worst cases even
destroy endogenous potentials. On another side, there are policies strongly appreciated
because provide funds to renovate territorial capital, to maintain social capital, to support
innovative entrepreneurs and integration among different local resources.
Two scenarios can be envisaged: a) the “status quo”, with usual features of low level of
wellbeing, continuous outmigration and demographic ageing, etc.; b) a “sustainable
innovation” scenario, whith the perspectives of a better level of entrepreneurs, an increasing
territorial value added and a slowing down of outmigration. The shift from the first to the
second scenario, as many experts and local actors have pointed out, is quite problematic
without the pre-requisite of better SGIs access for population and economic activities. This
can be considered as a “political mutable” driver, if national or regional policies are well-
targeted and not fragmented in many small pieces of intervention as in the past. The other
condition concerns local governance, which is crucial for policy effectiveness.

ESPON 2020 2
1 Introduction of the case study background 1.1 General information and location in European Space
The Area Grecanica case study is located in the southernmost part of Calabria, which is the
region stretching in northeast-southwest direction from the main body of Italy located to the
toe of Italian peninsula, bordering in the north with the region Basilicata and surrounded by
the Tyrrhenian Sea on the western side and the Ionian Sea on the eastern and southern side.
The study area belongs to the Province of Reggio Calabria, covers 596 Km2 and includes the
15 municipalities still preserving a strong greek cultural identity: Bagaladi, Bova, Bova Marina,
Brancaleone, Bruzzano Zeffirio, Cardeto, Condofuri, Ferruzzano, Melito Porto Salvo,
Montebello Jonico, Palizzi, Roccaforte del Greco, Roghudi, San Lorenzo, Staiti (Map 1.1).
The area accounts for 15% of the provincial territory (97 municipalities) and 4% of the
regional territory (409 municipalities).
Map 1.1: Geographical location of the case study area in regional and national scale

ESPON 2020 3
According to urban-rural typology as developed by DG AGRI and DG REGIO, the case study
municipalities belong to an intermediate NUTS-3 area where the share of population living in
rural local units is between 20% and 50% (the Province of Reggio Calabria) and that contains
a metropolitan urban centre of about 180,000 inhabitants (Reggio Calabria) representing 9%
of the regional population.
All the municipalities of the case study area are included in the macroarea D “Less developed
rural areas” as per the classification of Italian rural territories adopeted in the EARDF
Regional Development Programmes (RDPs) and are characterised by strong elements of
marginality, such as depopulation, population ageing, high unemployment rates, inadequate
infrastructural, economic and social facilities.
Settlement pattern and spatial distribution of economic activities and infrastructures are
biased by distinctive geographical features. Local topography of Area Grecanica is dominated
by the ridges of the mountainous massif of Aspromonte alternated with deep and narrow
valleys crossed by fiumara torrents, ephemeral streams characterised along their course by
steep slopes and flat, wide and peebly mobile riverbeds oriented towards the sea that convey
impetuous abundant water in autumn and winter and little placid water for the rest of the year.
Figure 1.1: The Fiumara Amendolea
Due to the complex interplay of the predominantly mountainous morphology, the poor
accessibility of inner villages and the dispersed nature of rural inhabited locations, most of the
area suffer from geographical isolation and low provision and access to services for the
population and for the productive system that undermine quality of life and economic
opportunities. Therefore, over the decades, the Grecanica area has experienced a gradual
and enduring process of peripheralisation marked by loss of population, employment and
services and by abandonment and deterioration of the territory.

ESPON 2020 4
Although it is the whole region to suffer from weak economy, the problem is particularly
significant in the Grecanica area.
In the sourrounding areas, in fact, there is potential of competitiveness and relatively dynamic
economic conditions of specific sectors within specific territories. For example, the valley of
Gioia Tauro is highly specialized in olive and citrus cultivations and favoured by the presence
of a relevant port hub representing a strategic asset for local and regional development,
whereas the area of Locri is favoured by the extention of railways facilities and road network
allowing interconnection and interoperability between the Tyrrhenian Corridor and the Ionian
Corridor.
In the case study area, instead, due to its distinctive pattern characterized by prominent
orographical obstacles and very poor accessibility, it is the city of Reggio Calabria to take on
the role of centre of gravity as far as spatial organization, economic development and service
provision is concerned.
Figure 1.2: The Ionic Railway
In relation to the overall regional territorial and administrative framework, the region Calabria
(Map 1.2) belongs to the level NUTS-2 of classification of territorial units for statistics and it is
included in the list of less developed regions pursuant to Article 90(2)(a) of Regulation (EU)
No 1303/2013.
Calabria is composed of 5 provinces (NUTS-3 level): Catanzaro, Cosenza, Vibo Valentia,
Crotone, Reggio Calabria (Map 1.2). The regional administrative capital is Catanzaro, which
is the third province in the region as for dimension and population. It is Cosenza to be the
largest and most populated province (155 municipalities, covering a total area of 6,710 km²
and a population of 714,281 people at December 2012), followed by Reggio Calabria (3,210
km², 97 municipalities, 550,323 inhabitants), Catanzaro (2,415 km², 80 municipalities,

ESPON 2020 5
359,716 inhabitants), Crotone (1,736 km², 27 municipalities, 171,666 inhabitants) and Vibo
Valentia (1,151 km², 50 municipalities, 162,252 inhabitants).
Map 1.2: Location of the case study area within administrative structures
In Calabria the pattern of settlement and urban development is largely inadequately organized
both spatially and functionally: the development of urban centres, housing and road networks
suffers the widespread suburbanisation and urban sprawl, productive and service activities
are undermined by the lack of infrastructural and logistic preconditions, population is
dispersed in small villages and their scattered fractions, poor or unsuited connections
between the urban settlements and to the main transport routes. And even the main
Calabrian urban centres that serve as administrative gravitational pull of neighbouring centres
(commuting for school and work purposes) have limited functional dimension and scarce
complex functions (immaterial relations, such as cultural functions, directional functions,

ESPON 2020 6
innovation networks, etc.), for which there is strong dependence from other cities or areas
(Rome, Naples, etc.).
Moreover, since Calabria is for the most part totally or partially mountainous (70% of the
municipalities, against a national average of 52%) with small lowland areas, the increasing
concentration of urban development and population in non mountainous and coastline areas
is causing a persistent trend towards the depopulation of inner villages, that will consequently
be consigned to marginalisation and impoverishment without specific measures to counteract
this ongoing declining process.
The mountainous and hilly areas are affected by economic and social problems resulting from
the endogenous morphologic conditions that determine structural shortcomings (transport and
communication networks) and penalise and discourage human and productive settlement.
The declining process of internal areas seems therefore almost unavoidable due to better
opportunities and services offered by major urban centres, but it has important economic,
environmental and social implications. On one side, local authorities are unable to plan and
cope with internal migration and increasing concentration of citizens in cities and this is
certainly undesirable as regards quality of life, congestion, illegal building, infrastructural and
service development (transport and communication, schools, hospitals, etc.) at the expense
of other areas. On the other side, not only does the decline of outlying rural areas impedes to
maintain vocational economic activities (agriculture, livestock, tourism), making development
and growth difficult due to opportunities shortcomings, but also gives rise to agricultural land
loss, abandonment and despoiling of the cultural heritage, degradation of natural habitats and
to increasing safety or environmental risks (disruption of the hydrogeological balance, greater
vulnerability to fire, etc.).
Rural internal areas have special assets and potential that have until recently been neglected
or largely unused and they could remedy the many handicaps associated with distance and
marginality. However, this requires not only sufficient funds, but also, as detailed further on,
far-sighted policy and policy-makers that are up to the challenge that the process of
marginalization sets and, most of all, a fundamental radical change of attitude and mentality.
1.2 IP delineation outcomes The Area Grecanica gravitates towards the metropolitan area of Reggio Calabria where the
major administrative functions and services of general interest (SGIs) facilities are located
and is characterised by limited local road network (Map 1.3), limited availability of public
means of transportation to the main urban centres, poor access to regional centres by car
travel time.

ESPON 2020 7
Map 1.3: Main transport networks and relief
As evidenced by the maps of accessibility to regional centres by car (Map 1.4 and Map 1.5)
and of accessibility to SGIs (Annex Map 1 to Annex Map 8) and as further detailed next and in
Table IV, the case study area shows a distinctive internal differentiation into two sub-areas, a
more peripheral one (predominantly mountainous municipalities) and a less peripheral one
(predominantly coastal municipalities).
Moreover, within the territory of the province of Reggio Calabria, it is possible to identify,
besides the Area Grecanica, three other distinct homogeneous areas located around the
cities of Locri (Locride), Gioia Tauro (Gioia Tauro Valley) and Reggio Calabria (Metropolitan
area of Reggio Calabria) (Map 1.2), each of which is characterized by specific socio-
economic situation and assets and all of which are more developed and vital than the case
study area.
ESPON 2020 8
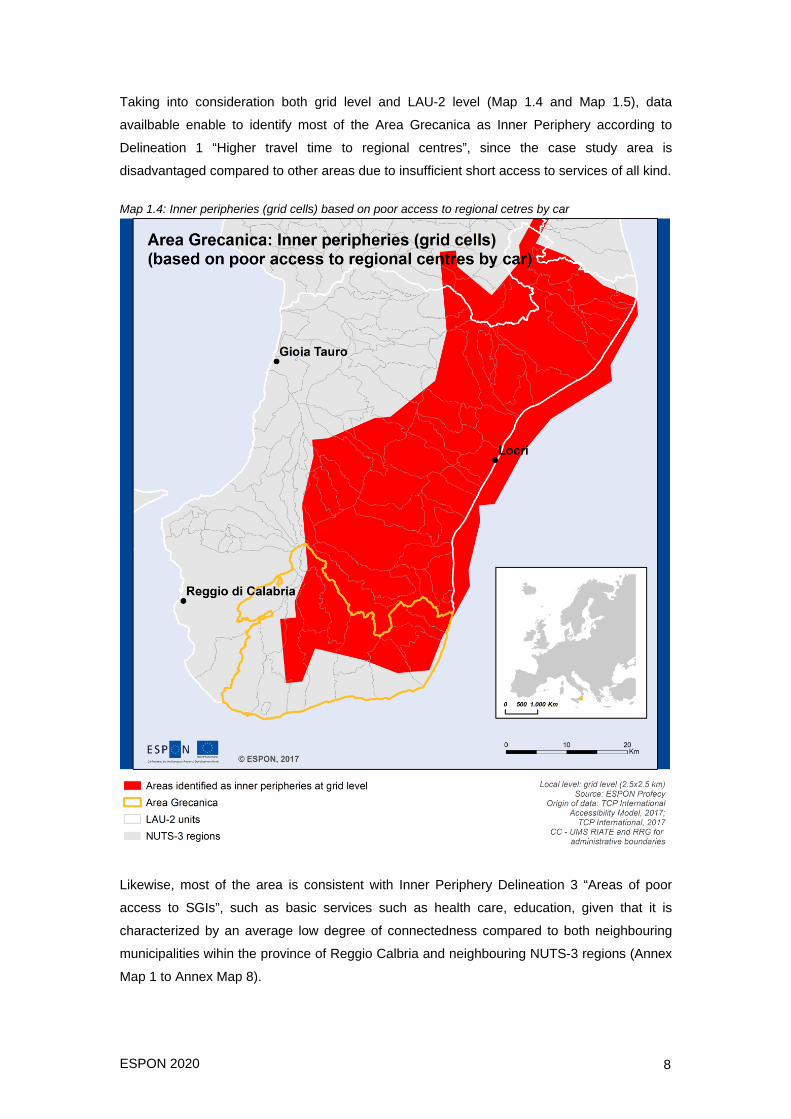
Taking into consideration both grid level and LAU-2 level (Map 1.4 and Map 1.5), data
availbable enable to identify most of the Area Grecanica as Inner Periphery according to
Delineation 1 “Higher travel time to regional centres”, since the case study area is
disadvantaged compared to other areas due to insufficient short access to services of all kind.
Map 1.4: Inner peripheries (grid cells) based on poor access to regional cetres by car
Likewise, most of the area is consistent with Inner Periphery Delineation 3 “Areas of poor
access to SGIs”, such as basic services such as health care, education, given that it is
characterized by an average low degree of connectedness compared to both neighbouring
municipalities wihin the province of Reggio Calbria and neighbouring NUTS-3 regions (Annex
Map 1 to Annex Map 8).

ESPON 2020 9
Map 1.5: Lau-2 units identified as inner peripheries based on poor access to regional centres by car
Therefore, in the Italian case study, it is evident that NUTS-3 data cannot provide a
comprehensive realistic description of the socio-economic situation/development of this
typology of areas and do not enable to differentiate the most marginal areas and/or sub-
areas.
Anyway, as for the Area Grecanica, the results at grid and LAU-2 level of Delineations 1 and
3 related to high travel time to regional centres, low accessibility and low access to primary
SGIs shows that the case study area suffers adverse effects that are gradually piling up and
are having further negative consequences leading to steadily worse depleting processes, as
detailed in the following pages.

ESPON 2020 10
1.3 Basic socio-economic characteristic The province of Reggio Calabria is a lagging region as per GDP performance compared to
EU and national average (GDP per capita is <75% in comparison to EU100 and NAT100).
Within the province, however, as mentioned above, the Area Grecanica is characterised,
more than the neighbouring ones (Annex 2: Table Ib), by declining population (mostly due to
net outward migration), shrinking of the active population (not adequately compensated by
immigrants), growing number of elderly people (old age dependency ratio 35%) significantly
greater than the other three provincial areas (ranging between 27% and 30%) and regional
and national rates (respectively, 29% and 32%).
In general, however, the whole case study area is characterized by the reduction of
population, scant presence of young people, low level of entrepreneurship and of economic
activities and poor competiveness. The Area Grecanica is involved in a vicious circle from
which it is very difficult to escape: the local labour market is very weak and heavily influenced
by the demographic situation that in turn biases the productive system, biased in its turn by
depopulation, since people (and in particular young people) are prompted to move in more
dynamic and competitive economic areas, both within the same province and outside it.
Provincial unemployment rate (20%) is not far from the overall regional rate (19%). Youth
employment rate is instead much more critical (52% in internal municipalities and 48% in
coastal municipalities), mainly compared to national rate (35%), but also to provincial and
regional rates (respectively, 51% and 50%).
The major source of employment and income comes from the tertiary sector, which is
responsible for more than 60% of employment (even so it is a share far below other provincial
areas, region and Italy, see Annex 2: Table Ib). The remaining employment is provided by
agriculture (25%) and industries (14%).
The primary sector, in particular, plays a vital role in local development. Whereas in the
coastal municipalities it is the service sector to be predominant, agriculture (mainly livestock
breeding and citrus cultivation, among which the most notable bergamot citrus) and the
diverse activities associated to it (agro-tourism, village renovation, landscape and
environment protection, etc.) are a major source of employment and wealth in the more
internal areas.
Moreover, the area is very much committed to renovating historic town centres, rural tourism
and craft trades and makes of the preservation and restoration of historical and natural assets
and retainment and reinforcement of the cultural identity its major attractions.
All this, therefore, implies that, in order to safeguard competitiveness, prevent any
continuation of the tendency towards depopulation and socio-economic decline, it is relevant
to understand the changes intercurred and the historical background that led to constant
peripheralisation with a view to achieve a turnaround and reinforce the territorial system of
Area Grecanica over the long run.

ESPON 2020 11
2 Characteristics of the case study: Patterns and processes 2.1 The evolution of IP case study region The Area Grecanica is characterised by low development and high outmigration rates. The
population decline has been a constant phenomenon producing social and economic negative
impacts on the growth potentials of the area. Peripheralisation has been a cumulative process
over the last fifty years, where the quality of local institutions, infrastructures and SGIs, the
human and social capital, economic performances and, last but not least, specific social
relations have all interacted in a sort of vicious circle1. How this circle works is represented in
Figure 2.1.
Figure 2.1: Descriptive model of Inner Periphery Processes in the Grecanica area
The general perception of all interviewees is that there is a lack of infrastructures and SGIs, in
particular in education, local mobility (roads, railways and private buses) and medical and
hospital centres. This is the result of infrastructures and SGIs decline due to the reduction of
public resources (mainly national and regional) devoted to these public goods and the political
incapacity to address these priorities and allocate available funds2.
«The reduction of public expenditures and the healthcare rationalisation put forward by the
the regional government simply means services decline in this area» (Interviewee n. 6).
«All these policies regulating services in the field of transports, schools and healthcare simply
followed an efficiency criterion, not the rationale of maintaining a minimum standard for
everyone. There is no vision of the future, merely the need to face conjunctural situations»
(Interviewee no. 7).
The SGIs decline causes a fundamental fall in the wellbeing of population and surely does not
contribute to stop the outmigration of younger people and students after the secondary school

ESPON 2020 12
diploma. The decline of human and social capital is the result of three joint phenomena, which
can be adequately summarised by same words of experts/local actors:
1) «Young couples move from the inner villages to the coastline areas and from here, in a
second step, they emigrate from the area» (Interviewee no. 7);
2) «The most brilliant and high-qualified students, once taking the university degree, look for a
job and aren’t able to find anything here. So they go away and we loose exactly those human
resources needed to change this conditions» (Interviewee no. 7);
3) «There is a lack of self-esteem and self-reliance here […] nobody has promoted
entrepreneurship in this area due to ages of dependence from public policies» [which have
destroyed entrepreneurship capabilities] (Interviewee no. 8).
All these factors caused low rate of entrepreneuship and innovation and this, in turn, is one of
the main reason for low economic development in the area. As we have already pointed out,
general unemployment and youth unemployment rates, in particular, are higher than at
regional level: in 2011 only one young out of 2 is officially employed.
The agricultural sector has still a relevant role in the area. It employs 1/4 of the total labour
force, while industrial production is marginal and services and public administration represent
2/3 of the labour force. Agriculture suffers from structural problems: low size and fragmented
pieces of land characterise most of land properties. Altitude and small properties make
impossible/inefficient the process of mechanisation. This is true for the most important
cultivations: olive and cereals. Bergamot cultivation is a high-income activity, but it is
widespread only in the coastline areas.
Figure 2.2: Bergamot cultivation
Economic performances of the area are strongly influenced by weak linkages within the single
value chain (agri-food system) and among different sectors. In the agricultural sector the

ESPON 2020 13
bergamot production is a crucial source of income for the area, suffering from problematic
relations among producers, processors and exporters.
«The bergamot production could represent a source of income for thousands of families here,
but a fair distribution of the value chain is blocked by oligopolistic market structures (very few
exporters). There is a need for an innovative strategy here: innovative projects to create
entrepreneurship networks and increase income in the short period» (Interviewee no. 10).
«In the last twenty years there has been a growing awareness of peculiarities of this area, of
its natural beauties and of opportunities for the valorisation of niche products. This result was
impossible ten years ago» (Interviewee no. 9).
Key factors explaining peripherality in the Area Grecanica are fundamentally two (see Figure
2.1): a) the weakness of local and regional institutions, and b) social relations based on
patronage and opportunistic relations. As we will see futher on, both factors feed each other
in a mechanism of mutual dependence3.
The role of institutions and institutional and social variables in the explanation of poor
economic performances in underdeveloped economies and their persistence over time has
been deeply studied in literature. The absence of solid and efficient institutions cause high
transaction costs, widespread rent-seeking, inequality and lack of trust4. If this is true, then
the question is why do some systems choose and maintain these dysfunctional institutions? A
theoretical model was proposed by Acemoglu, Johnson and Robinson5 to explain why “poor”
institutional environments are likely to be persistent. The quality of institutions is the key factor
in determining economic performance of a given territory. Quality of institutions strongly
depends, according to this model, from the de jure political power and the legislative frame.
The de jure political power refers to power that originates from political institutions in society
(form of government and constraints on politicians and local elites). The quality of institutions
also depends from the de facto political power, which is the power originating from the ability
of groups of individuals, even if they are not allocated power by political institutions, to solve
their collective action problem. Their power is strongly related to economic resources
available to the group, which determine both their ability to use (or misuse) existing
institutions. But quality of institutions does not affect only economic performance of a given
territory but also the distribution of resources and it is then able, through this way, to generate
mechanisms of persistence of specific elites and their de facto political power. From this logic
the quality of institutions is an endogenous variable of the territorial system.
Weak institutions in the Calabria case mean that public institutions (municipalities, national
park, provinces, mountain community, and regional administrations) are unable to design a
comprehensive and effective strategy to promote the creation of local public goods, which are
necessary to change living and employment conditions for all inhabitants. We are speaking of
“political” inability, as some experts/local actors point out:

ESPON 2020 14
«One of the most relevant weaknesses is the quality of public institutions, both political and
administrative, they do not perceive as a priority task the development problem» (Interview
no. 7).
«Political actors do not perceive in any way the needs of this territory. The public
administration usually acts as if knowing nothing about the problems of this area»
(Interviewee no. 5).
«We lack vision of the future and also of local/regional policy which is able to build a long-
term perspective based on local potentials. We also lack politicians and public officials that
are capable of negotiating the allocation of funds with the region and the State» (Interviewee
no. 4).
Almost all interviewees describe local and regional politicians as incompetent and linked to
specific social groups (or clients). They explain these negative characteristics as a result of
the political system and the way politicians are selected:
«There is an enormous gap between public policy-makers and people. Those competent and
skilled usually do not candidate themselves in the local/regional elections. Consequently, the
majority of elected politicians have no idea of how this territory can be developped and
valorised» (Interviewee no. 8)
«Politicians here, as in most of the Mezzogiorno regions, are not evaluated according to
criteria of personal commitment and results publically scrutinised, but only according to the
compliance to clients’ needs. This is a political system based on patronage and personal
relations between the single politician and his supporting group. Here voting for political ideals
does not exist anymore. Here voting for someone presupposes that there is some exchange
behind» (Interviewee no. 7).
The poor quality of local institutions and the social/political dominant system go hand in hand
and this is blocking whatsoever possibility of change in the political and administrative
leadership of the area. This contributes to consolidate the process of peripheralisation of the
Grecanica area. Weakness of local institutions does not necessarily mean the isolation of the
area from national/internatioinal political and economic circuits. Some interviewees pointed
out that no local politician was ever elected in the regional or national parliament. But this was
not decisive in explaining peripheralisation over the years and it was not strictly linked to the
lack of policy networking and capability of capturing public funds for the area. The policy
networking and the capability of capturing funds was not a problem, whereas it was the
patronage system the main problem characterising the local context. Moreover, the provision
of public policies has been ensured in the area (see paragraph 2.4) by the dynamism of local
development agencies, NGOs/local associations and local experts who implemented
development projects with local municipalities within private-public partnerships6.

ESPON 2020 15
Despite the immobilism of local/regional public institutions, this area shows some dynamism
in the field of private associations (social and cultural) and in the work done by the Local
Action Group, which is not only linked to LEADER activities.
«Associations are a key variable for this area. Cultural associations are diverse, but very
conflicting with each other. Social associations are more dynamic and succeed in influencing
local administrations. These associations collaborate to share common projects. There are
common catholic values helping to share initiatives to develop in collaboration. And there are
about thirty groups, cooperatives and associations» (Interviewee no. 6)
2.2 The case study against the region, country and Europe The Grecanica area is perceived as having the following characteristics compared to other
areas: a) a clear peculiarity in the context of the province and the Calabria region, as for both
cultural identity and economic potentials; b) a more peripheral position as for services’
accessibility and economic development; c) the peripheral position is perceived not only in
comparison to the nearest urban agglomeration (the metropolitan area of Reggio Calabria),
but also in comparison to other areas of the province, which similarly suffer from problems of
SGIs access and economic potentials; d) finally, strong linkages and flows of resources
emerge between the study area and the biggest urban area of Reggio Calabria, so that the
Grecanica area cannot be considered as a remote area, despite of severe lack of
infrastructural connectedness (road and railway networks).
The Grecanica area is seen as homogeneous under the cultural point of view: the old Greek
language is part of the population identity. In the past, population was quite numerous in inner
villages, but over time it migrated to coastline municipalities or to other areas starting from the
second half of the '900s. This process was so disruptive for local communities that some of
the inner villages were completely abandoned. This was also due to hydro-geological
instability of mountain settlements. These processes were more severe in this area than in
other areas of the Reggio Calabria province.
As we already said, the closest homogeneous areas within the province are as follows: a) the
Locride, in the Jonic North-eastern coast; b) the metropolitan area of Reggio Calabria, in the
South-western part of the Tyrrhenian coast; c) finally, the Gioia Tauro valley, in the Northern
part of the Tyrrhenian coast. The metropolitan area of Reggio Calabria shows the greatest
intensity of services and public/private functions, typical of the urban agglomeration. The
Gioia Tauro valley is more an agro-industry-oriented district and plays an important economic
role due to the development of a commercial port hub, whose creation was strongly supported
by public intervention of the State.
The phenomenon of depopulation of the last 14 years (1999-2013) does not affect the
province of Reggio Calabria equally and there are demographic imbalances between the
different areas. As evidenced in Table Ib in Annex 2, the overview of the demographic change
clearly shows the sharp decline of the Area Grecanica (-9%) versus a less dramatic reduction

ESPON 2020 16
of the areas of Locri (-5%) and Gioia Tauro (-4%). And this reflects the very low population
density of the case study area in comparison to regional and national levels: 71 inhabitants
per km2 for the whole Area Grecanica (that comes down to 29,98 inhabitants per km2 for the
predominantly mountainous municipalities) in comparison to 129 in Calabria and 198 in Italy.
In the perception of the experts interviewed, the Grecanica area is more peripherical than
other surrounding areas, but at the same time it shows more potentials than elsewhere:
«If we consider employment, income and the linkages with political networks [this area] is
lagging behind other areas. But when we consider potentials, it shows greatest resources,
and paradoxically this is due just to the lowest economic development» [that destroyed
natural resources in other areas] (Interviewee no. 8).
«Under the economic profile, indicators show surely that Grecanica is a peripheral area. But
at the same time, this area presents idle resources, scarcely visible, sometimes even the
same population isn’t fully aware of these potentials» (Interviewee no. 7).
The state of the art in the provision of SGIs is really critical. All local experts focus on
essential services: healthcare, education (primary and secondary school), public transports
and road networks. Various schools have been closed down, especially in inner villages, and
classes have been grouped and maintained only in some coastline municipalities, with the
consequent need of ensuring the daily commuting of students from inner villages by bus
service. Nevertheless there is a lack of complementary activities for all commuting students
(like sports, culture and school meals). Moreover, most of teachers come from the
metropolitan area of Reggio Calabria and do not know anything about the local culture. The
main hospital in Melito has been rationalised too, that meant closing some relevant medical
department. At the same time, medical assistance at local level was not strengthened through
doctors and general care services of first assistance. Road infrastructures are one of the most
critical issues in the area, with particular reference to connectedness between mountain and
coast.
The closeness with the metropolitan area of Reggio Calabria facilitates opportunities of
working and using services otherwise not available (e.g. high-qualified education at University
of Reggio Calabria), but very fragile conditions of road and railway networks create a
permanent disadvantage for local commuters and raises the costs of the daily commuting
between the Grecanica area and the urban centre.
2.3 Internal structures and disparities inside case study region In the Grecanica area there are huge disparities between coastline area and inner villages,
where outmigration and ageing are socio-demographic processes more disruptive than
elsewhere. This picture is confirmed both by statistical data and local actors/experts
interviewed in the field work.
Demographic differences are substantial within the case study area (Table IV). The area, in
fact, is characterized by an evident dualism between the more internal mountainous villages

ESPON 2020 17
(Bagaladi, Bova, Bruzzano, Cardeto, Ferruzzano, Roccaforte del Greco, Roghudi, San
Lorenzo, Staiti) and the predominantly coastline municipalities (Bova Marina, Brancaleone,
Condofuri, Melito Porto Salvo, Montebello Ionico, Palizzi).
Most of the first ones suffered in the past disasters caused by landslides and heavy flooding
but are also the strongholds of the local greek historical and cultural assets and still suffer
particularly the demographic decline (except the -12% of Bova, all show extremely negative
figures, ranging from the -20% of Ferruzzano to the -42% of Staiti) and the ageing of
population (in most cases well above the average of the overall study area, see Table IV). A
much smaller demographic and economic decline is instead showed in the coastal
municipalities, mostly below the average of the whole area.
Figure 2.3: Pentedattilo, part of the municipality of Melito Porto Salvo
This was the result of two different processes: first, an internal migration from mountains/hills
to coastline municipalities both of young couples with their school-aged children and of elderly
couples/singles in search for a closer assistance by their relatives living in the coast.
«Today depopulation is a neverending process, unless there are really effective interventions.
When younger generations leave, even elderly tend to follow them to the coast. Someone still
remains, but there are cases of retired people going to sleep in relatives’ houses during the
night and coming back to inner villages during the day. Inner villages also lose population for
a natural process: population is aged and the mortality rate is higher than elsewhere»
(Interviewee no.7).

ESPON 2020 18
The second relevant process is the outmigration of the younger population (-28%), both from
inner villages (-38%) and from the coastline areas (-25%) (Table IV). The higher is the level of
education and training, the higher is the likelihood of outmigration of the younger generation,
unable to find a job in the area. This is confirmed when looking at the youth unemployment
rate (about 50% in the area), with a slight higher rate in coastline areas where younger people
are proportionally more present.
Internal disparities are also visible in natural resources and cultural heritage. Both of them
were severely depleted by the diffuse and uncontrolled urbanisation of the coastline areas,
especially linked to second houses for people living in the metropolitan areas and to mass
tourism development in 1970s-1980s. This led to the reduction of agricultural cultivations
(orange, lemon, tangerine, jasmine, bergamot) important for families’ incomes and also for
landscape, having particular Mediterranean features (the so-called “gardens”). Soil
degradation and erosion, depletion of water resources, salinisation of watertables, pollution of
coastline areas were all negative effects realated to the wild urbanisation process.
Internal villages have not been touched by this disruptive urbanisation, but on the contrary
were characterised by a process of de-urbanisation, that meant abandonment by the native
population. This led to a sort of degradation of the oldest houses, churches and farm
buildings.
But there are several exceptions. Especially in those villages restored and renovated in the
90s and in the last decades (e.g. Bova and Palizzi) thanks to public investment supported by
the Cohesion policy and the Rural Development Plans. Natural resources and landscapes in
this part of the Grecanica area have always been under the threat of hydro-geological
erosion, and in fact some villages have been abandoned because under the risk of lanslides.
«In other areas of this province the economic development of 70s-90s destroyed natural
resources. I am thinking of areas like the Locride and Gioia Tauro valley. In the Grecanica
area the coast was devastated, while inner areas were not touched at all. We are now
developing rural tourism, cultural valorisation, hiking, etc. only thanks to these resources. If
we were in the Locride or in Gioia Tauro valley, this would have not been possible. We
succeed to attract here so many tourists from other Italian regions and also from other
countries because naturalistic and cultural assets are still here, somehow preserved as they
were many years ago» (Interviewee no. 8).

ESPON 2020 19
Figure 2.4: The abandoned old village of Roghiudi
2.4 The case study as a subject of local, regional and state coping strategies
The Area Grecanica is within a regional context belonging to the so-called Objective 1/less
developed regions. This status gave the region and the area the opportunity to spend
European and national financial resources for promoting econonomic and social
development. Different funds and policy tools have been implemented in the area (Table II):
not only single measures of Operational Programmes under ERDF/ESF and of Rural
Development Plan under EARDF, but also diverse forms of integrated territorial projects.
These projects were introduced in Italian programmes as a way to combine the most
opportune policy tools according to local needs. They have been widely incentivated in the
recent decade by regional administrations both in the context of the Cohesion policy and in
Rural Development Plans in order to make more integrated and effective the territorial
approach and more participated the design and the implementation of policies through the
setting up of a local partnership. As some experts said, not all these forms are in reality
integrated and participated. The analysis of diverse programmes implemented in the area
focuses in particular on the 2005-2015 period, the last decade, and it is based on public
expenditures singled out at the municipal level (LAU2) in the study area.
During the 2005-2015 period about 93.3 millions € have been delivered to the study area,
through different types of schemes. This means 9.3 millions per year and about 220 € per
inhabitant per year, that is certainly below the financial needs for renovating/enhancing the
ESPON 2020 20
territorial capital, especially in the field of SGIs. However, many local actors/experts
expressed strong criticism on the use of this money as far as the impact on the
entrepreneurship development and the provision of local collective goods are concerned.
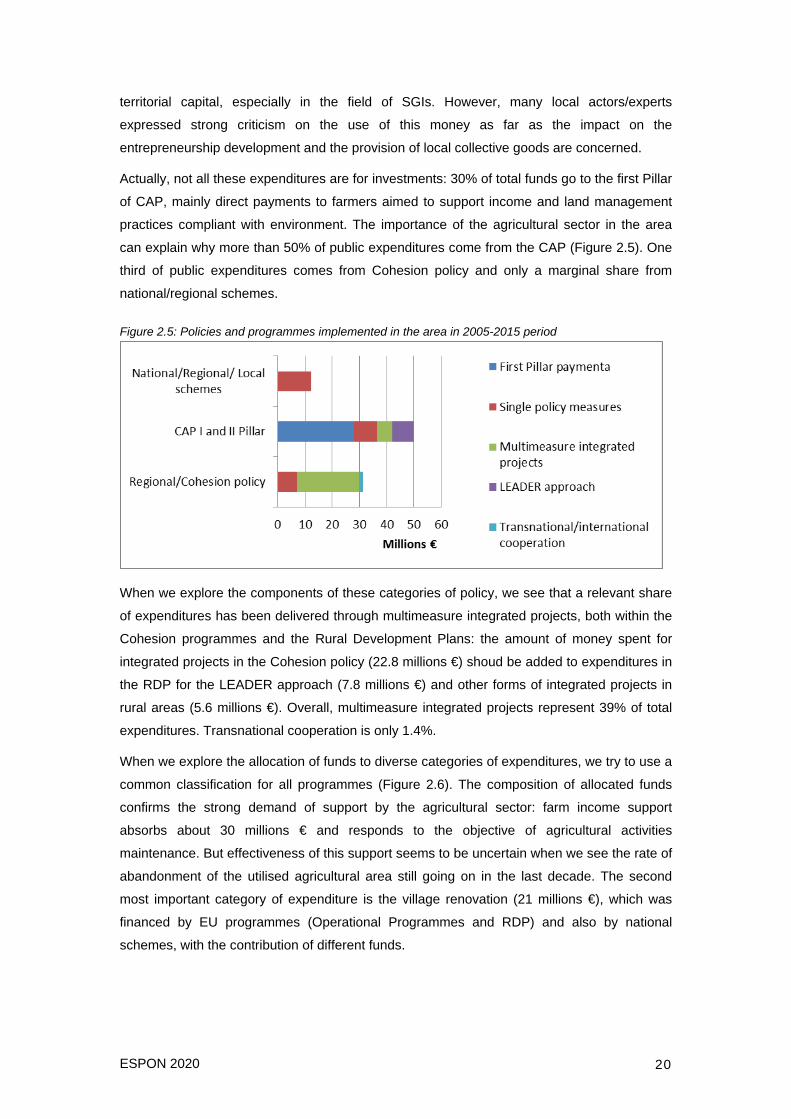
Actually, not all these expenditures are for investments: 30% of total funds go to the first Pillar
of CAP, mainly direct payments to farmers aimed to support income and land management
practices compliant with environment. The importance of the agricultural sector in the area
can explain why more than 50% of public expenditures come from the CAP (Figure 2.5). One
third of public expenditures comes from Cohesion policy and only a marginal share from
national/regional schemes.
Figure 2.5: Policies and programmes implemented in the area in 2005-2015 period
When we explore the components of these categories of policy, we see that a relevant share
of expenditures has been delivered through multimeasure integrated projects, both within the
Cohesion programmes and the Rural Development Plans: the amount of money spent for
integrated projects in the Cohesion policy (22.8 millions €) shoud be added to expenditures in
the RDP for the LEADER approach (7.8 millions €) and other forms of integrated projects in
rural areas (5.6 millions €). Overall, multimeasure integrated projects represent 39% of total
expenditures. Transnational cooperation is only 1.4%.
When we explore the allocation of funds to diverse categories of expenditures, we try to use a
common classification for all programmes (Figure 2.6). The composition of allocated funds
confirms the strong demand of support by the agricultural sector: farm income support
absorbs about 30 millions € and responds to the objective of agricultural activities
maintenance. But effectiveness of this support seems to be uncertain when we see the rate of
abandonment of the utilised agricultural area still going on in the last decade. The second
most important category of expenditure is the village renovation (21 millions €), which was
financed by EU programmes (Operational Programmes and RDP) and also by national
schemes, with the contribution of different funds.

ESPON 2020 21
Figure 2.6: European and national policies by categories of expenditures in the area in 2005-2015 period
The same happened for investments for the cultural identity. Village renovation and cultural
identity funds have been used mainly for restoring inner villages and for the
maintenance/valorisation of the Greek cultural traditions. Given the scarce presence of
entrepreneurship in all sectors, it is not surprising the relatively low share of expenditures in
entrepreneurship creation and competitiveness, both in agriculture and especially outside this
sector. In conclusion, the demand for policy support reflects strictly potentials and constraints
of the local economic structure.
Governance of policies in the area, as we have pointed out, is a key issue in understanding
why policies did not work as it was expected7. In the past, most of the policies were designed
by “central” institutions, especially the State and the regional administration. This is not true
for this area, where the role of local partnerships seems quite pro-active in designing
integrated projects (Figure 2.7), if we consider the amount of funds involved in projects
designed and proposed by them (37.5 millions €, more than 1/3 of total funds estimated in the
area in the period 2005-2015).
The role of the different actors changes when we consider their role in funds allocation, which
is decisive to ensure the coherence with policy design. In this case there is a clear process of
centralised governance, where the role of local partnerships is relevant in the design and only
marginal in the concrete management of projects. Regional administration centralises
decisions even in the more operational phases, in order to ensure compliance to rules and
legality, but there is no attention to the quality of projects and their impacts on territorial gaps.

ESPON 2020 22
Figure 2.7: Distribution of European and national funds (2005-2015) in the study area by responsability in policy design and funds’ allocations
0
5
10
15
20
25
30
35
40
45
50
55
National institutions(Ministerial structures)
Regional administration Local Partnerships (includingLAGs)
Mill
ions
Stategy design (€) Funds' allocation (€)
The contribution of this mix of policies to the process of peripheralisation is quite
controversial. In general, there is a diffuse consensus among local actors/experts on the lack
of holistic visions by all these programmes. The evaluation of policies implemented in the
area is two-faced. On one side, these policies are strongly criticised for being too much
fragmented in thousands of small isolated interventions, not really well-targeted to local needs
and ineffective, consolidating a local conservative elite that blocks innovation and in the worst
cases even destroys endogenous potentials.
«Policies implemented here have only allocated funds among “clients” in the territory. Many
initiatives created through policies at the end died because there was no market for products
and services. European Funds can promote the creation of infrastructures. We need no policy
to promote economic activities, but only entrepreneurs and markets» (Interviewee no. 2).
«Until now only the national Strategy for Inner Areas has been focused on the gap reduction.
Other policies were not really well-targeted to this area because they were only policies
designed outside and captured funds for local administrations’ needs» (Interviewee no.4)
Fragmentation and the “capture” of funds for achieving social consensus are two crucial
issues in influencing the effectiveness of policies implemented in the area, including the
design of the so-called “integrated approaches”. In the field of Cohesion policy, integration
among policy tools is sometimes criticised because it is reduced to mere sum up of several
measures funded by ERDF under the same objective.
«Fragmentation of public interventions among diverse municipalities is one of the most critical
point. This happens when each single mayor wants to draw funds for his own territory, despite

ESPON 2020 23
of the general strategy of a territorial project. Only when relations among mayors are driven
by trust, then you can find a more rational solution and avoid fragmentation» (Interviewee no.
3).
«Integrated Territorial Projects did not have actually a holistic vision of the whole area and
funds have been allocated among municipalities according to population size. Moreover, the
renovation of public and historical buildings was completed without planning their economic
valorisation and defining how they would have been managed» (Interviewee no. 6).
«The worst programmes financed those groups and those European Funds experts serving
only to promote public works» (Interviewee no. 10).
On another side, there are policies strongly appreciated because provided funds to renovate
territorial capital, to maintain social capital, to support innovative entrepreneurs and
integration among different local resources.
«The area was interested by diverse policies over the last fifteen years. Public investments
have been addressed to village renovation, agriculture and cultural assets. The reduction of
the gap with other areas was the main objective of the LEADER programme and the national
Strategy for Inner Areas […]. There were three fundamental types of investments: physical
capital in village renovation, soft investments and private investments by NGOs. Enhancing
the quality of historical buildings in Bova and promoting cultural traditions and assets have
been the most effective investments» (Interviewee no. 10).
Other local actors/experts agree on these positive impacts but at the same time point out
some limits of these investments in reducing the gap.
«There were several successful programmes in the creation of economic activities and village
renovation, but they were not accompanied by complementary actions on services to
population. In Bova, for example, historical buildings were renovated but you cannot find any
farmacy. These programmes should have also been targeted to essential services»
(Interviewee no. 4)
«Those investments made in Bova did not get the same success elsewhere. For example, in
the inner village of Gallicianò all European funds did not produce the same outcome because,
despite of projects, the road to get there is really in hard conditions» (Interviewee no. 9)
The policy with the highest impact is LEADER, for which a long-lasting Local Action Group
“Area Grecanica” is operating in the area (since 1994), with a technical staff quite
experienced in local development issues. Integration of diverse policy tools and funds here
has been quite effective, if compared with scarce financial resources provided by the regional
administration. Integration here was possible because, differently from the other territorial
policies implemented under the Cohesion policies, the LAG was capable to coordinate local
actions and promote a good governance of available funds. Local experts working in the LAG
structure were capable to set up a comprehensive strategy and to elicit the participation of
local administrators and some innovators in the area. But there have been strong conflicts

ESPON 2020 24
with some local administrators who felt loosing their role and capacity to influence the
management of LAG. In this conflict, the LAG’s technical staff and the private component tried
to defend independence and autonomy from any policy influence, but at the end the conflict
was resolved through a compromise solution and the LAG continued to operate following an
innovative logic. Innovation in LAGs initiatives was, firstly, in promoting entrepreneurship in an
area lacking entrepreneurs and, secondly, in achieving a successful integration between
culture/identity and the valorisation of agriculture, food specificities, environmental
endowments amd tourism development. This was not a really coherent strategy pursued from
the beginning of the LEADER programme, but it was a sort of learning by doing process. The
time dimension came out from some interviews, suggesting that in an area characterised by
peripheralisation processes the reduction of the gap with other areas takes time and must be
seen in a long term perspective:
«The programme with the highest impact was surely the LEADER in 1994-99. There were
great expectations and trust then, and very innovative initiatives have been financed. In the
2000-2006 period the LAG Area Grecanica lost effectiveness and credibility due to the
process of territorial enlargement requested by the regional administration. In 2007-2013
there was a new start, but new conflicts arised in the relations with local municipalities (…).
LEADER had a role in the development process, but what is important is pursuing this
objective in the long run together with an appropriate vision» (Interviewee no. 10).
«Promoting cultural initiatives like the “Paleariza” festival, linked to the Greek world, meant a
new way of looking at our own cultural identity and more generally to ourselves. It implied
looking at the dignity of our past, without denying traditions because in contrast with the myth
of the modernity. Today the traditions are transformed into resources: new jobs linked to
agriturism and to niche products were created» (Interviewee no. 7).
«At the beginning, the LEADER programme focused on a fundamental component of this
area: the cultural identity. Over time the LEADER has been also addressed to support local
entrepreneurs. There were so many applications by entrepreneurs (more than 120), but part
of them were unable to co-finance the private quota. They were all so ambitious and
undervaluated the financial burden for them. We adviced them to revise their applications and
proposed to prepare small projects which were more financially sustainable for their pockets»
(Interviewee no. 4).
But lack of synergy due to fragmentation was also a problem of implementing LEADER.
«A fundamental mistake, when we started, was allocating funds among all municipalities of
the territory, instead of concentrating funds on two-three strategic priorities based on territorial
needs. In this way the LAG got the consensus from all municipalities, but with poor results»
(Interviewee no. 3).
«Yes, it is true that there was some fragmentation among municipalities, but at that time
focusing on two-three priorities was not possible. We were not sufficiently aware of this
ESPON 2020 25
problem. The priority was then of achieving immediate outcomes in order to gain legitimation
from local people» (Interviewee no. 4).
2.5 Future scenarios Prospective analysis presented in this part of the report was aimed at answering three main
research questions:
• What are the externally and internally driven influences on the problem of inner
peripheralisation of a specific locality?
• What are the key drivers for the future development – chances or threats – in the
context of further peripheralisation processes in the area under investigation?
• What future scenarios can be drawn for each case study according to the estimated
positive or negative impact and likeliness of possible uptrend, downtrend or sideways
of key drivers in chosen localities suffering from inner peripheralisation?
In the PROFECY Project, future scenarios are defined as a description of a possible future
path of development of chosen case study areas. They are not intended to represent a full
description of the future, but rather to highlight central elements of a possible future and to
draw attention to the key factors that will drive future developments. In the PROFECY project,
“Scenarios are descriptions of journeys to possible futures. They reflect different assumptions
about how current trends will unfold, how critical uncertainties will play out and what new
factors will come into play“8 (UNEP 2002, p. 320). According to this definition, in the
PROFECY Project, future scenarios should be considered as “explorative” and/or
“descriptive” type as they are opposed to “normative” scenarios in literature. The main
question asked when building explorative scenarios is “What would happen if” and the
present is taken as their starting point.
Scenario building was based on the scenario questionnaire and the interviews carried with
experts and stakeholders listed in the Annex 8 to this report. Scenario questionnaire
consisted of four elements: (1) dimensions of inner peripherialisation process, (2) key factors
in each dimension, (3) likeliness and (4) strength of influence for the future development of
the area. Experts were asked to fill a questionnaire specifying on the scale -5 (strong negative
impact) to 5 (strong positive impact) and 0 for no impact for a set of factors and drivers of
peripherialisation process and the likeliness (distribution of 100% among particular trends) of
their impact in the chosen IP region with the indicated power on a possible uptrend, sideways
and downtrend (Figure 2.8).
Opinions of all experts were calculated and presented in Table 2.1 and Table 2.2, reflecting
their average assessments of the likeliness of a certain key factor to occur and its strength of
influence on periperalisation of the area in the future. The arrows used in tables represent the
most probable trend (or two trends, if the difference between their assets is below 5%) of
particular factors as evaluated by the experts.

ESPON 2020 26
Figure 2.8: The structure of the scenario questionnaire specifying elements to be evaluated by experts
Future scenarios for the development of Area Grecanica discussed hereafter are derived from
planning/policy documents, from interviews with local experts and from the scenario
questionnaire applied in all interviews to gain insight into the perspectives of experts on future
development of the area.
In focus groups and interviews with local actors and experts the importance of the national
Strategy for Inner Areas was aknowledged. They are aware that for the first time problems of
peripheralisation can be faced through a complete and holistic vision. To do this an
Association of local municipailities (represented by mayors) is trying to combine the National
Strategy with initiatives that are going to be implemented in the area by the LAG Area
Grecanica (some mayors of the area are part of the executive board of the LAG), in order to
build sinergies between diverse funds and policy tools. This can contribute to fill the gap in
strengthening essential services, which still have to be considered as one the main drivers of
peripheralisation in this area.
As for transport services, in the next future important public investments are planned in the
railway and train service along the Jonic coastline, including Area Grecanica. This can be
decisive in reducing physical isolation of this area from the rest of the region, but especially
from the metropolitan area of Reggio Calabria.
Several municipalities of Area Grecanica have been included within the borders of the
metropolitan area, this in principle can be very positive in intensifying public interventions at a
greater scale to provide more efficient services to the entire population. Some of the

ESPON 2020 27
interviewees, however, look quite skeptically at this perspective and what can be the real
advantage for the Area Grecanica from the new governance of the metropolitan area.
Increasing collaboration in the area between the Association of mayors and regional and
national administrations is a concrete perspective, with interesting potentials in terms of future
policy design. This collaboration has already started under the joint committee for the Inner
Area Strategy, but it is going to produce further effects with the implementation of this
strategy.
Another interesting perspective is the development of some of typical agri-food products of
the area. After the recent creation of two producers’ Associations, the bergamot production is
gaining more and more attention from national and international consumers, thanks to
medical properties of fruits components and the growth in juice demand. These perspectives
would require a proper governance and organisation of the value chain at local level, aiming
at achieving a fairer distribution of the value added within the supply chain in favour of the
bergamot producers. Very interesting perspectives are also seen in the tourism sector, mainly
in demand for mountain hiking and hospitality in inner villages. This also would require proper
governance, involving not only municipalities, but also the provincial/regional administrations,
the National Park and the University of Reggio Calabria.
Focus groups and interviews confirmed fragmented interests and lack of collaboration among
the principal actors in the area. Lack of trust and patronage relations are the main explicative
factors of the weakness of local institutions. Regional administration does not seem capable
to act as a catalyst of better local governance and this is another crucial weakness. National
institutions, in this case the Presidency of the Council of Ministers and the national Cohesion
Agency can act to induce more cooperative attitudes at regional and local level.
The scenario findings are presented in Table 2.1 and Table 2.2 and discussed below.
The first table shows the average of all experts’ assessment of the likehood of a certain
development to occur (in the next 5 years in %; experts had to divide 100% among the
possible options of an uptrend, a sideways and downtrend development). The assessments
of experts were very similar and seemed to have a common expectation of a general
worsening of the socio-economic situation in the area. In fact, all variables are expected to
increase by 3/4 of interviewees. For most of the variables there is a general consensus, given
that the average likehood is between 64% and 70%. Only for future perspectives of NGOs
there is a more balanced assessment between downtrend and uptrend.

ESPON 2020 28
Table 2.1: Results of scenario tool: Probability (next 5 years in %) – Average of all experts‘ assessments
Uptrend Sideways Downtrend
Number of residents 10,1 22,6 67,5
Ageing 76,0 16,0 16,0
Number of NGOs 33,6 26,6 44,3
Share of well-educated people 48,6 36,5 59,0
Number of jobs 14,4 18,0 70,0
Individual income 19,4 20,5 64,0
Access to SGIs 7,5 28,5 67,0
Development of the transport system 15,8 25,5 64,0
Cooperation of local authorities within the region
20,0 12,0 67,0
National level subsidies 7,5 24,5 70,0
Access to information on policy supply at national/regional level
44,0 18,0 61,7
Access to policy networks/relations 22,9 16,1 69,5
Sources: data from interviews with experts/local actors
Table 2.2 summarises the experts’ assessment on how each of the single factor can influence
peripheralisation, with negative numbers meaning a slowing down of, or even a
countermovement to, peripheralisation processes, while positive numbers imply increased
peripherality.
Looking at the downtrend column we can notice that three variables show a strong influence
on peripheralisation: 1) the population decrease, including outmigration processes; 2) the
access to SGIs; 3) the development of the transport system. This confirms what emerged
from qualitative interviews: without effective policies supporting services enhancement, the
process of circular cumulative influence between depopulation and services’ depletion will
continue.
It is also worthy noticing that for many variables the effect of downtrend is in absolute value
greater than the effect of uptrend. This means that negative effects of the diverse variables
have been really pervasive unitl now and further continuatiuon of downtrend would be hard to
be reversed. Furthermore, it seems that quite pessimistic views of the future have emerged.

ESPON 2020 29
Table 2.2: Influence on peripheralisation [+5 to -5] – Average of all experts‘ assessments
Uptrend Sideways Downtrend
Number of residents -3,0 -1,3 4,4
Ageing 3,9 0,0 -3,0
Number of NGOs -2,7 -0,8 3,0
Share of well-educated people -0,3 0,3 3,4
Number of jobs -2,6 0,1 3,3
Individual income -2,4 -0,3 2,9
Access to SGIs -1,7 1,1 4,4
Development of the transport system -2,3 1,4 4,6
Cooperation of local authorities within the region
-0,9 0,4 2,7
National level subsidies -0,8 0,9 3,7
Access to information on policy supply at national/regional level
-1,2 0,2 2,0
Access to policy networks/relations -1,2 1,0 3,1

ESPON 2020 30
3 Discussion Over the decades, the Area Grecanica has experienced a gradual and enduring process of
peripheralisation marked by loss of population, employment and services and by
abandonment and deterioration of the territory. Although it is the whole region to suffer from
weak economy, the problem is particularly significant in the Area Grecanica.
In the sourrounding areas, in fact, there is potential of competitiveness and relatively dynamic
economic conditions of specific sectors within specific territories. For example, the valley of
Gioia Tauro is highly specialized in olive and citrus cultivations and favoured by the presence
of a relevant port hub representing a strategic asset for local and regional development, and
the area of Locri, which is favoured by the extention of railways facilities and road network
allowing interconnection and interoperability between the Tyrrhenian Corridor and the Ionian
Corridor. In the case study area, instead, due to its distinctive pattern characterized by
prominent orographical obstacles and very poor accessibility, it is the urban centre of Reggio
Calabria to take on the role of centre of gravity as far as spatial organization, economic
development and service provision is concerned. In the perception of the experts interviewed,
the Area Grecanica is more peripheral than other surrounding areas, but at the same time it
shows more potentials than elsewhere.
Demoghaphic differences are very substantial within the case study area. The area, in fact, is
characterised by an evident dualism between the more internal mountainous villages and the
predominantly coastline municipalities.
The demographic decline is the result of two different processes: first, an internal migration
from mountains/hills to coastline municipalities and second, the outmigration of the younger
population that is especially intense in inner villages. Internal disparities are also visible in
natural resources and cultural heritage. Both were severely depleted by the diffuse and
uncontrolled urbanisation of the coastline areas, especially linked to second houses building
for people living in the metropolitan areas and mass tourism development in 1970s-1980s.
This led to reduction of agricultural cultivations (orange, lemon, tangerine, jasmine and
bergamot) important for families’ incomes and also for landscape, having particular
Mediterranean features (the so-called “gardens”).
Different funds and policy tools have been implemented in the area: not only single measures
of Operational Programmes under ERDF/ESF and of Rural Development Plans under
EARDF, but also diverse forms of integrated territorial projects. Actually, not all these
expenditures are for investment: 30% of total funds go to the first Pillar of CAP, mainly direct
payments to farmers to support income and land management practices compliant with
environment. The importance of the agricultural sector in the area can explain why more than
50% of public expenditures come from the CAP. One third of public expenditures come from
Cohesion policy and only a marginal share from national/regional schemes. The contribution
of this mix of policies to the process of peripheralisation is quite controversial. In general,
there is a diffuse consensus among local actors/experts on the lack of holistic visions by all

ESPON 2020 31
these programmes. Fragmentation and the “capture” of funds for achieving social consensus
are two crucial issues in influencing the effectiveness of policies implemented in the area,
including the design of the so-called “integrated approaches”. On another side, there are
policies strongly appreciated because provided funds to renovate territorial capital, to
maintain social capital, to support innovative entrepreneurs and integration among different
local resources. The policy with the highest impact is LEADER, for which a long-lasting Local
Action Group “Area Grecanica” is operating in the area (since 1994), with a technical staff
quite experienced in local development issues. Integration of diverse policy tools and funds
here has been quite effective, if compared with scarce financial resources provided by the
regional administration. Integration here was possible because, differently from the other
territorial policies implemented under the Cohesion policies, the LAG was capable to
coordinate local actions and promote a good governance of available funds.
Peripheralisation has been a cumulative process over the last fifty years, where the quality of
local institutions, infrastructures and SGIs, the human and social capital, economic
performances and, last but not least, specific social relations have all interacted in a sort of
vicious circle. Key factors explaining peripherality in the area Grecanica are fundamentally
two: a) the weakness of local and regional institutions, and b) social relations based on
patronage and opportunistic relations. There are examples of dynamism from the private
sector: private associations (social and cultural), some local development agency like the
Local Action Group, some innovative small and medium entrepreneurs who introduced
interesting novelties in the way of producing and in the relations with international markets.
They are slightly increasing, as the demand for niche products and sustainable tourism is
increasing from abroad. But these innovative experiences are growing slowly and in a
pioneristic way, due to the still poor conditions in the prerequisites for the diffusion of
innovations (good infrastructures and services, efficient public administrations, respect of the
rule of low).
The Area Grecanica can be defined as a sort of “periphery within a peripheral area” from the
economic point of view. This area presents several characteristics which can be derived from
the three types described in the Interim Report: 1) first, like the type 1, it is excluded from the
agglomeration advantages of the metropolitan area of Reggio Calabria, and local population
and enterprises have to pay high transport costs to reach the centre of services and regional
and national markets; 2) it is similar to type 2 if we consider the poor access to Services of
General Interest not driven by the distance (the city of Reggio Calabria is just 25-30 km far
from Melito, the center of Area Grecanica); 3) it is very close to the type 3 in terms of role of
weakness of instituitons and relative implications on political capacity to act and socio-cultural
aspects that contribute to generate a phenomenon of institutional “lock-in”. As we already
said, institutions (especially the local and the regional level) play here a fundamental role, in
conjunction with the socio-cultural factors that reproduce the status quo and block social and
economic innovation. This contributes to consolidate the process of peripheralisation of the
Grecanica area. Weakness of local institutions does not necessarily mean the isolation of the

ESPON 2020 32
area from national/internatioinal political and economic circuits. This area has never been
represented by local politicians in the regional or national parliament. But this does not mean
that this area is politically isolated or that the specific interests of this area are not represented
and/or supported in the regional or national context. In other words, this does not mean that
this area is politically unconnected. In addition, when we explore economic connectedness of
some niche products or some innovative activity (e.g. the nature tourism) we notice that
entrepreneurs were able to set international networks that created new markets and
opportunity to enlarge their business.
In conclusion, we cannot say that connectedness is a problem for this area, both with political
and business networks. The issue is that local elites use political and economic networks to
consolidate their power through patronage practices. The policy networking and the capability
of capturing funds was not a problem, while patronage system was the main problem
characterising the local context.

ESPON 2020 33
4 Conclusions In the Grecanica area there are four types of triggers that are influencing the process of
peripheralisation:
- The multi-level governance and the relations of power between the local and the
highest tiers did not work in the sense of supporting and assisting the local level in
designing appropriate projects. The national and, even more, the regional tiers have
simply reduced the public spending and rationalised services, rather than developing
more advanced functions;
- Political and economic netwoks that local actors were able to set up in the public and
private domain are characterised by dependence, patronage and opportunitstic
relations. These types of relations with polical and economic networks outside the
area reflect strictly the relation of the same types within the area;
- The evolution of public funding, including European and national policies, has been
declining in the last decade and this causes the constant fall of the quality of SGIs.
External investments appear more and more necessary to finance the
creation/maintenance of the territorial and human capital;
- The evolution of markets is the only factor acting in an opposite direction (counter-
trend) as far as the new demand for sustainable tourism and quality products are
concerned.
These triggers combine with the regional/local drivers we have already described in the
previous paragraphs. How do they match and what kind of impacts will come out of these
processes depend on the capability to innovate of some institutional stakeholders
(municipalities of the area, the Aspromonte National Park, the Area Grecanica Local Action
Group) and private entrepreneurs who want to achieve substantial change in their social and
economic situations. We would point out that these impacts rely on local human resources, on
one hand, and on the capabilities of local actors to set up alliances with national and
international actors (both institutions and firms), on the other hand. Consequently, the
relevant policy scale here is the local one, but in the multi-level governance logic the local-
national relation is also important. The Inner Areas Strategy is an example, in this case, of
how the local-national relation can create new opportunities to escape from the “lock-in”
phenomenon. A similar example, in the private sector, is the relation local farmers-
international buyers in the bergamot production, where local producers were able to expand
the market and move from a niche product to a high-quality product for extra-UE countries.
Two scenarios can be envisaged: a) the “status quo”, with usual features of low level of
wellbeing, continuous outmigration and demographic ageing, etc.; b) a “sustainable
innovation” scenario, whith the perspectives of a better level of entrepreneurs, an increasing
territorial value added and a slowing down of outmigration.

ESPON 2020 34
Figure 4.1: Visualisation of triggers / drivers / defining features of case study area
The shift from the first to the second scenario, as many experts and local ators have pointed
out, is quite problematic without the pre-requisite of better SGIs access for population and
economic activities. This can be considered as a “political mutable” driver, if national or
regional policies are well-targeted and not fragmented in many small pieces of intervention as
in the past.
The other condition concerns local governance, which is crucial for policy effectiveness.
Public policies and private initiatives have to be coordinated; population has to be involved
into a process of inclusive and open discussion; all possible innovators should be involved in
a careful scrutiny by experts supporting the strategy design. This is to avoid that EU funds are
used for policy consensus at local level. The new mode of governance cannot be
implemented only by public bodies (municipalities) in order to reduce the risk that public
administration responds only to vested interests: this would require setting up a mixed
partnership (public + private), following the model of the LAG in the LEADER approach.

ESPON 2020 35
List of Tables Table 2.1: Results of scenario tool: Probability (next 5 years in %) – Average of all experts‘
assessments ............................................................................................................................ 28
Table 2.2: Influence on peripheralisation [+5 to -5] – Average of all experts‘ assessments ... 29
List of Figures Figure 1.1: The Fiumara Amendolea ......................................................................................... 3
Figure 1.2: The Ionic Railway .................................................................................................... 4
Figure 2.1: Descriptive model of Inner Periphery Processes in the Grecanica area .............. 11
Figure 2.2: Bergamot cultivation .............................................................................................. 12
Figure 2.3: Pentedattilo, part of the municipality of Melito Porto Salvo ................................... 17
Figure 2.4: The abandoned old village of Roghiudi ................................................................. 19
Figure 2.5: Policies and programmes implemented in the area in 2005-2015 period ............. 20
Figure 2.6: European and national policies by categories of expenditures in the area in 2005-
2015 period .............................................................................................................................. 21
Figure 2.7: Distribution of European and national funds (2005-2015) in the study area by
responsability in policy design and funds’ allocations ............................................................. 22
Figure 2.8: The structure of the scenario questionnaire specifying elements to be evaluated
by experts ................................................................................................................................ 26
Figure 4.1: Visualisation of triggers / drivers / defining features of case study area ............... 34
List of Maps Map 1.1: Geographical location of the case study area in regional and national scale ............ 2
Map 1.2: Location of the case study area within administrative structures ............................... 5
Map 1.3: Main transport networks and relief ............................................................................. 7
Map 1.4: Inner peripheries (grid cells) based on poor access to regional cetres by car ........... 8
Map 1.5: Lau-2 units identified as inner peripheries based on poor access to regional centres
by car ......................................................................................................................................... 9
Annex Map 1: LAU-2 units identified as inner peripheries based on poor access to hospitals
by car ....................................................................................................................................... 37

ESPON 2020 36
Annex Map 2: Travel time to next hospital (min) ..................................................................... 38
Annex Map 3: Travel time to next hospital (standardized at average of neighbouring NUTS-3
regions) .................................................................................................................................... 39
Annex Map 4: LAU-2 units identified as inner peripheries based on poor access to primary
schools by car .......................................................................................................................... 40
Annex Map 5: Travel time to next primary school (min) .......................................................... 41
Annex Map 6: Travel time to next primary school (standardized at average of neighbouring
NUTS-3 regions ....................................................................................................................... 42
Annex Map 7: Travel time to next UMZ ................................................................................... 43
Annex Map 8: Travel time to next UMZ (standardized at average of neighbouring NUTS-3
region) ...................................................................................................................................... 44
Annex Map 9: Corine land cover typology of the Case Study area, 2012............................... 45

ESPON 2020 37
Annex Map 1: LAU-2 units identified as inner peripheries based on poor access to hospitals by car

ESPON 2020 38
Annex Map 2: Travel time to next hospital (min)

ESPON 2020 39
Annex Map 3: Travel time to next hospital (standardized at average of neighbouring NUTS-3 regions)

ESPON 2020 40
Annex Map 4: LAU-2 units identified as inner peripheries based on poor access to primary
schools by car

ESPON 2020 41
Annex Map 5: Travel time to next primary school (min)

ESPON 2020 42
Annex Map 6: Travel time to next primary school (standardized at average of neighbouring NUTS-3 regions

ESPON 2020 43
Annex Map 7: Travel time to next UMZ

ESPON 2020 44
Annex Map 8: Travel time to next UMZ (standardized at average of neighbouring NUTS-3
region)

ESPON 2020 45
Annex Map 9: Corine land cover typology of the Case Study area, 2012

ESPON 2020 46
List of Annexes Annex 1: Table Ia. Introductory data
Annex 2: Table Ib. Exploratory data
Annex 3: Table II. Policies and programmes
Annex 4: Table III. Governance structures
Annex 5: Table IV. Socio-economic characteristic of administrative units of case study area
(internal structure)
Annex 6: Table V. Content analysis of coping strategies documents
Annex 7: Table VI. Content analysis of newspaper archives – image / stigmatization
Annex 8: List of experts

ESPON 2020 47
Annex 1: Table Ia. Introductory data
No. Identification of case study area
1.1 Administrative regions involved LAU2
1.2 Name and ID of the NUTS-3 areas that are (partly) covered by IP area Province of Reggio Calabria - ITF65
1.3 Size of IP in km² (and national average IP size) 596,10 Km2
1.4 Classification of concerned NUTS-3 area according to urban-rural typology as developed by DG AGRI and DG REGIO
intermediate (close to a city)
1.5 Names of the regional centres within the IP Reggio Calabria
2 Delineation outcomes
2.1 IP according to Delineation 1 (Travel time to Regional Centres) y/n Y
2.2 IP according to Delineation 2 (Economic potential interstitial areas) y/n N
2.3 IP according to Delineation 3 (Areas of poor access to SGI) y/n Y
2.4 IP according to Delineation 4 (Depleting area index) y/n and % of area coverage; brief qualitative description of the situation
N
2.5 Type of IP according to PROFECY delineation-typology -

ESPON 2020 48
Annex 2: Table Ib. Exploratory data
No. Issues
Province o Reggio Calabria (NUTS-3)
Calabria (NUTS-2) Italy Area
Grecanica Locride Gioia Tauro Valley
Metropolitan Area of Reggio Calabria
3
3.1 Population density per km² (2013) 71 94 171 495 129 198
3.2 Total population (2013) 42,201 112,807 160,339 234,976 1,958,238 59,685,227
3.3 Population development (1999-2013) -0.09 -0.05 -0.04 0.00 -0.03 0.05
3.4 Population development age 18-30, (2002-2011) -0.15 -0.10 -0.11 -0.12 -0.14 -0,15
3.5 Old age dependency ratio (2011) 0.35 0.30 0.27 0.29 0.29 0.32
3.6 Gender Imbalance (2013) (M/F) 0.95 0.95 0.95 0.93 0.95 0.94
3.7 Ethnic composition (2013) 0.05 0.03 0.04 0.05 0.04 0.07 4
4.1 Growth measured as Disposable Income per capita (2011)
12,410 12,604 17,337
4.2 Unemployment rate (2011) Area Grecanica: 19,10 Province of Reggio Calabria: 20.27 19.47 11.42
4.3 Youth unemployment rate (2011) 51.42 49.61 34.74
4.4
Main economic basis: Share of employees per sector 2011 (agriculture, industry, services)
Agr 25% 30% 28% 7% 17% 6%
Ind 14% 14% 15% 13% 16% 27%
Serv 61% 56% 57% 80% 67% 67%
4.5
Development of the economic situation in the past (dominant industries, major breaks etc.; please describe in a few sentences)
In the Area Grecanica it is the third sector that prevails (mainly tourism), however agriculture (mostly livestock farming) has always played a fundamental role in the local economic system. In particular, local development models address land abandonment, rural depopulation, ageing of the rural population. In order encourage a reverse trend, actions put in place are aimed at regaining a strong cultural identity, restoring, renovating and valorising historic internal villages, encourage rural tourism and handicraft.
4.6 Share of tertiary educated people (according to ISCED, 2013)
11% - - - 11% 11%
4.7 Forms / Amounts of received financial transfers -
4.8 Share of population with no access to Broadband from fixed line and mobile (2013)
22.1% - - - 10.2% 3.5%
4.9
Virtual SGI provision (local government initiatives / support of virtual services) (please describe in a few sentences)
-
Source: our elaboration on data from ISTAT (the Italian National Institute of Statistics)

ESPON 2020 49
Annex 3: Table II. Policies and programmes
Types of policy/programme
Duration of participation (period of implementation)
Objectives related to the study area
Type of project implemented in the study area
Measure/Fund
Financial expenditures in the study area (public expenditure)
TOTAL RESOURCES 93,279,967 5. Regional/Cohesion policy 31,239,550
5.1. Specific policy measure financed by the Operational Programme (ERDF, ESF)
ERDF Axiss 2 Energy 2009-2015 Renewable energy and energy saving Village renovation Infrastructures ERDF 831,488
EDRF Axis 3 Environment 2009-2016
Soil protection, costal protection, waste management
Village renovation Infrastructures ERDF 2,296,844
ERDF Axis 4 Quality of life and Social inclusion 2009-2013 Education, Social
inclusion Education Infrastructures/ Services ERDF 2,483,412
ESF Axis 1 Adaptability 2012
Training scheme for hydraulic-forestry workers (Consorzio di Bonifica Basso Ionio Reggino)
Training Services ESF 507,581
ESF Axis 4 Human capital 2009-2013 Strengthening of
competences Training Services ESF 1,032,064
Total specific measures 7,151,389
5.2. Transnational/interterritorial cooperation
Interregional Operational Programme "Natural, cultural attractors and tourism"
2011-2013
Enhancement of local tourist system and tourist destinations
Village renovation Infrastructures ERDF 1,341,184
5.3. Other initiatives: Multifund/Multimeasure/Multiactor integrated projects
Specific Project ISMIA "Valorisation and safeguard of ethno-linguistic minorities of the Greeks of Calabria"
(ROP 2000-2006)
Realisation of innovative cultural events and cultural networks
Cultural identity Services ERDF 2,100,000
Integrated territorial project PIT no. 23 "I 2005-2008 Protection and
enhancement of Total PIT no. 23 9,953,360
Village renovation Infrastructures ERDF 6,044,600

ESPON 2020 50
Types of policy/programme
Duration of participation (period of implementation)
Objectives related to the study area
Type of project implemented in the study area
Measure/Fund
Financial expenditures in the study area (public expenditure)
CALAVRIA DIKIMA" ("Our Calabria")
natural, cultural and historical heritage
Entrepreneurship Aid schemes 1,074,175 Technical Assistance Services 80,985
Education/Training Services ESF 2,592,000
Entrepreneurship Aid schemes FIFG 161,600 Integrated local development project for Quality of life: PISL “Disability and social hardship"
2012-2013 Inter-municipal services for a better qualty of life
Social inclusion Infrastructures ERDF 610,000
Integrated local development project for depopulation: PISL "PAESE MIO" (My village")
2012-2013
Contrast to depopulation of marginal and declining areas
Village renovation Infrastructures ERDF 2,274,000
Integrated local development project linguistic minorities: PISL “I RIZE TIS KULTURA GREKA” (Grecanic Cultural Heritage Site)
2012-2013 Protection and enhancement of cultural heritage
Cultural identity Infrastructures ERDF 6,737,450
Integrated local development project for tourist systems: PISL “Aspromonte within …. beach "
2008-2013
Enhancement of local tourist system and tourist destinations
Village renovation Infrastructures ERDF 463,168
Integrated local development project for Villages of Excellence: PISL “Kalòs Ìrtete” (Cultural District)
2013
Valorisation of historical centres and of Villages of Excellence
Cultural identity Infrastructures ERDF 609,000

ESPON 2020 51
Types of policy/programme
Duration of participation (period of implementation)
Objectives related to the study area
Type of project implemented in the study area
Measure/Fund
Financial expenditures in the study area (public expenditure)
Total integrated projects 22,746,978
6. First CAP pillar + Rural Development programmes (EARDF) 49,833,834
6.1 CAP First Pillar
Pillar 1 payments 2007-2013
Support of farm incomes (Direct payments + decoupled payments)
EAGF 27,955,399
6.2. Specific policy measure financed by the RDP
Pillar 2 measures 2007-2013 Agro-environmental payments
EARDF 3,815,734
Pillar 2 measures 2007-2013 Less favoured area payments EARDF 1,238,418
Pillar 2 measures 2007-2013 Investments in farm and processing industry
EARDF 1,570,958
Pillar 2 measures 2007-2013 Investments in diversification EARDF 1,809,842
6.3. Leader initiative
Leader+ Area Grecanica 2000-2006
Integrated valorisation of archeological, cultural and
environmental heritage
Total Local Development Plan 2,243,000 Management and animation Services EARDF 887,800
Training Services EARDF 220,500
Village renovation Infrastructures EARDF 435,400
Competitiveness Infrastructures EARDF 43,400
Competitiveness Infrastructures EARDF 374,900
Environment and land management
Non-productive investments EARDF 281,000
Local Development Plan - LAG Area Grecanica 2009-2015
Total Local Development Plan 5,600,000 Competitiveness Aid schemes EARDF 1,100,000

ESPON 2020 52
Types of policy/programme
Duration of participation (period of implementation)
Objectives related to the study area
Type of project implemented in the study area
Measure/Fund
Financial expenditures in the study area (public expenditure)
Environment and land management
Non-productive investments EARDF 200,000
Diversification and quality of life Infrastructures EARDF 3,400,000
Management and animation Services EARDF 700,000
Cooperation EARDF 200,000
6.4. Other initiatives: integrated projects
Integrated projecs for rural areas PIAR no.37 "Area Grecanica"
2005-2008 Enhancement of rural areas
Total PIAR no. 37 3,271,903 Competitiveness Aid schemes EARDF 307,500
Social inclusion Aid schemes EARDF 190,580
Village renovation Infrastructures EARDF 1,436,668
Competitiveness Aid schemes EARDF 300,000
Social inclusion Services EARDF 474,220
Village renovation Infrastructures EARDF 562,935
Integrated projecs for rural areas PIAR no. 4 "Stin Chuma"
2009-2013 Enhancement of rural areas
Total PIAR no. 4 2,328,579 Competitiveness Infrastructures EARDF 1,278,579
Environment and land management
Non-productive investments EARDF 300,000
Social inclusion Services EARDF 750,000
7. National/regional/local schemes (own funds) 12,206,583
National Scheme
Framework Programme Agreement on Cultural Assests
2003-2006
Enhancement of natural, cultural and historical heritage
Village renovation Services MEL 1-10 6,000,000

ESPON 2020 53
Types of policy/programme
Duration of participation (period of implementation)
Objectives related to the study area
Type of project implemented in the study area
Measure/Fund
Financial expenditures in the study area (public expenditure)
National Scheme Local Agenda 21 Programme 2004-2007 Sustainable
development Study and dissemination Services
206,583
Regional Scheme
Investments in bergamot farming and processing industry
2007-2013
6,000,000

ESPON 2020 54
Annex 4: Table III. Governance structures
Types of policy/programme
Duration of participation (period of implementation)
Strategy design
Composition of the partnership involved in the
project
Project implementation
Project financing and control
5. Regional/Cohesion policy
5.1. Specific policy measure financed by the Operational Programme (ERDF, ESF)
ERDF Axis 2 Energy 2009-2015 Region No partnership involved
Private and public beneficiaries Region
EDRF Axis 3 Environment 2009-2016 Region No partnership
involved Private and public beneficiaries Region
ERDF Axis 4 Quality of life and Social inclusion 2009-2013 Region No partnership
involved Private and public beneficiaries Region
ESF Axis 1 Adaptability 2012 Region No partnership involved
Private and public beneficiaries Region
ESF Axis 4 Human capital 2009-2013 Region No partnership
involved Private and public beneficiaries Region
5.2. Transnational/interterritorial cooperation
Interregional Operational Programme "Natural, cultural attractors and tourism"
2011-2013 Cooperation partnership
Public bodies: municipalities and parks
Cooperation partnership Region
5.3. Other initiatives: Multifund/Multimeasure/Multiactor integrated projects
Specific Project ISMIA "Valorisation and safeguard of ethno-linguistic minorities of the Greeks of Calabria"
(ROP 2000-2006) Region No partnership
involved Private and public beneficiaries Region
Integrated territorial project PIT no. 23 "I CALAVRIA DIKIMA" ("Our Calabria")
2005-2008 Region No partnership involved
Private and public beneficiaries Region
Integrated local development project for Quality of life: PISL
2012-2013 Region No partnership involved
Private and public beneficiaries Region

ESPON 2020 55
Types of policy/programme
Duration of participation (period of implementation)
Strategy design
Composition of the partnership involved in the
project
Project implementation
Project financing and control
“Disability and social hardship" Integrated local development project for depopulation: PISL "PAESE MIO" (My village")
2012-2013 Region No partnership involved
Private and public beneficiaries Region
Integrated local development project linguistic minorities: PISL “I RIZE TIS KULTURA GREKA” (Grecanic Cultural Heritage Site)
2012-2013 Region No partnership involved
Private and public beneficiaries Region
Integrated local development project for tourist systems: PISL “Aspromonte within …. beach "
2008-2013 Region No partnership involved
Private and public beneficiaries Region
Integrated local development project for Villages of Excellence: PISL “Kalòs Ìrtete” (Cultural District)
2013 Region No partnership involved
Private and public beneficiaries Region
6. First CAP pillar + Rural Development programmes (EARDF)
6.1 CAP First Pillar Pillar 1 payments 2007-2013 Ministry of Agriculture
No partnership involved Private beneficiaries Payment Agency
6.2. Specific policy measure financed by the RDP
Pillar 2 measures 2007-2013 Region No partnership involved Private beneficiaries Region +
Payment Agency
Pillar 2 measures 2007-2013 Region No partnership involved Private beneficiaries Region +
Payment Agency Pillar 2 measures 2007-2013 Region No partnership Private beneficiaries Region +

ESPON 2020 56
Types of policy/programme
Duration of participation (period of implementation)
Strategy design
Composition of the partnership involved in the
project
Project implementation
Project financing and control
involved Payment Agency
Pillar 2 measures 2007-2013 Region No partnership involved Private beneficiaries Region +
Payment Agency
6.3. Leader initiative Leader+ Area Grecanica 2000-2006 Local Action
Group Private + public partners Local Action Group Region + LAG
Local Development Plan - LAG Area Grecanica 2009-2015 Local Action
Group Private + public partners Local Action Group Region + LAG
6.4. Other initiatives: integrated projects
Integrated projecs for rural areas PIAR no.37 "Area Grecanica"
2005-2008 Region No partnership involved
Private and public beneficiaries
Region + Payment Agency
Integrated projecs for rural areas PIAR no. 4 "Stin Chuma"
2009-2013 Region No partnership involved
Private and public beneficiaries
Region + Payment Agency
7. National/regional/local schemes (own funds)
National Scheme Framework Programme Agreement on Cultural Assests
2003-2006 Ministry of Cultural Assets
No partnership involved
Private and public beneficiaries
National Scheme Local Agenda 21 Programme 2004-2007 Ministry of
Environment No partnership involved
Private and public beneficiaries
Regional Scheme Investments in bergamot farming and processing industry
2007-2013 Region No partnership involved Private beneficiaries
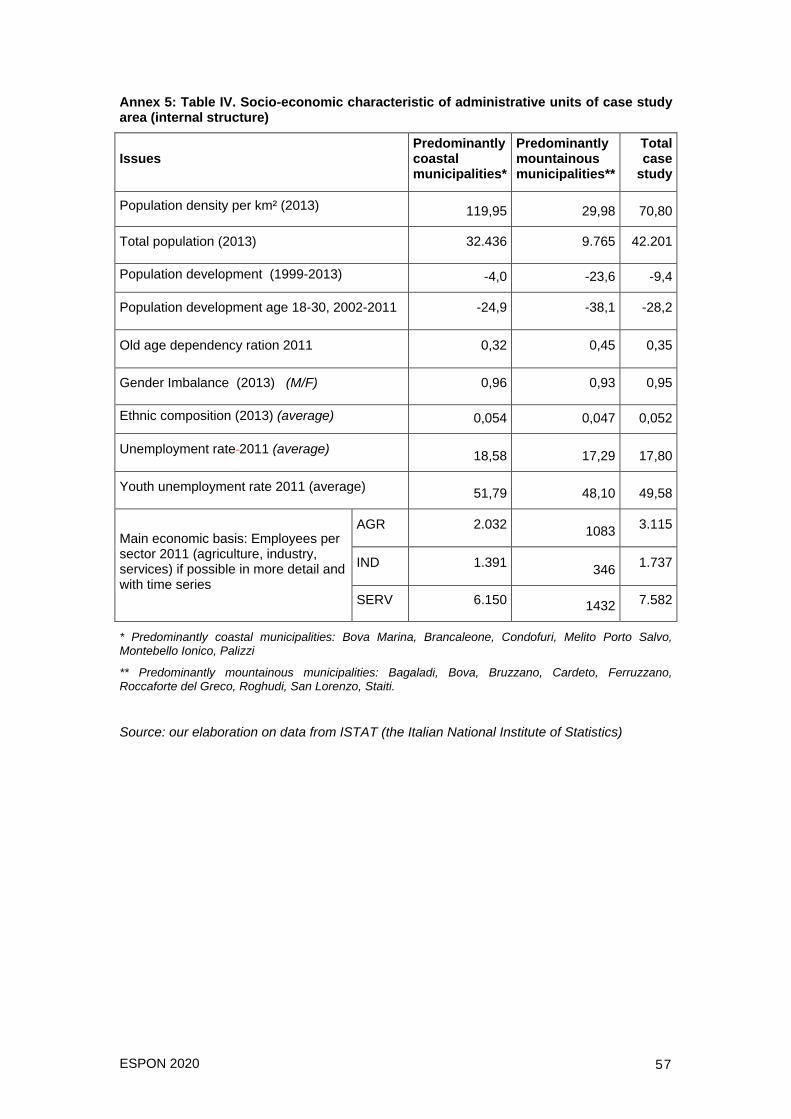
ESPON 2020 57
Annex 5: Table IV. Socio-economic characteristic of administrative units of case study area (internal structure)
Issues Predominantly coastal municipalities*
Predominantly mountainous municipalities**
Total case
study
Population density per km² (2013) 119,95 29,98 70,80
Total population (2013) 32.436 9.765 42.201
Population development (1999-2013) -4,0 -23,6 -9,4
Population development age 18-30, 2002-2011 -24,9 -38,1 -28,2
Old age dependency ration 2011 0,32 0,45 0,35
Gender Imbalance (2013) (M/F) 0,96 0,93 0,95
Ethnic composition (2013) (average) 0,054 0,047 0,052
Unemployment rate 2011 (average) 18,58 17,29 17,80
Youth unemployment rate 2011 (average) 51,79 48,10 49,58
Main economic basis: Employees per sector 2011 (agriculture, industry, services) if possible in more detail and with time series
AGR 2.032 1083 3.115
IND 1.391 346 1.737
SERV 6.150 1432 7.582
* Predominantly coastal municipalities: Bova Marina, Brancaleone, Condofuri, Melito Porto Salvo, Montebello Ionico, Palizzi
** Predominantly mountainous municipalities: Bagaladi, Bova, Bruzzano, Cardeto, Ferruzzano, Roccaforte del Greco, Roghudi, San Lorenzo, Staiti.
Source: our elaboration on data from ISTAT (the Italian National Institute of Statistics)

ESPON 2020 58
Annex 6: Table V. Content analysis of coping strategies documents
Document 1
Title Local Action Plan 2007-2013 – LEADER approach
Information and status of the document Document approved by the Calabria Region
Type of the document (plan/strategy/…)
Plan composed by a strategy and objective, measures and financial plan
Governance level/levels (local/regional/…)
Governance is based on the policy design function assigned to the Local Action Group and the funds’ allocation which is shared by the regional administration and the LAG (first approval by the LAG e definitive approval by the Region)
Synthesis/general foundings of the document – in context of peripherality of case study region or its part
The strategy of the Local Action Group is targeted to cultural traditions, village renovation and creation of new entrepreneurship in agriculture, tourism and craft activities
Document 2
Title Strategy for Grecanica Inner area
Information and status of the document
The strategy has been generally defined and has to be approved by the regional administration and the National Commettee for Inner areas
Type of the document (plan/strategy/…)
The plan is composed by objectives, expected results, priorities, measures and financial plan
Governance level/levels (local/regional/…)
Governance is based on the policy design co-defined and co-decided by the Association of local municipalities, the Region and the national Committee for Inner areas. The funds allocation is partly on the hands of the Association of local municipalities and partly is conditioned by the approval of the national Cohesion Agency and the Region
Synthesis/general foundings of the document – in context of peripherality of case study region or its part
The strategy is targeted to the enhancement of services in field like primary and secondary education, local transports and healthcare. In addition there are interventions on local development to valorize niche products and tourism.
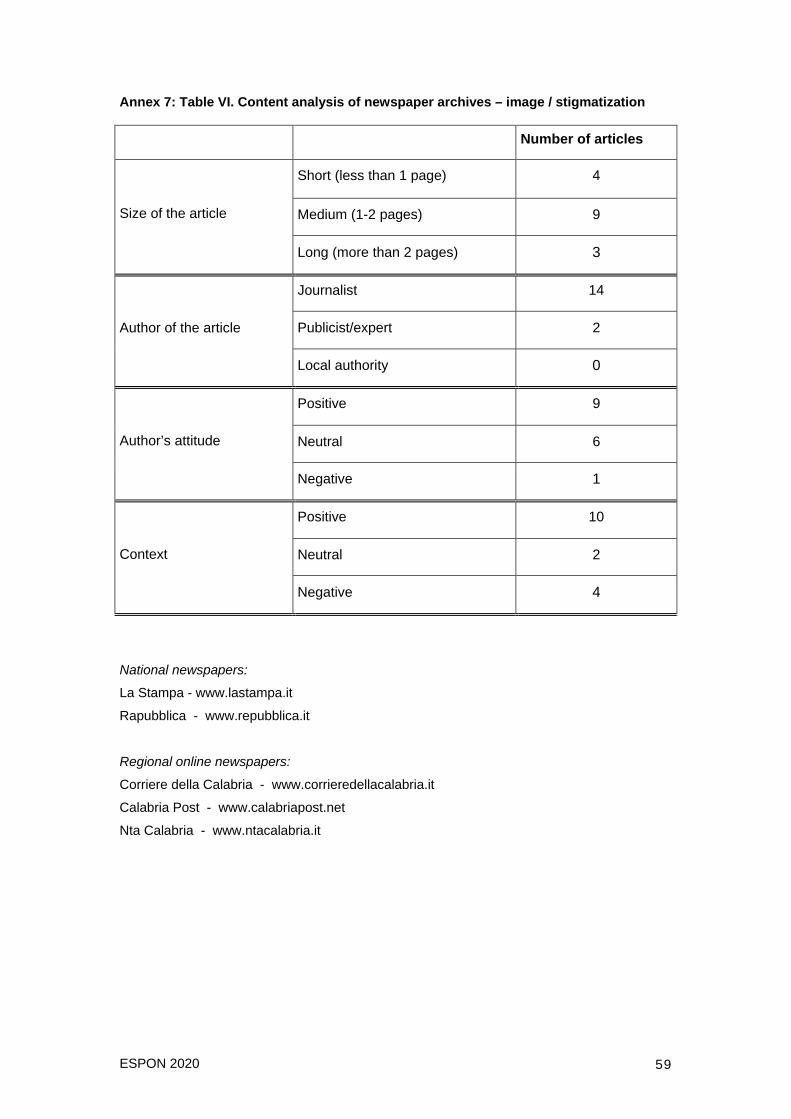
ESPON 2020 59
Annex 7: Table VI. Content analysis of newspaper archives – image / stigmatization
Number of articles
Size of the article
Short (less than 1 page) 4
Medium (1-2 pages) 9
Long (more than 2 pages) 3
Author of the article
Journalist 14
Publicist/expert 2
Local authority 0
Author’s attitude
Positive 9
Neutral 6
Negative 1
Context
Positive 10
Neutral 2
Negative 4
National newspapers:
La Stampa - www.lastampa.it
Rapubblica - www.repubblica.it
Regional online newspapers:
Corriere della Calabria - www.corrieredellacalabria.it
Calabria Post - www.calabriapost.net
Nta Calabria - www.ntacalabria.it
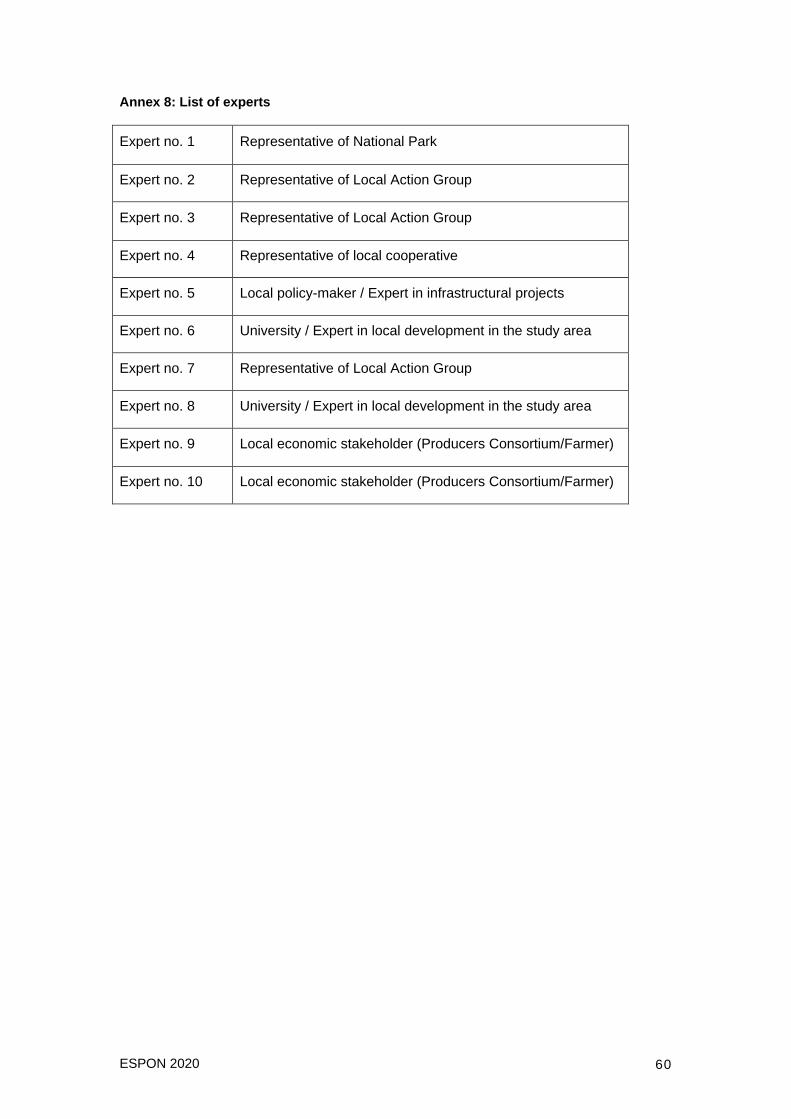
ESPON 2020 60
Annex 8: List of experts
Expert no. 1 Representative of National Park
Expert no. 2 Representative of Local Action Group
Expert no. 3 Representative of Local Action Group
Expert no. 4 Representative of local cooperative
Expert no. 5 Local policy-maker / Expert in infrastructural projects
Expert no. 6 University / Expert in local development in the study area
Expert no. 7 Representative of Local Action Group
Expert no. 8 University / Expert in local development in the study area
Expert no. 9 Local economic stakeholder (Producers Consortium/Farmer)
Expert no. 10 Local economic stakeholder (Producers Consortium/Farmer)

ESPON 2020 61
References 1 Perna, T. (2002) Aspromonte. I parchi nazionali nello sviluppo locale, Bollati Boringhieri, Torino.
2 Cersosimo, D., Wolleb G. (2006) Economie dal basso. Un itinerario nell’Italia locale, Donzelli, Roma.
3 Russo, G. (2013) Nella terra estrema. Reportage sulla Calabria, Rubettino, Soveria Mannelli.
4 Rodrìguez-Pose, A. (2009) Do institutions matter for regional development in the EU ?, London School of Economics.
5 Acemoglu, D., Johnson, S., Robinson, J. (2004) Institutions as the Fundamental Cause of Long-Run Growth. In Aghion P. and Durlauf S. (eds), Handbook of Economic Growth.
6 Fonte, M., Grande, S., Sacco V. (2007) Aspromonte. Natura e cultura nell’Italia estrema, Donzelli, Roma.
7 Mantino, F. (2010) Understanding delivery mechanisms in EU rural development policies: an institutional approach, Paper prepared for presentation at the 118th Seminar of the EAAE (European Association of Agricultural Economists), ‘Rural Development: governance, policy design and delivery, Ljubljana, Slovenia, August 25-27.
8 UNEP (United Nations Environment Programme) (2002): GEO 3 Global environ- ment outlook 3. Past: Present and Future Perspectives, Chapter 4, 2002–2032, Nairobi, Kenya.