Productivity Puzzles in Europe: A Comparison of the UK, France, Germany and Spain Alex Bryson and...
34
Productivity Puzzles in Europe: A Comparison of the UK, France, Germany and Spain Alex Bryson and John Forth NIESR (London) Philippe Askenazy PSE (Paris) 11 th November 2014 NIESR
-
Upload
stanley-blankenship -
Category
Documents
-
view
232 -
download
3
Transcript of Productivity Puzzles in Europe: A Comparison of the UK, France, Germany and Spain Alex Bryson and...

Productivity Puzzles in Europe: A Comparison of the UK, France,
Germany and SpainAlex Bryson and John Forth
NIESR (London)Philippe Askenazy
PSE (Paris)
11th November 2014NIESR

What’s the Issue?• The Great Recession– A big hit to the global economy– Affected most nations (few exceptions eg
Australia and.....SPAIN)
• Yet much heterogeneity in Europe– Size of GDP shock– Impact on firms– Muted impact on the labour market
• So what’s going on?– How can we explain this?

First Findings from A New Study• Labour Productivity Puzzles in Europe (OUP
forthcoming)
• Askenazy, Bellman, Bryson, Chevalier, Erhel, Forth, Gerner, Hospido, Laible, & Moreno-Galbis
• UK, Germany, Spain, France
– 60% EU GDP
– Contrasting cases
– Similarities and differences

Structure of Presentation• Overview of Productivity Trends• What lies behind these trends?– Country specific narratives
• Special focus on UK for this audience• Policy implications• Future

Productivity Trends
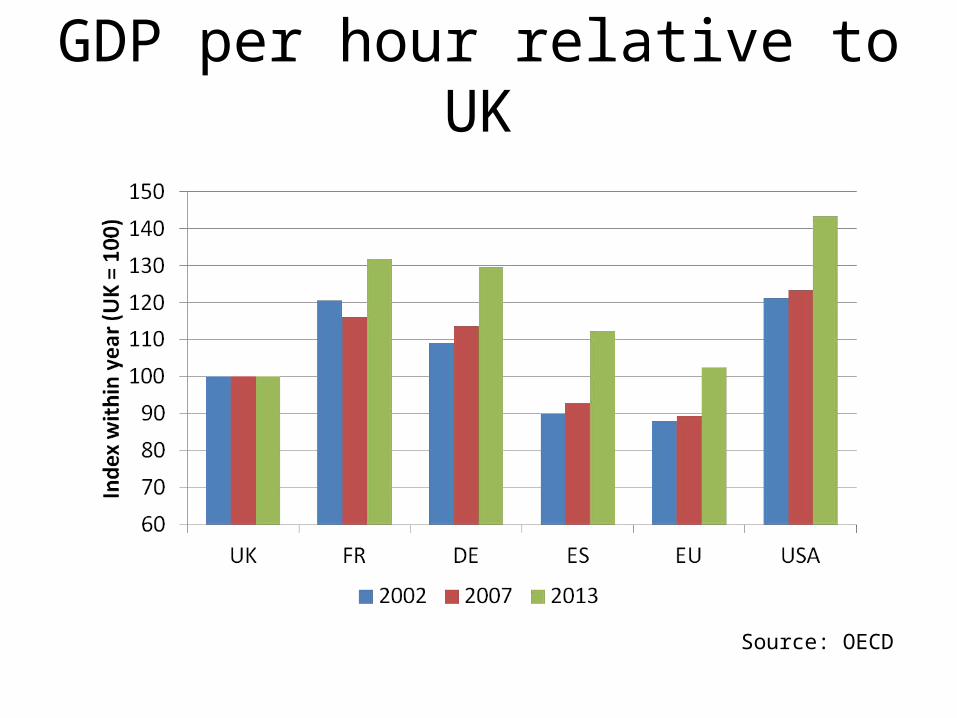
GDP per hour relative to UK
Source: OECD

Growth in GDP per hour
Source: OECD

Growth in GDP and hours worked
Source: OECD
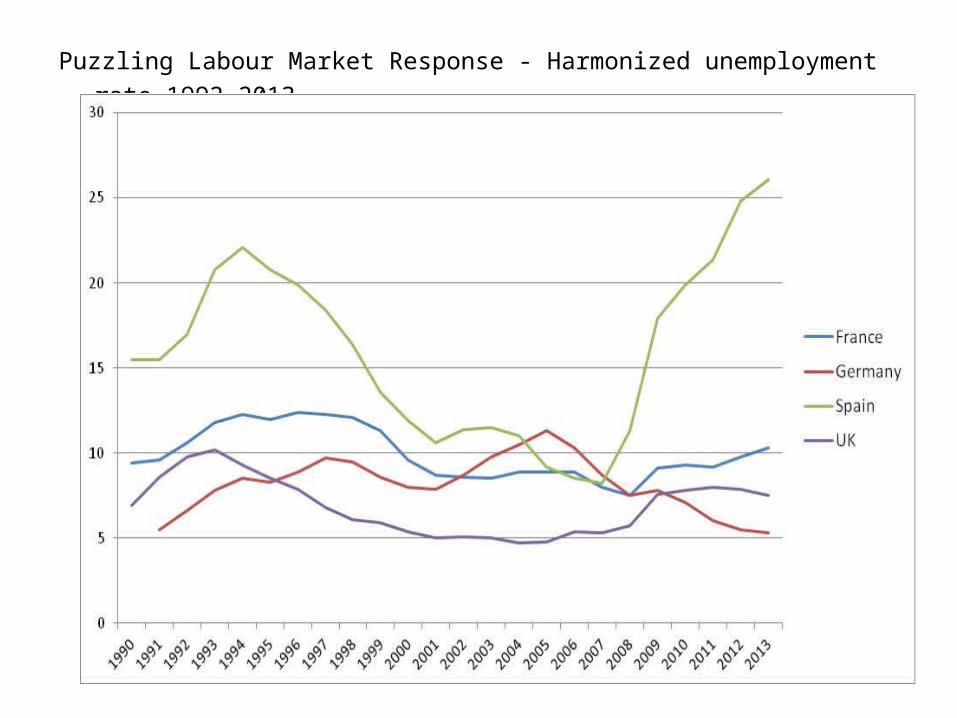
Puzzling Labour Market Response - Harmonized unemployment rate 1992-2013

What lies behind these trends?• In general, less attention given to the question
in FR, DE and ES, compared with UK
• But specific narratives emerge in each country
– Labour market reforms
– Government policy responses
– Sectoral heterogeneity

Spain

Spain• Pre-recession productivity was depressed by the large
share of short-term contracts and the construction sector
• Productivity revival due to large composition effects:• Decline in Construction
• Restrictions on temporary contracts
• But also some new exporting firms more productive
• And a reform in 2010 allows more firm-level bargaining, giving wage flexibility
• => probably a permanent gain

Decline in construction (% of GDP)
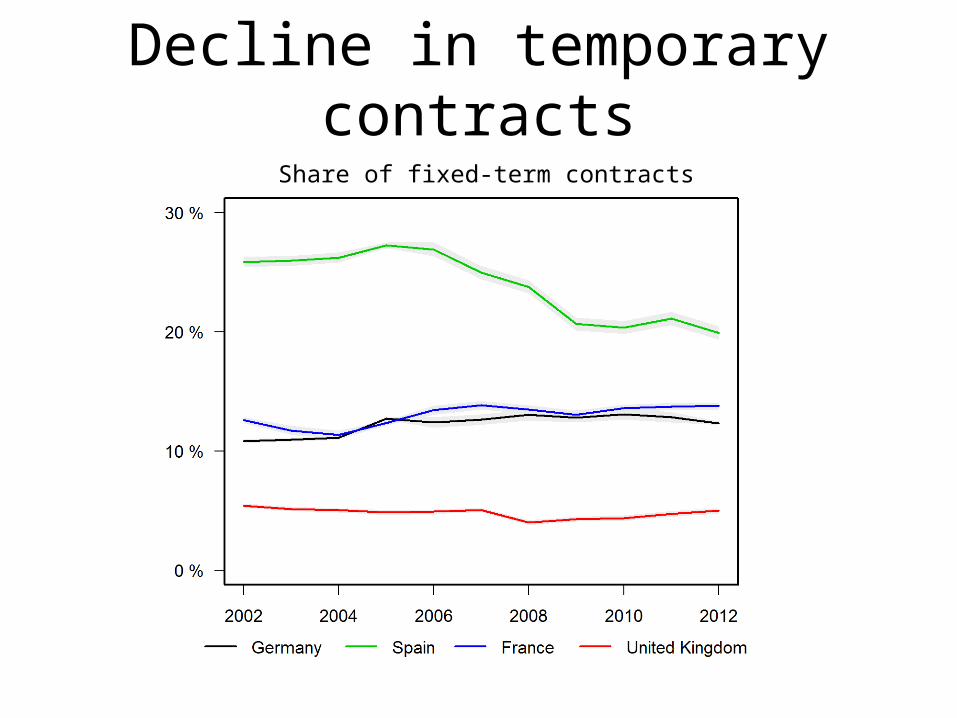
Decline in temporary contractsShare of fixed-term contracts

France and Germany
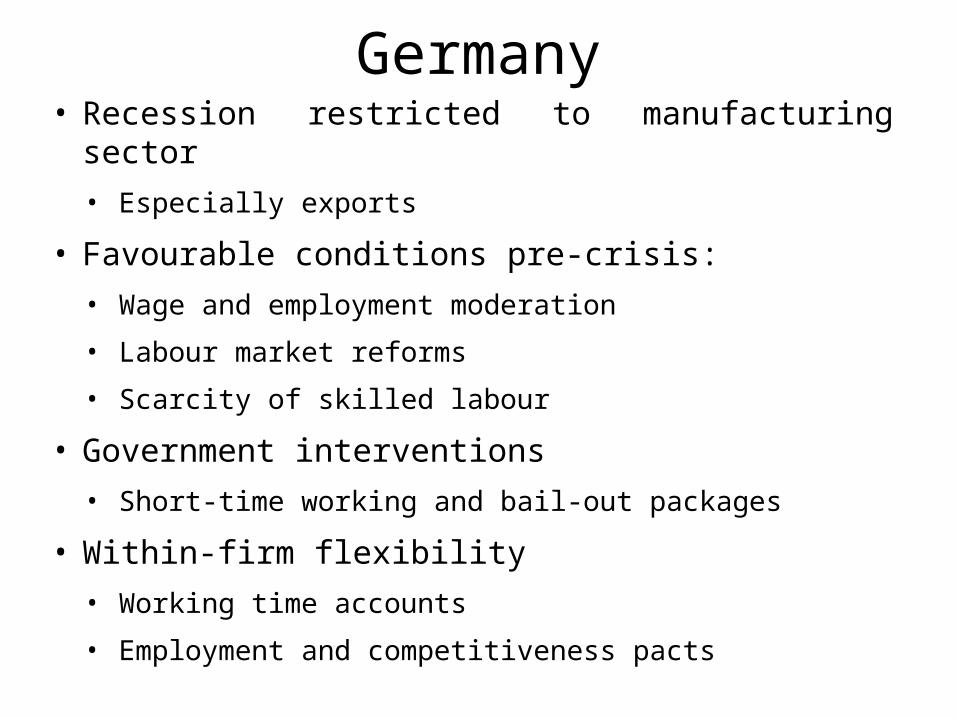
Germany• Recession restricted to manufacturing sector
• Especially exports
• Favourable conditions pre-crisis:• Wage and employment moderation
• Labour market reforms
• Scarcity of skilled labour
• Government interventions• Short-time working and bail-out packages
• Within-firm flexibility• Working time accounts
• Employment and competitiveness pacts

France• No significant compositional / cleansing effect (so
within firms)
• Slow down in real wage growth, but not on a par with UK
• Capital investment and R&D spending stable
• Key factors:
• Labour market reform leads to creation of low-productivity jobs (temporary, self-employed)
• Hoarding of high-skilled labour [???]
• Lower returns to HPW practices

France Half Way Between UK and Germany?
• A productivity shock but signs of a return to trend in FR and DE (but not UK)
• Employment holding up in FR, but not as well as in the UK and DE
• The real wage growth story is DIFFERENT– UK and DE have experienced very big wage
adjustments, unlike FR

Average real FTE wages
Source: OECD

The Policy Response• France a bit like Germany– Building flexibility into a “rigid” system with high protections
• Seems to “matter”– Changing nature of workforce• Self-employed• Very short-term contracts
• Implications for productivity remain unclear– If bad for productivity, why have them?• Cheap can be profitable even without productivity

UK

Historically slow recovery in GDP

Accompanied by unusually high levels of employment

Discussions have been about.....• Measurement error– Output, capital stock; intangibles; estimating counterfactual
• The role of the Banking Sector (direct, indirect)• Whether there has been a ‘cleansing’ effect• Incentives to innovate (conflicting hypotheses)• Labour Hoarding– If so why, and how? And to what end?
• The Flexible labour market– Strong labour supply, falling real wages
• Capital shallowing

No strong cleansing effect• Temporary spike in liquidations and redundancies, but %
loss making firms rose (Barnett et al)• Although no strong role for bank forbearance • Growth in productivity variance across sectors (Barnett et
al, Field and Franklin)• Chief contributor to falling productivity is within sector and within firm (Riley et al; Barnett et al)
• WERS: Increase in propensity of poor performers to die 2004-11 c.f. benign 1998-2004, but rate of workplace closure no different to 1998-2004 (van Wanrooy et al)
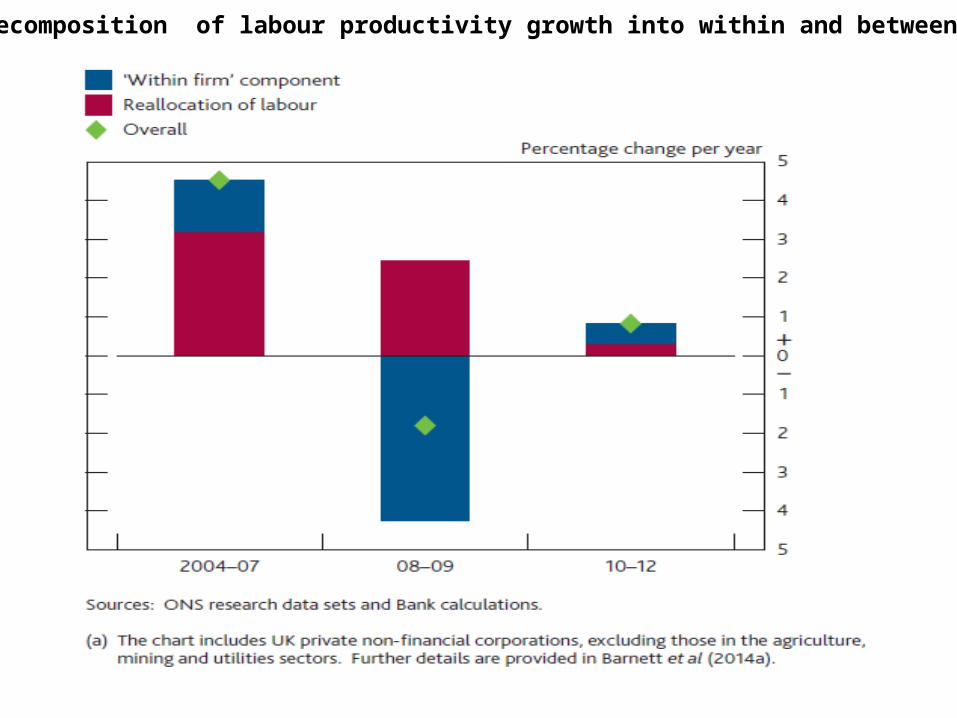
Figure 4 Decomposition of labour productivity growth into within and between firm

The Workplace Employment Relations Survey
• National survey mapping employment relations in workplaces across Britain.
• Unique and comprehensive: data collected from managers, worker representatives and employees in 2,700 workplaces with 5+ employees.
• Well-established: 1980, 1984, 1990, 1998, 2004, 2011
• Linked employer-employee:
• 2004 and 2011 cross-sections
• 2004-2011 Panel
Incentives to Innovate?• Opportunity costs v uncertainty• Decline in product and process innovation in firms,
though real R&D expenditure constant (ONS; Barnett et al). Can account for 1pp of productivity shortfall 2008-12 (Barnett et al).
• WERS: Continuing work reorganization (van Wanrooy et al) - similar to early 90s (Geroski and Gregg)
• Innovation rates not linked to impact of recession, but returns to innovation in terms of productivity and ‘coming out stronger’
• Some continued growth in HRM investments. Some (weak) evidence of lower financial returns, but less change than seen in France.
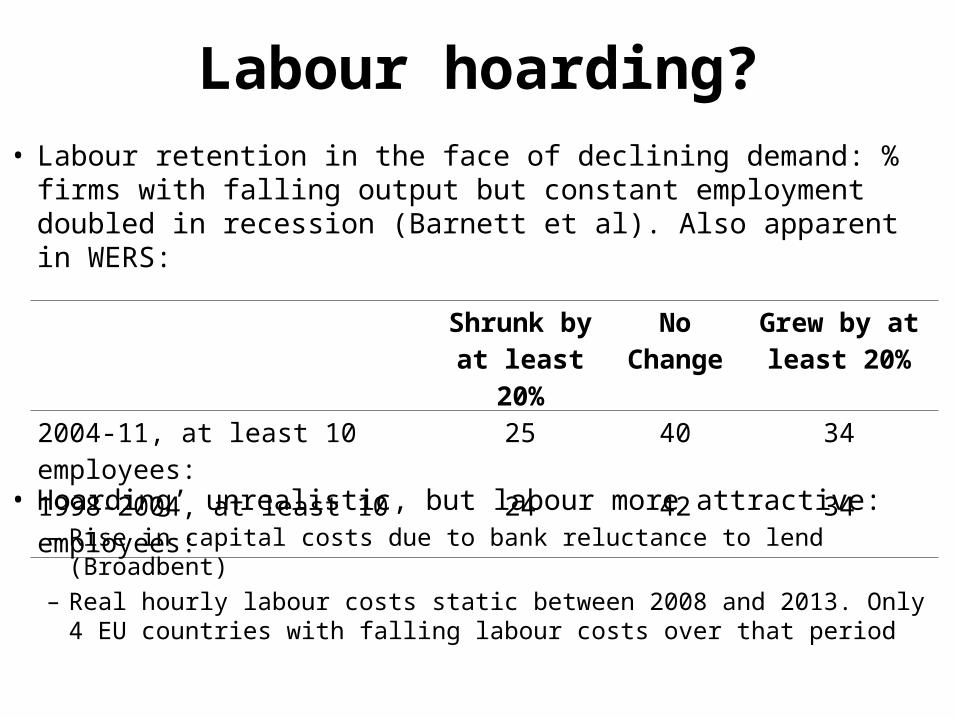
Labour hoarding?• Labour retention in the face of declining demand: % firms with
falling output but constant employment doubled in recession (Barnett et al). Also apparent in WERS:
• Hoarding’ unrealistic, but labour more attractive:– Rise in capital costs due to bank reluctance to lend (Broadbent)– Real hourly labour costs static between 2008 and 2013. Only 4 EU
countries with falling labour costs over that period
Shrunk by at least 20%
No Change
Grew by at least 20%
2004-11, at least 10 employees: 25 40 34
1998-2004, at least 10 employees: 24 42 34

What Lies Behind Falling Real Wages• Union bargaining power?
– No correlation between freezes/cuts and unionisation– No correlation between pay freeze in last settlement and unionisation– Little change in union wage premium (some counter-cyclicality)– Hard to identify break point in union power
• May have been some time ago?
• Welfare reform– Those using public job placement service and those drawing on
unemployed for recruits no more likely to freeze/cut pay
• Immigration– 1 percentage point in the number of non-EEA nationals employed at a
workplace raised the probability of a wage freeze or cut by roughly 0.4 of a percentage point
– % non-UK EEA nationals was not significant

• Growth in non-standard (low-productivity?) jobs– Part-time, temporary, self-employment; often involuntary;
Blanchflower underemployment index
• WERS: Greater use of numerical flexibility in 2011 than 2004– Up from 50% to 65% of workplaces– But not associated with managerial perceptions of how adversely
workplace affected by recession nor with HR manager perceptions of how workplace had emerged from recession
Flexible labour market?

• By end 2013 8% lower than counterfactual in absence of recession, accounting for 2.5pp of productivity shortfall (Bennett et al)
• Pessoa and Van Reenen say accounts for 2/3 decline in labour productivity, with hours decline also important but TFP minor
Fall in capital-labour ratio

Future• Employment/output recently reached pre-recession peak• Real wage growth remains illusive• Reforms suggest long-term prospects good (Aghion et al)
– Deregulation of capital flows; Higher Education; Welfare system; Labour law
• Permanent loss?– Barnett et al argue reduced investment in capital and
impaired resource reallocation account for 6-9pp of 16pp shortfall in labour productivity
– UK productive capacity 2/3 its pre-recession rate (Ball)• Similar to France, smaller than Spain, larger than Germany
• TFP– Barnett et al.: accounts for much of underutilisation and
misallocation– Pessoa and Van Reenen: no structural break

Productivity Puzzles in Europe: A Comparison of the UK, France,
Germany and SpainAlex Bryson and John Forth
NIESR (London)Philippe Askenazy
PSE (Paris)
11th November 2014NIESR