PRODUCTIVITY CHARTPACK
44
PRODUCTIVITY CHARTPACK OCTOBER 2018
Transcript of PRODUCTIVITY CHARTPACK

PRODUCTIVITY CHARTPACK
OCTOBER 2018

Economic Division | productivity chart-pack Page | i
Contents
Page
Contents i Executive summary ii
1. Aggregate productivity measures 1
2. Foreign and domestic sector productivity 6
3. Sectoral productivity 12 4. Firm-level productivity measures 21 5. Allocative efficiency 30 6. Unit labour costs 36

Economic Division | productivity chart-pack Page | ii
Executive Summary
As the Irish economy approaches full employment and demographic trends become less favourable, the baton for raising domestic living standards will, to a greater extent, pass to productivity. This variable is, perhaps, the single most important in macroeconomics. However, possibly because of its slow moving nature, it receives less attention than other variables. The purpose of this chart-pack is to shine a light on some of the key productivity trends in Ireland. At the outset, it must be stressed that the information content embedded in headline productivity aggregates in Ireland is more limited than elsewhere, given sector-specific (and possibly firm-specific) issues. For instance, headline figures suggest that Irish productivity – Gross Domestic Product per hour worked basis – is the highest in the OECD (and nearly twice the OECD average). This, of course, is misleading, and arises because Irish GDP levels are significantly inflated by the activities of parts of the multinational sector. This is why any assessment of Irish productivity trends must look ‘under the bonnet’. To address these information challenges, aggregate productivity data in this document are complemented by sectoral and micro-data. These more granular data confirm diverging patterns among different subsets of firms: foreign-owned versus indigenous; frontier firms versus ‘laggard’ firms, etc. Diverging sectoral trends have important implications, including for competitiveness, for the allocation of capital and labour across firms and sectors of the economy and, potentially, for wage disparities. While policy recommendations are not the purpose of this document, it is a truism to say that boosting productivity growth over the medium term will require enhancing knowledge spill-overs between the ‘best and the rest’. From a public finances perspective, it is important that trends in productivity are monitored and understood, as they can shape short- and medium-term economic trends. Over the longer-term, productivity is the main source of economic growth and boosting productivity is essential to mitigate the budgetary costs associated with population ageing.
Economic Division | productivity chart-pack Page | iii
Productivity chart-pack October 20181
The volume of goods and services produced in any economy, i.e. Gross Domestic Product, is determined by the availability of capital and labour, together with the efficiency with which these factor inputs are combined to produce output. The pool of labour is finite (at least in the long-term) while capital is subject to the law of diminishing returns (a worker can produce more goods and services with one computer but not necessarily any additional goods and services with two computers). In the long-run, therefore, raising living standards is contingent upon improving the efficiency with which capital and labour are combined to produce goods and services, i.e. productivity. For this reason, economists have long seen productivity as the single most important macro-economic variable. Krugman (1994), for instance, highlighted that “productivity isn’t everything, but in the long-run it is almost everything”.2 Moreover, there is a strong empirical cross-country link between living standards and productivity – those countries with the highest per capita incomes are also those with the highest levels of productivity and vice versa. Notwithstanding the importance of productivity as an engine of growth, it receives less attention than other metrics such as output growth, employment, unemployment, etc. This probably reflects the fact that productivity is a ‘slow burner’ – while volatile in the short-term, the underlying trend tends to be relatively stable over time. The purpose of this chart-pack, which will be updated annually, is to address this information gap. At the outset, it is crucial to stress that headline productivity measures in Ireland need to be treated with caution, given that GDP is inflated by the activities of part of the multinational sector,3 including in parts of the pharmaceutical, chemical and ICT sectors. For instance, data presented later in this document show that, over the period 2000-2016, the annual average growth rate of productivity in the foreign-dominated sectors in Ireland was more than four times that recorded in sectors dominated by domestically-owned firms. This reliance on a very small cohort of sectors and firms represents a risk to the sustainability and resilience of the Irish economy in the longer term, and disguises the majority of underperforming firms where productivity growth is stagnant or falling. Indeed the OECD,4 citing Department of Finance research, recently identified the comparatively weaker productivity of local firms as an underlying fragility of the Irish economy which, if not addressed, could limit the scope for higher living standards in the years ahead.
1 This chart-pack was produced by the Economic Division of the Department of Finance, and the information contained herein does not necessarily reflect the views of the Minister of Finance or the Irish Government. 2 Krugman, P. (1994), “The Age of Diminished Expectations: U.S. Economic Policy in the 1990s” Volume 1 of Briefing Books, MIT Press. 3 The exceptional growth rate recorded in 2015 is an especially noteworthy factor, but other developments, such as ‘contract manufacturing’ and the importance of capital-intensive sectors such as aircraft leasing in the Irish economy, are also very relevant. 4 See OECD Economic Survey of Ireland, 2018. Available at: https://www.finance.gov.ie/wp-content/uploads/2018/03/OECD-survey.pdf

Economic Division | productivity chart-pack Page | iv
For this reason, the analysis in this document complements the aggregate data with more granular data in order to obtain a more meaningful insight into productivity trends. The international literature has, in more recent years, increasingly focussed on micro-data, i.e. firm-level data, in recognition of a growing divergence between frontier-firms (those at the productivity frontier) and those lagging behind.5 The analysis has highlighted a small cohort of highly productive firms (those in the 95th percentile and above) with the remainder experiencing lower levels of productivity and almost stagnant growth rates. In an Irish context, a widening productivity gap between ‘the best and the rest’ has also been identified, with part of the reason being that domestic firms have reaped only limited spillovers of knowledge, technology and know-how from the highly productive multinational firms located in Ireland.6 From a public finances perspective, there are several motivations for a deeper dive into productivity trends. Firstly, budgetary frameworks rely on robust, internally-consistent short- and medium-term macroeconomic projections, of which productivity trends are a key ingredient. Secondly, changes in output per hour worked ultimately finance wage increases: wages moving in excess of productivity reduce competitiveness, and vice versa, via the unit labour cost channel. Hence, an understanding of productivity trends is crucial when assessing the existence of imbalances in the economy. Finally, as has been well documented, the population of Ireland (and other advanced economies) is ageing, with declining fertility rates and rising life expectancy increasing the number of retirees relative to the working age population. As a key source of long-term growth, productivity developments have a crucial bearing on the public finance costs associated with ageing populations.7 Given the importance of productivity for the public finances, the Economics Division of the Department of Finance closely monitors productivity developments and publishes relevant research in this area. The Department is also a joint-member of the steering group of the OECD Global Productivity Forum (alongside the Department of Enterprise, Business and Innovation), an initiative that fosters international co-operation among public bodies promoting productivity-enhancing policies.
5 OECD (2015), “The future of productivity”. 6 Di Ubaldo, M., M. Lawless and I. Siedschlag (2018) “Productivity spillovers from multinational activity to indigenous firms in Ireland”, ESRI Working Paper 587, March 2018. 7 See “Population ageing and the public finances in Ireland”, Department of Finance, September 2018. Available at: http://www.finance.gov.ie/wp-content/uploads/2018/09/Population-Ageing-and-the-Public-Finances-1.pdf

Economic Division | productivity chart-pack Page | 1
Section 1 – Aggregate productivity measures

Economic Division | productivity chart-pack Page | 2
Figure 1.1 GDP per hour worked, USD 2010 PPPs
Note: The GDP per hour worked series for the aggregate OECD area is only available from 2000. PPP is purchasing power parity – these are exchange rates that adjust for differences in purchasing power across countries. Source: OECD Productivity Database.8
As measured by GDP per hour worked, Ireland has the highest level of labour productivity amongst OECD countries.
In 2016, the level of GDP per hour worked in Ireland stood at $82, nearly twice the OECD average of $47.
The US is usually seen as the ’productivity frontier’; however, Irish productivity levels on a GDP per hour basis moved above US levels in 2011 and were 30 per cent higher than in the US in 2016.
The surge in measured GDP in 2015, as well as other factors that artificially inflate GDP in Ireland, highlight the difficulties of cross-country productivity comparisons for Ireland.
8 OECD. “Growth in GDP per Capita, Productivity and ULC”, available at:
http://stats.oecd.org
0
10
20
30
40
50
60
70
80
90
19
70
19
72
19
74
19
76
19
78
19
80
19
82
19
84
19
86
19
88
19
90
19
92
19
94
19
96
19
98
20
00
20
02
20
04
20
06
20
08
20
10
20
12
20
14
20
16
France Germany Ireland Japan UK USA OECD

Economic Division | productivity chart-pack Page | 3
Figure 1.2 GDP, GNI and GNI* per hour worked, USD 2010 PPPs
Source: CSO, OECD, Department of Finance calculations.
Several factors serve to artificially inflate the level of GDP in an Irish context, including the on-
shoring of intellectual property, the depreciation of foreign-owned, Irish-based capital assets and so-called ‘contract manufacturing’.9
Modified Gross National Income – also referred to as GNI* – gives a better picture of income per
capita in Ireland.
Even on a GNI or GNI* basis, which strip out most of this impact, Ireland still has a productivity level above the OECD average.10
9 See “GDP and modified GNI – explanatory note”, Department of Finance, May 2018. Available at: https://www.finance.gov.ie/wp-content/uploads/2018/05/180504-GDP-and-Modified-GNI-Explanatory-Note-May-2018.pdf 10 GNI* is unavailable on a constant price basis and so the figures above are Department of Finance estimates.
30
40
50
60
70
80
90
19
96
19
97
19
98
19
99
20
00
20
01
20
02
20
03
20
04
20
05
20
06
20
07
20
08
20
09
20
10
20
11
20
12
20
13
20
14
20
15
20
16
20
17
France Germany Ireland (GDP)
Japan UK USA
OECD Ireland (GNI) Ireland (GNI*)

Economic Division | productivity chart-pack Page | 4
Figure 1.3 Irish labour productivity growth, per cent
Note: CSO productivity growth estimates are only available from 2000-2016, in GVA per hour worked. OECD estimates for Ireland are available from 1970-2017, in GDP per hour worked. Source: CSO11, OECD.
Labour productivity growth was strong in the second half of the 1990s.
However, the pace of growth slowed during the first half of the 2000s, as domestic demand – in particular consumer spending and house building – replaced exports as the main source of growth.
This misallocation of resources – from the traded to the non-traded sector – led to a sharp fall in labour productivity (the flip-side of this coin was a surge in employment growth as the non-traded sectors tend to be more labour-intensive).
The situation was reversed during the crisis as employment fell sharply in the retail and construction sectors. Essentially, firms reduced employment at a faster rate than the decline in output.
Measured labour productivity surged in 2015, due to the spike in Gross Value Added associated with a small number of firms relocating their balance sheets – including intellectual property assets – to Ireland.
11 “Productivity in Ireland 2016”, Central Statistics Office (May 2018).
-5
0
5
10
15
20
25
19
95
19
96
19
97
19
98
19
99
20
00
20
01
20
02
20
03
20
04
20
05
20
06
20
07
20
08
20
09
20
10
20
11
20
12
20
13
20
14
20
15
20
16
20
17
OECD CSO
Economic Division | productivity chart-pack Page | 5
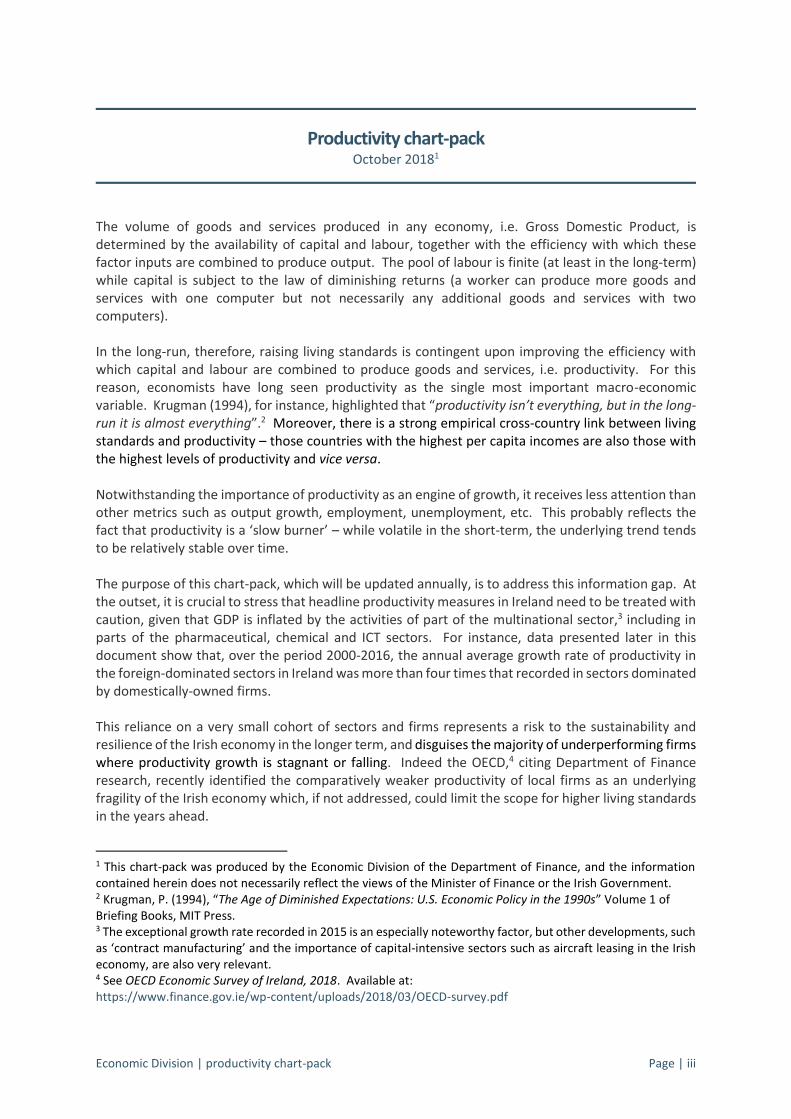
Figure 1.4 Irish multifactor productivity growth (MFP), per cent
Note: Disparities in the OECD/CSO estimates are due to methodological differences and/or differences in the vintage of data used. Source: CSO, OECD.
Multifactor productivity (MFP) is an alternative measure of productivity which takes into account the contribution of both labour and capital to production.
It is residually determined – it is the remaining contribution to growth once increases in labour supply and capital inputs have been accounted for. In this sense, it is sometimes referred to as the ‘Solow residual’.12
The MFP trend since the mid-1990s is similar to that of labour productivity, with solid growth recorded in the second half of the 1990s followed by a more modest pace of expansion in the first half of the last decade.
There was a noticeable rise in MFP in the initial years following the crisis, reflecting efficiency gains and, possibly, the exit of unproductive firms.
12 Solow, R. M. (1957), “Technical Change and the Aggregate Production Function”, Review of Economics and Statistics, Vol. 39(3), pp. 312-20.
-15
-10
-5
0
5
10
19
95
19
96
19
97
19
98
19
99
20
00
20
01
20
02
20
03
20
04
20
05
20
06
20
07
20
08
20
09
20
10
20
11
20
12
20
13
20
14
20
15
20
16
OECD CSO

Economic Division | productivity chart-pack Page | 6
Section 2 – Foreign and domestic sector productivity

Economic Division | productivity chart-pack Page | 7
Figure 2.1 productivity levels: foreign-dominated vs. domestic and other sectors
Note: ‘Foreign-dominated’ are those sectors where multinational enterprise turnover exceeds 85 per cent of total turnover.13 Source: Gross Value Added for foreign-owned multinational enterprises and other sectors, CSO.
Figure 2.1 shows the evolution of labour productivity in two broad sectors: the multinational sector and the domestic-owned sector.
By 2014, output per worker in the foreign-owned sector was nearly two and a half times its level in 2000.
Thereafter, developments in the foreign-owned sector are distorted by the surge in measured GDP in 2015. On a purely headline basis, productivity levels in 2016 were almost four and a half times higher than in 2000.
A small number of multinational firms relocating intellectual property to Ireland in 2015 led to a productivity growth rate of 79 per cent that year.
By 2016, the level of productivity in the domestic and other sector had grown by nearly 50 per relative to its level in 2000.
13 Gross Value Added for Foreign-owned Multinational Enterprises and Other Sectors Annual Results, Central
Statistics Office, 2017.
0
50
100
150
200
250
300
350
400
450
500
20
00
20
01
20
02
20
03
20
04
20
05
20
06
20
07
20
08
20
09
20
10
20
11
20
12
20
13
20
14
20
15
20
16
20
00
=10
0
Foreign Domestic and Other

Economic Division | productivity chart-pack Page | 8
Figure 2.2 productivity growth: foreign-dominated vs. domestic and other sectors, per cent
Note: ‘Foreign-dominated’ are those sectors where multinational enterprise turnover exceeds 85 per cent of total turnover. Source: Gross Value Added for foreign-owned multinational enterprises and other sectors, CSO.
The productivity growth rate in the foreign-dominated sector has been higher than that of the domestic and other sector in nearly all years, while it is also more volatile.
A small number of multinational firms relocating intellectual property to Ireland in 2015 led to a productivity growth rate of 79 per cent.
The average pace of growth in the foreign-dominated sector was 10.9 per cent, compared to 2.5 per cent in the domestic and other sector over the 2000-2016 period.
-10
0
10
20
30
40
50
60
70
80
90
2000 2001 2002 2003 2004 2005 2006 2007 2008 2009 2010 2011 2012 2013 2014 2015 2016
Foreign Domestic Foreign trend Domestic trend

Economic Division | productivity chart-pack Page | 9
Figure 2.3 Cumulative labour productivity growth, per cent
Source: CSO.
Irish labour productivity grew by the fourth-largest amount in the EU28 since 2000. Higher growth
rates were recorded for post-2004 accession countries Lithuania, Latvia and Romania.
The domestic (and other sector) experienced the largest increase in labour productivity among the ‘old’ Member States, i.e. the 15 Member States that joined the EU prior to 2004.
The foreign-dominated sector in the Irish economy had cumulative growth that was far larger than the overall growth in any EU country.
0
50
100
150
200
250
300
350
400IT
A
LUX
GR
C
NO
R
NLD BEL
CYP
FRA
Euro
Are
a
ESP
GB
R
DN
K
PR
T
FIN
DEU EU
AU
T
SWE
SVN
MLT
HR
V
IRL
- D
om
esti
c &
Oth
ers
HU
N
PO
L
BG
R
SVK
IRL
LTU
LVA
RO
U
IRL
- Fo
reig
n D
om
.

Economic Division | productivity chart-pack Page | 10
Figure 2.4 Decomposition of annual GVA growth in Foreign-Dominated sector, per cent
Note: 2015 figure is off the scale. Source: CSO.
Output growth in the foreign-dominated sector averaged 11 per cent per annum over the 2000-2016 period.
Figure 2.4 decomposes this output growth into labour and capital inputs and to MFP. Most of the output growth in the foreign-dominated sector since 2000 has been accounted for increase in capital inputs.
Labour input (hours worked) contributed only marginally over the period.
As is often the case, MFP growth is volatile on an annual basis although, on average, contributed positively to output growth.
The multinational activity in 2015 (i.e. relocation of intellectual property to Ireland) led to extreme growth rates in GVA, Capital and MFP of 84 per cent, 328 per cent and -57 per cent, respectively.
-10
-5
0
5
10
15
20
20
00
20
01
20
02
20
03
20
04
20
05
20
06
20
07
20
08
20
09
20
10
20
11
20
12
20
13
20
14
20
15
20
16
Multi-factorProductivity
LabourInput
CapitalInput
Gross ValueAdded

Economic Division | productivity chart-pack Page | 11
Figure 2.5 Decomposition of annual GVA growth in Domestic and Other sector, per cent
Source: CSO.
Output growth in the indigenous-dominated sector averaged 3.4 per cent per annum over the
2000-2016 period.
Most of this output growth is accounted for by increases in capital inputs.
Labour input growth also contributed positively over the period on average, although the contribution from this component turned negative during the crisis as hours worked declined sharply.
MFP growth also showed a positive contribution over the period, with relatively strong growth in recent years.
-10
-8
-6
-4
-2
0
2
4
6
8
10
20
00
20
01
20
02
20
03
20
04
20
05
20
06
20
07
20
08
20
09
20
10
20
11
20
12
20
13
20
14
20
15
20
16
Multi-factorProductivity
LabourInput
CapitalInput
Gross ValueAdded

Economic Division | productivity chart-pack Page | 12
Section 3 – Sectoral productivity

Economic Division | productivity chart-pack Page | 13
Figure 3.1 Agriculture labour productivity growth, per cent
Note: Labour productivity calculated as gross value added divided by hours worked. Source: CSO.
In the agricultural sector, labour productivity growth has averaged 4.2 per cent per annum since the beginning of the last decade.
Having said that, productivity has been extremely volatile over this period – with growth rates ranging from +30 per cent to -30 per cent.
The main reason for this has been the volatility of gross value added; average hours worked is also
volatile but less so than GVA.
-40
-30
-20
-10
0
10
20
30
40
20
01
20
02
20
03
20
04
20
05
20
06
20
07
20
08
20
09
20
10
20
11
20
12
20
13
20
14
20
15
20
16
Labour productivity Gross Value Added Hours

Economic Division | productivity chart-pack Page | 14
Figure 3.2 Construction labour productivity growth, per cent
Note: Labour productivity calculated as gross value added divided by hours worked. Source: CSO.
The construction sector has also seen volatile growth rates, with labour productivity growth
averaging zero per cent per annum since the beginning of the last decade.
The construction industry experienced the largest impact of the crisis in terms of employment. This is seen in 2009, where workers hours halved.
As these were in low productivity roles, GVA saw a smaller decline relative to hours worked, leading to a spike in labour productivity.
-60
-50
-40
-30
-20
-10
0
10
20
30
20
01
20
02
20
03
20
04
20
05
20
06
20
07
20
08
20
09
20
10
20
11
20
12
20
13
20
14
20
15
20
16
Labour productivity Gross Value Added Hours
Economic Division | productivity chart-pack Page | 15
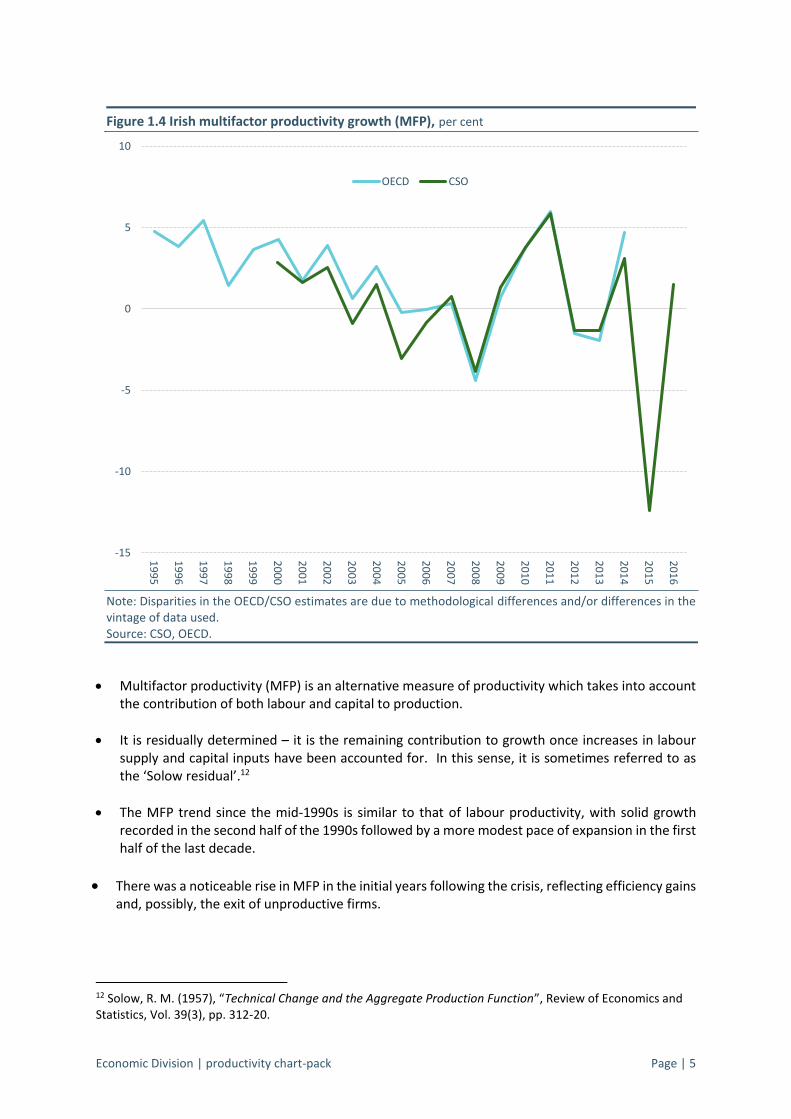
Figure 3.3 Decomposition of annual GVA growth in IT sector, per cent
Source: CSO.
The strong growth in IT during the mid-2000s was driven by improvements in MFP.
This MFP growth has slowed in recent years, and has in fact been negative in 4 of the last 6 years.
Strong growth in capital have meant that overall output growth in the sector has remained positive.
-20
-15
-10
-5
0
5
10
15
20
20
00
20
01
20
02
20
03
20
04
20
05
20
06
20
07
20
08
20
09
20
10
20
11
20
12
20
13
20
14
20
15
20
16
MFP Labour Capital Gross Value Added

Economic Division | productivity chart-pack Page | 16
Figure 3.4 Decomposition of annual GVA growth in Industry sector, per cent
Source: CSO14.
Productivity growth in the industry sector has been volatile over the years, although responded well initially post-crisis.
Most output growth was driven by growth in capital, which was positive in all years with the exception of 2011.
14 Decompositions from 2000-2016 were only available for the IT and distribution sectors.
-10
-5
0
5
10
15
20
25
20
01
20
02
20
03
20
04
20
05
20
06
20
07
20
08
20
09
20
10
20
11
20
12
20
13
20
14
20
15
20
16
MFP Labour Capital Gross Value Added

Economic Division | productivity chart-pack Page | 17
Figure 3.5 Decomposition of annual GVA growth in Dist., transport, hotels / resturants, per cent
Source: CSO.
This is a largely domestic, non-traded sector serving the domestic economy, and should be somewhat representative of trends in the domestic economy as a whole.
MFP is very pro-cyclical, with increases arising from the efficiency gains made from using fixed assets such as warehouses or hotels during years when the economy is strong.
-15
-10
-5
0
5
10
15
20
00
20
01
20
02
20
03
20
04
20
05
20
06
20
07
20
08
20
09
20
10
20
11
20
12
20
13
20
14
20
15
20
16
MFP Labour Capital Gross Value Added

Economic Division | productivity chart-pack Page | 18
Figure 3.6 Sector contribution to labour productivity growth, per cent
Source: CSO.
In the period to 2016, Industry has made the largest average contribution to total productivity growth, followed by Information and Communication and Professional, Admin and Support Services, although the large additions from GVA to Industry in 2015 should be noted.
Real estate services showed a negative contribution of 0.1 percent over the period.
Other domestic-dominated sectors such as construction (no growth) and distribution and transport (+0.1 percent) showed almost no contribution.
-0.1
0.0
0.1
0.1
0.1
0.1
0.3
0.6
0.6
3.0
4.6
-0.5 0.5 1.5 2.5 3.5 4.5
Real estate services
Construction
Agriculture, forestry and fishing
Arts, entertainment and other services
Public admin, education and health
Distribution and Transport etc.
Financial and insurance activities
Professional, admin and support services
Information and Communication
Industry (excluding construction)
Total

Economic Division | productivity chart-pack Page | 19
Figure 3.7 Decomposing the UK - Ireland productivity gap into sectoral contributions, 2014
Note: Labour productivity expressed as GVA per hour worked (based on persons engaged), expressed in 2010 prices. Labour productivity in Ireland in 2014 is indexed to 100 and all other components expressed relative to Ireland. Aggregate productivity estimates cover NACE sectors A to N, excluding sector L (real estate activities). Also excludes NACE sectors O-U. The ‘sector mix’ adjusts for differences in sector sizes across economies. 2014 = latest available comparable data. Source: EUKLEMS15, Department of Finance (2018).
Average labour productivity in the UK stood at 68 per cent of Ireland’s productivity level in 2014.
Nearly two thirds of this 32 per cent productivity gap is due to the Pharma-Chem and IT sectors, accounting for 8 per cent and 12 per cent respectively.
A negative productivity gap between Ireland and the UK is however observed in the agriculture and construction sectors.
15 EU KLEMS Growth and Productivity Accounts (2017). Available at:
http://www.euklems.net/
68
0 -1
1 6
8 -3
0 12
47
100
0
20
40
60
80
100
120
UK
GV
A/H
R
Sector M
ix
Agricu
lture
Min
ing &
utilities
Man
uf e
xc Ph
arma-C
hem
Ph
arma-C
hem
Co
nstru
ction
W/sale
, retail, t/p
ort, acco
m, fo
od
IT Finan
cial
Pro
f and
adm
in services
Ireland
GV
A/H
R

Economic Division | productivity chart-pack Page | 20
Figure 3.8 Decomposing the euro area - Ireland productivity gap into sectoral contributions, 2014
Note: see notes in previous figure. Source: EUKLEMS, Department of Finance (2018).
Average labour productivity in the euro area stood at 74 per cent of Ireland’s productivity in 2014.
Again, two thirds of this gap is explained by Pharma-Chem and IT, accounting for 8 per cent and 9 per cent respectively of the 26 per cent gap.
A negative productivity gap between Ireland and the euro area is however observed in a number
of domestic sectors such as agriculture, construction and domestic services (wholesale, retail, transportation, accommodation and food services).
Lastly, the distribution of sector shares in Ireland, the ‘Sector Mix’, also results in a productivity
dividend for Ireland, indicating that the labour shares in Ireland are higher in more productive sectors, relative to the euro area.
74 2
-1
1 48
-4 -2
9
3 6
100
0
20
40
60
80
100
120
Euro
Area G
VA
/HR
Sector M
ix
Agricu
lture
Min
ing &
utilities
Man
uf e
xc Ph
arma-C
hem
Ph
arma-C
hem
Co
nstru
ction
W/sale
, retail, t/p
ort, acco
m,
foo
d
IT Finan
cial
Pro
f and
adm
in services
Ireland
GV
A/H
R

Economic Division | productivity chart-pack Page | 21
Section 4 – Firm-level productivity
Economic Division | productivity chart-pack Page | 22
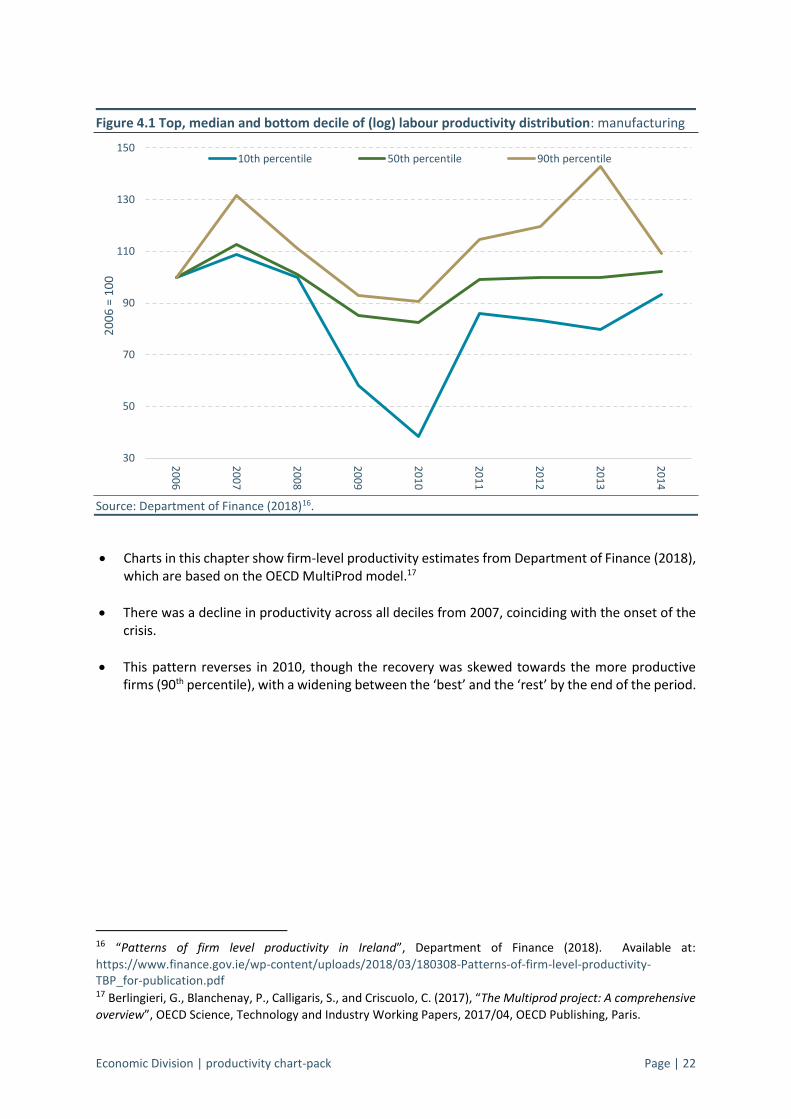
Figure 4.1 Top, median and bottom decile of (log) labour productivity distribution: manufacturing
Source: Department of Finance (2018)16.
Charts in this chapter show firm-level productivity estimates from Department of Finance (2018), which are based on the OECD MultiProd model.17
There was a decline in productivity across all deciles from 2007, coinciding with the onset of the crisis.
This pattern reverses in 2010, though the recovery was skewed towards the more productive firms (90th percentile), with a widening between the ‘best’ and the ‘rest’ by the end of the period.
16 “Patterns of firm level productivity in Ireland”, Department of Finance (2018). Available at:
https://www.finance.gov.ie/wp-content/uploads/2018/03/180308-Patterns-of-firm-level-productivity-TBP_for-publication.pdf 17 Berlingieri, G., Blanchenay, P., Calligaris, S., and Criscuolo, C. (2017), “The Multiprod project: A comprehensive
overview”, OECD Science, Technology and Industry Working Papers, 2017/04, OECD Publishing, Paris.
30
50
70
90
110
130
150
20
06
20
07
20
08
20
09
20
10
20
11
20
12
20
13
20
14
20
06
= 1
00
10th percentile 50th percentile 90th percentile

Economic Division | productivity chart-pack Page | 23
Figure 4.2 Top, median and bottom decile of (log) labour productivity distribution: market services
Source: Department of Finance (2018).
In services, labour productivity levels declined post-2007 across all cohorts of firms, and still remained well below their 2006 level (between 15 and 40 per cent) at the end of the period.
As with manufacturing, a widening in the labour productivity gap can be observed, although for slightly different reasons. It has occurred due to firms at the top of the distribution seeing a slower decline in productivity compared to the rest.
50
60
70
80
90
100
110
120
130
20
06
20
07
20
08
20
09
20
10
20
11
20
12
20
13
20
14
20
06
= 1
00
10th percentile 50th percentile 90th percentile

Economic Division | productivity chart-pack Page | 24
Figure 4.3 Contribution of the Most Productive Firms to Aggregate Productivity: manufacturing
Note: 90_100 represents the top productivity decile, with 0_10 representing the bottom decile, 40-60 represents a median group, with the remainder split into 2 equal sized quantiles each covering 3 deciles above and below the median group. Source: Department of Finance (2018).
The top performing firms (the top productivity decile) in manufacturing account for 70 per cent (on average) of aggregate productivity over the period 2006-2014, and just under 80 percent in 2014.
0%
10%
20%
30%
40%
50%
60%
70%
80%
90%
100%
20
06
20
07
20
08
20
09
20
10
20
11
20
12
20
13
20
14

Economic Division | productivity chart-pack Page | 25
Figure 4.4 Contribution of the Most Productive Firms to Aggregate Productivity, market services
Source: Department of Finance (2018).
In services, the impact of the most productive firms on aggregate productivity is lower than in manufacturing.
The top 10 per cent most productive firms account for 46 per cent (on average) of aggregate
productivity over the period. This a growing trend after the crisis from 37 per cent in 2008 to 56 per cent in 2014, suggesting that the top performing firms are growing in size over these years.
0%
10%
20%
30%
40%
50%
60%
70%
80%
90%
100%
2006 2007 2008 2009 2010 2011 2012 2013 2014

Economic Division | productivity chart-pack Page | 26
Figure 4.5 Relative labour productivity by 2-digit industries 2006-2014 – manufacturing
Source: Department of Finance (2018).
The chart reports the average of firm-level productivity at 2-digit sectors, relative to the manufacturing average. As ratios are expressed in logs, the value on the horizontal axis corresponds to the percentage difference between the productivity level of each sector, and the unweighted manufacturing average.
The pharmaceutical sector is by far the most productive, with average firm level productivity
roughly 170 per cent above the manufacturing average. Chemicals and computer products are also well above the manufacturing industry average, being 60 per cent and 43 per cent more productive.
-36%
-32%
-31%
-30%
-3%
0%
5%
31%
33%
43%
60%
-0.4 -0.2 0.0 0.2 0.4 0.6 0.8 1.0 1.2 1.4 1.6
Textiles
Furniture
Transport equipment
Electrical equipment
Basic metals
Food
Rubber and plastic products
Wood and paper products
Machinery and equipment
Computer products
Chemicals
Pharmaceuticals
172%

Economic Division | productivity chart-pack Page | 27
Figure 4.6 Relative labour productivity by 2-digit industries 2006-2014 – market services
Source: Department of Finance (2018).
In the case of services, the most productive sector relative to the industry average is Scientific R&D (76 per cent more productive).
This is followed by the Publishing, audio-visual and broadcasting services (media) and Telecommunications sectors, which are about 64 per cent larger than the average productivity in the services industry.
-13%
-5%
11%
14%
37%
49%
64%
64%
76%
-0.4 -0.2 0.0 0.2 0.4 0.6 0.8 1.0
Hotels and restaurants
Wholesale & retail
Administration services
Transportation & storage
Marketing & other
Legal & accounting
IT
Telecommunications
Media
Scientific R&D
Economic Division | productivity chart-pack Page | 28
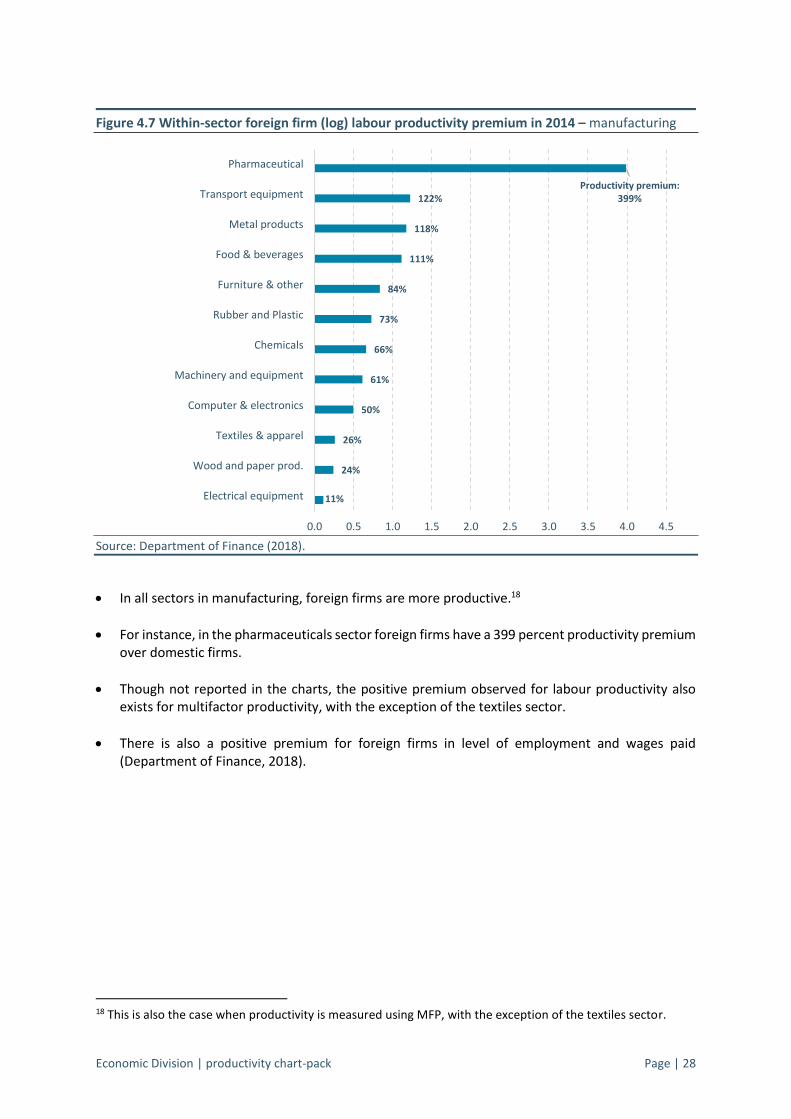
Figure 4.7 Within-sector foreign firm (log) labour productivity premium in 2014 – manufacturing
Source: Department of Finance (2018).
In all sectors in manufacturing, foreign firms are more productive.18
For instance, in the pharmaceuticals sector foreign firms have a 399 percent productivity premium over domestic firms.
Though not reported in the charts, the positive premium observed for labour productivity also exists for multifactor productivity, with the exception of the textiles sector.
There is also a positive premium for foreign firms in level of employment and wages paid (Department of Finance, 2018).
18 This is also the case when productivity is measured using MFP, with the exception of the textiles sector.
11%
24%
26%
50%
61%
66%
73%
84%
111%
118%
122%Productivity premium:
399%
0.0 0.5 1.0 1.5 2.0 2.5 3.0 3.5 4.0 4.5
Electrical equipment
Wood and paper prod.
Textiles & apparel
Computer & electronics
Machinery and equipment
Chemicals
Rubber and Plastic
Furniture & other
Food & beverages
Metal products
Transport equipment
Pharmaceutical

Economic Division | productivity chart-pack Page | 29
Figure 4.8 Within-sector foreign firm (log) labour productivity premium in 2014, market services
Source: Department of Finance (2018).
In all sectors in services, foreign firms are more productive.19
Foreign telecommunications firms have a productivity premium of 171 per cent over domestic firms, while foreign real estate firms are not significantly more productive than their domestic counterparts
19 This is also the case for all services sectors under an MFP measure of productivity.
7%
8%
37%
39%
74%
74%
82%
102%
144%
153%
Productivity premium: 171%
0.0 0.5 1.0 1.5 2.0 2.5
Real estate activities
Scientific R&D
Hotels and restaurants
Administrative and support service activities
Advertising and market research
Legal & accounting
Wholesale & retail
Transportation & storage
IT
Media
Telecommunications

Economic Division | productivity chart-pack Page | 30
Section 5 – Allocative efficiency

Economic Division | productivity chart-pack Page | 31
Figure 5.1 Allocative efficiency of whole economy, US dollars
Source: Department of Finance (2018).
Aggregate whole economy or sectoral productivity can be decomposed mathematically into two components according to the Olley-Pakes method (1996) – the average (unweighted) productivity of the firms in the economy or sector, and the relationship between firm size and productivity (known as allocative efficiency).20
In 2006, the unweighted average of all firms was roughly $55,000 per worker, while the aggregate (weighted) productivity economy was $80,000 per worker. The higher weighted productivity owes to the largest firms also being the most productive.
On average, 36 per cent of aggregate productivity is accounted for by large firms (in terms of labour) being the most productive, although the strength of this relationship is growing over the period, indicating an increasingly efficient market as the most productive firms have increased their market share.
20 Olley, S., Pakes, A., (1996), “The dynamics of productivity in the telecommunications equipment industry”,
Econometrica 64, 1263–1298.
0
10,000
20,000
30,000
40,000
50,000
60,000
70,000
80,000
90,000
100,000
20
06
20
07
20
08
20
09
20
10
20
11
20
12
20
13
20
14
Unweighted productivity
Due to the efficiency of resource allocation
Weighted/Aggregate productivity

Economic Division | productivity chart-pack Page | 32
Figure 5.2 Allocative efficiency of manufacturing, US dollars
Source: Department of Finance (2018).
In the manufacturing sector, more than a half (54 per cent on average) of aggregate labour productivity is accounted for by allocative efficiency over the whole 2006-2014 period. The remaining part of aggregate productivity in manufacturing is accounted for by within-firm productivity.
The 2013 decline in weighted productivity was mainly driven by a drop in value added of large chemical and pharmaceutical enterprises, coinciding with the ‘patent cliff’ in those sectors.
-
50,000
100,000
150,000
200,000
250,000
20
06
20
07
20
08
20
09
20
10
20
11
20
12
20
13
20
14
Unweighted productivity
Due to the efficiency of resource allocation
Weighted/Aggregate productivity

Economic Division | productivity chart-pack Page | 33
Figure 5.3 Allocative efficiency of market services, US dollars
Source: Department of Finance (2018).
In services, most of the aggregate productivity is accounted for by within-firm (unweighted) productivity over the period 2006-2014, with the overall allocation of resources playing a very small role.
In fact, the allocation term was even negative during the crisis reflecting an inefficient resource allocation during that period, indicative of an increase in market share by (and flow of resources towards) less productive firms.
After the crisis allocative efficiency started to grow, accounting for about 14 per cent of aggregate productivity in 2014.
-10,000
-
10,000
20,000
30,000
40,000
50,000
60,000
70,000
20
06
20
07
20
08
20
09
20
10
20
11
20
12
20
13
20
14
Unweighted productivity
Due to efficiency of resource allocation
Weighted/aggregate productivity

Economic Division | productivity chart-pack Page | 34
Figure 5.4 Manufacturing allocative efficiency across countries in 2011, 2005 USD PPPs
Source: Department of Finance (2018), Berlingieri et al (2017).
Ireland’s resource allocation term in manufacturing is large when benchmarked against other OECD countries, with only Hungary and Chile reporting a contribution from allocative efficiency of 50 per cent or more in 2011.
This outcome is likely to be driven by the impact of a small number of very large firms, in certain foreign dominated sectors.
When these sectors are excluded, the efficiency of resource allocation in manufacturing in Ireland is more in line with the average, falling from 56 per cent to 29 per cent in 2011.
56%
34%
31%
34%
41%
39%
45%
25%
29%
29%
6%
23%
10%
9%
41%
67%
48%
52%
0 20,000 40,000 60,000 80,000 100,000 120,000 140,000 160,000 180,000 200,000
IRL
BEL
NOR
DNK
SWE
NLD
AUT
FRA
FIN
IRL*
AUS
JPN
LUX
CAN
ITA
HUN
PRT
CHL
due to the efficiency of resource allocation

Economic Division | productivity chart-pack Page | 35
Figure 5.5 Macro-level allocative efficiency (2014) and total change (2000-2014) in EU MS
Note: the allocative efficiency term is expressed in percentage terms, i.e. equal to the ratio of aggregate productivity to the unweighted average of sectoral productivity, multiplied by 100. The change is an estimated change over 14 years, obtained by running a simple regression of annual allocative efficiency on the time trend for each country. Source: European Commission.21
Ireland’s level of allocative efficiency was below the euro area average in 2014, reflecting the less efficient allocation of resources in services and other sectors outside of manufacturing.
Its growth rate on the other hand was above the euro area, capturing the improvements in services over the period.
21 European Commission (forthcoming), “Allocative efficiency in the euro area”, note for the Eurogroup.
AT
BE
BG
CY
CZDE
DK
EE
ES
FI
FR
IE
IT
LT
LU
NL
PT
RO
SE
SI
SK
UK
euro area average
euro area average
55
60
65
70
75
80
85
-5 0 5 10 15 20 25
Leve
l of
allo
cati
ve e
ffic
ien
cy,
20
14
Change in allocative efficiency, 2000-2014

Economic Division | productivity chart-pack Page | 36
Section 6 – Unit labour costs

Economic Division | productivity chart-pack Page | 37
Figure 6.1 Overall, Domestic and Foreign Nominal Unit Labour Costs growth rates, per cent
Source: CSO.
Nominal unit labour costs (ULC) measure nominal hourly employee compensation relative to real
labour productivity. Growth in ULC suggests that nominal employee income is rising relative to
real labour productivity, resulting in decreased competitiveness.
Irelands ULC increased rapidly relative to overall output from 2000 to 2008. Since 2009, however,
it has declined substantially to just under ninety percent of the 2000 level.
The foreign-dominated sector has been much more volatile over the period than the domestic
part of the economy, showing large and intermittent changes, including the 2015 shock to GVA.
-40
-35
-30
-25
-20
-15
-10
-5
0
5
10
15
20
01
20
02
20
03
20
04
20
05
20
06
20
07
20
08
20
09
20
10
20
11
20
12
20
13
20
14
20
15
20
16
Foreign Domestic Whole economy
Reduced
competitiveness
Increased
competitiveness

Economic Division | productivity chart-pack Page | 38
Figure 6.2 Nominal Unit Labour Cost growth by country, per cent
Source: CSO, Eurostat.
Despite having had one of the highest levels of growth in nominal ULC from 2000 to 2008, Ireland is the only country in the EU to have had a cumulative fall in nominal unit labour cost over the entire period.
This negative result is driven by developments in the foreign-dominated sector of the Irish economy, in particular the significant increase in GVA in 2015.
The domestic sector on its own has had the lowest increase in nominal unit labour cost relative to the rest of the EU, due to labour shedding in the construction sector during the crisis.
-100
-50
0
50
100
150
200
250
IRE
- Fo
reig
n D
om
.
IRE
IRE
- D
om
esti
c &
Oth
ers
DEU PR
T
HR
V
PO
L
NLD ES
P
GR
E
BEL
FRA
AU
T
CYP
SWE
FIN
CZE
DN
K
ITA
SVK
UK
MLT
SVN
LUX
LTU
HU
N
BG
R
EST
LVA
RO
U

Economic Division | productivity chart-pack Page | 39