PRODUCTIVITY AND ENERGY EFFICIENCY: A CASE STUDY IN …
20
Iberoamerican Journal of Industrial Engineering, Florianópolis, SC, Brasil, v. 7, n. 13, p. 196- 215, 2015. PRODUCTIVITY AND ENERGY EFFICIENCY: A CASE STUDY IN THE TEXTILE INDUSTRY IN BRAZIL Miguel Otávio Melo 1 Ricardo Moreira 2 Vanessa Pereira 3 ABSTRACT: The aim of this paper is to analyze the relationship between energy efficiency and productivity from the point of view of the losses. The specific objectives are to raise the current industry productivity case, identifying the existing energy losses; and to raise the potential for improvement and simulate the new level of productivity in face of improvements caused by energy efficiency. The research is a case study in the textile sector industry in the Northeast of Brazil. Variables of production and energy efficiency were analyzed: energy management, power systems, lighting systems, and calculated productivity. In conclusion, it is shown that there is a direct relationship between the variables of energy efficiency and productivity with a reduced consumption of electricity of 4.74 % and an increase of 4.96 % in terms of productivity in the industry. Keywords: Productivity and energy efficiency. Textile industries. Energy losses. 1 INTRODUCTION The energy management is not restricted just to meet demand and take measures for energy efficiency (EE). In the Polar Regions there is the destruction of the ozone layer due to the emission of greenhouse gases is causing the greenhouse effect and as a consequence a reduction of polar ice caps affecting biodiversity due to rising sea level. In view of this, the idea of integrated policies aggregating certificates of quality, environmental management and emission gas pollutants equivalent of carbon dioxide CO2 is increasingly being held (CULLEN, 2010; SIITONEN et al., 2010). It appears that the global target is to reduce CO2 emissions by 2050 so that the temperature is limited to an increase of 2 ºC (TESKE, 2011). In the last decade, much 1 Doctor, Production Engineering, Center University ASCES, Paraiba, Brazil. E-mail: [email protected]. 2 Doctor, Production Engineering Federal University of Paraiba, Paraiba, Brazil. E-mail: [email protected]. 3 Master, Production Engineering Federal University of Paraiba, PB-Brazil. E-mail: [email protected].
Transcript of PRODUCTIVITY AND ENERGY EFFICIENCY: A CASE STUDY IN …

Iberoamerican Journal of Industrial Engineering, Florianópolis, SC, Brasil, v. 7, n. 13, p. 196-215, 2015.
PRODUCTIVITY AND ENERGY EFFICIENCY: A CASE STUDY IN
THE TEXTILE INDUSTRY IN BRAZIL
Miguel Otávio Melo1
Ricardo Moreira2
Vanessa Pereira3
ABSTRACT: The aim of this paper is to analyze the relationship between energy efficiency
and productivity from the point of view of the losses. The specific objectives are to raise the
current industry productivity case, identifying the existing energy losses; and to raise the
potential for improvement and simulate the new level of productivity in face of improvements
caused by energy efficiency. The research is a case study in the textile sector industry in the
Northeast of Brazil. Variables of production and energy efficiency were analyzed: energy
management, power systems, lighting systems, and calculated productivity. In conclusion, it
is shown that there is a direct relationship between the variables of energy efficiency and
productivity with a reduced consumption of electricity of 4.74 % and an increase of 4.96 % in
terms of productivity in the industry.
Keywords: Productivity and energy efficiency. Textile industries. Energy losses.
1 INTRODUCTION
The energy management is not restricted just to meet demand and take measures for
energy efficiency (EE). In the Polar Regions there is the destruction of the ozone layer due to
the emission of greenhouse gases is causing the greenhouse effect and as a consequence a
reduction of polar ice caps affecting biodiversity due to rising sea level. In view of this, the
idea of integrated policies aggregating certificates of quality, environmental management and
emission gas pollutants equivalent of carbon dioxide CO2 is increasingly being held
(CULLEN, 2010; SIITONEN et al., 2010).
It appears that the global target is to reduce CO2 emissions by 2050 so that the
temperature is limited to an increase of 2 ºC (TESKE, 2011). In the last decade, much
1 Doctor, Production Engineering, Center University ASCES, Paraiba, Brazil. E-mail: [email protected]. 2 Doctor, Production Engineering Federal University of Paraiba, Paraiba, Brazil. E-mail: [email protected]. 3 Master, Production Engineering Federal University of Paraiba, PB-Brazil. E-mail: [email protected].
Iberoamerican Journal of Industrial Engineering, Florianópolis, SC, Brasil, v. 7, n. 13, p. 196-215, 2015.
197
research has been done on methods for improving EE and reduction of CO2 emissions in
many countries like Germany, USA, Sweden, Holland and others (SANDS et al., 2009;
MILLS, 2011; MLECNICK 2012; MARTINEZ et al., 2013; ROSENOW, 2013) . The
researchers analyzed various sectors of economic activity such as vehicles, buildings, lighting,
transportation and household appliances (URGE VORSATZ, 2009; VENDRUSCULO, 2009;
RAUX; RAUX, 2010; MILLS; JACOBSON, 2011; BERRY, 2014).
It is noteworthy that all segments of society must contribute effectively to improving the
environment, since the risks are real due to global warming and the attitudes and actions must
be practical, especially those related to energy conservation and efficiency. This paradigm
shift will substantially contribute to future generations of the world. Many countries have
organized the awards as an instrument to promote Energy Efficiency (EE), to contribute
towards energy sustainability and to provide a mechanism to continuously search for
organizations, initiatives and to acknowledge and benchmark best practices in EE (MANAN,
2010).
Improvements in productivity levels, through the rational use of resources cited, may
reduce costs, benefiting society and the survival of businesses. Thus, the application of EE
can be considered as a tool to increase the productivity of the industry.
The need for varied and diversified products that meet the expectations and aspirations
of the different types of customers require a greater effort of the industry to raise productivity
and lower costs. In the textile industry, it is not different and technological advancement and
reduction of loss of resources are vital.
For the textile industry to remain competitive in the market, it is essential to monitor
productivity levels through the measurement of resources used by it in its transformation
process. Examples of these resources are: Labor, capital, materials and energy. However, for
this study they will be emphasized to electricity.
Thus this can be achieved by varying the input features, output or both, and the ideal
way of productivity in the organizational environment is achieved is by reducing resource
input and output increase. Boyde and Pang (2009) indicated that intensive industries have low
energy productivity. Thus the use of EE in the industrial sector is an alternative that if applied
can increase productivity with respect to its use.
The reduction of energy losses encompassing the dimensions of the study (energy
management, lighting systems and power systems), sets up a potential for reducing the power
consumption by about 5% , 8% and 50%, respectively. In addition, these measures are a low

Iberoamerican Journal of Industrial Engineering, Florianópolis, SC, Brasil, v. 7, n. 13, p. 196-215, 2015.
198
cost investment (GELLER, 2003). So applying them to industry generates benefits in the case
and in its surroundings
This article seeks to quantify the potential productivity gains linked to EE, analyzing the
relationship of measures to reduce energy consumption with productivity in the textile
segment.
In the section, 2 will be shown theoretical considerations of productivity and energy
efficiency. The methods and models used in this paper are in the section 3 and the results in
the section 4. The conclusions are shown in the section 5.
2 GENERAL CONSIDERATIONS
In this section will be shown and analysed the textile industry in Brazil and the
definition and general considerations of energy efficiency and productivity as lighting, motors
and improvements in energy management
2.1 The Textile Industry in Brazil
The textile sector is divided between the activities of spinning, weaving, knitting,
finishing. For the purposes of this study, only the spinning industry will be considered. In this
segment, the fibers are converted into yarn by grouping and twisting operations.
The wiring understood in the broadest sense, encompasses a set of processes and
operations required for processing of fibers into yarn. It comprises the treatments given to the
raw material, according to its nature and purpose of the desired product. The spinning process
may be performed by two methods: a) spinning ring and b) spinning rotor.
The ring spinning is an important wiring system to make fine yarns of different fibers in
the textile industry, but the high power consumption and low productivity are outstanding
problems in this type of wiring (KAPLAN et al., 2010). Because spinning with the rotor
system produces thicker wires to the successful transformation of the fiber with higher speeds
(TANG et al., 2006) and one of the advantages of this system compared to the previous is the
reduction of waste. The type of wiring used in the case study is spinning with the rotor system
thus this will be the focus of the study.
The basic steps of the production process consists in preparing wiring (opening of the
burden of the raw material (Cotton/Polyester); mixture; carding process , development of the
wires) and the wiring itself through twisting wires process. To perform the transformation
Iberoamerican Journal of Industrial Engineering, Florianópolis, SC, Brasil, v. 7, n. 13, p. 196-215, 2015.
199
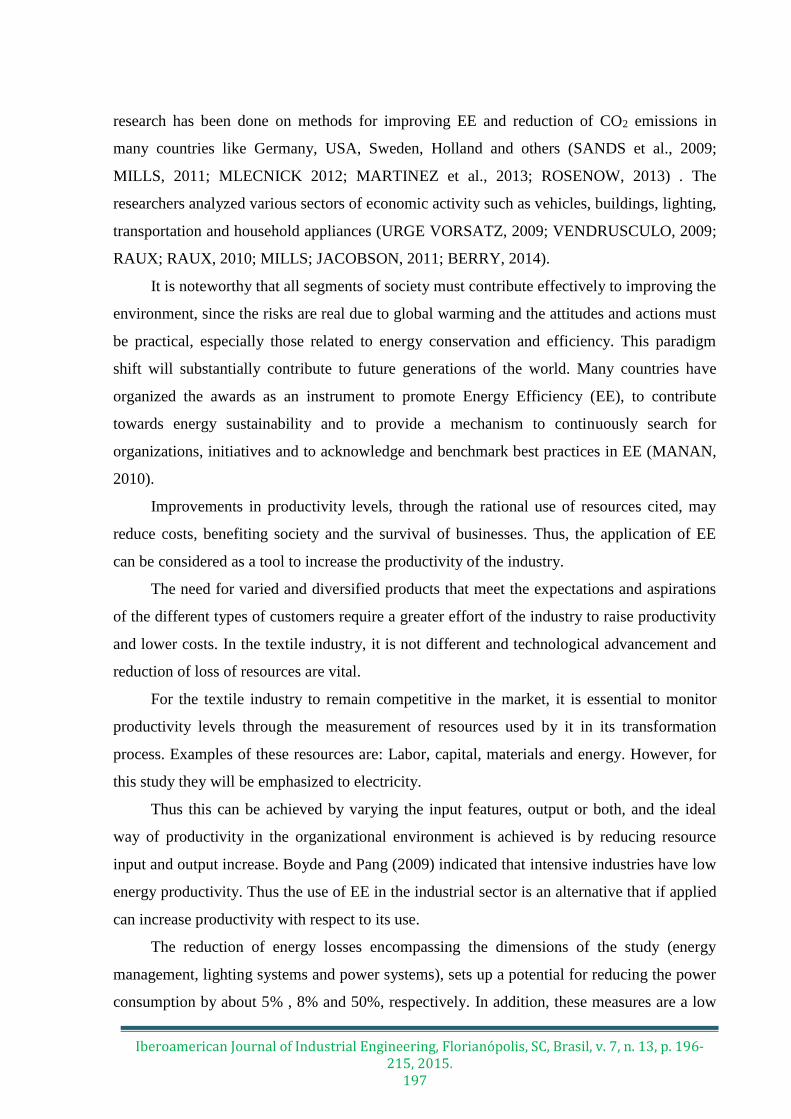
process in wiring the following steps are necessary: carding; opening smugglers and spinning
machines (Twist) as shown in Figure 1.
Figure 1 – Phases of the production process of spinning
Source: Adapted from Tang et al. (2006)
The concern with the development and the prospect of the industry is growing due to
two main factors: poor performance of the industry globally and the growth of the advantages
that Asian countries have in relation to others (KAPLAN et al., 2010).
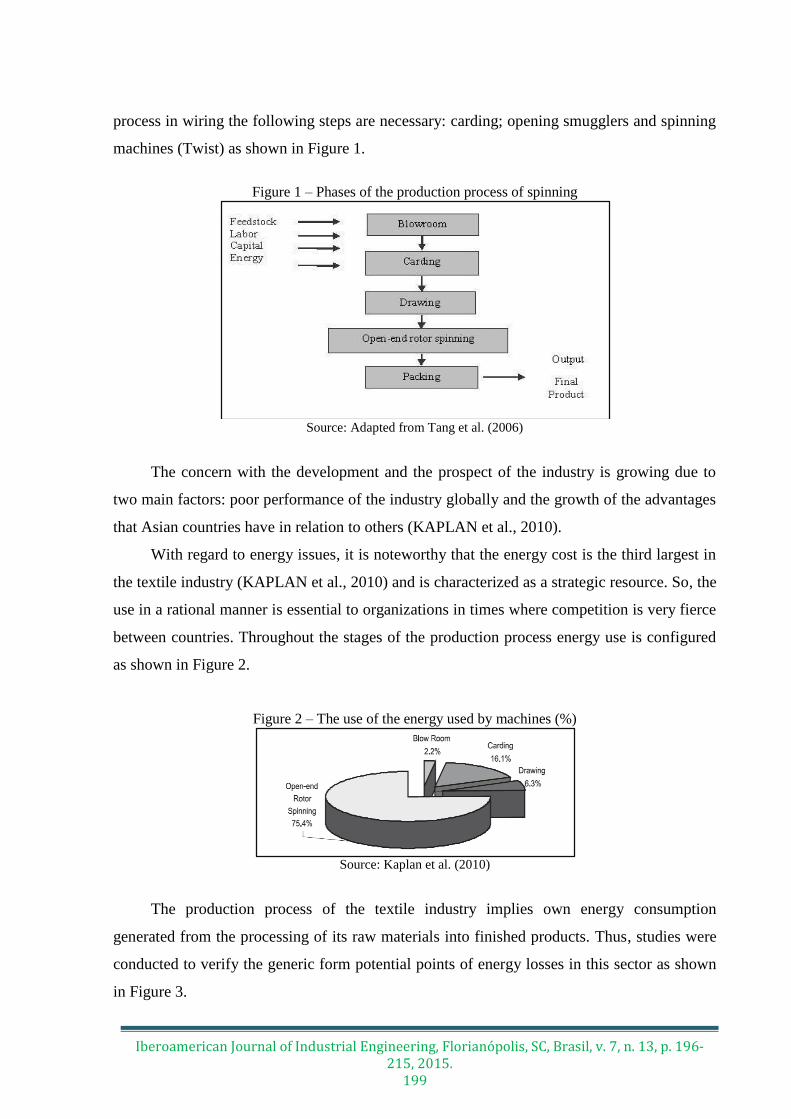
With regard to energy issues, it is noteworthy that the energy cost is the third largest in
the textile industry (KAPLAN et al., 2010) and is characterized as a strategic resource. So, the
use in a rational manner is essential to organizations in times where competition is very fierce
between countries. Throughout the stages of the production process energy use is configured
as shown in Figure 2.
Figure 2 – The use of the energy used by machines (%)
Source: Kaplan et al. (2010)
The production process of the textile industry implies own energy consumption
generated from the processing of its raw materials into finished products. Thus, studies were
conducted to verify the generic form potential points of energy losses in this sector as shown
in Figure 3.
Iberoamerican Journal of Industrial Engineering, Florianópolis, SC, Brasil, v. 7, n. 13, p. 196-215, 2015.
200
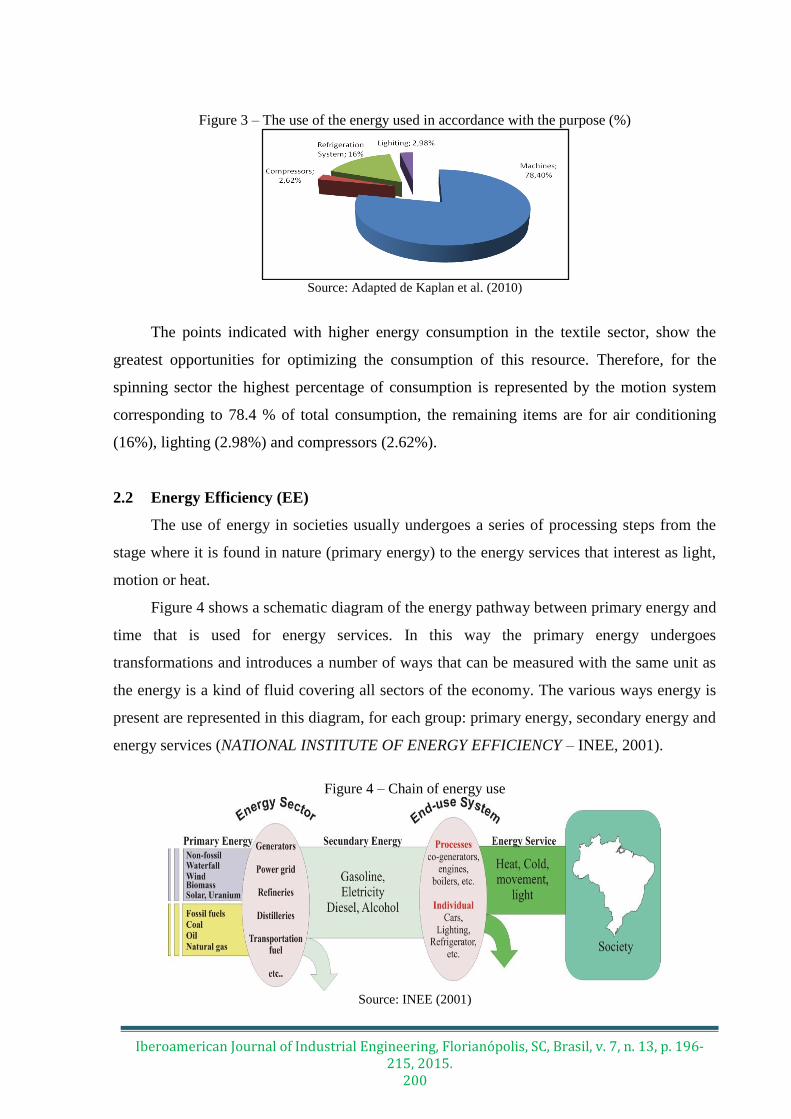
Figure 3 – The use of the energy used in accordance with the purpose (%)
Source: Adapted de Kaplan et al. (2010)
The points indicated with higher energy consumption in the textile sector, show the
greatest opportunities for optimizing the consumption of this resource. Therefore, for the
spinning sector the highest percentage of consumption is represented by the motion system
corresponding to 78.4 % of total consumption, the remaining items are for air conditioning
(16%), lighting (2.98%) and compressors (2.62%).
2.2 Energy Efficiency (EE)
The use of energy in societies usually undergoes a series of processing steps from the
stage where it is found in nature (primary energy) to the energy services that interest as light,
motion or heat.
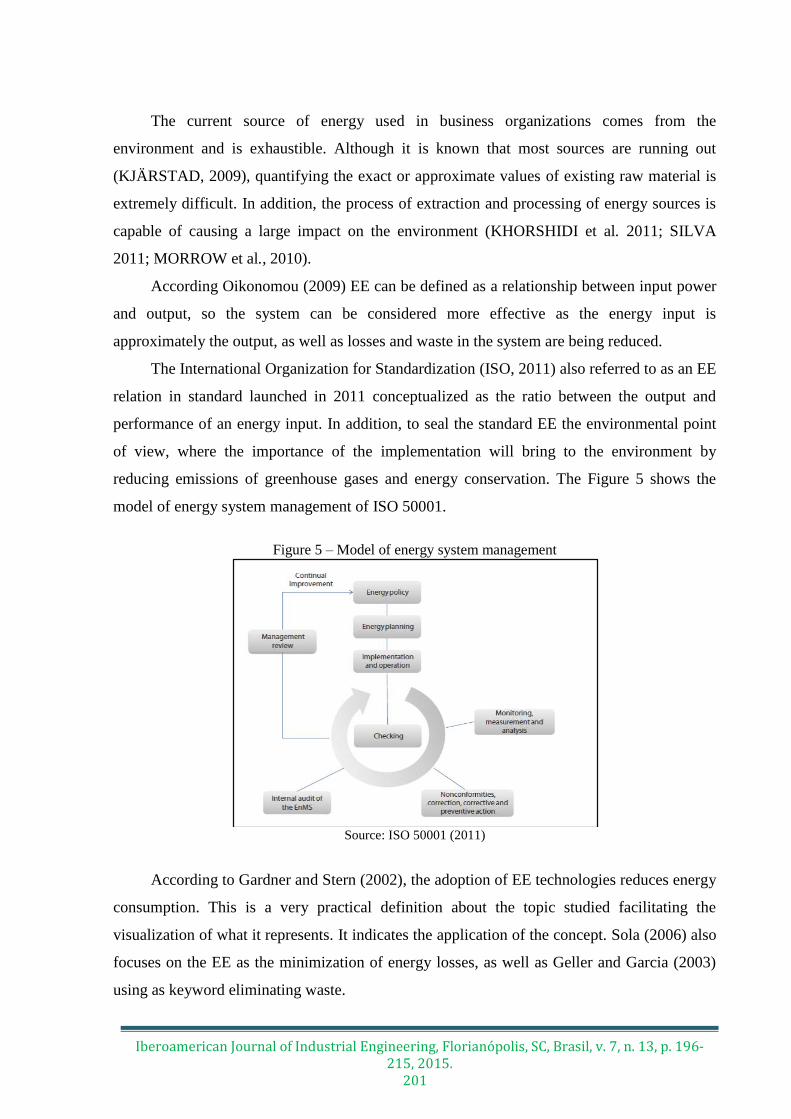
Figure 4 shows a schematic diagram of the energy pathway between primary energy and
time that is used for energy services. In this way the primary energy undergoes
transformations and introduces a number of ways that can be measured with the same unit as
the energy is a kind of fluid covering all sectors of the economy. The various ways energy is
present are represented in this diagram, for each group: primary energy, secondary energy and
energy services (NATIONAL INSTITUTE OF ENERGY EFFICIENCY – INEE, 2001).
Figure 4 – Chain of energy use
Source: INEE (2001)
Iberoamerican Journal of Industrial Engineering, Florianópolis, SC, Brasil, v. 7, n. 13, p. 196-215, 2015.
201
The current source of energy used in business organizations comes from the
environment and is exhaustible. Although it is known that most sources are running out
(KJÄRSTAD, 2009), quantifying the exact or approximate values of existing raw material is
extremely difficult. In addition, the process of extraction and processing of energy sources is
capable of causing a large impact on the environment (KHORSHIDI et al. 2011; SILVA
2011; MORROW et al., 2010).
According Oikonomou (2009) EE can be defined as a relationship between input power
and output, so the system can be considered more effective as the energy input is
approximately the output, as well as losses and waste in the system are being reduced.
The International Organization for Standardization (ISO, 2011) also referred to as an EE
relation in standard launched in 2011 conceptualized as the ratio between the output and
performance of an energy input. In addition, to seal the standard EE the environmental point
of view, where the importance of the implementation will bring to the environment by
reducing emissions of greenhouse gases and energy conservation. The Figure 5 shows the
model of energy system management of ISO 50001.
Figure 5 – Model of energy system management
Source: ISO 50001 (2011)
According to Gardner and Stern (2002), the adoption of EE technologies reduces energy
consumption. This is a very practical definition about the topic studied facilitating the
visualization of what it represents. It indicates the application of the concept. Sola (2006) also
focuses on the EE as the minimization of energy losses, as well as Geller and Garcia (2003)
using as keyword eliminating waste.
Iberoamerican Journal of Industrial Engineering, Florianópolis, SC, Brasil, v. 7, n. 13, p. 196-215, 2015.
202
The energy losses are directly related to the efficient use of energy. In turn, reduced
productivity is related to the existence of losses in the process. Thus, when there are gains in
energy use there will be increased productivity.
Various options for savings opportunities and implementation of a program of industrial
EE have been the pattern in Figure 6.
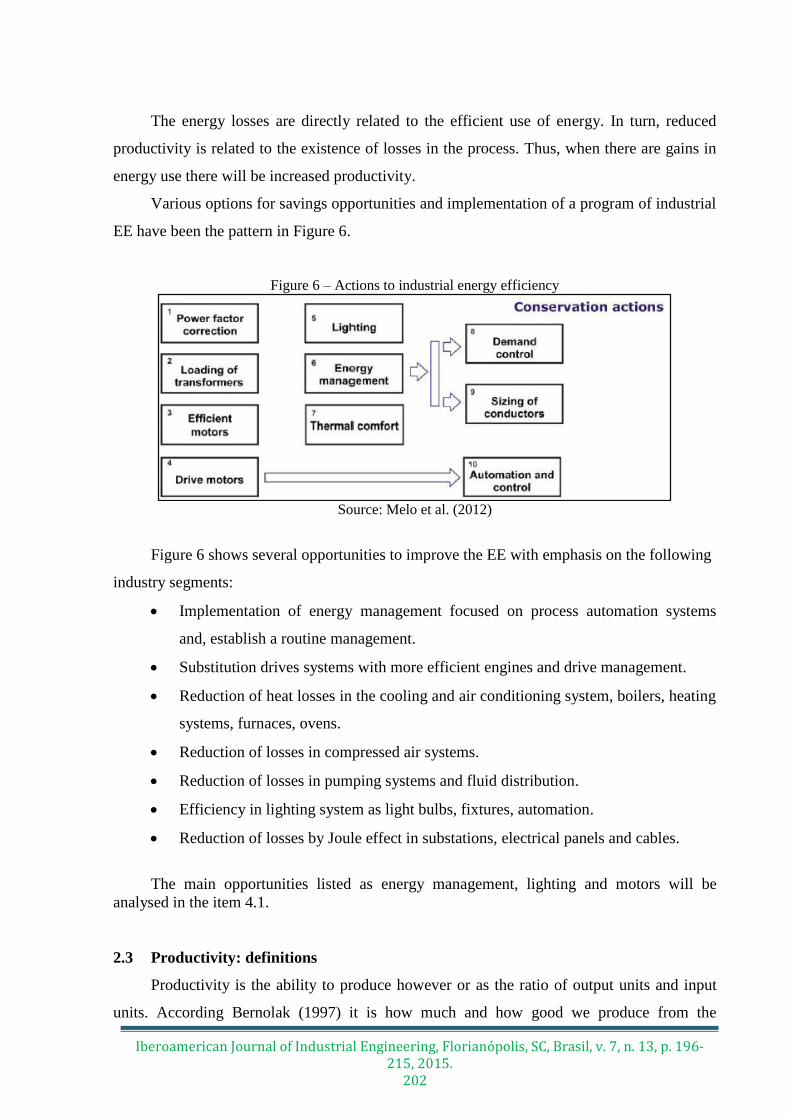
Figure 6 – Actions to industrial energy efficiency
Source: Melo et al. (2012)
Figure 6 shows several opportunities to improve the EE with emphasis on the following
industry segments:
Implementation of energy management focused on process automation systems
and, establish a routine management.
Substitution drives systems with more efficient engines and drive management.
Reduction of heat losses in the cooling and air conditioning system, boilers, heating
systems, furnaces, ovens.
Reduction of losses in compressed air systems.
Reduction of losses in pumping systems and fluid distribution.
Efficiency in lighting system as light bulbs, fixtures, automation.
Reduction of losses by Joule effect in substations, electrical panels and cables.
The main opportunities listed as energy management, lighting and motors will be
analysed in the item 4.1.
2.3 Productivity: definitions
Productivity is the ability to produce however or as the ratio of output units and input
units. According Bernolak (1997) it is how much and how good we produce from the

Iberoamerican Journal of Industrial Engineering, Florianópolis, SC, Brasil, v. 7, n. 13, p. 196-215, 2015.
203
resources used. Moseng and Rostaldas (2001) conceptualize the ability to meet the need of
goods and services with minimal consumption of resources used. Pekuri et al. (2011) show
that productivity should be used solely to identify improvement targets and control activities
at a micro level, that is, within companies and at the level of their internal processes.
The European Association of National Productivity Centres (EANPC, 2005) defines
productivity as how efficiently and effectively products and services are being produced. The
productivity can be increased by two variable factors: the amount of production and amount
of resources used. There are four ways to increase productivity:
Increase production and not change the amount of resources used.
Reduce the amount of resources as the same production takes place.
Increase the amount of resources used and further increase production.
Reducing the amount of production and further reduce the amount of resources used.
The increase in productivity of a company is always positive because it creates
competitive advantage through process improvement and improvement of the results because
it refers to measuring the use of resources (labor, machinery, materials, energy and capital).
The principle productivity can be determined using any of these features as input denominator
to make a productivity index. Productivity can be measured in whole but also partially. The
measures of partial productivity ratios are output for a given input source such as labor,
capital, materials and energy (MORAES, 2011).
Losses along the transformation process are the main reasons for reduced
competitiveness, and for this reason, organizations need to undertake efforts that are
eliminated, or minimized, in order to stay on the market. Raw materials are commonly used,
because, they represent a large portion of the costs involved in the process. However, the
energy also has significant representation in the industrial sector.
Therefore, given that productivity should be measured to increase the ability of
organizations to compete in the market (TANGEN, 2005) and that it can be measured in part
(MORAES, 2011), the use of the indicator represents an alternative energy for reducing waste
in the manufacturing process, through constant monitoring.
3 METHODS AND MODELS
The case study of this research was carried out in a textile factory in northeast Brazil,
having as main task to transform the raw material into yarn, in the case of an industry wiring.
Iberoamerican Journal of Industrial Engineering, Florianópolis, SC, Brasil, v. 7, n. 13, p. 196-215, 2015.
204
For the research, it was decided to use three research instruments, namely: Document
analysis, structured interviews and direct observation. The analysis was conducted in three
segments:
The first part is related to the current state of the industry case under the aspects of
production (kg) , consumption (MWh) and the relationship between these two variables
(kg/MWh) characterizing the current productivity of the industry.
The second is related to the energy profile characterization of the variables related to the
proposed EE (energy management, lighting systems and power systems) identifying possible
points of existing losses and alternative improvements.
The third part is related to the estimation of the new level of productivity in face of the
improvements implemented by EE.
4 RESULTS
The first variable analyzed was used in the industrial production in the case study: the
amount of yarn produced monthly in kg, the proposed 60-month period, and the first
observable indicator of production (kg/month).
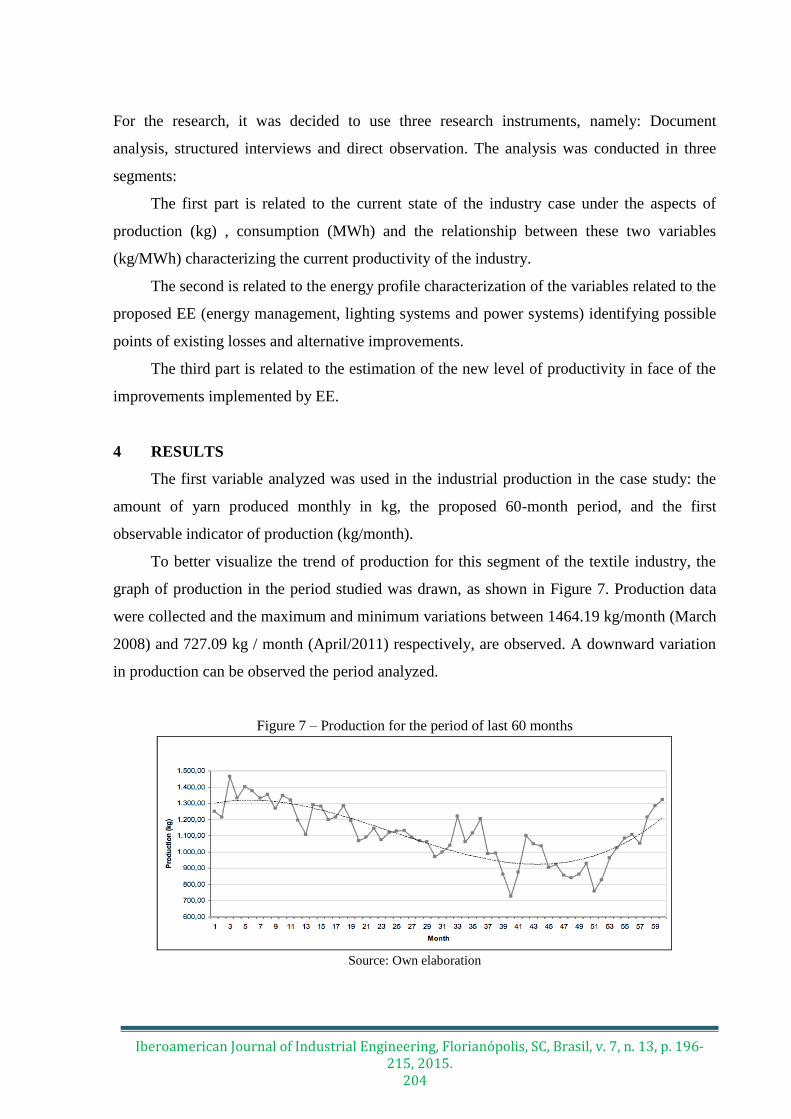
To better visualize the trend of production for this segment of the textile industry, the
graph of production in the period studied was drawn, as shown in Figure 7. Production data
were collected and the maximum and minimum variations between 1464.19 kg/month (March
2008) and 727.09 kg / month (April/2011) respectively, are observed. A downward variation
in production can be observed the period analyzed.
Figure 7 – Production for the period of last 60 months
Source: Own elaboration
Iberoamerican Journal of Industrial Engineering, Florianópolis, SC, Brasil, v. 7, n. 13, p. 196-215, 2015.
205
As shown in Figure 7 there is a decreased production over the past four years (2008-
2011). A reaction of the productive sector with an increase in production later this year was
observed over the course of the year 2012 from the month of April.
The other quantitative variable analyzed was the energy consumption, conducted during the
same period of the production variable (60 months), making feasible the calculation of yield
as a function of EE.
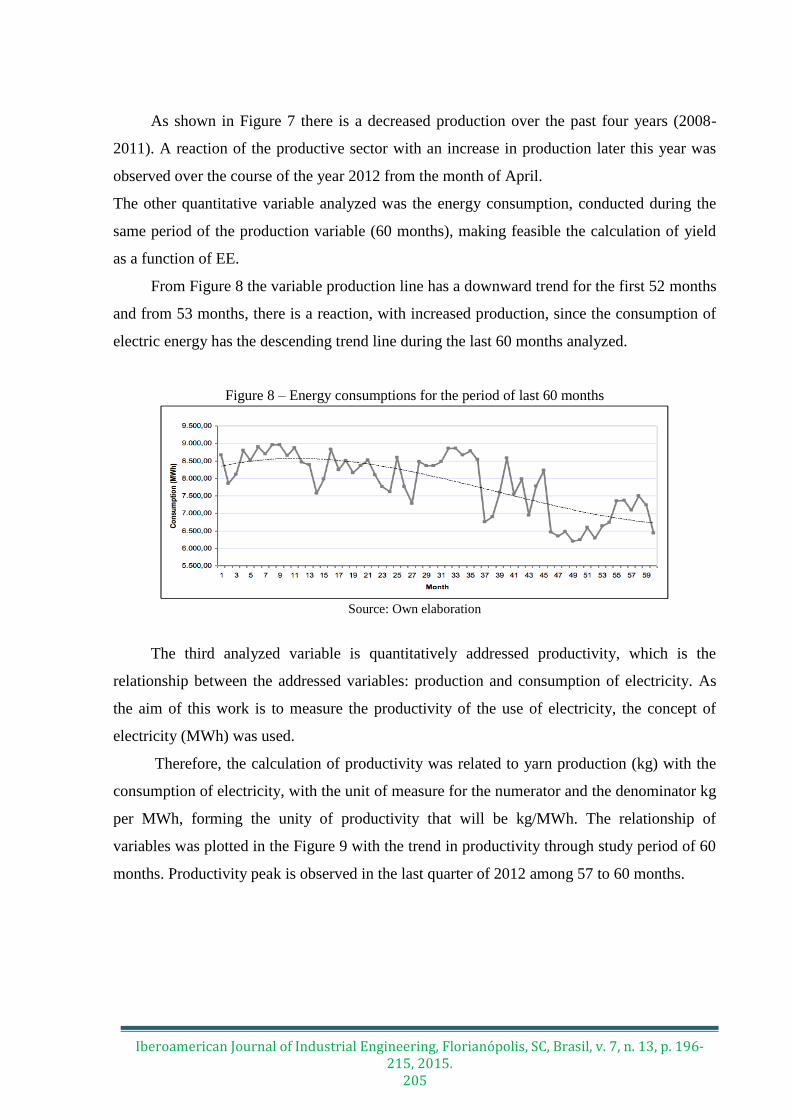
From Figure 8 the variable production line has a downward trend for the first 52 months
and from 53 months, there is a reaction, with increased production, since the consumption of
electric energy has the descending trend line during the last 60 months analyzed.
Figure 8 – Energy consumptions for the period of last 60 months
Source: Own elaboration
The third analyzed variable is quantitatively addressed productivity, which is the
relationship between the addressed variables: production and consumption of electricity. As
the aim of this work is to measure the productivity of the use of electricity, the concept of
electricity (MWh) was used.
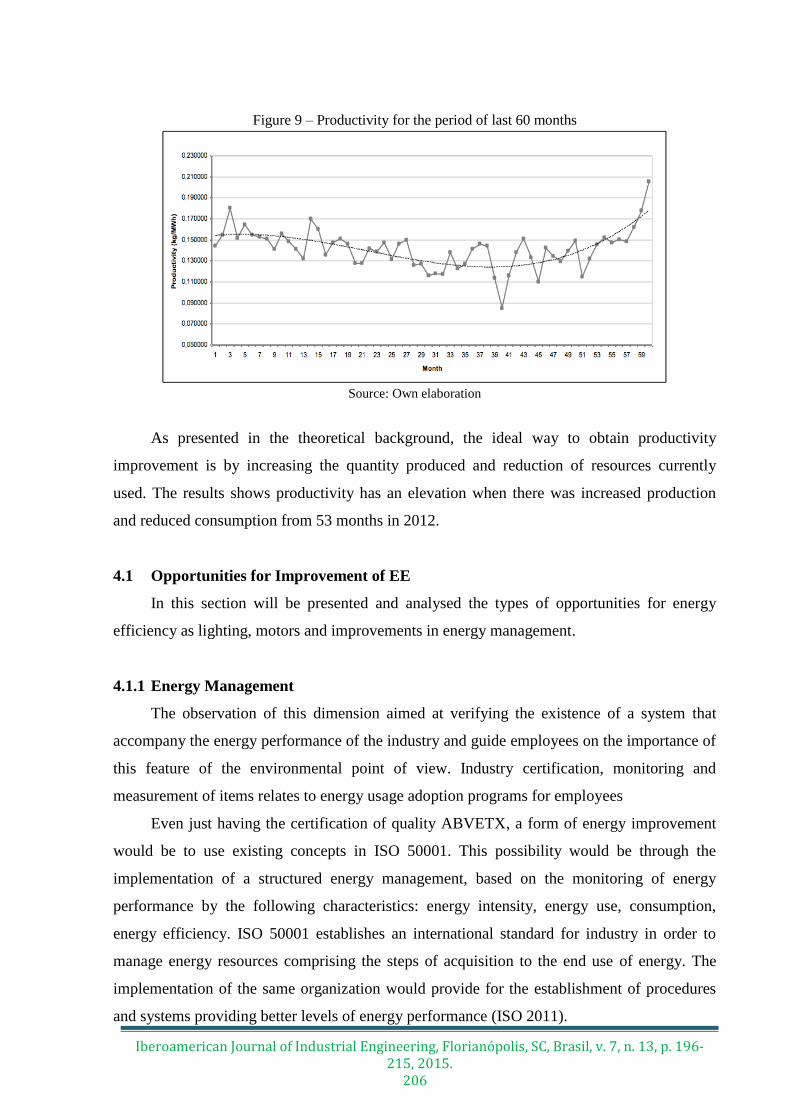
Therefore, the calculation of productivity was related to yarn production (kg) with the
consumption of electricity, with the unit of measure for the numerator and the denominator kg
per MWh, forming the unity of productivity that will be kg/MWh. The relationship of
variables was plotted in the Figure 9 with the trend in productivity through study period of 60
months. Productivity peak is observed in the last quarter of 2012 among 57 to 60 months.
Iberoamerican Journal of Industrial Engineering, Florianópolis, SC, Brasil, v. 7, n. 13, p. 196-215, 2015.
206
Figure 9 – Productivity for the period of last 60 months
Source: Own elaboration
As presented in the theoretical background, the ideal way to obtain productivity
improvement is by increasing the quantity produced and reduction of resources currently
used. The results shows productivity has an elevation when there was increased production
and reduced consumption from 53 months in 2012.
4.1 Opportunities for Improvement of EE
In this section will be presented and analysed the types of opportunities for energy
efficiency as lighting, motors and improvements in energy management.
4.1.1 Energy Management
The observation of this dimension aimed at verifying the existence of a system that
accompany the energy performance of the industry and guide employees on the importance of
this feature of the environmental point of view. Industry certification, monitoring and
measurement of items relates to energy usage adoption programs for employees
Even just having the certification of quality ABVETX, a form of energy improvement
would be to use existing concepts in ISO 50001. This possibility would be through the
implementation of a structured energy management, based on the monitoring of energy
performance by the following characteristics: energy intensity, energy use, consumption,
energy efficiency. ISO 50001 establishes an international standard for industry in order to
manage energy resources comprising the steps of acquisition to the end use of energy. The
implementation of the same organization would provide for the establishment of procedures
and systems providing better levels of energy performance (ISO 2011).
Iberoamerican Journal of Industrial Engineering, Florianópolis, SC, Brasil, v. 7, n. 13, p. 196-215, 2015.
207
4.1.2 Motors Systems
Electric motors are key components in the industry and represent more than two-thirds
of electricity consumption in some countries (DLAMINI et al., 2012). The monitoring of this
dimension is aimed at verifying the representativeness of the drive system in relation to the
total consumption of the industry as well as verifying the technology adopted the system with
respect to the type of engine used (High Yield) and the type of actuator used. The following
topic was observed:
a) Regarding the amount and representativeness of engines in electricity consumption
– in the analyzed industry a large number of engines in the transformation process
of material is used, with the total of 3513 motors distributed throughout the
production process. In addition 350 used in the opening sector, 1388 in the carding
process, the loops 216, in 1559 spinning process and 215 are used in the process of
cooling the plant.
By owning a great share in electricity consumption, industry's drive system sets the
highest priority when it comes to reducing losses, so it was verified that the used engines are
high- performance, and that about 90 to 95 % of them use variable the drive frequency.
b) With respect to the drive – as indicated in the theoretical framework, the use of
variable frequency drives in driving the motors can bring a reduction in percentage
of 8 % of total consumption terms.
The industry has studied between 90 and 95% of the drives performed by variable
frequency drives (frequency converters). The remaining percentage was observed that there is
the case of the use of fans thermal storage system where there is no use of this type of drive
and its implementation would be feasible for large motors.
Thus, the change in the drive to better modulate the use of fans and implementation of
thermal storage system would be possible to generate a gain with respect to consumption. The
rules for using these fans are 24 hours a day. Modulation allows actuation of fans only during
the day (12 hours) and sporadic night drives, avoiding this wasteful form of energy to spin the
fan.
Hence, the opportunity for improvement in this aspect is obtained by the difference
between the current consumption in mill operation performed by the proposed 24-hour

Iberoamerican Journal of Industrial Engineering, Florianópolis, SC, Brasil, v. 7, n. 13, p. 196-215, 2015.
208
consumption to be half of the time corresponding to 12 hours of operation, namely (Equation
1):
– CR CC SC (1)
where:
CR = Consumption Reduction
CC = Current Consumption
CS = Simulated Consumption
Reducing consumption will be calculated taking into account the multiplication of four
factors: Motor power; operating hours per day, the average days worked in the month and
number of motors used. First, calculate the current consumption and then and only then the
proposed calculating the reduction in consumption is made.
Therefore,we have (Equation 2):
* / * *CC P h d D n (2)
where:
CC = Current consumption
P = Motor power
h/d = Hours by day of motor operation
D = Working days by month
n = Numbers of motors in operation
There are 11 motors with power of 60 hp (44.16 kW) with the factory working under 24
hours/day for an average of 30 days / month, thus the current consumption is 349.75 MWh.
The proposed system for room temperature control consumption is calculated using the same
formula, whereas the engine will only work 12 hours / day (Since the engine will fire only
when necessary through the use of variable frequency drives). Thus, the proposed 174.87
MWh consumption is obtained reducing the consumption of 50% of the use of fans, a
percentage corresponding to 2% of the total power consumption of the drive system.
4.1.3 Lighting
The monitoring of this dimension is aimed at verifying lamp technology adopted and
the physical characteristics of the manufacturing environment like colors of walls and ceiling.
Iberoamerican Journal of Industrial Engineering, Florianópolis, SC, Brasil, v. 7, n. 13, p. 196-215, 2015.
209
Study considering the use of fluorescent lamps is an efficient solution with 22.86% reduction
of electricity and low cost on initial investment.
4.1.4 General
After tracing the energy profile, opportunities to reduce losses were found. It’s are
presented in Table 1 in percentage terms for the proposed actions.
Table 1 – Percentage improvements of the proposed actions
Actions Opportunity Reduction of consumption of
individual system (%)
Energy
management
Implementation of the System Management 2%
Motors Systems Use of variable frequency motor drive fan and
a reduction in working time of this engine
2%
Lighting Systems Replacement of metal halide lamps with
compact fluorescent lamps
22.86%
Source: Own elaboration
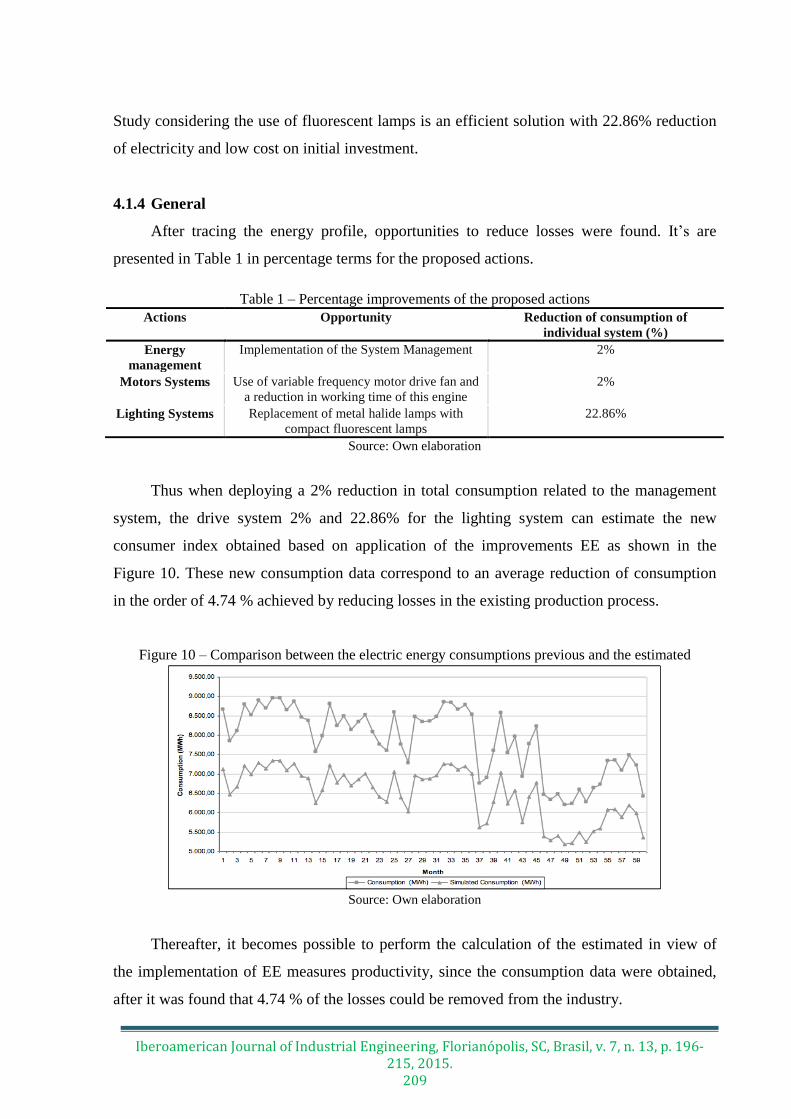
Thus when deploying a 2% reduction in total consumption related to the management
system, the drive system 2% and 22.86% for the lighting system can estimate the new
consumer index obtained based on application of the improvements EE as shown in the
Figure 10. These new consumption data correspond to an average reduction of consumption
in the order of 4.74 % achieved by reducing losses in the existing production process.
Figure 10 – Comparison between the electric energy consumptions previous and the estimated
Source: Own elaboration
Thereafter, it becomes possible to perform the calculation of the estimated in view of
the implementation of EE measures productivity, since the consumption data were obtained,
after it was found that 4.74 % of the losses could be removed from the industry.
Iberoamerican Journal of Industrial Engineering, Florianópolis, SC, Brasil, v. 7, n. 13, p. 196-215, 2015.
210
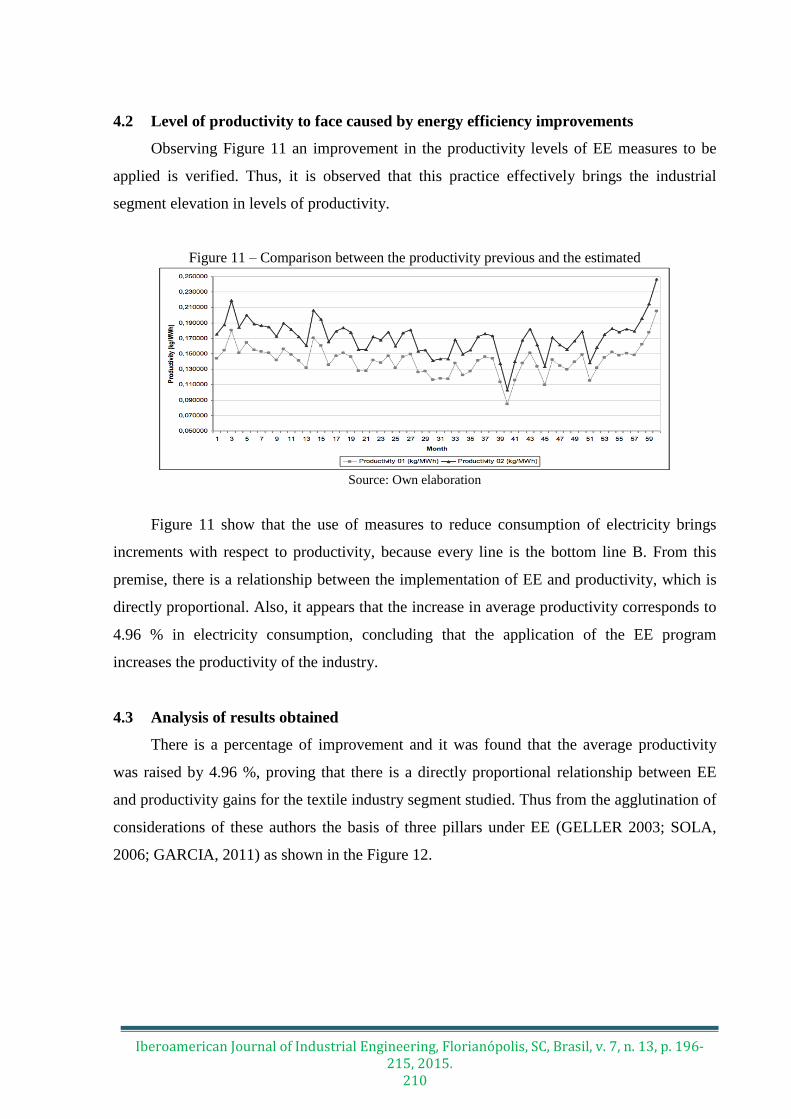
4.2 Level of productivity to face caused by energy efficiency improvements
Observing Figure 11 an improvement in the productivity levels of EE measures to be
applied is verified. Thus, it is observed that this practice effectively brings the industrial
segment elevation in levels of productivity.
Figure 11 – Comparison between the productivity previous and the estimated
Source: Own elaboration
Figure 11 show that the use of measures to reduce consumption of electricity brings
increments with respect to productivity, because every line is the bottom line B. From this
premise, there is a relationship between the implementation of EE and productivity, which is
directly proportional. Also, it appears that the increase in average productivity corresponds to
4.96 % in electricity consumption, concluding that the application of the EE program
increases the productivity of the industry.
4.3 Analysis of results obtained
There is a percentage of improvement and it was found that the average productivity
was raised by 4.96 %, proving that there is a directly proportional relationship between EE
and productivity gains for the textile industry segment studied. Thus from the agglutination of
considerations of these authors the basis of three pillars under EE (GELLER 2003; SOLA,
2006; GARCIA, 2011) as shown in the Figure 12.
Iberoamerican Journal of Industrial Engineering, Florianópolis, SC, Brasil, v. 7, n. 13, p. 196-215, 2015.
211
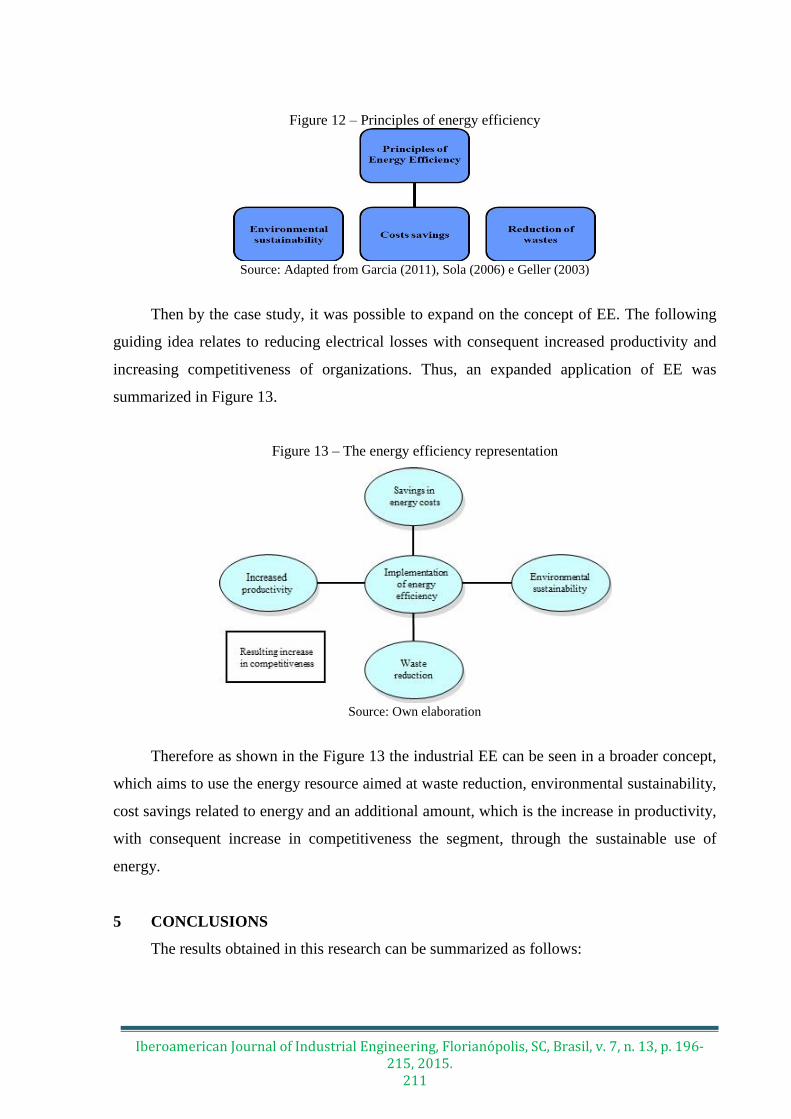
Figure 12 – Principles of energy efficiency
Source: Adapted from Garcia (2011), Sola (2006) e Geller (2003)
Then by the case study, it was possible to expand on the concept of EE. The following
guiding idea relates to reducing electrical losses with consequent increased productivity and
increasing competitiveness of organizations. Thus, an expanded application of EE was
summarized in Figure 13.
Figure 13 – The energy efficiency representation
Source: Own elaboration
Therefore as shown in the Figure 13 the industrial EE can be seen in a broader concept,
which aims to use the energy resource aimed at waste reduction, environmental sustainability,
cost savings related to energy and an additional amount, which is the increase in productivity,
with consequent increase in competitiveness the segment, through the sustainable use of
energy.
5 CONCLUSIONS
The results obtained in this research can be summarized as follows:
Iberoamerican Journal of Industrial Engineering, Florianópolis, SC, Brasil, v. 7, n. 13, p. 196-215, 2015.
212
After lifting the energy profile, through simulation indication of the potential for
improvement in the proposed dimensions, namely: a) Energy management: 2 %; b)
Drive system: 2 % and c) Lighting system: 22.86%.
It was then possible to find new content simulated productivity, where there was an
increase in this variable 4.74 % through the implementation of EE and impacted in
percentage productivity gains in the order of 4.96 %.
It can be concluded that when there is an increase in EE, there is an increase in
productivity in direct proportion, which impacts on increasing competitiveness.
It can be concluded that the methodology of calculation of productivity and
dimensions presented in this work can be applied in other industries, since the
calculation for the measurement of productivity is the relationship between
production and consumption of energy and the proposed dimensions exist in
virtually every type of industry , changing only the numeric value, company by
company .
It is possible to say that there is a directly proportional relationship between EE and
productivity. Therefore, the action of EE in the industrial sector increases
productivity by reducing losses.
It is recommended to future research the application of this study in other industries
segments such as high energy consumption such as steel, aluminium and cement.
PRODUTIVIDADE E EFICIÊNCIA ENERGÉTICA: ESTUDO DE CASO
EM INDÚSTRIA TÊXTIL NO BRASIL
RESUMO: O objetivo deste artigo é analisar o relacionamento entre a produtividade e a
eficiência energética sob o ponto de vista de perdas. Também e analisado a situação atual da
produtividade da indústria, identificando as perdas de energia existentes e prospectando um
potencial de melhoria para um novo nível como conseqüência da eficiência energética. A
pesquisa é um estudo de caso na indústria setor têxtil no Nordeste do Brasil. E foram
analisadas as seguintes variáveis de produção e eficiência energética: gestão de energia,
sistemas de energia, sistemas de iluminação e produtividade. Como conclusão é demonstrado
que existe uma relação direta entre as variáveis de produtividade e eficiência energética
devido a redução do consumo de energia de 4,74 % e um crescimento de 4.96 % na
produtividade.
Palavras-chave: Produtividade e Eficiência Energética. Indústria Têxtil. Perdas de Energia.
Iberoamerican Journal of Industrial Engineering, Florianópolis, SC, Brasil, v. 7, n. 13, p. 196-215, 2015.
213
REFERENCES
AMERICO, M. Engine systems: energy efficiency and techniques drive. Rio:
CEPEL/Sebrae, 2003.
BERNOLAK, I. Effective measurement and successful elements of company productivity:
The basis of competitiveness and world prosperity, International Journal of Production
Economics, v. 52, p. 203-13, 1997.
BERRY, S.; DAVIDSON, K.; SAMAN, W. Defining zero carbon and zero energy homes
from a performance-based regulatory perspective. Energy Efficiency, v. 7, n. 2, p 303-322,
2014.
CULLEN, J.; ALLWOOD, J.Theoretical efficiency limits for energy conversion devices,
Energy Review, v. 35, p. 2059-2069.
DLAMINI, V.; NAIDOO, R.; MANYAGE, M.A non-intrusive method for estimating motor
efficiency using vibration signature analysis. International Journal Electrical Power and
Energy Systems, v. 45, p. 384-390, 2013.
EANPC. European Association of National Productivity Centres. 2005. Available from:
<http://www.eanpc.eu/>. Acess in 2013.
GELLER, H.Energy revolution: policies for a sustainable future. Washington: Island Press,
2003.
GELLER, H.; SCHAEFFER, R.; SZKLO, A.; TOLMASQUIM, M. Policies for advancing
energy efficiency and renewable energy use in Brazil. Energy Policy, v. 32, p. 1437-1450,
2004.
INEE. National Institute of Energy Efficiency. The energy efficiency and the new model of
energetic sector. Rio de Janeiro, 2001.
ISO 50001:2011. Energy management systems: requirements with guidance for use, 2011.
KAPLAN, E.; KOÇ, ERDEM. Investigation of energy consumption in yarn production with
special Reference to open-end rotor spinning. Fibres & Textiles in Eastern Europe, v. 18, p.
7-13, 2010.
KHORSHIDI, Z.; SOLTANIEH, M.; SABOOHI, Y. ARABA, M. Economic feasibility of
CO2 capture from oxy-fuel power plants considering enhanced oil recovery revenues. Energy
Procedia, v. 4, p. 1886-1892, 2011.
KJÄRSTAD, J.; JOHNSSON, F. Resources and future supply of oil. Energy Policy, v. 37, p.
441-464, 2009.
CHANG, L.; WANG, X. Effect of yarn hairiness on energy consumption in rotating a ring-
spun yarn package.Textile research journal, v. 73, p. 949-954, 2003.

Iberoamerican Journal of Industrial Engineering, Florianópolis, SC, Brasil, v. 7, n. 13, p. 196-215, 2015.
214
MANAN, Z.; SHIUN, L.; ALWI, S.; HASHIN, H.; KANNAN K.; MOKHTAR, N.; ISMAIL,
A. Energy efficiency award system in Malaysia for energy sustainability. Renewable and
Sustainable Energy Reviews, v. 14, p. 2279-2289.
MARTINEZ, C.; SILVEIRA, S. Energy efficiency and CO2 emissions in Swedish
manufacturing industries.Energy Efficiency, v. 6, p. 117-133, 2013.
MELO, M.; CAMPELLO, S.; BUENO, L. Industry energy efficiency analysis in northeast
Brazil: proposal of methodology and case studies. International Journal of Industrial
Engineering: Theory, Applications and Practice, v. 19, n. 11, 2012.
MLECNICK, E. Defining nearly zero-energy housing in Belgium and the
NETHERLANDS. Energy Efficiency, v. 5, p 411-431, 2012.
MILLS, E. Building commissioning: a golden opportunity for reducing energy costs and
greenhouse gas emissions in the United States. Energy Efficiency, v. 4, p. 145-173, 2011.
MILLS, E.; JACOBSON, A. From Carbon to Light: A new framework for estimating
greenhouse gas emissions reductions from replacing fuel-based lighting with LED
systems. Energy Efficiency, v. 4, p. 523-546, 2011.
MORAES, T. A model to measurement of the productivity of maintenance staff of the
electric power substation. MSc dissertation in Engineering, Federal University of Paraiba,
Brazil, 2011.
MORROW, W.; GALLAGHER, K.; COLLANTES, G.; Lee, H. Analysis of policies to
reduce oil consumption and greenhouse-gas emissions from the US transportation sector.
Energy Policy, v. 38, p. 1305-1320, 2010.
MOSENG, B.; ROLSTADÅS, A. Success factors in the productivity process. 10th World
Productivity Congress, 2001. Available from:
<www.catriona.napier.ac.uk/resource/wpc10th/moseng.htm. Acess in 2014.
OIKONOMOU V.; BECCHIS F.; STEG L.; RUSSOLILLO, D. Energy saving and energy
efficiency concepts for policy making. Energy Policy, v. 37, p. 4787-4796, 2009.
PEKURI, A.; HAAPASALO, H.; HERRALA, M. Productivity and performance
management–managerial practices in the Construction Industry. International Journal of
Performance Measurement, v. 1, p. 39-58, 2011.
RAUX, C. The potential for CO2 Emissions trading in transport: the case of personal
vehicles and freight. Energy Efficiency, v. 3, p. 133-148, 2010.
RAUX, C.; LEE-GOSSELIN, MARTIN E.H. Transport, energy and greenhouse gases:
perspectives on demand limitation. Guest editorial. Energy Efficiency, v. 3, p. 111-113,
2010.
REIS, L.; CUNHA, E. Electric energy and sustainability. Barueri: Manole, 2006.
ROSENOW, J. The politics of the German CO2-building rehabilitation programme.
Energy Efficiency, v. 6, p. 219-238, 2013.
Iberoamerican Journal of Industrial Engineering, Florianópolis, SC, Brasil, v. 7, n. 13, p. 196-215, 2015.
215
SANDS, R.; SCHUMACHER, K. Economic comparison of greenhouse gas mitigation
options in Germany. Energy Efficiency, v. 2, p. 17-36, 2009.
SARKAR, A.; SINGH, J. Financing energy efficiency in developing countries: lessons
learned and remaining challenges, Energy Policy, v. 38, p. 5560-5571, 2010.
SIITONEN, S.; TUOMAALA, M.; SUOMINEN, M.; AHTILA, P. Implications of process
energy efficiency improvements for primary energy consumption and CO2emissions at the
national level. Applied Energy, v. 87, p. 2928-2937, 2010.
SILVA, R. A model for sustainability analysis of power supplies. PhD Thesis in
administration. Federal University of Pernambuco, Brazil, 2011.
TANGEN, S. Demystifying Productivity and Performance. International Journal of
Productivity and Performance Management, v. 54, p. 34-46, 2005.
TESKE, S.; PREGGER, T.; SIMON, S.; NAEGLER, T.; GRAUS, W.; LINS, C. Energy
[R]evolution 2010: a sustainable world energy outlook. Energy Efficiency, v. 4, p. 409-433,
2011.
ÜRGE-VORSATZ. D.; NOVIKOVA, A.; KÖPPEL, S. Bottom-up assessment of potentials
and costs of CO2 emission mitigation in the buildings sector: insights into the missing
elements. Energy Efficiency, v. 2, p. 293-316, 2009.
VENDRUSCULO, E.; QUEIROZ, G. Life cycle cost analysis of energy efficiency design
options for refrigerators in Brazil. Energy Efficiency, v. 2, p. 271-286, 2009.
Originais recebidos em: 15/02/2015
Aceito para publicação em: 06/09/2015