PRODUCTIVITY AND EFFICIENCY OF CORPORATE AND INDIVIDUAL...
26
1 PRODUCTIVITY AND EFFICIENCY OF CORPORATE AND INDIVIDUAL FARMS IN UKRAINE Zvi Lerman Department of Agricultural Economics and Management, The Hebrew University of Jerusalem, Israel [email protected] David J. Sedik Regional Office for Europe and Central Asia, Food and Agriculture Organization of the UN, Rome, Italy [email protected] Selected Paper prepared for presentation at the American Agricultural Economics Association Annual Meeting, Portland, OR, July 29-August 1, 2007 Copyright 2007 by Zvi Lerman and David J. Sedik. All rights reserved. Readers may make verbatim copies of this document for non-commercial purposes by any means, provided that this copyright notice appears on all such copies.
-
Upload
nguyenkhuong -
Category
Documents
-
view
216 -
download
1
Transcript of PRODUCTIVITY AND EFFICIENCY OF CORPORATE AND INDIVIDUAL...
1
PRODUCTIVITY AND EFFICIENCY OF CORPORATE AND
INDIVIDUAL FARMS IN UKRAINE
Zvi Lerman
Department of Agricultural Economics and Management,
The Hebrew University of Jerusalem, Israel
David J. Sedik
Regional Office for Europe and Central Asia,
Food and Agriculture Organization of the UN, Rome, Italy
Selected Paper prepared for presentation at the American Agricultural Economics Association
Annual Meeting, Portland, OR, July 29-August 1, 2007
Copyright 2007 by Zvi Lerman and David J. Sedik. All rights reserved. Readers may make
verbatim copies of this document for non-commercial purposes by any means, provided that this
copyright notice appears on all such copies.
2
PRODUCTIVITY AND EFFICIENCY OF CORPORATE AND
INDIVIDUAL FARMS IN UKRAINE
Zvi Lerman and David J. Sedik
Abstract
The paper presents a comparative analysis of the productivity of corporate and individual
farms in Ukraine based primarily on cross-section data from a farm survey conducted by FAO in
2005. We calculate partial land and labor productivity, total factor productivity, and technical
efficiency scores (using Stochastic Frontier Analysis) for farms of different organizational forms.
Our results demonstrate with considerable confidence that, contrary to established convictions
among the Ukrainian decision makers, the large corporate farms are not more productive than the
smaller family farms. This finding is not restricted to Ukraine, as a similar result has been
obtained by in Moldova, Russia, and the U.S. Policies encouraging a shift from large corporate
farms to smaller individual farms, rather than the reverse, can be expected to produce beneficial
results for Ukrainian agriculture and the economy in general. The government of Ukraine should
abandon its inherited preference for large-scale corporate farms and concentrate on policies to
improve the operating conditions for small individual farms. At the very least, the government
should ensure a level playing field for farms of all sizes and organizational forms, and desist
from biasing its policies in favor of large farms.
Keywords: family farms, corporate farms, comparative performance, technical efficiency, total
factor productivity, agrarian reforms, transition countries.
JEL classification: D24, J24, P27, P31, P32, Q12, Q15, R14

3
Introduction
One of the items on the agricultural reform agenda in former Soviet republics forming the
Commonwealth of Independent States (CIS) involves transformation from the traditional
corporate farms to substantially smaller family or individual farms. This transformation is
motivated by the theoretical incentive analysis of farms of different organizational forms in
market economies, which suggests that family farms can be expected to achieve higher levels of
productivity and efficiency than corporate farms (Allen and Lueck 2002). Although Ukraine
embarked on a course of transition to a market economy back in 1991, the first decade was
largely characterized by political indecision and lacked clear strategic focus (Lerman and Csaki
2000). Agricultural land was privatized, but only in the form of paper certificates of ownership,
without actual distribution of physical plots to rural families. It is only in 2000 that sufficient
political resolve was mustered to initiate sweeping conversion of these paper certificates into
physical plots. As a result the share of agricultural land in individual use increased dramatically
from about 15% in the late 1990s to 45% in 2005.
Despite the impressive progress with family farming, the large corporate farms – a
carryover from the Soviet era – still control more than half the agricultural land in Ukraine.
Comparison of farm structure in Ukraine and in typical market economies shows that Ukraine is
characterized by much greater land concentration in large corporate farms than the United States
or any of the EU-15 countries. The Soviet agricultural ideology, which was driven, among other
factors, by expectations of economies of scale, is still deeply implanted in the minds of all
agricultural decision makers, regardless of their declared dedication to market economy
principles. This ideology accounts for the widespread bias in favor of corporate farms and the
emphasis on so-called “horizontal transformation”, which aspires to make persistently inefficient
4
corporate farms suddenly efficient. Yet the experience of the last 15 years in all former Soviet
republics shows conclusively that the attempts to preserve the large-scale corporate structures
(whether as agricultural cooperatives or as new corporations with market-sounding names) have
not produced any positive results. On the contrary, it is the three small countries that resolutely
abandoned the large-scale corporate structures and made a clean shift to small-scale individual
agriculture – Armenia, Georgia, and Azerbaijan – that demonstrate the most impressive recovery
record among the CIS countries in recent years (Lerman 2004). Ukraine itself is beginning to
show signs of agricultural recovery in response to the changes in farm structure since 2000.
This paper attempts to inform the ongoing policy debate between the supporters of large
corporate farms and the supporters of smaller family farms in CIS. The paper presents a
comparative analysis of the productivity of corporate and individual farms in Ukraine based
primarily on cross-section data from a survey of 1,400 respondents conducted in 2005 by the
United Nations Food and Agriculture Organization (FAO) with local support. We calculate
partial land and labor productivity, total factor productivity (based on both accounting data and
the production function approach), and technical efficiency scores (using a Stochastic Frontier
algorithm) for farms of two main organizational forms: large corporate farms and relatively
small family farms.
Our results unfortunately do not demonstrate clear-cut performance differences between
corporate and individual farms, in part because in some analyses the individual sector is
represented only by peasant farms, whereas household plots – the main component of the
individual sector – are excluded due to missing data. Yet our results do demonstrate with
considerable confidence that, contrary to established convictions among the Ukrainian decision
makers, the large corporate farms are not more productive than the smaller family farms.
5
Moreover, the very small household plots – a major component of the individual farm sector –
are resoundingly more productive than the large corporate farms. These findings for Ukraine are
consistent with recent results for Moldova (Lerman and Sutton, 2006), Russia (Brock et al.,
2007), and the United States (Ahearn et al., 2002), all of which demonstrate that large corporate
farms do not perform better than small family farms. We do not observe economies of size
among Ukrainian farms, just as we do not observed economies of size for farms in other CIS
countries and in the United States.
Changing Farm Structure in Ukraine
The collective and state farms that dominated Ukraine‟s farm sector for decades during
the Soviet era were notoriously inefficient (Lerman et al. 2004). The need for the reorganization
of the traditional “farm enterprises” in the interest of improved productivity was recognized long
before Ukraine became independent, and the country began the process of agrarian reform in
March 1991, six months prior to the declaration of independence from the Soviet Union. The
first Land Code of independent Ukraine passed in March 1992 included provisions for
privatization of state land, abolishing exclusive state ownership, and the mechanisms for the
division of the privatized land into individual land shares were finalized by presidential decree in
August 1995.
Share-based privatization (similar to that in Russia) did not actually allocate land use
rights to individuals. Rural residents received paper certificates of landownership (“land
shares”), without physically getting a plot of land, and certificate holders were allowed to
convert the land share into a private plot when leaving the former collective. By December 1999
more than 6 million rural residents had received paper certificates confirming their entitlement to
a plot of land of a specified size (4.2 hectares on average) but in an unspecified location. The
6
non-land assets (farm machinery, buildings, livestock) had been divided into value-based paper
shares. The collective (now transformed into a corporate farm) was no longer a closed entity, as
it had been during the Soviet era, and individuals were entitled to leave the collective taking their
shares of land and assets with them. Yet very few corporate farms distributed land and assets in
kind to the shareowners and few farm employees left the large farms for independent farming.
The land and asset shares typically remained locked in collective ownership and use.
Share privatization did not encourage large farms to change their mode of operation by
reducing costs (share privatization often resulted in only “changing the sign on the door”), nor
did it eliminate the soft budget constraints implicit in government policies toward the large
farms. Most importantly, perhaps, it did not resolve the barriers to exit from large corporate
farms. Neither farm directors nor shareowners generally supported allowing other members to
leave the farm. Many details of the exit procedure (allocation of land and asset shares, the
methodology of identification of concrete plots of land and division of large farm assets) were
worked out only years after the initial decrees authorizing farm exit. The relatively unfavorable
conditions for individual farmers in matters of access to capital, inputs, and markets compared to
agricultural enterprises dissuaded many from exiting the corporate farms.
For these reasons, the first-wave reforms implemented throughout the 1990s failed to
produce the expected improvements in agricultural productivity and efficiency, and the second
phase of agricultural reforms was launched by President Leonid Kuchma in December 1999
(Decree 1999). The 1999 presidential decree essentially forced the conversion of the share
certificates into physical land plots, which could then be withdrawn by a simplified procedure
and used to establish a new individual farm or to enlarge an existing household plot. Corporate
7
farms could continue to use the privatized land only if they signed a formal lease contract with
the landowners.
The second-wave land reform achieved some very important results for rural residents.
First, nearly 7 million rural residents became owners of physical land plots (4.2 hectares on
average), not just paper shares. About 70% of agricultural land, or 80% of arable land, is now
physically owned by rural individuals. Ukraine evolved from exclusive state ownership of land
in 1990 to a mix of state and collective ownership in 1993-95 and finally to a mix of state and
private land ownership in 2000-05. The land ownership structure seems to have stabilized since
2000 with roughly one-half remaining in state ownership and one-half transferred to private
ownership.
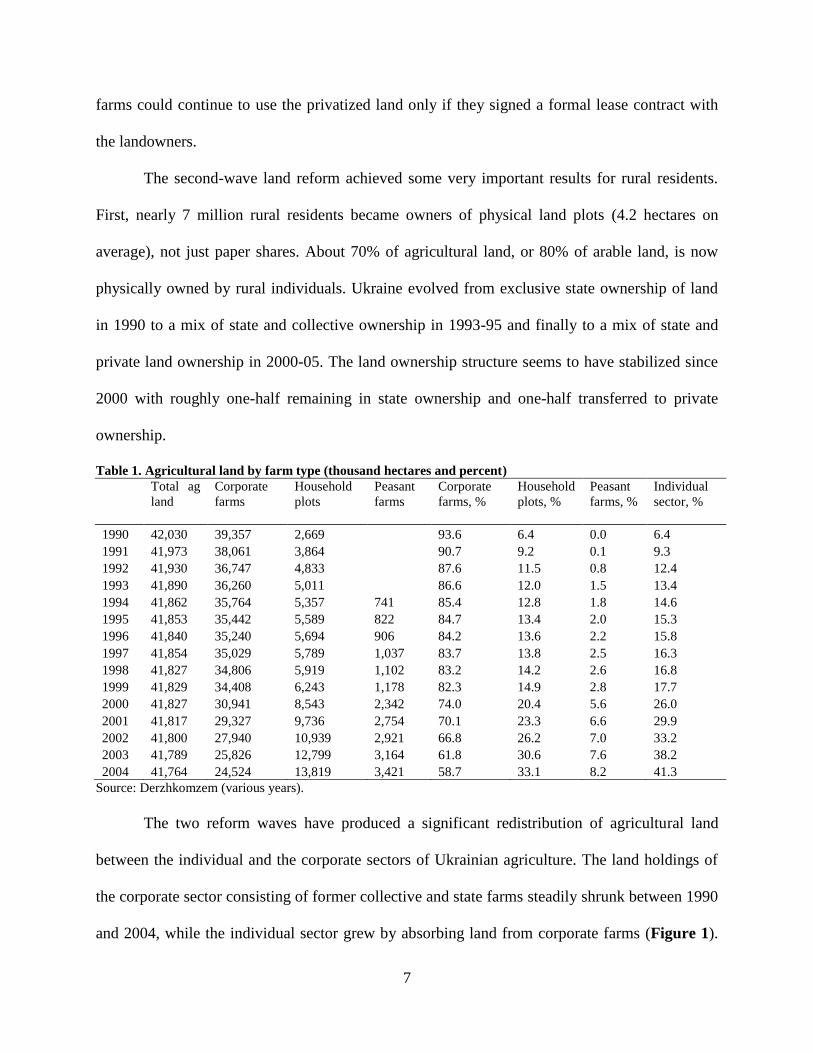
Table 1. Agricultural land by farm type (thousand hectares and percent)
Total ag
land
Corporate
farms
Household
plots
Peasant
farms
Corporate
farms, %
Household
plots, %
Peasant
farms, %
Individual
sector, %
1990 42,030 39,357 2,669 93.6 6.4 0.0 6.4
1991 41,973 38,061 3,864 90.7 9.2 0.1 9.3
1992 41,930 36,747 4,833 87.6 11.5 0.8 12.4
1993 41,890 36,260 5,011 86.6 12.0 1.5 13.4
1994 41,862 35,764 5,357 741 85.4 12.8 1.8 14.6
1995 41,853 35,442 5,589 822 84.7 13.4 2.0 15.3
1996 41,840 35,240 5,694 906 84.2 13.6 2.2 15.8
1997 41,854 35,029 5,789 1,037 83.7 13.8 2.5 16.3
1998 41,827 34,806 5,919 1,102 83.2 14.2 2.6 16.8
1999 41,829 34,408 6,243 1,178 82.3 14.9 2.8 17.7
2000 41,827 30,941 8,543 2,342 74.0 20.4 5.6 26.0
2001 41,817 29,327 9,736 2,754 70.1 23.3 6.6 29.9
2002 41,800 27,940 10,939 2,921 66.8 26.2 7.0 33.2
2003 41,789 25,826 12,799 3,164 61.8 30.6 7.6 38.2
2004 41,764 24,524 13,819 3,421 58.7 33.1 8.2 41.3
Source: Derzhkomzem (various years).
The two reform waves have produced a significant redistribution of agricultural land
between the individual and the corporate sectors of Ukrainian agriculture. The land holdings of
the corporate sector consisting of former collective and state farms steadily shrunk between 1990
and 2004, while the individual sector grew by absorbing land from corporate farms (Figure 1).

8
The transfer of agricultural land from corporate to individual farms accelerated markedly in
1999. Thus, the share of the individual sector (household plots and peasant farms combined) in
agricultural land use increased from 6% in 1990 to 17% in 1998 and then soared to 41% in 2004
(Table 1). The share of corporate farms decreased correspondingly from 94% of agricultural
land use in 1990 to 59% in 2004. The increased share of individual farms in land use is reflected
in increased holdings because the total agricultural land in Ukraine has remained constant at 42
million hectares.
Figure 1. Agricultural land (top panel) and gross agricultural product in constant prices (bottom panel) by farm type
in Ukraine, 1990-2004. Source: AgUkraine 2006.
The 1999 decree has dramatically changed the face of Ukrainian agriculture (Figure 1).
From agriculture with predominant concentration of production in collective farms it has evolved
1990 1992 1994 1996 1998 2000 2002 20040
10
20
30
40
50million ha
Corporate
Households
Peasant farms
1990 1992 1994 1996 1998 2000 2002 20040
20
40
60
80
100
120million hrivny (2000 prices)
Corporate
Households
Peasant farms
9
into agriculture characterized by the clear dominance of individual farms. The individual sector
(consisting of the traditional household plots and the independent peasant farms that began to
emerge after 1992) controls today more than 40% of agricultural land, contributing 70% of
agricultural output. Within the individual sector, the main contribution to agricultural production
is from household plots, not peasant farms, as they also control much more land (33% versus
8%).
Ukrainian farms today can be classified into two broad organizational categories:
individual farms and corporate farms (the latter are often called “agricultural enterprises”). The
individual sector is subdivided into household plots and peasant farms. These are typical family
farms and the main difference between them is one of size and commercial orientation.
Household plots are generally smaller and more subsistence-oriented than peasant farms, but
they sell their surplus products and thus augment the family income with sales revenue.
Individual farms operate mainly on family-owned land, although growth is achieved by leasing
additional land from other owners. The corporate sector consists of relatively large farms that
have replaced the traditional collective and state farms in the process of reform since 1992. They
are organized as private corporations with two or more shareholders (some farms have as many
as 1,600 shareholders according to the 2005 FAO survey) that operate mainly on leased land and
have strong commercial orientation.
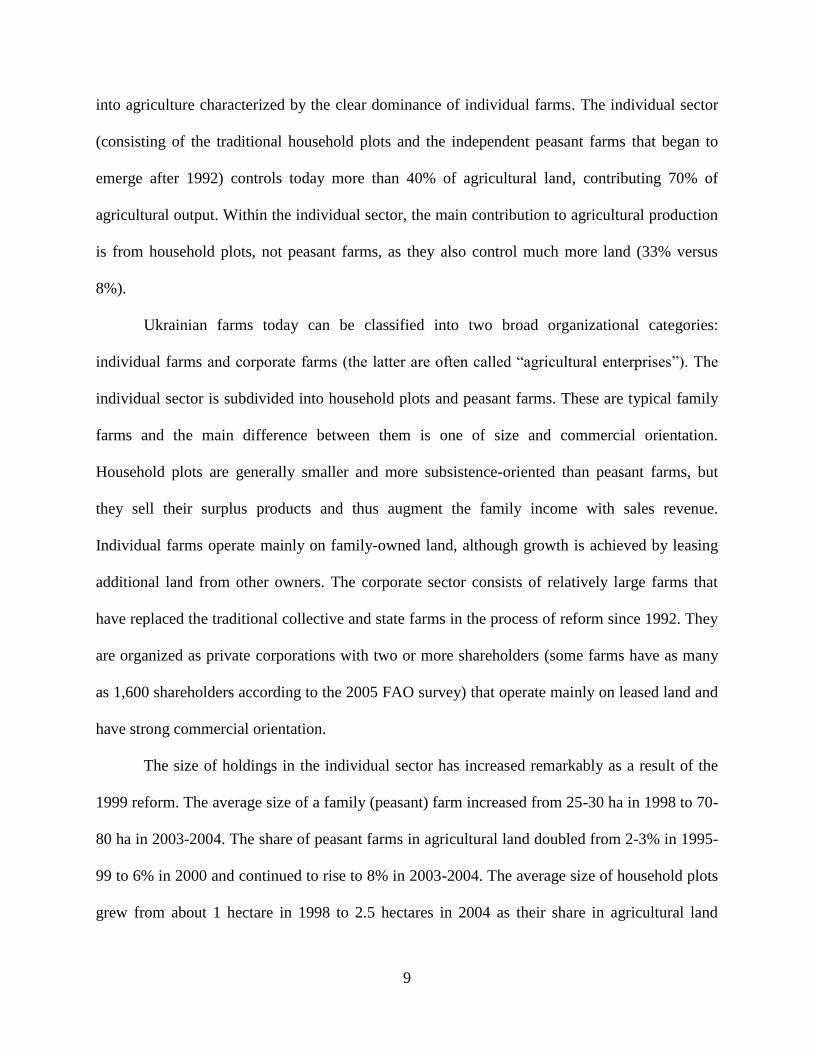
The size of holdings in the individual sector has increased remarkably as a result of the
1999 reform. The average size of a family (peasant) farm increased from 25-30 ha in 1998 to 70-
80 ha in 2003-2004. The share of peasant farms in agricultural land doubled from 2-3% in 1995-
99 to 6% in 2000 and continued to rise to 8% in 2003-2004. The average size of household plots
grew from about 1 hectare in 1998 to 2.5 hectares in 2004 as their share in agricultural land

10
increased from 15% to 35%. The substantial increase in total land cultivated in household plots
and their average size since 2000 is the direct outcome of the 1999 Presidential Decree, which
made it possible for many rural residents to take their land share out of the former collective and
use it to augment the traditional household plot (instead of establishing a peasant farm, as
originally envisaged).
The increase of landholding in the individual sector has been complemented by a
decrease in the landholding in corporate farms as well as an increase in the number of corporate
farms. The average size of a corporate farm in Ukraine has fallen from 3,000 ha in 1990 to 2,000
ha in 1998 to 1,000 ha in 2004. Corporate farms are now mainly represented by limited liability
companies and private lease enterprises (the latter accounting for almost 25% of the total number
of corporate farms in Ukraine). While the number of shareholders in corporate farms ranges from
1 to 1,600, fully 16% are single-shareholder entities and 31% have from 1 to 3 shareholders only.
Despite these changes, there remain important differences in the size distribution of farms
in Ukraine and in market economies. First, the average size a household farm in Ukraine (2.5
hectares) is much smaller than the average family farm in market economies (130 hectares in
land-rich United States, 20 hectares in EU-15). Second, the average size of a corporate farm in
Ukraine (around 1000 ha) is still quite a bit larger than the average size of farms in the EU and
the United States. Even non-family corporate farms in land rich United States (about 0.3% of
farms using 1.0% of land in farms) are on average only 533 ha in size (USDA/NASS 2004).
Though there has been an impressive fall in the average size of corporate farms in Ukraine
particularly since 1999, there is still some way to go before the size of Ukrainian corporate farms
becomes consistent with farm sizes in market economies. As a result of these differences, the
concentration of land use in Ukraine continues to deviate substantially from that in established

11
market economies: it is still characterized by Soviet-era duality, with a large number of very
small farms controlling a minute proportion of agricultural land and a very small number of large
farms controlling a disproportionately large land area.
Farm Productivity: Prior Hypotheses
Productivity is the output produced per unit of resource used, and it is accordingly a
measure of the efficiency with which producers use available resources. Productivity measures
are at the core of the discussion of the impact of reforms in transition countries, as efficiency
improvement was the main motivation for the shift from the centrally controlled socialist
economy to the market economy. The main manifestation of market reforms in Ukraine and
other CIS countries involves a shift from traditional corporate farms to new individual farms, and
the study accordingly focuses on a comparison of productivity measures for corporate and
individual farms.
We distinguish between partial productivity measures, when output is measured in
relation to a single input (land, labor, machines) and total factor productivity (TFP), when output
is measured in relation to a whole bundle of inputs used. In partial productivity measures the
resource inputs are typically in physical units (hectares of land, number of workers, number of
tractors or harvesters), whereas in TFP the different inputs are aggregated into a single bundle in
money units. Aggregate output (the sum total of commodities produced) is expressed in units of
value (although in some partial productivity calculations the specific commodity outputs may be
expressed in physical units).
In addition to partial and total factor productivity, technical efficiency is often used to
evaluate farm performance. Technical efficiency (TE) essentially measures the distance of a
particular farm from the production frontier (the locus of points that represent the maximum

12
attainable output for a given basket of inputs or, conversely, the minimum basket of inputs
required to attain a given output).
Our prior hypotheses regarding productivity and technical efficiency measures used in
this study are suggested by the available literature and theory. For partial productivity measures,
our prior hypothesis is that individual farms (household plots and peasant farms combined)
achieve higher productivity of land and lower productivity of labor than corporate farms. Higher
productivity of land is usually attributed to greater incentives in the individual form of
organization, while lower productivity of labor is associated with the tendency of individual
farms to absorb labor (the “labor sink” effect of individual farms, see Lerman and
Schreinemachers (2005)). The potential ambiguity in performance ranking by partial
productivity measures is expected to be resolved by TFP. Our prior hypothesis for total factor
productivity is that individual farms achieve higher TFP than corporate farms, primarily due to
differences in incentives between the two forms of farm organization. For technical efficiency
our prior hypothesis is again that individual farms achieve higher TE scores that corporate farms
for the same reasons.
The various productivity measures and technical efficiency scores of corporate and
individual farms in Ukraine are calculated using cross-section data from a survey of corporate
and individual farms conducted in 2005 by FAO in cooperation with local counterparts (the 2005
FAO survey).
Partial Productivity of Land and Labor
We calculate the partial productivity measures as value of output per hectare of land
(partial productivity of agricultural land) and value of output per worker (partial productivity of

13
agricultural labor).1 In accordance with our prior hypothesis, we expect the three organizational
forms to be ranked by output per hectare in the order household plots > peasant farms >
corporate farms. The actual results for the productivity of land in farms of different types are
presented in Table 2. Household plots outperform both peasant farms and corporate farms by
partial productivity of land (parametric t-test for means, nonparametric Wilcoxon test for
medians). The differences between corporate farms and peasant farms are not statistically
significant (both tests). The survey thus produces the ranking household plots > peasant farms ≈
corporate farms by partial productivity of land.
Table 2. Partial productivity of land and labor in farms of different types
Land productivity,
„000 hrivny/ha
Labor productivity,
„000 hrivny/worker
Mean Median Mean Median
Corporate farms 4.4 0.9 17.4 12.5
Peasant farms 4.8 1.0 11.7 5.9
Household plots 11.8 5.0 -- --
All sample farms 8.8 2.3 14.0 8.1
Partial productivity of agricultural labor was calculated only for corporate and peasant
farms, as the number of farm workers could not be reliably estimated for household plots. While
the productivity of land is comparable for corporate and peasant farms, the productivity of labor
(Table 2) is significantly higher for corporate farms (as expected). This is consistent with the
“labor sink” effect of individual farms: in Ukraine peasant farms surveyed employ nearly 30
workers per 100 hectares compared with less than 20 workers per 100 hectares in corporate
farms.
1 Partial productivity of land was also calculated in terms of crop yields in physical units (kg per hectare). Because
of the large number of commodities involved (16 different crops), the comparison results for farms of different
forms are not clear-cut, but judging overall (“by majority”) household plots are doing better than either corporate or
peasant farms. On the other hand, corporate and peasant farms overall achieve comparable crop yields. Milk yields –
a partial productivity measure for livestock – are lower for corporate farms than for individual farms (2,600 kg per
cow per year compared with 3,750 kg per cow per year), but there are no statistically significant differences between
the two components of the individual sector (household plots and peasant farms).

14
The partial productivity of land decreases with farm size (Table 3). The decrease is
particularly strong for the small household plots and levels out for the larger peasant farms and
corporate farms. Yet for these larger farms also the size coefficient is negative and statistically
significant. Thus, in a regression framework, large farms have significantly lower land
productivity than smaller farms even when the comparison excludes household plots and is
restricted to peasant farms and corporate farms only. The partial productivity of labor, on the
other hand, increases with farm size, rising significantly from the smaller peasant farms to the
larger corporate farms (no labor data for household plots).
Table 3. Regression coefficients for land productivity and labor productivity versus farm size
All three farms types Household plots only Peasant and corporate
farms
Land productivity −0.292 −0.508 −0.092
Labor productivity -- -- +0.265
Note: All coefficients statistically significant at p < 0.01.
Figure 2 shows the output per hectare as a function of size for all three farm types. It
visually demonstrates the results of Table 2, where household plots > peasant farms ≈ corporate
farms. On average household plots have higher land productivity than peasant and corporate
farms, but the regression results in Table 3 show that land productivity decreases with size also
in the subsample of peasant and corporate farms (the relatively flat right-hand tail of the
scattergram in Figure 2).

15
Figure 2. Output per hectare as a function of farm size (in logged variables). Source: 2005 FAO survey.
Total Factor Productivity (TFP)
The two partial productivity measures for land and labor do not give a consistent picture:
individual farms have a higher productivity of land and a lower productivity of labor. This
ambiguity can be resolved by switching from partial productivity measures (each calculated for a
single input) to total factor productivity (TFP), which is calculated as the ratio of the aggregated
value of output to the aggregated cost of input use. The theoretical formula for the aggregated
cost of input use calls for multiplying the quantity of each input by its market price and summing
all the input cost components. This is a truly formidable undertaking in most cases, and a naïve
method equates input costs to production costs as reported in the farm‟s financial statements. The
ratio of sales to costs is a TFP proxy that provides a strictly accounting measure of productivity
and is in fact equivalent to profit margin.
The well-known accounting valuation biases can be avoided even in the absence of
market prices for valuing the cost of inputs (such as the price of land). A theoretically more
16
sound approach is to determine TFP by estimating a production function and then using the
estimated input coefficients as the weights to calculate the value of the bundle of inputs. The
ratio of the observed output to the estimated bundle of inputs is the TFP. This measure does not
use accounting data and does not require knowledge of market prices.
In principle, the production function should be estimated for all the relevant inputs. In
farm surveys, however, the proliferation of missing values dramatically reduces the number of
valid cases that can be used for estimation as the number of inputs is increased. The problem is
especially acute because the standard Cobb-Douglas production function is estimated in
logarithms, which are undefined whenever the corresponding input is zero. In total, there are 518
observations of corporate and peasant farms in the survey database. Of these 507 observations
have valid data on agricultural land and agricultural labor, but only 399 cases have data for the
value of production – the dependent variable in production function estimation. This maximum
number of observations (399) is actually available for estimating two-input production functions
with land and labor as the only inputs. However, the number of valid observations is reduced
from 399 to 371 if in addition to land and labor we also include farm machinery, to 302 if we add
fertilizers to the list of inputs, and to 283 if both fertilizers and diesel fuel are included. Thus,
with merely 5 inputs – land, labor, machinery, fertilizer, and diesel fuel – we lose 30% of the
potential number of observations (399). Data shrinkage is even more dramatic if we include the
number of animals as an input: production function estimation using land, labor, farm machinery
and animals is based on as few as 207 observations.
In the general economic literature, TFP is typically calculated assuming two inputs:
capital and labor (see, e.g., Jones, 1998, pp. 41-42). We have decided to follow a modification of
the same approach from considerations of data availability and reliability. In our estimations
17
labor is taken as the physical number of agricultural workers reported in the survey (in
preferences to salaries) while capital is proxied by two physical variables: agricultural land (in
hectares) and the aggregated number of pieces of farm machinery (in preference to the highly
uncertain balance sheet value of machinery). The livestock herd was excluded from the capital
component because of the large number of farms without animals. We thus estimated the
production function with three inputs: labor, land, and farm machinery. A separate estimation
was additionally carried out for the subgroup of farms with animals. The physical variables were
judged to be much more reliable and consistent than the accounting figures reported for other
factors of production, such as the cost of purchased inputs and the value of fixed assets
(especially for individual farms).
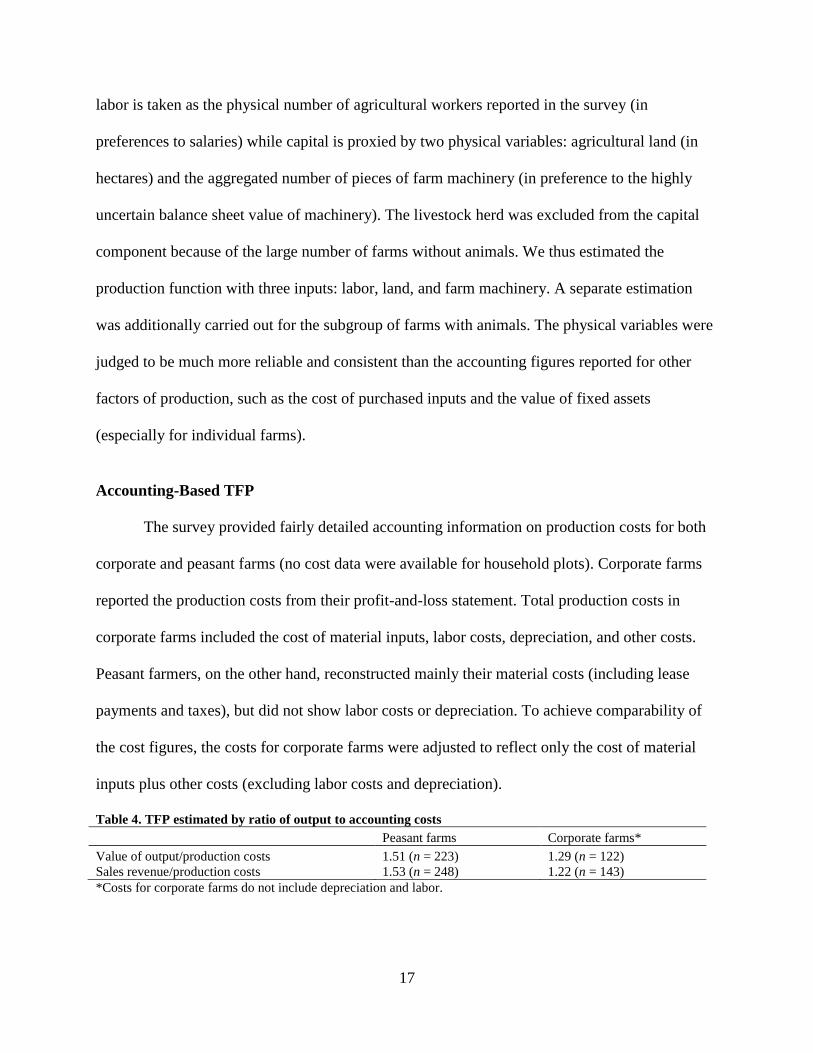
Accounting-Based TFP
The survey provided fairly detailed accounting information on production costs for both
corporate and peasant farms (no cost data were available for household plots). Corporate farms
reported the production costs from their profit-and-loss statement. Total production costs in
corporate farms included the cost of material inputs, labor costs, depreciation, and other costs.
Peasant farmers, on the other hand, reconstructed mainly their material costs (including lease
payments and taxes), but did not show labor costs or depreciation. To achieve comparability of
the cost figures, the costs for corporate farms were adjusted to reflect only the cost of material
inputs plus other costs (excluding labor costs and depreciation).
Table 4. TFP estimated by ratio of output to accounting costs
Peasant farms Corporate farms*
Value of output/production costs 1.51 (n = 223) 1.29 (n = 122)
Sales revenue/production costs 1.53 (n = 248) 1.22 (n = 143)
*Costs for corporate farms do not include depreciation and labor.

18
Table 4 presents the accounting-based TFP proxies calculated using these costs and two
output variables: the value of production and the sales revenue. The results are weighted
averages, obtained by taking the ratio of the sum total of outputs to sum total of input costs in the
entire sample (the number of observations for each sum is shown in parentheses). The
accounting TFP is somewhat higher for peasant farms than for corporate farms. There is no way
to decide if the difference is significant, because weighted averages do not lend themselves to
statistical significance testing.2
Production Function Approach: TFP by Dummy Variable Estimation
Differences in TFP between categories of farms can be captured by estimating
appropriate production functions with a dummy variable for different farm types. If the dummy
coefficient for type A farms is found to be greater than for type B farms, this implies that type A
farms produce a greater value of output at any given bundle of inputs and essentially means that
type A farms have higher TFP than type B farms. This procedure enables us to assess differences
in TFP without actually calculating the TFP in absolute values.
Table 5. Estimation of Cobb-Douglas production function for corporate and peasant farms
Dependent variable: value of output („000 hrivny, logged) Model 1: labor, land,
machinery*
Model 2: labor, land,
machinery, animals**
Explanatory variables:
Labor (workers, logged) 0.542 0.548
Land (ha, logged) 0.512 0.367
Farm machinery (pieces, logged) 0.175 0.067
Livestock (standard head, logged) -- 0.187
Farm type (dummy): corporate relative to peasant farms −0.249 −0.318
R2 0.815 0.848
Number of observations 371 207
* All coefficients significant at p = 0.05. Farm dummy marginally significant with p = 0.18.
** Labor, land, and livestock significant at p = 0.05; farm machinery (p = 0.54) and farm type (p = 0.24) not
significant.
2 Accounting-based TFP measures have been previously calculated in several studies for other transition countries.
For a calculation of TFP as the ratio of output to the reported cost of inputs see Dudwick et al. (2005).

19
A three-input Cobb-Douglas production function, relating the aggregated value of output
to agricultural land, agricultural labor, and the number of farm machinery, was estimated on 371
observations from the survey dataset classified into corporate and peasant farms (Table 5, Model
1). Another model (Model 2) was estimated with the number of animals also included in the
capital component, but at the cost of using a much smaller sample of observations (207 farms
with a nonzero herd). In both models the dummy variable differentiated between corporate and
peasant farms, as household plots could not be included due to missing data for labor and other
inputs.
In the three-input production function (Model 1), labor, land, and farm machinery have a
highly significant positive impact on the value of production. In the four-input production
function with livestock (Model 2), land and labor remain highly significant, but livestock takes
over from farm machinery as the third significant factor of production in farms that have
animals. The farm type dummy has a negative coefficient in both models (and in models with
many other combinations of inputs that we have tried). This coefficient is only marginally
significant (at p = 0.20) in Model 1 and not statistically significant by any acceptable measure in
Model 2. Nevertheless, its consistently negative sign provides an indication that, for every given
bundle of inputs, corporate farms achieve a lower value of output than peasant farms.3 However,
even without drawing this (statistically weak) conclusion in favor of the performance of peasant
farms, we can definitely say that the results do not support the inherited socialist conviction
regarding the superiority of large farm enterprises: the statistical analysis shows that corporate
farms certainly do not outperform peasant farms. The performance of large corporate farms at
best is comparable to the performance of the much smaller peasant farms.
3 The mathematics of the Cobb-Douglas production function translates the negative dummy variable coefficient of
−0.249 in Model 1 into a difference of 22% in output between corporate farms and peasant farms for each bundle of
inputs (1 − exp(−0.249) = 1 − 0.78 = 0.22). For Model 2 the difference is 27%.
20
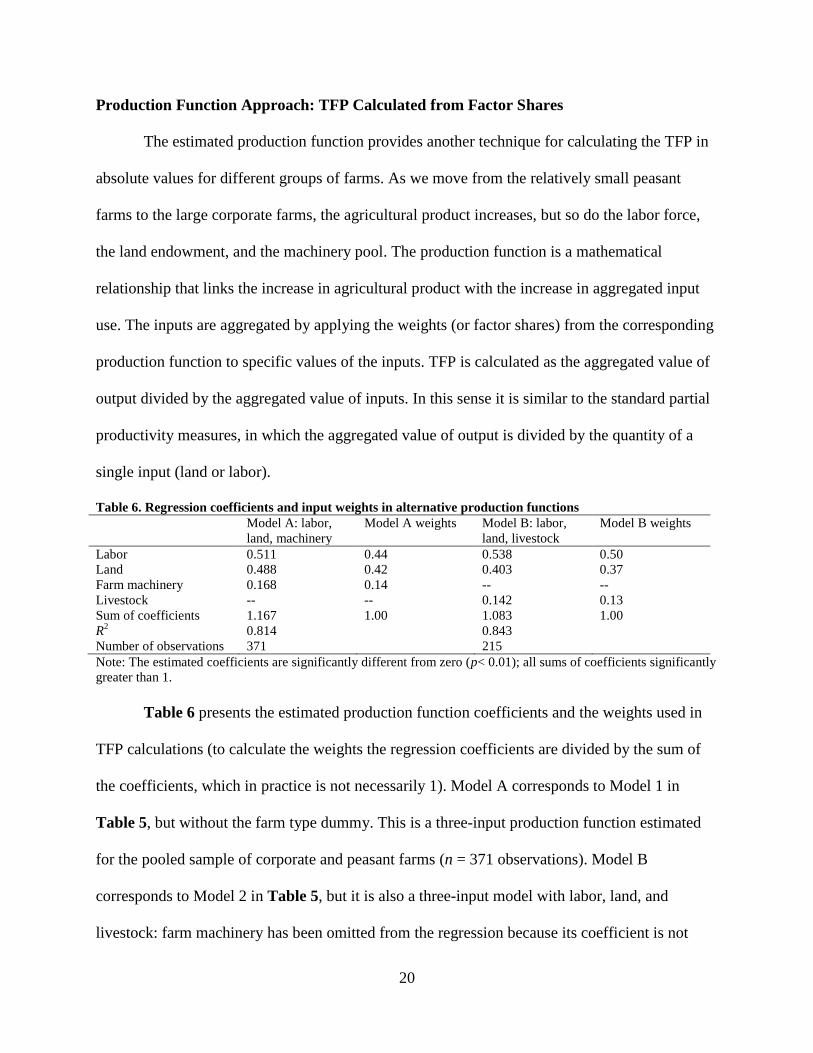
Production Function Approach: TFP Calculated from Factor Shares
The estimated production function provides another technique for calculating the TFP in
absolute values for different groups of farms. As we move from the relatively small peasant
farms to the large corporate farms, the agricultural product increases, but so do the labor force,
the land endowment, and the machinery pool. The production function is a mathematical
relationship that links the increase in agricultural product with the increase in aggregated input
use. The inputs are aggregated by applying the weights (or factor shares) from the corresponding
production function to specific values of the inputs. TFP is calculated as the aggregated value of
output divided by the aggregated value of inputs. In this sense it is similar to the standard partial
productivity measures, in which the aggregated value of output is divided by the quantity of a
single input (land or labor).
Table 6. Regression coefficients and input weights in alternative production functions
Model A: labor,
land, machinery
Model A weights Model B: labor,
land, livestock
Model B weights
Labor 0.511 0.44 0.538 0.50
Land 0.488 0.42 0.403 0.37
Farm machinery 0.168 0.14 -- --
Livestock -- -- 0.142 0.13
Sum of coefficients 1.167 1.00 1.083 1.00
R2 0.814 0.843
Number of observations 371 215
Note: The estimated coefficients are significantly different from zero (p< 0.01); all sums of coefficients significantly
greater than 1.
Table 6 presents the estimated production function coefficients and the weights used in
TFP calculations (to calculate the weights the regression coefficients are divided by the sum of
the coefficients, which in practice is not necessarily 1). Model A corresponds to Model 1 in
Table 5, but without the farm type dummy. This is a three-input production function estimated
for the pooled sample of corporate and peasant farms (n = 371 observations). Model B
corresponds to Model 2 in Table 5, but it is also a three-input model with labor, land, and
livestock: farm machinery has been omitted from the regression because its coefficient is not

21
statistically significant. In both three-input production functions agricultural land accounts for
nearly 50% of input use and labor for around 40% (see the columns for input weights in Table
6). The third factor (machinery or livestock) accounts for less than 15% of input use. The
aggregated value of inputs is obtained for each observation as the sum of the relevant inputs
(labor, land, machinery or labor, land, livestock) multiplied by the respective weights from
Table 6. The TFP is then calculated for each observation as the ratio of the value of output to the
aggregated value of inputs.
The mean and median TFP values obtained by this method for corporate and peasant
farms are presented in Table 7. The numbers are very close for the two categories and the
differences between farms of different types are not statistically significant. Regression of TFP
on farm size as a continuous variable (measured in hectares of agricultural land) failed to detect
any statistically significant relationship either:TFP was found to be at the same average level for
farms of all sizes. These results are fully consistent with the previous observation that the
dummy variable coefficient did not produce a statistically significant shift in production
functions between corporate and peasant farms. The TFP calculations do not provide positive
evidence in support of our hypothesis that individual (peasant) farms are more productive than
corporate farms. On the other hand, these results establish convincingly that corporate farms are
not better than peasant farms, and both farm types should be allowed to evolve on a level playing
field.
Table 7. TFP (‘000 hrivny per aggregated unit of inputs)
Mean Median
Peasant farms Corporate
farms
Peasant farms Corporate
farms
Model A: labor, land, machinery 2.70 2.46 1.64 1.85
Model B: labor, land, animals 2.97 3.01 1.92 2.21
Note: none of the pairwise differences in TFP are statistically significant.

22
Technical Efficiency
Our approach to total factor productivity has mainly relied on estimation of production
functions. A different approach that focuses on farm technical efficiency (rather than TFP) relies
on the construction of production frontiers (not production functions). A production frontier is
the locus of efficient or “best attainable” points, i.e., points where the maximum output is
achieved for every given bundle of inputs, or alternatively every given output is achieved by the
consumption of a minimum bundle of inputs. The production-frontier approach provides an
alternative view that generally reinforces the TFP results obtained with production functions.
The production frontier is constructed on the basis of available empirical data, and the
efficient points are the “best attainable” in the sample, not in the entire conceivable population.
Once the production frontier has been constructed, the technical efficiency of each farm is
calculated by measuring its relative distance from the frontier. Points on the frontier are
technically efficient; their distance from the frontier is 0, and their technical efficiency (TE)
score is 1. As the distance of a particular point from the frontier increases, its TE score decreases.
Each TE score is a number indicating the output that a particular farm achieves with a given
bundle of inputs as a fraction (or a percentage) achieved by the “best performer” with the same
bundle of inputs. For a comprehensive discussion of technical efficiency and the methodology of
constructing production frontiers see Coelli et al. (1998).
Stochastic Frontier Analysis (SFA) is a production frontier technique that is conceptually
close to production function estimation. This is an econometric method that starts with the
production function and then iteratively shifts it outward by a certain algorithm until a
production frontier is obtained. The actual observed points generally fall below the frontier (in
this sense they are inefficient). The deviation of the observed points from the frontier also
23
contains a random error component because of which some points may actually fall above the
estimated frontier (if the error component exceeds the estimated inefficiency component). The
TE scores are calculated by taking the ratio of the actual output of each farm (adjusted for
random errors) to the stochastic frontier output for the corresponding bundle of inputs. A detailed
description of the SFA algorithm can be found in Coelli et al. (1998).
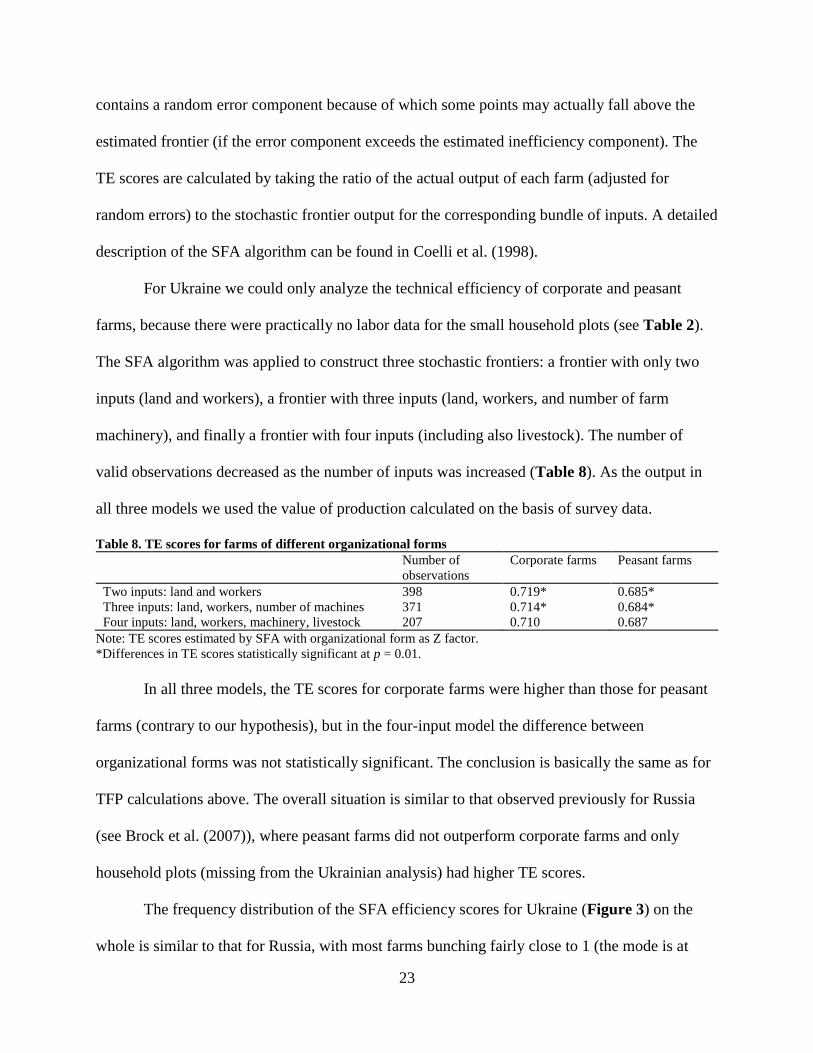
For Ukraine we could only analyze the technical efficiency of corporate and peasant
farms, because there were practically no labor data for the small household plots (see Table 2).
The SFA algorithm was applied to construct three stochastic frontiers: a frontier with only two
inputs (land and workers), a frontier with three inputs (land, workers, and number of farm
machinery), and finally a frontier with four inputs (including also livestock). The number of
valid observations decreased as the number of inputs was increased (Table 8). As the output in
all three models we used the value of production calculated on the basis of survey data.
Table 8. TE scores for farms of different organizational forms
Number of
observations
Corporate farms
Peasant farms
Two inputs: land and workers 398 0.719* 0.685*
Three inputs: land, workers, number of machines 371 0.714* 0.684*
Four inputs: land, workers, machinery, livestock 207 0.710 0.687
Note: TE scores estimated by SFA with organizational form as Z factor.
*Differences in TE scores statistically significant at p = 0.01.
In all three models, the TE scores for corporate farms were higher than those for peasant
farms (contrary to our hypothesis), but in the four-input model the difference between
organizational forms was not statistically significant. The conclusion is basically the same as for
TFP calculations above. The overall situation is similar to that observed previously for Russia
(see Brock et al. (2007)), where peasant farms did not outperform corporate farms and only
household plots (missing from the Ukrainian analysis) had higher TE scores.
The frequency distribution of the SFA efficiency scores for Ukraine (Figure 3) on the
whole is similar to that for Russia, with most farms bunching fairly close to 1 (the mode is at
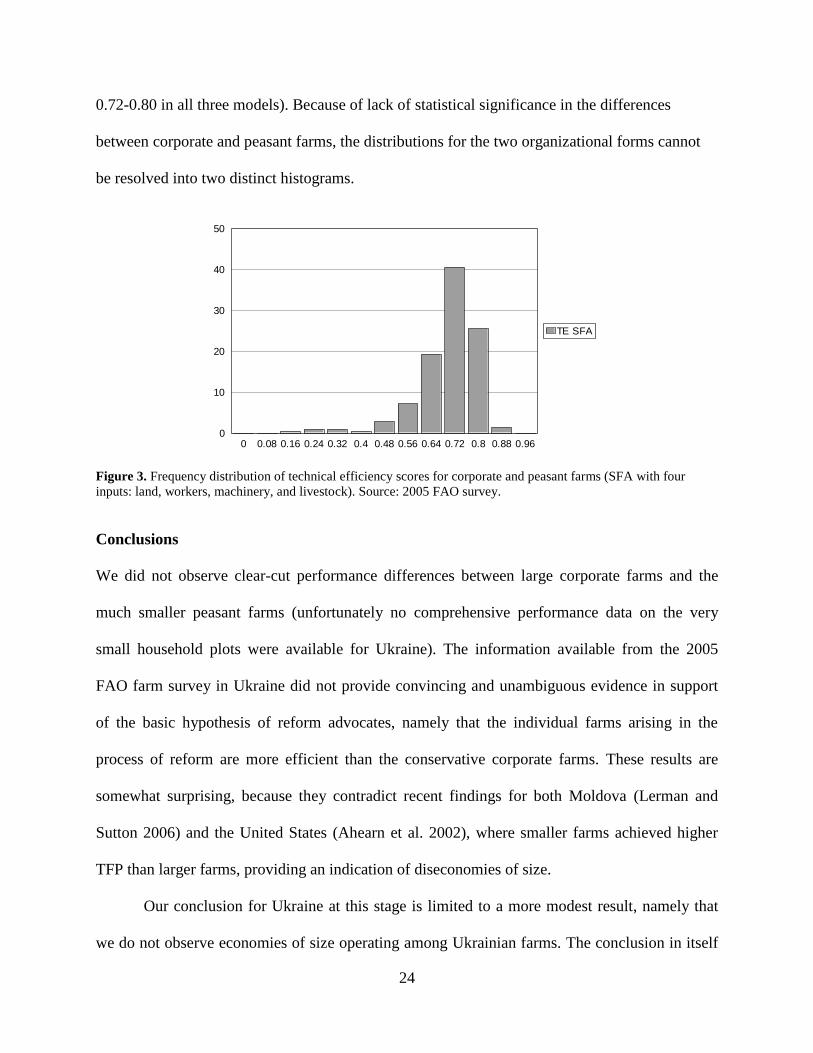
24
0.72-0.80 in all three models). Because of lack of statistical significance in the differences
between corporate and peasant farms, the distributions for the two organizational forms cannot
be resolved into two distinct histograms.
Figure 3. Frequency distribution of technical efficiency scores for corporate and peasant farms (SFA with four
inputs: land, workers, machinery, and livestock). Source: 2005 FAO survey.
Conclusions
We did not observe clear-cut performance differences between large corporate farms and the
much smaller peasant farms (unfortunately no comprehensive performance data on the very
small household plots were available for Ukraine). The information available from the 2005
FAO farm survey in Ukraine did not provide convincing and unambiguous evidence in support
of the basic hypothesis of reform advocates, namely that the individual farms arising in the
process of reform are more efficient than the conservative corporate farms. These results are
somewhat surprising, because they contradict recent findings for both Moldova (Lerman and
Sutton 2006) and the United States (Ahearn et al. 2002), where smaller farms achieved higher
TFP than larger farms, providing an indication of diseconomies of size.
Our conclusion for Ukraine at this stage is limited to a more modest result, namely that
we do not observe economies of size operating among Ukrainian farms. The conclusion in itself
0 0.08 0.16 0.24 0.32 0.4 0.48 0.56 0.64 0.72 0.8 0.88 0.960
10
20
30
40
50
TE SFA
25
has important implications in a country where the traditional mindset among agricultural policy-
makers is that “large is beautiful”. Based on our findings, there is no justification for continuing
policies that favor large corporate farms over smaller family farms. The government of Ukraine
should abandon its inherited preference for large-scale corporate farms and concentrate on
policies to improve the operating conditions for small individual farms. All types of farms should
be allowed to evolve on a level playing field, as they normally do in established market
economies. Continuing the transformation from largely corporate to largely individual farm
structure in line with the patterns characteristic of market economies can be expected to
strengthen the beneficial effects for Ukrainian agriculture that are beginning to be noticeable
since the introduction of the watershed policies in 2000.
References
AgUkraine (2006). Agriculture of Ukraine 2005, Statistical Yearbook, Kiev, State Statistical
Committee of Ukraine.
Ahearn, M., Yee, J., Huffman, W. (2002). “The effect of contracting and consolidation on farm
productivity,” paper presented at the Economics of Contracting in Agriculture Workshop,
Annapolis, MD (July).
Allen, D.W. and Lueck, D. (2002). The Nature of the Farm: Contracts, Risk, and Organization in
Agriculture, Cmabridge, MA, MIT Press.
Brock, G., Grazhdaninova, M., Lerman, Z., and Uzun, V. (2007). “Technical efficiency in
Russian agriculture,” in: Lerman, Z. (ed.), Russia’s Agriculture in Transition: Factor
Markets and Constraints on Growth, Lanham, MD, Lexington Books.
Coelli, T., Rao, D. S. P., and Battese, G. (1998). An Introduction to Efficiency and Productivity
Analysis, Kluwer, Boston.
Decree (1999). Presidential Decree No. 1529/99 “On immediate measures to accelerate the
reforms in the agricultural sector”, December 3.
Derzhkomzem (various years). Nalichie zemel’ i raspredelenie ikh po zemlepol’zovatelyam,
sobstvennikam zemli i ugodii, Statistical Yearbook, Kiev, State Land Committee.
26
Dudwick, N., Fock, K., Sedik, D. (2005). A Stocktaking of Land Reform and Farm Restructuring
in Bulgaria, Moldova, Azerbaijan, and Kazakhstan, Environmentally and Socially
Sustainable Development Working Paper, Washington, DC, World Bank, June.
Jones, C. I. (1998). Introduction to Economic Growth, New York, Norton.
Lerman, Z. (2004). “Successful land individualization in Trans-Caucasia: Armenia, Azerbaijan,
Georgia,” in: Macey, D., Pyle, W., and Wegren, S. (eds.), Building Market Institutions in
Post-Communist Agriculture, Lanham, MD, Lexington Books.
Lerman, Z. and Csaki, C. (2000). Ukraine: Review of Farm Restructuring Experience, World
Bank Technical Paper 459, Washington, DC, World Bank.
Lerman, Z., Csaki, C., and Feder, G. (2004). Agriculture in Transition: Land Policies and
Evolving Farm Structures in Post-Soviet Countries, Lanham, MD, Lexington Books.
Lerman, Z. and Schreinemachers, P. (2005). “Individual farming as a labor sink: Evidence from
Poland and Russia,” Comparative Economic Studies, 47(4): 675-695 (December).
Lerman, Z. and Sutton, W. (2006). “Productivity and efficiency of small and large farms in
Moldova,” AAEA Annual Meeting, Long Beach, CA, July 23-26 [posted on AgEcon
Search http://agecon.lib.umn.edu/].
USDA/NASS (2004). 2002 Census of Agriculture, Washington, DC, U.S. Department of
Agriculture [www.usda.gov/nass].