Condensation Polymerization of Anthocyanin Biomolecule and ...
UNIVERSIDADE DA BEIRA INTERIOR Ciências
Production of nanofiber-based membranes for biomolecule recovery
Bernardo Paiva Antunes
Dissertação para obtenção do Grau de Mestre em
Biotecnologia (2º ciclo de estudos)
Orientador: Prof. Doutor Ilídio Joaquim Sobreira Correia
Covilhã, junho de 2013
UNIVERSIDADE DA BEIRA INTERIOR Ciências
Produção de membranas à base de nanofibras para a recuperação de biomoléculas
Bernardo Paiva Antunes
Dissertação para obtenção do Grau de Mestre em
Biotecnologia (2º ciclo de estudos)
Orientador: Prof. Doutor Ilídio Joaquim Sobreira Correia
Covilhã, junho de 2013

iii
iv
List of Publications
Valente, J.F.A., V.M. Gaspar, B.P. Antunes, P. Coutinho, and I.J. Correia,
Microencapsulated chitosan–dextran sulfate nanoparticles for controled delivery of
bioactive molecules and cells in bone regeneration. Polymer, 2012. 54(1): 5-15;
Correia, T.R., B.P. Antunes, P.H. Castilho, J.C. Nunes, M.T. Pessoa de Amorim, I.C.
Escobar, J.A. Queiroz, I.J. Correia, and A.M. Morão, A bi-layer electrospun nanofiber
membrane for plasmid DNA recovery from fermentation broths. Separation and
Purification Technology, 2013. 112: p. 20-25.

v

vi
Acknowledgments
Behind me lies a year of intense effort and hard work, which made me grow up not
only in knowledge but also as a man. Nevertheless, along this path I could count on some
people, whom I would like to thank:
Firstly, I would like to express my gratitude to my supervisor Professor Ilídio Correia for his
guidance, patience and support during this Master Thesis. I would also like to thank him for
all the conditions and knowledge provided in this area.
I would also like to show my appreciation to Eng. Ana Paula from the Optics department of
Universidade da Beira Interior for the time spent on the acquisition of scanning electron
microscopy images.
I thank my work group for creating a healthy working environment, and for offering me
support and kindness in the toughest moments.
To my closest friends I would like to express my deepest gratitude, for being at my side in the
darkest times, but as well as in the happiest.
Last but not least, to my parents, for supporting me during all these years. For your
unconditional faith, guidance and love, I thank you from the bottom of my heart.

vii

viii
“Knowledge speaks, but wisdom listens.”
James Marshall Hendrix

ix
x
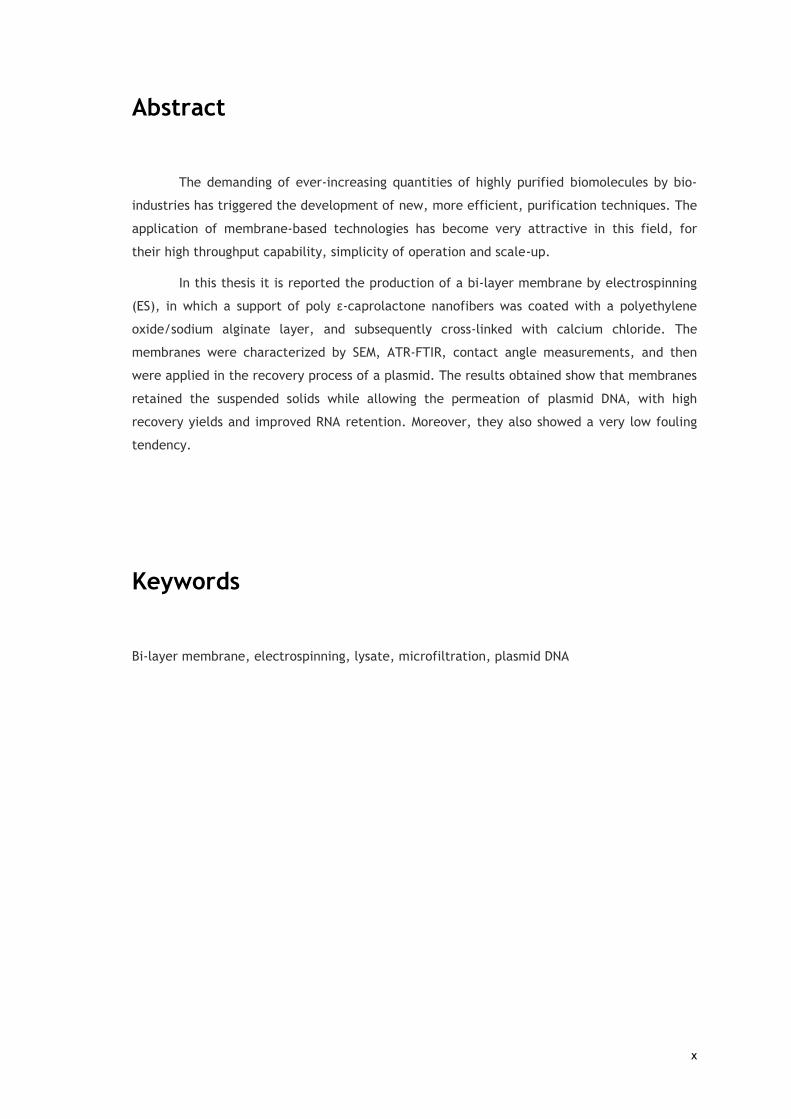
Abstract
The demanding of ever-increasing quantities of highly purified biomolecules by bio-
industries has triggered the development of new, more efficient, purification techniques. The
application of membrane-based technologies has become very attractive in this field, for
their high throughput capability, simplicity of operation and scale-up.
In this thesis it is reported the production of a bi-layer membrane by electrospinning
(ES), in which a support of poly ε-caprolactone nanofibers was coated with a polyethylene
oxide/sodium alginate layer, and subsequently cross-linked with calcium chloride. The
membranes were characterized by SEM, ATR-FTIR, contact angle measurements, and then
were applied in the recovery process of a plasmid. The results obtained show that membranes
retained the suspended solids while allowing the permeation of plasmid DNA, with high
recovery yields and improved RNA retention. Moreover, they also showed a very low fouling
tendency.
Keywords
Bi-layer membrane, electrospinning, lysate, microfiltration, plasmid DNA

xi
xii
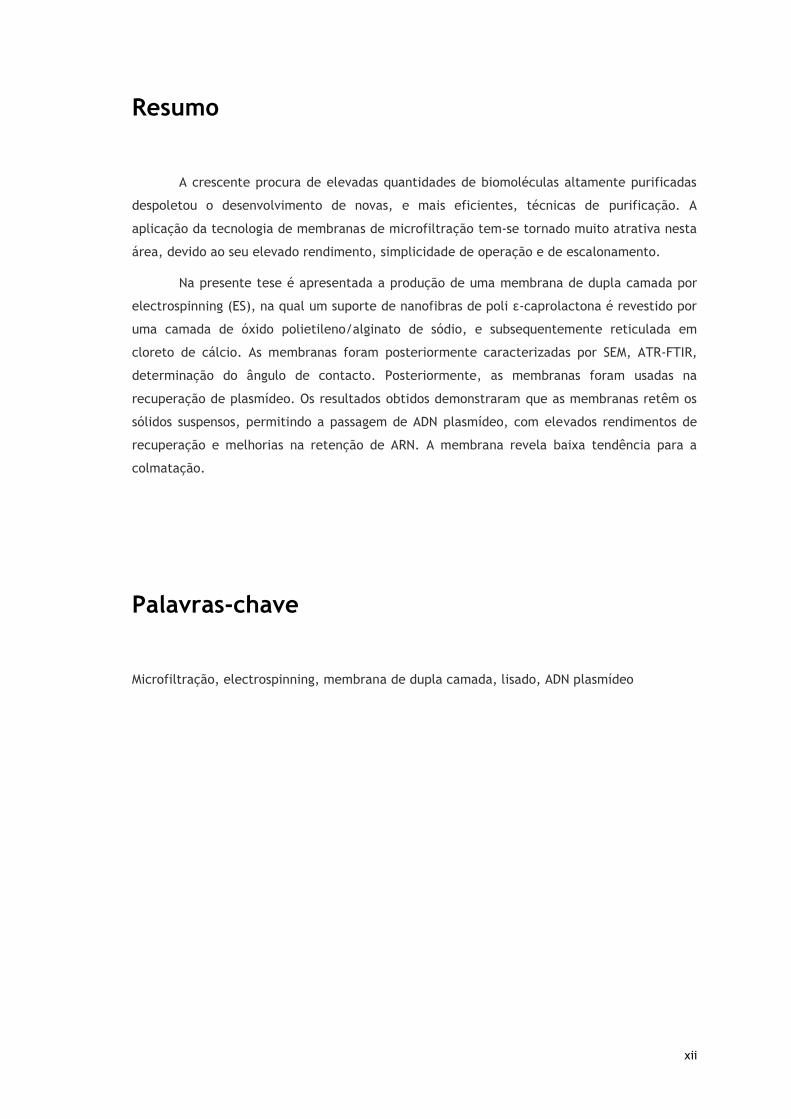
Resumo
A crescente procura de elevadas quantidades de biomoléculas altamente purificadas
despoletou o desenvolvimento de novas, e mais eficientes, técnicas de purificação. A
aplicação da tecnologia de membranas de microfiltração tem-se tornado muito atrativa nesta
área, devido ao seu elevado rendimento, simplicidade de operação e de escalonamento.
Na presente tese é apresentada a produção de uma membrana de dupla camada por
electrospinning (ES), na qual um suporte de nanofibras de poli ε-caprolactona é revestido por
uma camada de óxido polietileno/alginato de sódio, e subsequentemente reticulada em
cloreto de cálcio. As membranas foram posteriormente caracterizadas por SEM, ATR-FTIR,
determinação do ângulo de contacto. Posteriormente, as membranas foram usadas na
recuperação de plasmídeo. Os resultados obtidos demonstraram que as membranas retêm os
sólidos suspensos, permitindo a passagem de ADN plasmídeo, com elevados rendimentos de
recuperação e melhorias na retenção de ARN. A membrana revela baixa tendência para a
colmatação.
Palavras-chave
Microfiltração, electrospinning, membrana de dupla camada, lisado, ADN plasmídeo

xiii
xiv
Resumo Alargado
A produção de fármacos em larga escala debate-se com a necessidade de recuperar
biomoléculas a partir de misturas complexas (e.g. produtos de fermentação). A crescente
procura de elevadas quantidades de biomoléculas altamente purificadas, por parte de
indústrias como a farmacêutica, tem levado a procura de técnicas mais eficientes de
purificação. O isolamento e purificação de produtos biotecnológicos podem envolver várias
etapas, com diferentes princípios de separação. O processo terá de ser adaptado e otimizado
ao produto que se pretende purificar, dependendo da natureza e do tamanho do mesmo. A
aplicação da tecnologia de membrana (e.g. microfiltração) tem vindo a tornar-se muito
atrativa nesta área, devido ao seu elevado rendimento, simplicidade de operação e de
adaptação à escala industrial.
A tecnologia de membrana está principalmente associada a processos de separação
(e.g. processamento de misturas biotecnológicas complexas). Esta inclui uma vasta gama de
aplicações, tais como filtração estéril, clarificação, remoção de vírus, concentração de
proteínas. Os processos de membrana contemplam ainda a purificação de água, e a
recuperação e purificação de ácidos nucleicos.
Este trabalho tem em vista a produção de membranas através da técnica de
electrospinning para a recuperação de ADN plasmídeo a partir de caldos de fermentação. A
recuperação e purificação do ADN plasmídeo possui grande importância, dado o seu papel na
terapia génica e na produção de vacinas.
Electrospinning trata-se de uma técnica simples e barata para a produção de
nanofibras, a partir de uma vasta gama de polímeros, ou misturas de polímeros. Esta técnica
oferece condições únicas para a produção de materiais à base de nanofibras (e.g.
membranas), para a aplicação em várias áreas de interesse, entre as quais a filtração. As
membranas produzidas por electrospinning apresentam várias vantagens para a aplicação em
processos de filtração (e.g. elevado rácio área superficial/volume e poros continuamente
interconectados).
Foi produzida uma membrana de dupla camada por electrospinning, na qual um
suporte de nanofibras de poli ε-caprolactona é revestido por uma camada de óxido
polietileno/alginato de sódio, e subsequentemente reticulada em cloreto de cálcio. A
membrana produzida é comparada com membranas comerciais usadas para o mesmo tipo de
processos de recuperação.
As membranas foram caracterizadas por SEM, ATR-FTIR, determinação do ângulo de
contacto. A partir das imagens de SEM foi analisada a morfologia superficial das membranas,
assim como a distribuição do diâmetro de fibras, no caso das membranas produzidas por

xv
electrospinning. A determinação do ângulo de contacto das membranas permitiu concluir
sobre as características de superfície das membranas.
Posteriormente, as membranas foram usadas na recuperação de plasmídeo. Os
resultados obtidos demonstraram que as membranas aqui produzidas retêm os sólidos
suspensos, permitindo a passagem de ADN plasmídeo, com elevados rendimentos de
recuperação. A membrana produzida por electrospinning mostrou ainda melhorias na
retenção de ARN, assim como baixa tendência para a colmatação, face às membranas
comerciais.

xvi
xvii
Index
Chapter I:
1. Introduction....................................................................................................... 2
1.1 Biomolecule purification in pharmaceutical industry............................................ 2
1.1.1 Downstream Processing.................................................................. 2
1.2 Membrane science and technology................................................................. 4
1.2.1 Membrane classification.................................................................. 4
1.2.2 Pressure-driven membrane applications............................................... 6
1.2.3 Membrane properties..................................................................... 8
1.2.4 Parameters affecting membrane processes........................................... 9
1.3 Plasmid DNA........................................................................................... 11
1.3.1 Plasmid DNA purification................................................................. 11
1.4 Nanofiber production techniques................................................................... 12
1.4.1 Electrospinning process.................................................................. 13
1.4.1.1 Parameters Influencing Nanofiber Production............................ 13
1.4.1.2 Polymeric Nanofibers......................................................... 13
1.4.1.3 Application of nanofiber membranes to separation processes......... 18
1.5 Objectives.............................................................................................. 20
Chapter II:
2. Materials and methods........................................................................................... 22
2.1 Materials............................................................................................. ... 22
2.2 Methods................................................................................................. 22
2.2.1 Bacterial growth and cell lysis.......................................................... 22
2.2.2 Electrospinning Setup.................................................................... 22
2.2.3 Preparation of the polymer solutions.................................................. 23
2.2.4 Electrospun nanofiber membranes production....................................... 23
2.2.5 Membrane filtration tests................................................................ 23
2.2.6 Turbidity measurements................................................................. 24
2.2.7 Plasmid DNA and RNA quantification................................................... 24
xviii
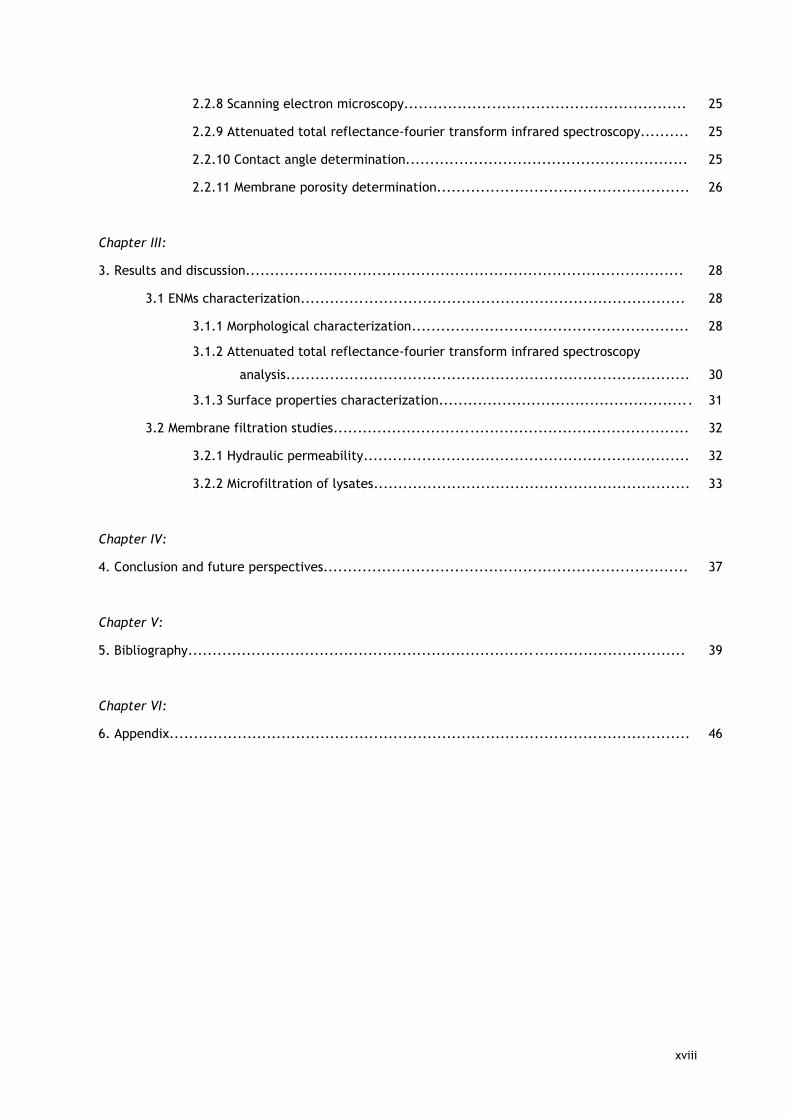
2.2.8 Scanning electron microscopy.......................................................... 25
2.2.9 Attenuated total reflectance-fourier transform infrared spectroscopy.......... 25
2.2.10 Contact angle determination.......................................................... 25
2.2.11 Membrane porosity determination.................................................... 26
Chapter III:
3. Results and discussion.......................................................................................... 28
3.1 ENMs characterization............................................................................... 28
3.1.1 Morphological characterization......................................................... 28
3.1.2 Attenuated total reflectance-fourier transform infrared spectroscopy
analysis................................................................................... 30
3.1.3 Surface properties characterization.................................................... 31
3.2 Membrane filtration studies......................................................................... 32
3.2.1 Hydraulic permeability................................................................... 32
3.2.2 Microfiltration of lysates................................................................. 33
Chapter IV:
4. Conclusion and future perspectives........................................................................... 37
Chapter V:
5. Bibliography...................................................................................................... 39
Chapter VI:
6. Appendix........................................................................................................... 46

xix
xx
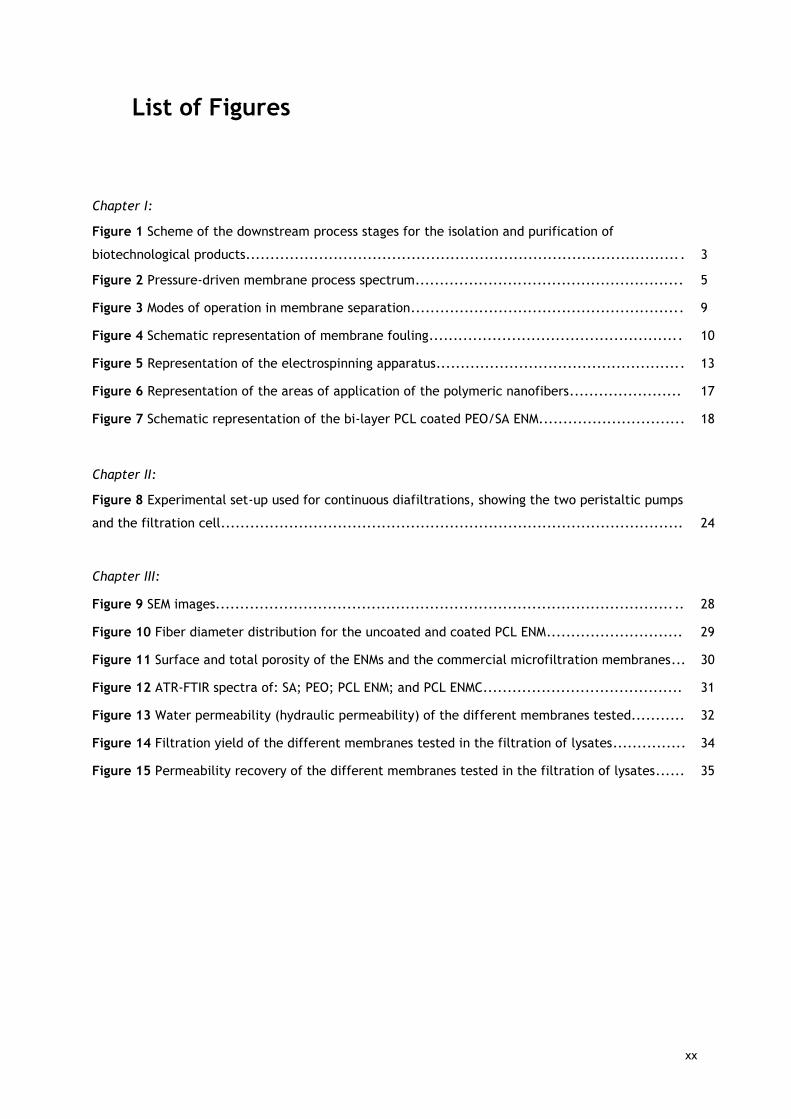
List of Figures
Chapter I:
Figure 1 Scheme of the downstream process stages for the isolation and purification of
biotechnological products.......................................................................................... 3
Figure 2 Pressure-driven membrane process spectrum....................................................... 5
Figure 3 Modes of operation in membrane separation........................................................ 9
Figure 4 Schematic representation of membrane fouling.................................................... 10
Figure 5 Representation of the electrospinning apparatus................................................... 13
Figure 6 Representation of the areas of application of the polymeric nanofibers....................... 17
Figure 7 Schematic representation of the bi-layer PCL coated PEO/SA ENM.............................. 18
Chapter II:
Figure 8 Experimental set-up used for continuous diafiltrations, showing the two peristaltic pumps
and the filtration cell............................................................................................... 24
Chapter III:
Figure 9 SEM images.............................................................................................. .. 28
Figure 10 Fiber diameter distribution for the uncoated and coated PCL ENM............................ 29
Figure 11 Surface and total porosity of the ENMs and the commercial microfiltration membranes... 30
Figure 12 ATR-FTIR spectra of: SA; PEO; PCL ENM; and PCL ENMC......................................... 31
Figure 13 Water permeability (hydraulic permeability) of the different membranes tested........... 32
Figure 14 Filtration yield of the different membranes tested in the filtration of lysates............... 34
Figure 15 Permeability recovery of the different membranes tested in the filtration of lysates...... 35

xxi
xxii
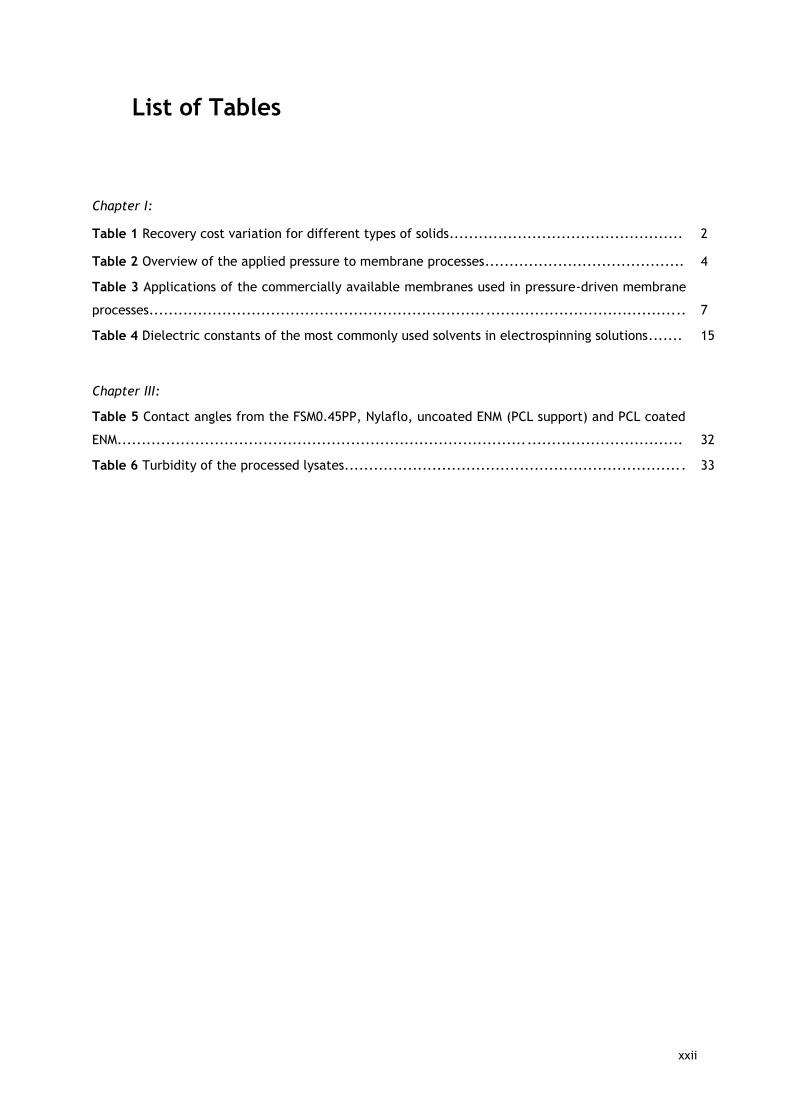
List of Tables
Chapter I:
Table 1 Recovery cost variation for different types of solids................................................ 2
Table 2 Overview of the applied pressure to membrane processes......................................... 4
Table 3 Applications of the commercially available membranes used in pressure-driven membrane
processes.............................................................................................................. 7
Table 4 Dielectric constants of the most commonly used solvents in electrospinning solutions....... 15
Chapter III:
Table 5 Contact angles from the FSM0.45PP, Nylaflo, uncoated ENM (PCL support) and PCL coated
ENM.................................................................................................................... 32
Table 6 Turbidity of the processed lysates...................................................................... 33

xxiii
xxiv
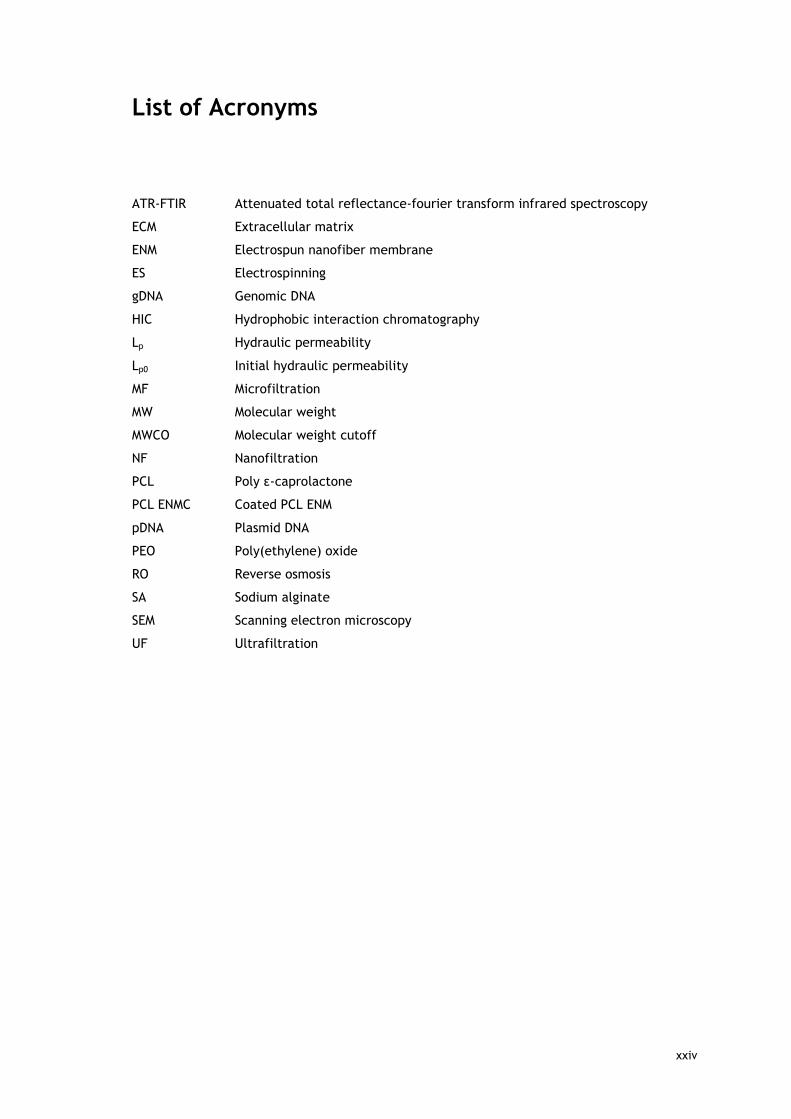
List of Acronyms
ATR-FTIR Attenuated total reflectance-fourier transform infrared spectroscopy
ECM Extracellular matrix
ENM Electrospun nanofiber membrane
ES Electrospinning
gDNA Genomic DNA
HIC Hydrophobic interaction chromatography
Lp Hydraulic permeability
Lp0 Initial hydraulic permeability
MF Microfiltration
MW Molecular weight
MWCO Molecular weight cutoff
NF Nanofiltration
PCL Poly ε-caprolactone
PCL ENMC Coated PCL ENM
pDNA Plasmid DNA
PEO Poly(ethylene) oxide
RO Reverse osmosis
SA Sodium alginate
SEM Scanning electron microscopy
UF Ultrafiltration

xxv
Introduction
Chapter I
Chapter I: Introduction ________________________________________________________________________
2
1. Introduction
1.1 Biomolecule purification in pharmaceutical industry
The pharmaceutical industry produces drugs on large scale to meet the needs of those
who are ill. Most of the biotechnological molecules, required to drug production, are present
in complex mixtures of products (e.g. fermentation broths). The recovery of these
biomolecules is processed by downstream purification techniques [1].
1.1.1 Downstream Processing
This is a multistage operation that regards the isolation and purification of a
biotechnological product. The complexity of this process is determined by the required purity
of the product, and also by its application. Different separation principles may be required,
as the products vary in terms of size and nature. As examples of these products we have,
whole cells, nucleic acids, amino acids, enzymes, proteins, antibiotics, among others.
Furthermore, it is of great importance to minimize the number of steps used for obtaining the
desired biomolecule, so that the cost and the time of the operation can be kept as low as
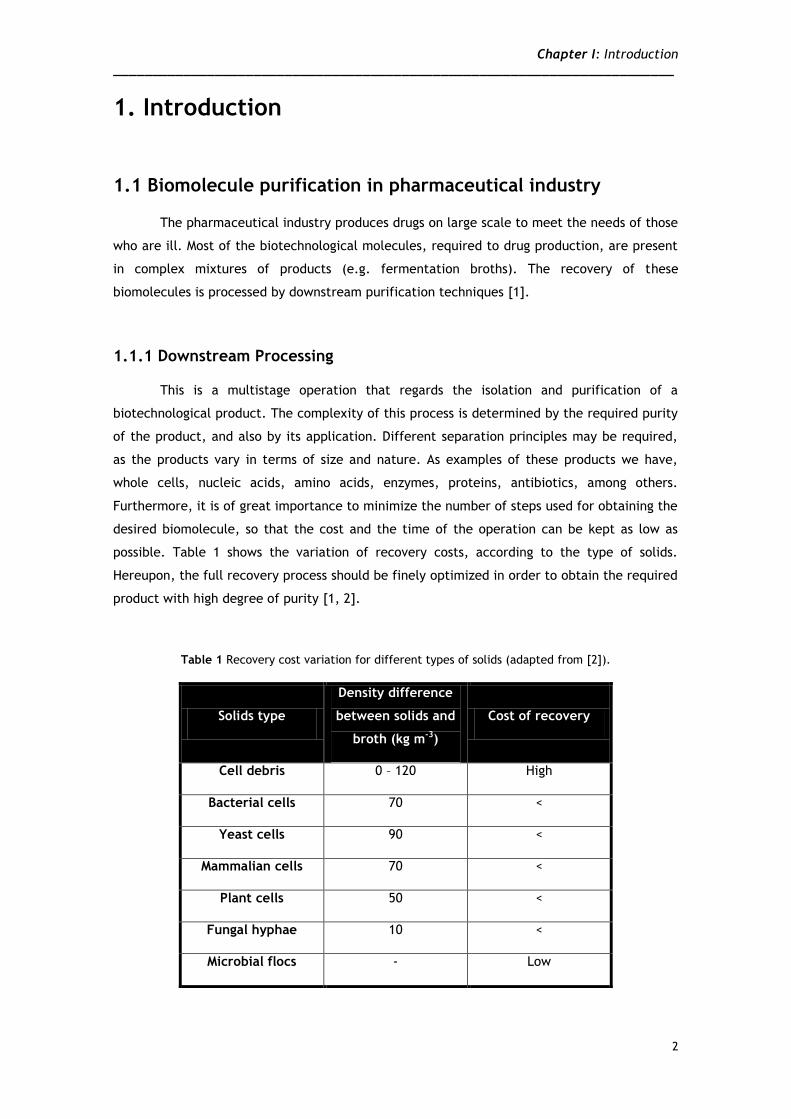
possible. Table 1 shows the variation of recovery costs, according to the type of solids.
Hereupon, the full recovery process should be finely optimized in order to obtain the required
product with high degree of purity [1, 2].
Table 1 Recovery cost variation for different types of solids (adapted from [2]).
Solids type
Density difference
between solids and
broth (kg m-3)
Cost of recovery
Cell debris 0 – 120 High
Bacterial cells 70 <
Yeast cells 90 <
Mammalian cells 70 <
Plant cells 50 <
Fungal hyphae 10 <
Microbial flocs - Low

Chapter I: Introduction ________________________________________________________________________
3
The downstream processing scheme to isolate and purify target biomolecules usually
features four stages [2]:
1. solid-liquid separation (or clarification)
2. concentration
3. purification
4. formulation.
In figure 1 is shown a scheme of the different stages comprised in downstream processes,
pointing out purification (or isolation) methods used in those stages. Moreover, a reduction of
the number of recovery stages has a high demand. Processes able to do the work of several
others, will allow the saving of time and money [2].
Figure 1 Scheme of the downstream process stages for the isolation and purification of biotechnological
products (adapted from [2]).
Chapter I: Introduction ________________________________________________________________________
4
1.2 Membrane science and technology
Membrane science is a broad and highly interdisciplinary field, where process
engineering, material science and chemistry meet, to produce membranes that have a wide
range of applications. Membranes are best known for their use in separation processes (e.g.
processing of complex biotechnological mixtures), nevertheless employing biocompatible or
biodegradable polymers for membrane production, allow them to be applied as culturing
supports (or scaffolds) for tissue engineering purposes [3].
Membrane systems offer properties, such as, high selectivity, high surface area to
volume ratio and potential for controlling the contact and mixing level between two phases.
Furthermore, membranes have been used to purify biological molecules, since they can be
operated at relatively low temperature and pressure, involving no phase changes or chemical
additives, which minimize denaturation, deactivation and/or degradation of biological
molecules [4, 5]. Moreover, membrane filtrations offer relatively simple operations and low
costs, when compared with other competitive procedures, such as centrifugal separation,
vacuum filtration and spray drying. Membrane processes usually achieve high efficiency in
terms of separation, which has a great economical impact [6].
1.2.1 Membrane classification
Membranes used for biotechnological purposes are classified according to three
factors, pore size, molecular weight cutoff (MWCO) and driving force. It is important to point
out that MWCO is used to describe membrane retention capabilities, directly associated with
the membrane pore dimensions [6, 7].
Membrane processes can be classified as concentration-driven, pressure-driven and
electrical-driven membrane processes [8]. Herein pressure-driven membrane processes will
be further characterized. Among these are microfiltration (MF), ultrafiltration (UF),
nanofiltration (NF) and reverse osmosis (RO), from the least selective to the most selective,
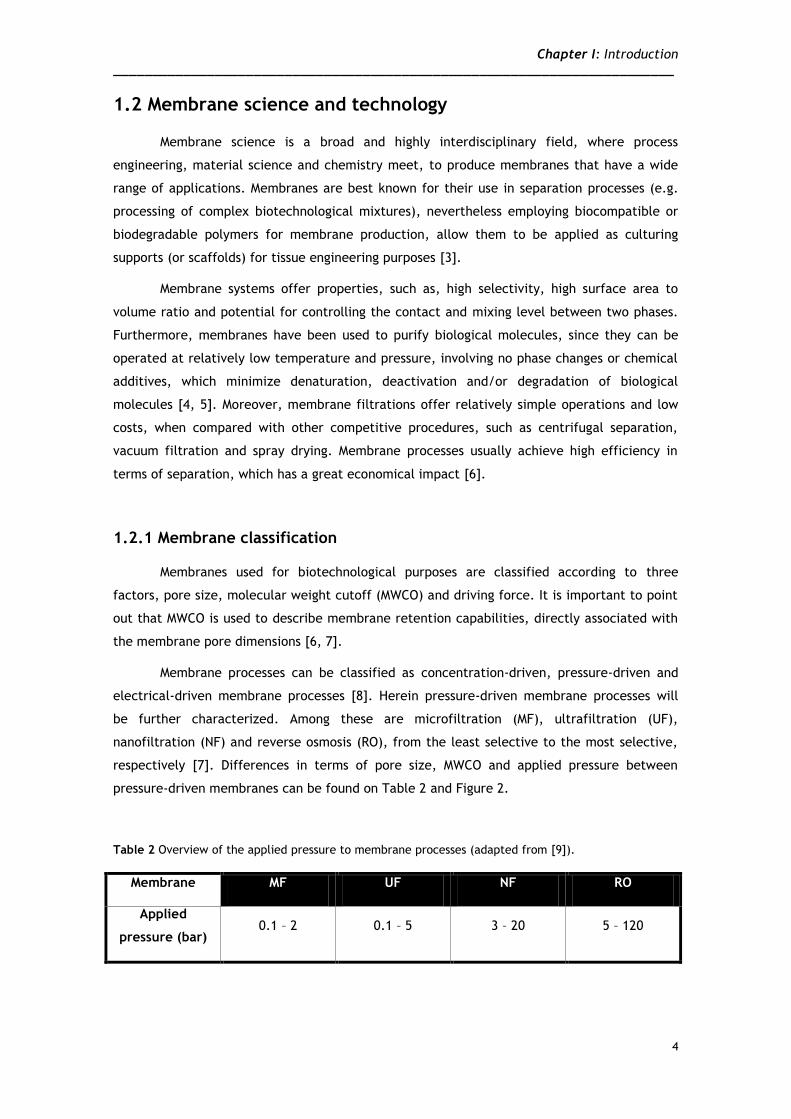
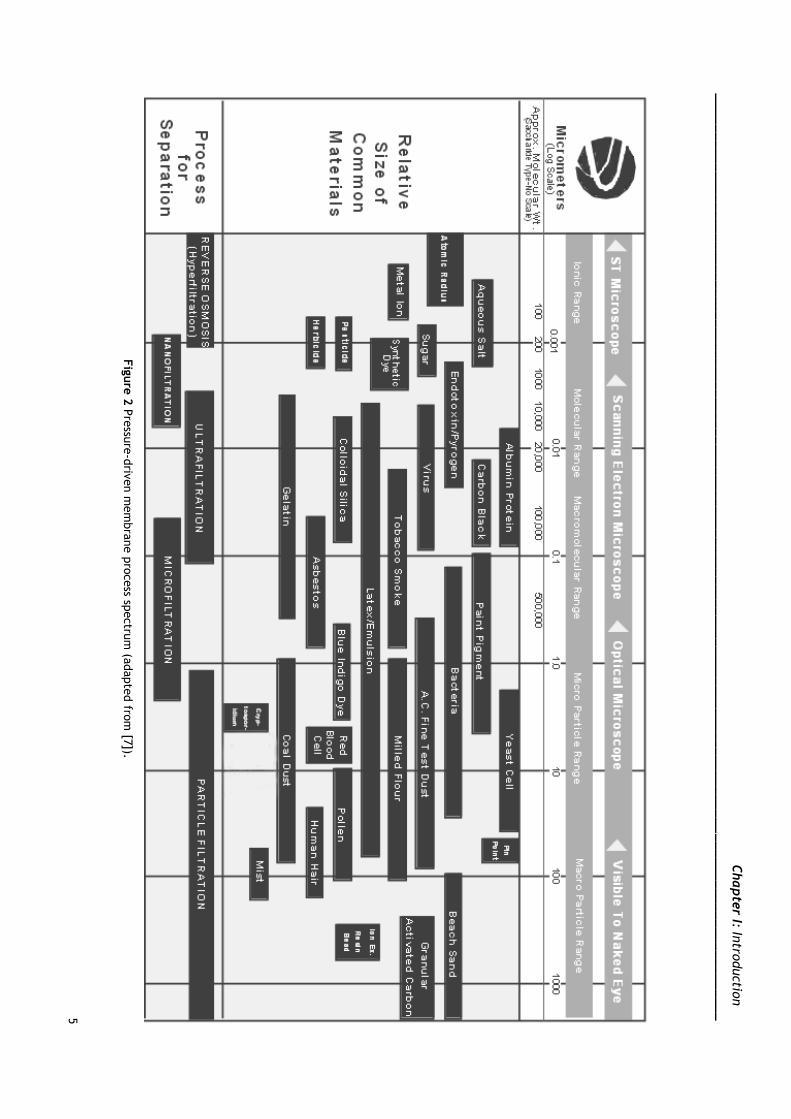
respectively [7]. Differences in terms of pore size, MWCO and applied pressure between
pressure-driven membranes can be found on Table 2 and Figure 2.
Table 2 Overview of the applied pressure to membrane processes (adapted from [9]).
Membrane MF UF NF RO
Applied
pressure (bar) 0.1 – 2 0.1 – 5 3 – 20 5 – 120
Chapte
r I: Intro
ductio
n
_______________________________________________________________________________________________
________________________
5
Fig
ure
2 P
ressu
re-d
riven m
em
bra
ne p
rocess sp
ectru
m (a
dapte
d fro
m [7
]).
Chapter I: Introduction Chapter I: Introduction ________________________________________________________________________
6
1.2.2 Pressure-driven membrane applications
The application of membrane technology has been extensively reported for several
applications in both upstream and downstream processes, playing a critical role in the
purification of biotechnology products [5]. These applications include a wide range of
processes, such as sterile filtration, clarification, initial recovery, virus removal, protein
concentration, buffer exchange and protein purification [10, 11]. Furthermore, other
applications are contemplated by membrane processes, such as water purification [7, 11],
and nucleic acids (pDNA and RNA) recovery and purification [12, 13]. A summary of the
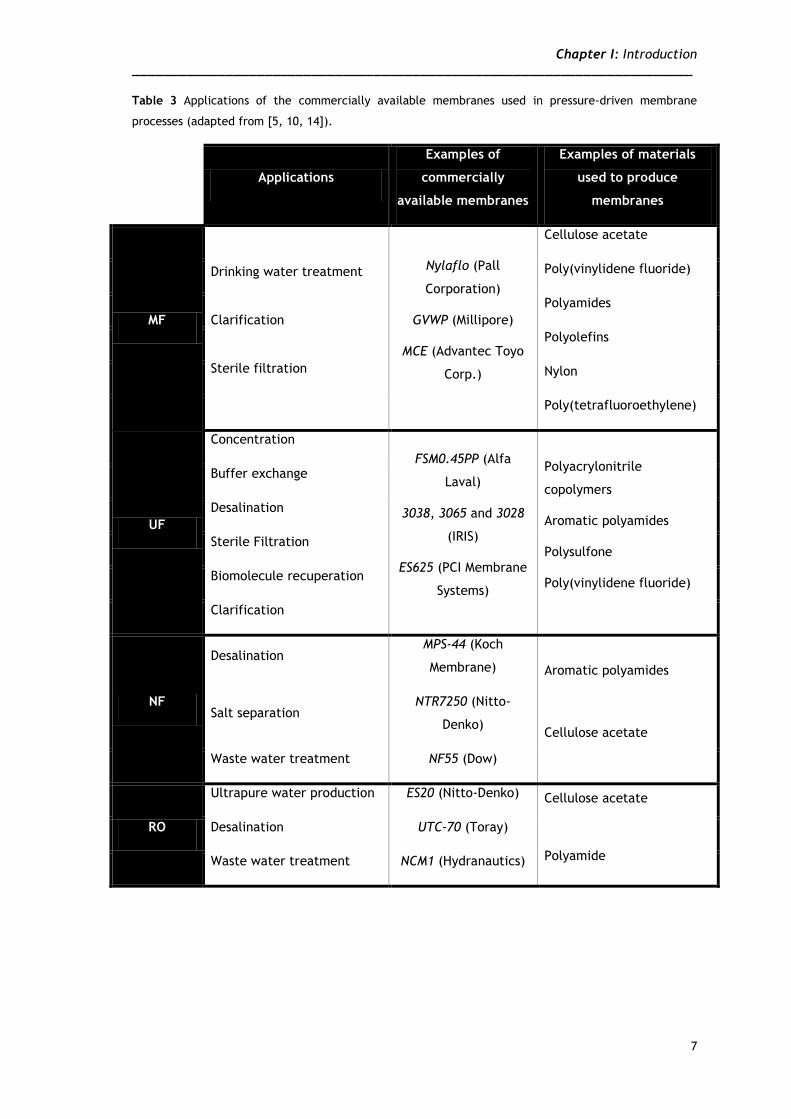
materials, applications and commercial available membranes can be found on Table 3.
Chapter I: Introduction Chapter I: Introduction ________________________________________________________________________
7
Table 3 Applications of the commercially available membranes used in pressure-driven membrane
processes (adapted from [5, 10, 14]).
Applications
Examples of
commercially
available membranes
Examples of materials
used to produce
membranes
MF
Drinking water treatment
Clarification
Sterile filtration
Nylaflo (Pall
Corporation)
GVWP (Millipore)
MCE (Advantec Toyo
Corp.)
Cellulose acetate
Poly(vinylidene fluoride)
Polyamides
Polyolefins
Nylon
Poly(tetrafluoroethylene)
UF
Concentration
FSM0.45PP (Alfa
Laval)
3038, 3065 and 3028
(IRIS)
ES625 (PCI Membrane
Systems)
Polyacrylonitrile
copolymers
Aromatic polyamides
Polysulfone
Poly(vinylidene fluoride)
Buffer exchange
Desalination
Sterile Filtration
Biomolecule recuperation
Clarification
NF
Desalination MPS-44 (Koch
Membrane) Aromatic polyamides
Cellulose acetate
Salt separation NTR7250 (Nitto-
Denko)
Waste water treatment NF55 (Dow)
RO
Ultrapure water production ES20 (Nitto-Denko) Cellulose acetate
Polyamide
Desalination UTC-70 (Toray)
Waste water treatment NCM1 (Hydranautics)
Chapter I: Introduction Chapter I: Introduction ________________________________________________________________________
8
1.2.3 Membrane Properties
Membrane can be defined as semi-permeable barrier capable of separating substances
when applied a driving force across the membrane. The transport through a membrane is
affected by a difference in chemical potential between both sides. This difference may be
caused by a gradient in temperature, pressure, concentration or electrical potential. The
transport is, of course, severely affected by the membrane morphology. Two morphologies
are usually distinguished, dense and porous [3, 7].
Dense membranes are permeable to single molecules, being the transport mechanism
described by the solution diffusion model [15]. This model explains processes like dialysis,
reverse osmosis, gas permeation and pervaporation. According to this model the permeability
of a component is directly related to its diffusivity and solubility in the membrane material.
With this in mind it is possible to conclude that the transport, in this sort of models, is
material dependent, since the diffusivity and solubility of a component depend of its
interactions with the membrane material. It is important to retain that the permeability is, in
fact, an intrinsic property of the membrane material that shows the membrane transport
capacity [3].
The transport in porous membranes is performed through empty spaces (i.e. pores).
Hence, the transport, in this case, is primarily governed by membrane morphology, although
the interaction with the internal membrane surface may also influence. Membrane
morphology comprises the surface and volume porosity, pore size distribution and tortuosity.
The tortuosity constitutes a correction for the deviation of the pore shape from perfect
cylinders, defined by the ratio of the average path length through the pores and the
membrane thickness. Permeability values for porous membranes also indicate the capacity of
the membrane [3].
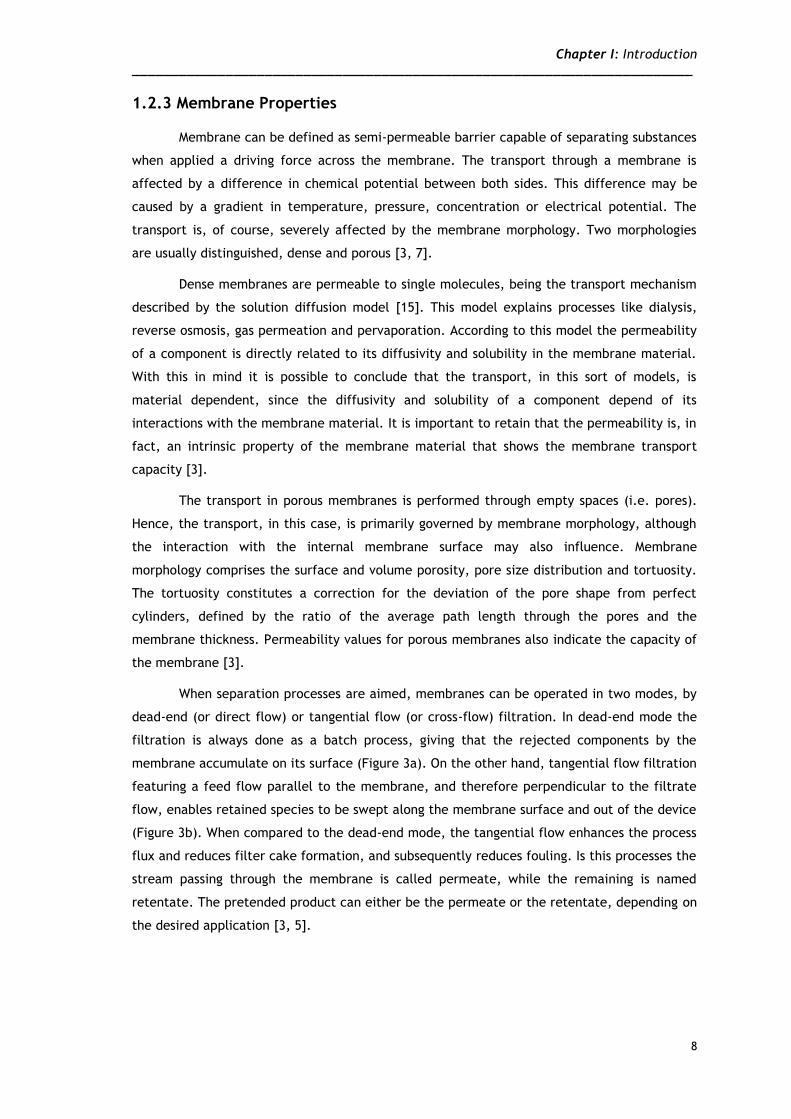
When separation processes are aimed, membranes can be operated in two modes, by
dead-end (or direct flow) or tangential flow (or cross-flow) filtration. In dead-end mode the
filtration is always done as a batch process, giving that the rejected components by the
membrane accumulate on its surface (Figure 3a). On the other hand, tangential flow filtration
featuring a feed flow parallel to the membrane, and therefore perpendicular to the filtrate
flow, enables retained species to be swept along the membrane surface and out of the device
(Figure 3b). When compared to the dead-end mode, the tangential flow enhances the process
flux and reduces filter cake formation, and subsequently reduces fouling. Is this processes the
stream passing through the membrane is called permeate, while the remaining is named
retentate. The pretended product can either be the permeate or the retentate, depending on
the desired application [3, 5].
Chapter I: Introduction Chapter I: Introduction ________________________________________________________________________
9
Figure 3 Modes of operation in membrane separation: (a) dead-end mode and (b) tangential flow mode
(adapted from [14]).
1.2.4 Parameters affecting membrane processes
When designing a membrane process, there are some key characteristics to take into
account, the selectivity, the volumetric flux and the system capacity [11].
The selectivity of the membrane is, of course, determined by the underlying pore size
distribution, but is also affected by the membrane surface properties (e.g. electrically
charged membranes enhance the retention of biomolecules with the same polarity) [11, 16].
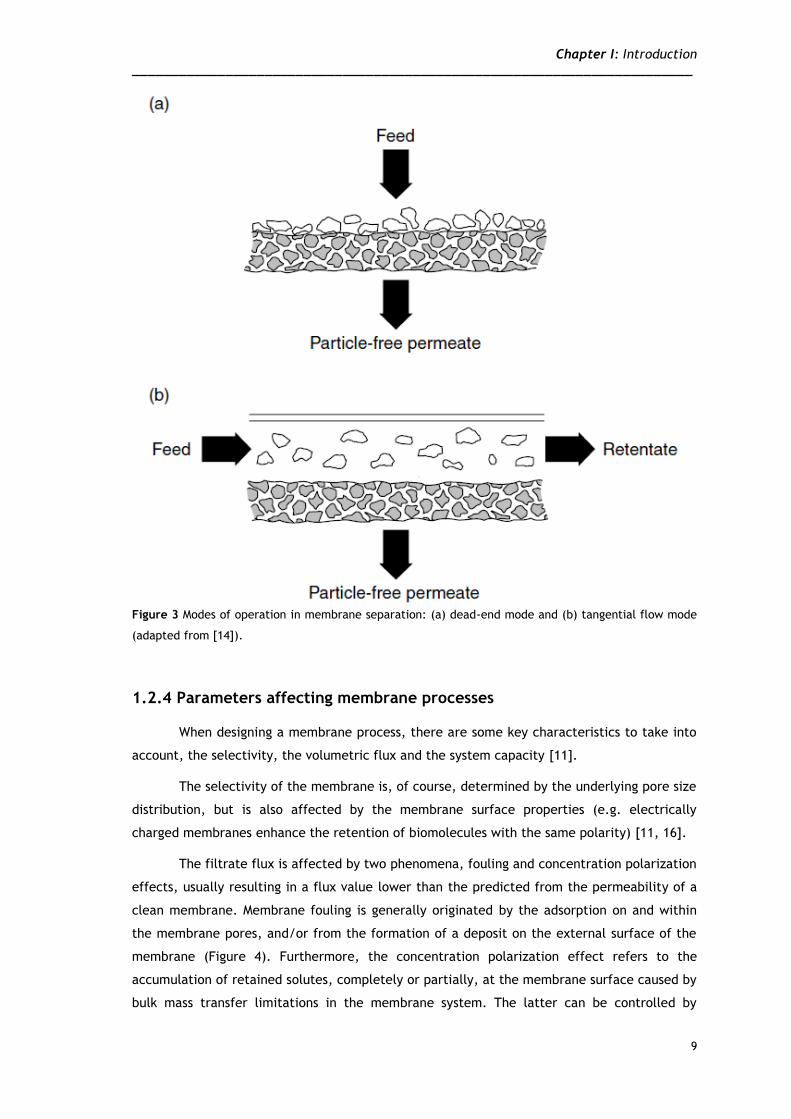
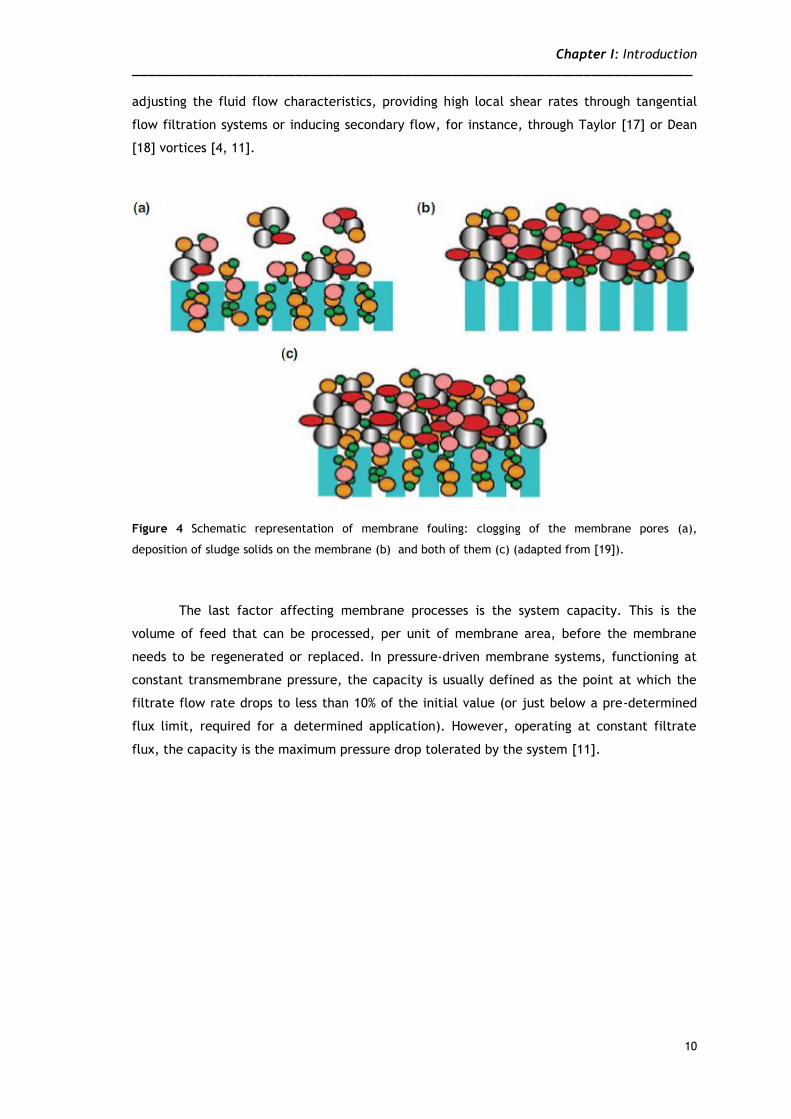
The filtrate flux is affected by two phenomena, fouling and concentration polarization
effects, usually resulting in a flux value lower than the predicted from the permeability of a
clean membrane. Membrane fouling is generally originated by the adsorption on and within
the membrane pores, and/or from the formation of a deposit on the external surface of the
membrane (Figure 4). Furthermore, the concentration polarization effect refers to the
accumulation of retained solutes, completely or partially, at the membrane surface caused by
bulk mass transfer limitations in the membrane system. The latter can be controlled by
Chapter I: Introduction Chapter I: Introduction ________________________________________________________________________
10
adjusting the fluid flow characteristics, providing high local shear rates through tangential
flow filtration systems or inducing secondary flow, for instance, through Taylor [17] or Dean
[18] vortices [4, 11].
Figure 4 Schematic representation of membrane fouling: clogging of the membrane pores (a),
deposition of sludge solids on the membrane (b) and both of them (c) (adapted from [19]).
The last factor affecting membrane processes is the system capacity. This is the
volume of feed that can be processed, per unit of membrane area, before the membrane
needs to be regenerated or replaced. In pressure-driven membrane systems, functioning at
constant transmembrane pressure, the capacity is usually defined as the point at which the
filtrate flow rate drops to less than 10% of the initial value (or just below a pre-determined
flux limit, required for a determined application). However, operating at constant filtrate
flux, the capacity is the maximum pressure drop tolerated by the system [11].
Chapter I: Introduction Chapter I: Introduction ________________________________________________________________________
11
1.3 Plasmid DNA
Plasmid DNA (pDNA) can be used as a vector for gene therapy or vaccination, as
several studies have already reported in the past two decades [20-22]. It has been shown that
the injection of pDNA containing selected genes from pathogens can elicit a protective
immune response [23]. Plasmid DNA vaccines have shown very encouraging results against
malaria and AIDS, and its use is also being investigated against other infectious diseases, such
as hepatitis B and C, and tuberculosis [24, 25].
Plasmid DNA vaccines are believed to mimic natural intracellular pathogen gene
expression pathways, triggering cellular and humoral responses, and this way Overall, DNA-
based vaccines are quite safe, due to lack of genetic integration (i.e. the injected foreign
genetic material will not be integrated in the host genetic material) and absence of specific
immune response to the plasmid itself [24, 25].
1.3.1 Plasmid DNA purification
The ever-increasing use of plasmid DNA as a biopharmaceutical, created a demand for
simple, robust and scalable purification processes that can enable the isolation of pDNA from
transformed bacteria. There are, in fact, several processes described in the literature for the
isolation of small amounts of pure pDNA, although these are mostly useful in a laboratory
environment, and considered unsafe (e.g. due to the utilization of harmful chemicals), or
impractical, when inserted into large scale operations [12].
The first step of pDNA downstream process, is the release from transformed bacteria
by cell lysis [13]. There are some techniques available for cell lysis, such as mechanical [26]
and thermal methods [27], as well as alkaline lysis [28]. Alkaline lysis is the most used, as it is
the less aggressive process, and therefore the one that offers higher guarantees of obtaining
undamaged product. Furthermore, alkaline lysis offers not only cell wall disruption, releasing
the pDNA, but also removes a large amount of cell debris, genomic DNA (gDNA) and proteins,
which precipitate upon neutralization, leaving RNA (the major contaminant), as well as low
amounts of gDNA, proteins and endotoxins [13].
To obtain purified pDNA on a large scale, it is of paramount importance to develop a
set of highly efficient processes in terms of yield and absence of harmful chemicals.
Conventional laboratory procedures involve the use of chemicals like cesium chloride or
ethidium bromide, solvents as isopropanol, phenol or chloroform, enzymes (i.e. RNase A,
proteinase K or lysozyme), which allow a selective precipitation of the contaminants, that are
subsequently removed by ultracentrifugation [12, 13]. As already addressed, conventional
laboratory pDNA purification procedures are quite complex to scale up, as some scalable
alternatives were found. Hereupon, purification processes that use membranes were found as
Chapter I: Introduction Chapter I: Introduction ________________________________________________________________________
12
a good solution to purify pDNA at a larger scale, without using potentially harmful chemicals
[12, 13].
1.4 Nanofiber production techniques
Lately several processing techniques have been used to produce polymeric nanofibers,
such as drawing [29], template synthesis [30], phase separation [31], self-assembly [32] and
electrospinning [33], among others. The drawing process is closely related to a dry spinning,
used in the fiber industry, making one-by-one single long fibers. This process is, however,
limited to viscoelastic materials, the ones that can undergo strong deformations as well as
the stresses developed during fibers production through drawing [34]. In the case of template
synthesis, a nanoporous membrane is used as a template to produce the nanofibers, making
either solid (i.e. fibril) or hollow (i.e. tubule) shaped nanofibers. The best feature of this
template synthesis is the variety of raw materials (e.g. electronically conducting polymers,
metals, semiconductors, carbons) from which the nanofibers can be made. Nonetheless, this
method of fabrication is limited, as it cannot make one-by-one continuous nanofibers.
Furthermore, phase separation comprises processes of dissolution, gelation, extraction
applying different solvent systems, freezing and drying process to obtain a nanoscale porous
foam. The long period that takes to transfer the solid polymer into a nano-porous foam, is a
limitation to the process. Finally, concerning the self-assembly process, where individual
components organize themselves to achieve desired patterns and functions. The major
drawbacks related to this process are, the complexity and excessive time elapsed to process
continuous polymer nanofibers.
Hereupon, electrospinning appears as a simple and cheap method to produce one-by-
one continuous nanofibers, being able to apply a wide range of polymers, or mixtures of
polymers [34, 35]. This method has gained much attention in the past decade, as a versatile
technique that offers unique features to make nanofibrous materials with controllable pore
structure. The diameter of the fibers produced using electrical forces range from only 2
nanometers to some micrometers, as it is difficult to consistently obtain submicron fibers
from standard mechanical fiber-spinning techniques [36-38]. Being a relatively straight-
forward method of fiber production, electrospinning was found very helpful in a wide range of
applications, including tissue engineering applications, like for instance in bone repair [39],
wound healing [40] and drug delivery systems [41], but also in sensors and biosensors [42],
electrodes [43] and filtration processes [35].
Chapter I: Introduction Chapter I: Introduction ________________________________________________________________________
13
1.4.1 Electrospinning process
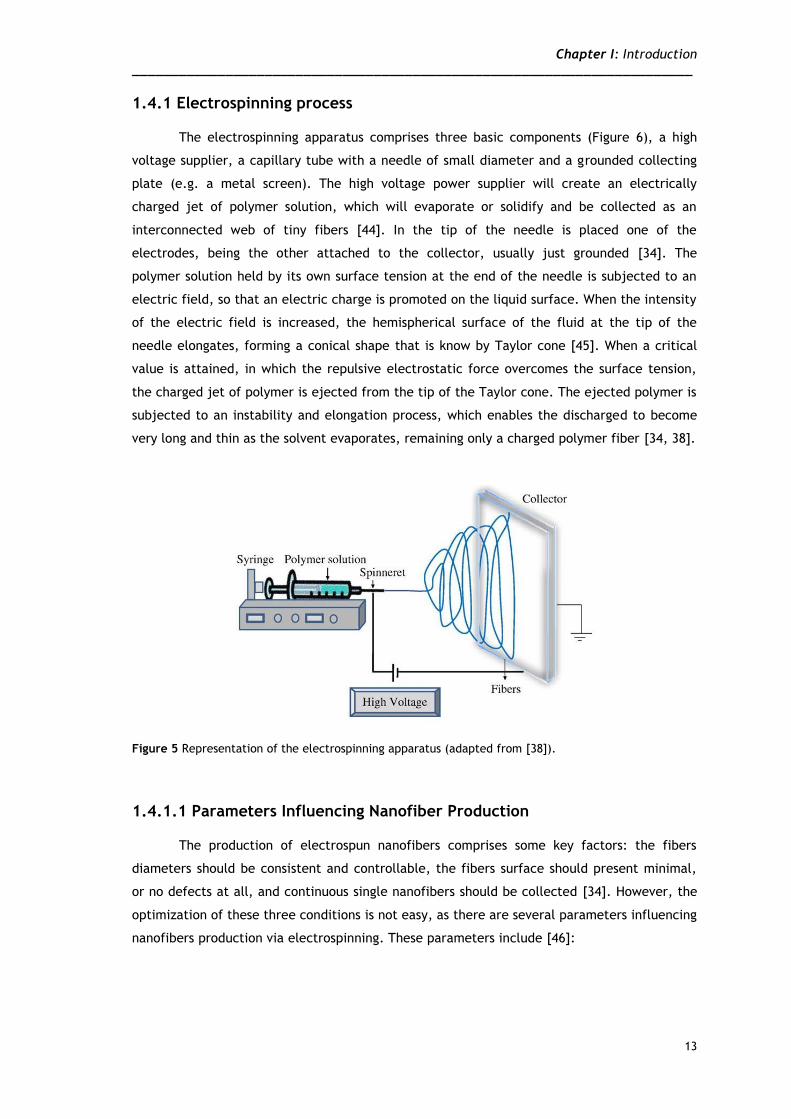
The electrospinning apparatus comprises three basic components (Figure 6), a high
voltage supplier, a capillary tube with a needle of small diameter and a grounded collecting
plate (e.g. a metal screen). The high voltage power supplier will create an electrically
charged jet of polymer solution, which will evaporate or solidify and be collected as an
interconnected web of tiny fibers [44]. In the tip of the needle is placed one of the
electrodes, being the other attached to the collector, usually just grounded [34]. The
polymer solution held by its own surface tension at the end of the needle is subjected to an
electric field, so that an electric charge is promoted on the liquid surface. When the intensity
of the electric field is increased, the hemispherical surface of the fluid at the tip of the
needle elongates, forming a conical shape that is know by Taylor cone [45]. When a critical
value is attained, in which the repulsive electrostatic force overcomes the surface tension,
the charged jet of polymer is ejected from the tip of the Taylor cone. The ejected polymer is
subjected to an instability and elongation process, which enables the discharged to become
very long and thin as the solvent evaporates, remaining only a charged polymer fiber [34, 38].
Figure 5 Representation of the electrospinning apparatus (adapted from [38]).
1.4.1.1 Parameters Influencing Nanofiber Production
The production of electrospun nanofibers comprises some key factors: the fibers
diameters should be consistent and controllable, the fibers surface should present minimal,
or no defects at all, and continuous single nanofibers should be collected [34]. However, the
optimization of these three conditions is not easy, as there are several parameters influencing
nanofibers production via electrospinning. These parameters include [46]:
Chapter I: Introduction Chapter I: Introduction ________________________________________________________________________
14
solution properties, such as viscosity, elasticity, conductivity, and surface tension,
processing variables, such as hydrostatic pressure, electric potential at the needle
tip, distance between the collector and the needle tip, the type of collector (e.g.
static, rotational) and flow rate,
ambient related parameters, such as solution temperature, humidity and air velocity
inside the electrospinning chamber.
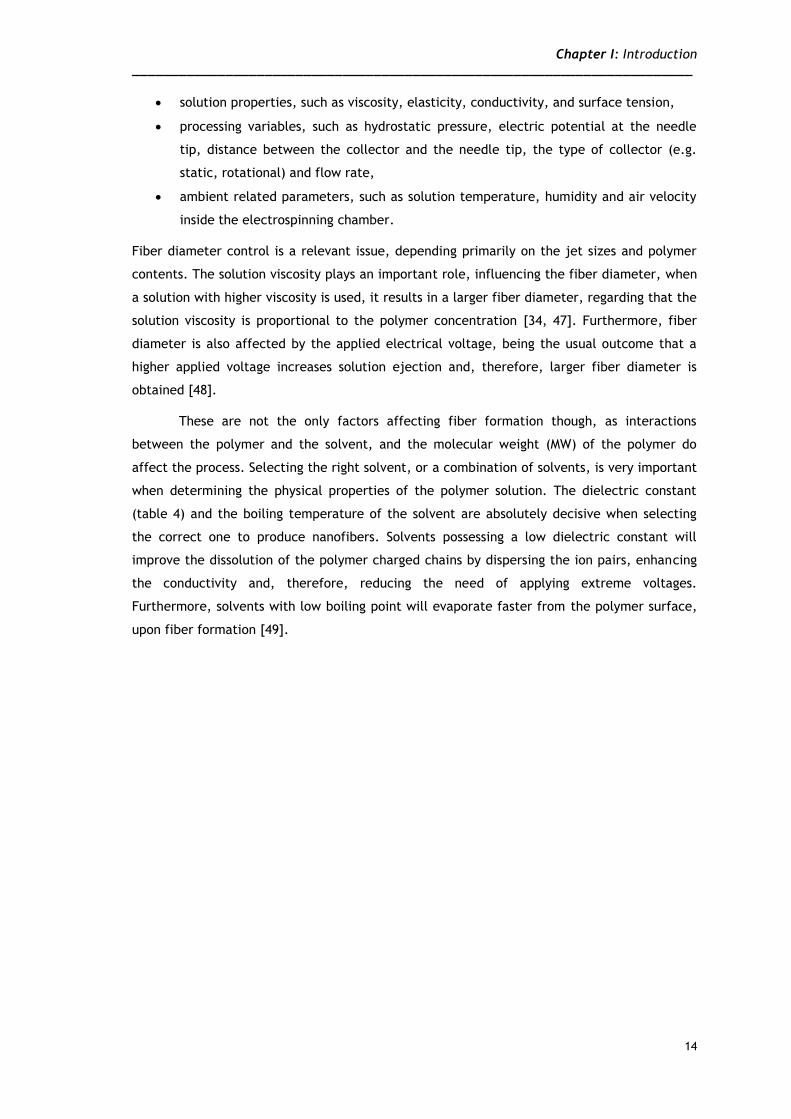
Fiber diameter control is a relevant issue, depending primarily on the jet sizes and polymer
contents. The solution viscosity plays an important role, influencing the fiber diameter, when
a solution with higher viscosity is used, it results in a larger fiber diameter, regarding that the
solution viscosity is proportional to the polymer concentration [34, 47]. Furthermore, fiber
diameter is also affected by the applied electrical voltage, being the usual outcome that a
higher applied voltage increases solution ejection and, therefore, larger fiber diameter is
obtained [48].
These are not the only factors affecting fiber formation though, as interactions
between the polymer and the solvent, and the molecular weight (MW) of the polymer do
affect the process. Selecting the right solvent, or a combination of solvents, is very important
when determining the physical properties of the polymer solution. The dielectric constant
(table 4) and the boiling temperature of the solvent are absolutely decisive when selecting
the correct one to produce nanofibers. Solvents possessing a low dielectric constant will
improve the dissolution of the polymer charged chains by dispersing the ion pairs, enhancing
the conductivity and, therefore, reducing the need of applying extreme voltages.
Furthermore, solvents with low boiling point will evaporate faster from the polymer surface,
upon fiber formation [49].
Chapter I: Introduction Chapter I: Introduction ________________________________________________________________________
15
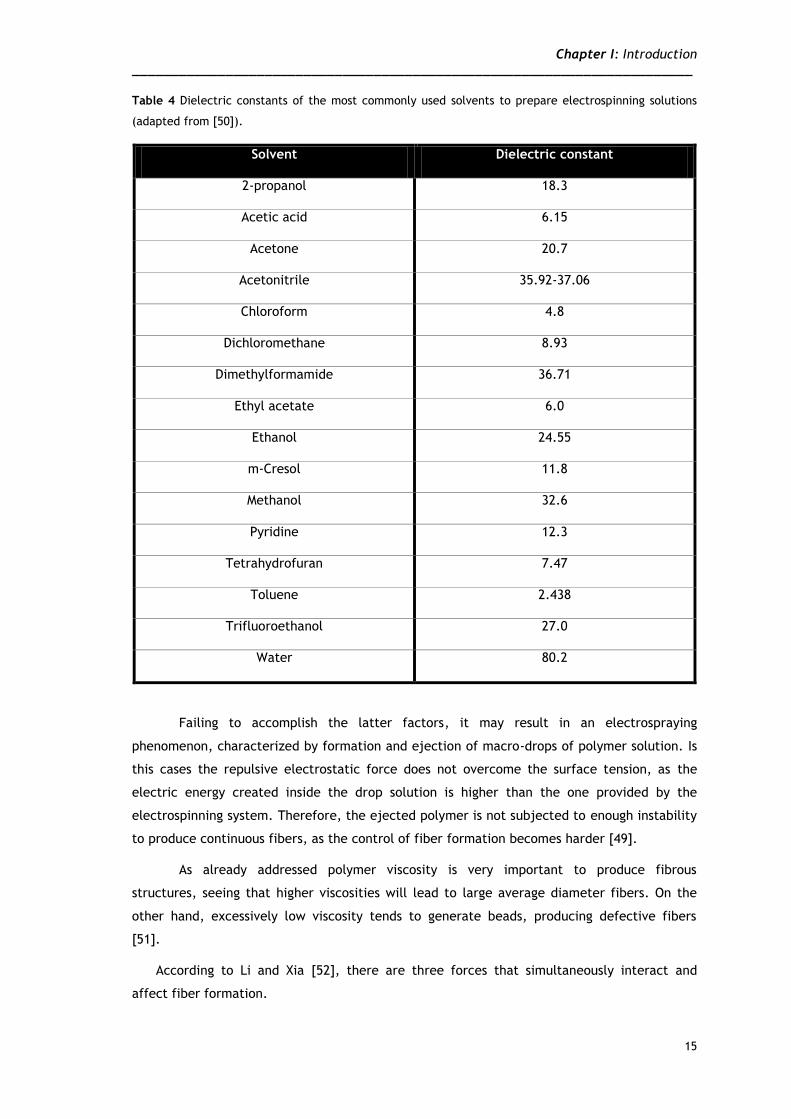
Table 4 Dielectric constants of the most commonly used solvents to prepare electrospinning solutions
(adapted from [50]).
Solvent Dielectric constant
2-propanol 18.3
Acetic acid 6.15
Acetone 20.7
Acetonitrile 35.92-37.06
Chloroform 4.8
Dichloromethane 8.93
Dimethylformamide 36.71
Ethyl acetate 6.0
Ethanol 24.55
m-Cresol 11.8
Methanol 32.6
Pyridine 12.3
Tetrahydrofuran 7.47
Toluene 2.438
Trifluoroethanol 27.0
Water 80.2
Failing to accomplish the latter factors, it may result in an electrospraying
phenomenon, characterized by formation and ejection of macro-drops of polymer solution. Is
this cases the repulsive electrostatic force does not overcome the surface tension, as the
electric energy created inside the drop solution is higher than the one provided by the
electrospinning system. Therefore, the ejected polymer is not subjected to enough instability
to produce continuous fibers, as the control of fiber formation becomes harder [49].
As already addressed polymer viscosity is very important to produce fibrous
structures, seeing that higher viscosities will lead to large average diameter fibers. On the
other hand, excessively low viscosity tends to generate beads, producing defective fibers
[51].
According to Li and Xia [52], there are three forces that simultaneously interact and
affect fiber formation.
Chapter I: Introduction Chapter I: Introduction ________________________________________________________________________
16
The surface tension is responsible for converting the liquid jet into one or several
spherical droplets through the minimization of the surface area.
The electrostatic repulsion between different charges on the jet surface is likely to
increase the surface area, favoring the formation of a thin jet, a key parameter for
the electrospinning process.
Viscoelastic forces tend to resist sudden changes in the shape, as well as support the
formation of fibers with smooth surface.
Hereupon, bead formation can be eliminated if the combined effect of the
electrostatic repulsion and viscoeleastic forces is able to overcome the influence of the
surface tension.
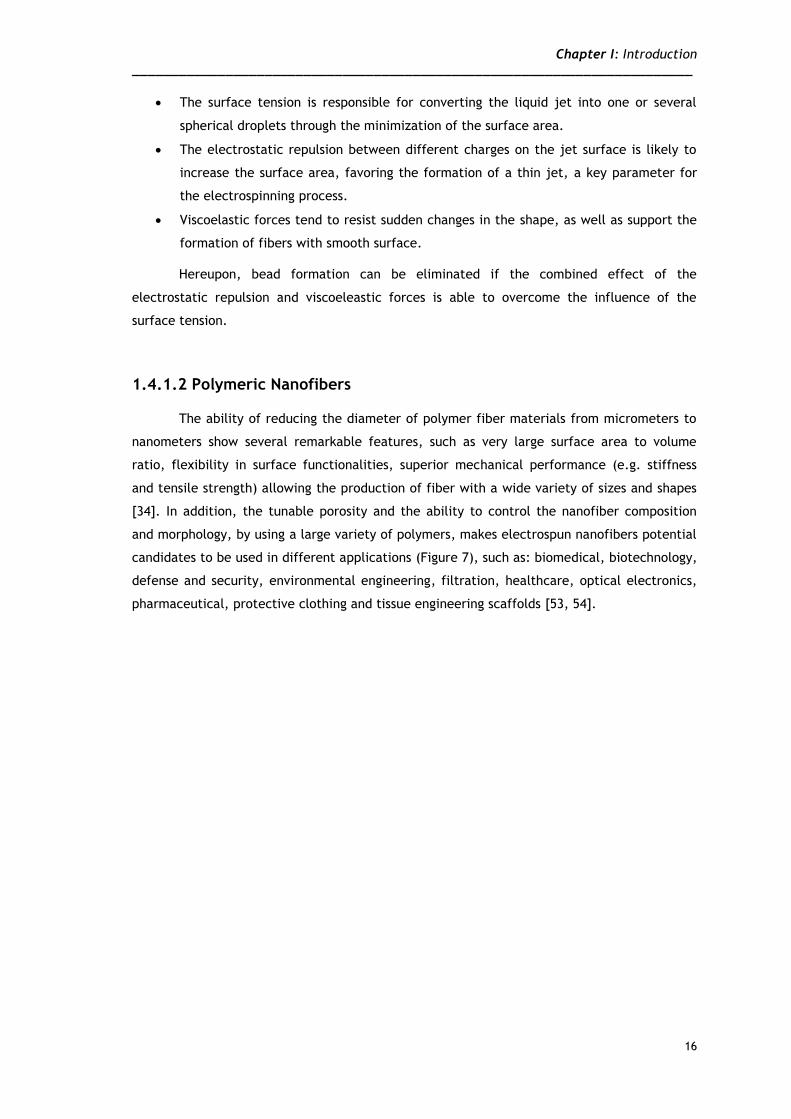
1.4.1.2 Polymeric Nanofibers
The ability of reducing the diameter of polymer fiber materials from micrometers to
nanometers show several remarkable features, such as very large surface area to volume
ratio, flexibility in surface functionalities, superior mechanical performance (e.g. stiffness
and tensile strength) allowing the production of fiber with a wide variety of sizes and shapes
[34]. In addition, the tunable porosity and the ability to control the nanofiber composition
and morphology, by using a large variety of polymers, makes electrospun nanofibers potential
candidates to be used in different applications (Figure 7), such as: biomedical, biotechnology,
defense and security, environmental engineering, filtration, healthcare, optical electronics,
pharmaceutical, protective clothing and tissue engineering scaffolds [53, 54].
Chapter I: Introduction Chapter I: Introduction ________________________________________________________________________
17
Figure 6 Representation of the areas of application of the polymeric nanofibers (adapted from [38]).
The application of electrospun nanofibers for the production of tissue engineering
scaffolds, for wound healing, drug delivery or bone regeneration, has been increasing in the
past few years [38]. To engineer living tissue, a biodegradable scaffold is crucial to be applied
as a temporary template, enabling cell seeding, invasion, proliferation and differentiation,
leading to restore the biological function of the tissue or of the extracellular matrix (ECM)
[38]. Electrospinning has been reported to create nanofibrous scaffolds, very useful in tissue
engineering, as they have been shown to promote cell-matrix and cell-cell interactions,
maintaining the normal phenotypic shape and gene expression of the cells [55, 56].
Furthermore, electrospun fibers show similar diameter magnitude when compared to the ECM
fibrils, mimicking the environment in natural tissues, and demonstrated also effectiveness as
substrate for cell growth [57].
Nowadays, a wide variety of polymeric nanofibers has been tested as a scaffold for
tissue engineering purposes, including in cartilage [58], skin [59], bone [60], arterial blood
vessels [61], heart [62] and nerves [63], among others.
In the present thesis three polymers were used to produce an electrospun nanofiber
membrane (ENM), poly ε-caprolactone (PCL), poly(ethylene) oxide (PEO) and sodium alginate
(SA). PCL was selected as a support, based on the good mechanical properties (e.g. strength
Chapter I: Introduction Chapter I: Introduction ________________________________________________________________________
18
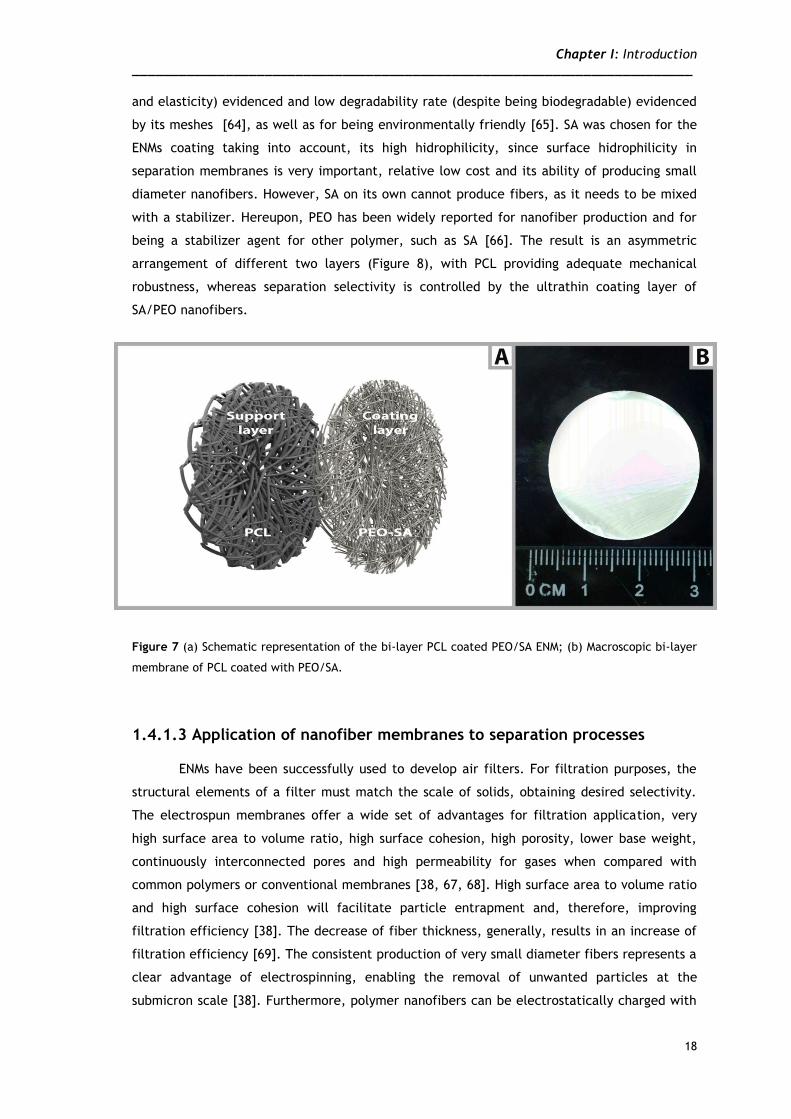
and elasticity) evidenced and low degradability rate (despite being biodegradable) evidenced
by its meshes [64], as well as for being environmentally friendly [65]. SA was chosen for the
ENMs coating taking into account, its high hidrophilicity, since surface hidrophilicity in
separation membranes is very important, relative low cost and its ability of producing small
diameter nanofibers. However, SA on its own cannot produce fibers, as it needs to be mixed
with a stabilizer. Hereupon, PEO has been widely reported for nanofiber production and for
being a stabilizer agent for other polymer, such as SA [66]. The result is an asymmetric
arrangement of different two layers (Figure 8), with PCL providing adequate mechanical
robustness, whereas separation selectivity is controlled by the ultrathin coating layer of
SA/PEO nanofibers.
Figure 7 (a) Schematic representation of the bi-layer PCL coated PEO/SA ENM; (b) Macroscopic bi-layer
membrane of PCL coated with PEO/SA.
1.4.1.3 Application of nanofiber membranes to separation processes
ENMs have been successfully used to develop air filters. For filtration purposes, the
structural elements of a filter must match the scale of solids, obtaining desired selectivity.
The electrospun membranes offer a wide set of advantages for filtration application, very
high surface area to volume ratio, high surface cohesion, high porosity, lower base weight,
continuously interconnected pores and high permeability for gases when compared with
common polymers or conventional membranes [38, 67, 68]. High surface area to volume ratio
and high surface cohesion will facilitate particle entrapment and, therefore, improving
filtration efficiency [38]. The decrease of fiber thickness, generally, results in an increase of
filtration efficiency [69]. The consistent production of very small diameter fibers represents a
clear advantage of electrospinning, enabling the removal of unwanted particles at the
submicron scale [38]. Furthermore, polymer nanofibers can be electrostatically charged with
Chapter I: Introduction Chapter I: Introduction ________________________________________________________________________
19
the purpose of attracting particles without increasing the pressure drop, further enhancing
the filtration efficiency [70].
ENMs have been reported for application in separation processes, especially in
pressure-driven separations, such as MF, UF or NF [67, 71-73]. The application of ENMs
requires a support to provide strength, unlike conventional cast membranes. Therefore,
nowadays ENMs used in membrane separation technology are based in hybrid systems. In this
kind of systems, electrospun nanofibers are placed over a support, combined in various layers
or blended together with micron scale fibers [68].

Chapter I: Introduction Chapter I: Introduction ________________________________________________________________________
20
1.5 Objectives
In the present study an electrospinning technique was used in order to produce a bi-
layer nanofiber membrane for recuperation of biotechnology products. The present master
thesis work plan had the following aims:
- Electrospun of PCL and PEO-SA nanofibers to produce the ENMs;
- Characterization of the properties of the produced EMNs and commercial membranes
by Scanning electron microscopy (SEM), Attenuated total reflectance-fourier
transform infrared spectroscopy (ATR-FTIR), determination of the Contact angles and
Membrane porosity;
- Evaluation of the filtration performance for both the ENMs and commercial
membranes.
Materials & Methods
Chapter II
Chapter II: Materials & Methods Chapter I: Introduction ________________________________________________________________________
22
2. Materials and methods
2.1 Materials
Calcium chloride (Mw=110.99 g/mol), PEO (Mw=300,000 g/mol), PCL (Mw=80,000 g/mol), SA
(Mw=120000–190,000g/mol), were purchased from Sigma–Aldrich (Sintra, Portugal) as well as
Terrific Broth medium for bacterial culture and kanamycin sulfate. P1 buffer (50mM Tris–HCl,
pH=8.00, 10 mM EDTA and 100 µg/mL of RNase A), P2 buffer (200 mM NaOH and 1% SDS (w/v))
and P3 buffer (3M of potassium acetate, pH 5.00) were obtained from a Qiagen Plasmid Maxi
Kit and Tris–HCl 10 mM (IZASA, Portugal). Microfiltration membranes, Nylaflo (pore diameter
of 0.22 µm Pall Corporation and FSM0.45PP from Alfa Laval (pore diameter of 0.45 µm).
2.2 Methods
2.2.1 Bacterial growth and cell lysis
The plasmid production procedure was adapted from the literature [13, 74]. The 6050
bp plasmid pVAX1-LacZ was amplified in a cell culture of Escherichia coli (E. coli) DH5α. The
fermentation was carried out at 37 ˚C in 250 mL of Terrific Broth medium, supplemented
with 50 µg/mL of kanamycin. Growth was suspended at the late log phase (OD600_nm ≈ 10–11)
and cells were harvested by centrifugation. Afterwards, pDNA extraction was performed by
alkaline lysis using three different buffers (P1, P2 and P3, previously specified). For this
procedure 120 g/L (wet weight) of cells were resuspended in 4 mL of P1 buffer. Then, 4 mL of
P2 were added to promote cell lysis for 5 min, at room temperature. Finally, P3 buffer, at 4
˚C, was added to neutralize the alkaline solution. A large quantity of suspended solids was
obtained upon neutralization and the suspension was kept on ice for 15 min before membrane
filtration.
2.2.2 Electrospinning setup
The system used herein to carry out the electrospinning process was composed by a
high power voltage supply (Spellman CZE1000R, 0–30 kV), a syringe pump (KDS-100), a syringe
fitted with a stainless steel blunt end needle and an aluminum plate as the conductive
collector (10 cm x 12 cm). The needle was positively charged by the power supply and the
metal collector was grounded. The charged tip and grounded collector form a static electric
field between them, to provide the driving force that enables fiber formation [38].
Chapter II: Materials & Methods Chapter I: Introduction ________________________________________________________________________
23
2.2.3 Preparation of the polymer solutions
PCL was dissolved in acetone to a concentration of 10% (w/v), under constant stirring
and heating at 50 ˚C [75]. Meanwhile, a PEO/SA solution was prepared by mixing 6.75% PEO
and 0.5% SA aqueous solutions [76].
2.2.4 Electrospun nanofiber membranes production
The PCL polymer solution was used to produce a support ENM, using a constant flow
rate and different voltages. Subsequently, the PEO/SA solution was deposited over the PCL
ENM by electrospinning, in the same apparatus, at a constant flow rate, with a similar
voltage, thereby obtaining a bi-layer ENM. Finally, the membrane was crosslinked in a
calcium chloride solution for 24 h [76]. From the obtained films, membranes disks were cut
with suitable size to be used in the filtration cell, using a circular blade.
2.2.5 Membrane filtration tests
These assays were performed in a 10mL stirred cell (Amicon/Millipore, model 8010),
according to a previously described procedure [13]. The membranes to be tested (Nylaflo,
FSM0.45PP or the ENMs) were initially flushed with 20 mL of Milli-Q water at a constant
pressure of 0.07 bar, to ensure the thorough washing of the membranes. Then, the water
permeability (hydraulic permeability) of each membrane was determined by measuring the
flow rate, at that pressure. Five permeability measurements were performed with each
membrane disk and the average value was considered the initial hydraulic permeability of
each membrane disk, Lp0.
To perform the filtration of the E. coli DH5α lysates the remaining water in the cell
was carefully removed and, immediately after that, 10 mL of lysate were introduced in the
filtration cell. A continuous diafiltration of the lysate was performed for 1h, using a 10 mM
Tris–HCl (pH=8.00) buffer at a constant flow rate of 0.5 mL/min. Two peristaltic pumps were
used, one for feeding the diafiltration buffer and the other to perform the filtration (by
suction). The experimental setup is shown in Figure 9. Under these conditions, one could
estimate that, if no pDNA was adsorbed on the membrane and the membrane rejection was 0,
approximately 95% of the pDNA was expected to be recovered in the permeate, while 5%
would remain in the cell. It was decided not to try to recover the remaining pDNA to avoid
excessive dilution of the whole permeate.
Chapter II: Materials & Methods Chapter I: Introduction ________________________________________________________________________
24
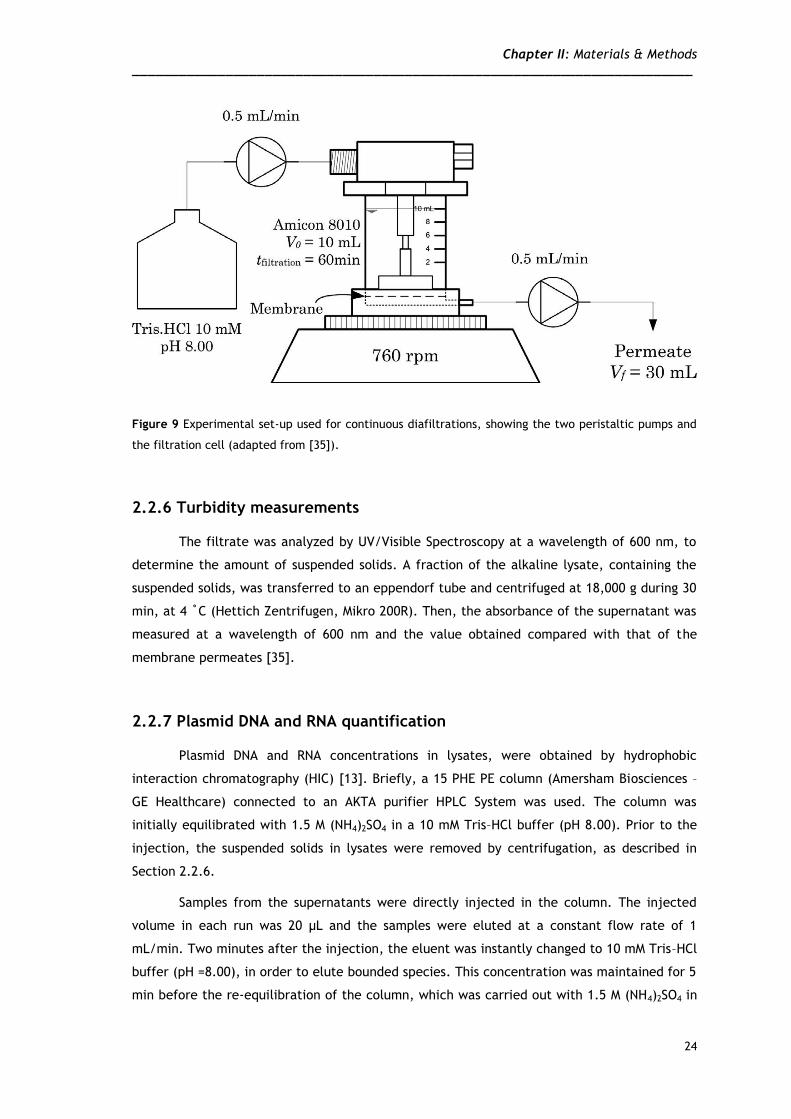
Figure 9 Experimental set-up used for continuous diafiltrations, showing the two peristaltic pumps and
the filtration cell (adapted from [35]).
2.2.6 Turbidity measurements
The filtrate was analyzed by UV/Visible Spectroscopy at a wavelength of 600 nm, to
determine the amount of suspended solids. A fraction of the alkaline lysate, containing the
suspended solids, was transferred to an eppendorf tube and centrifuged at 18,000 g during 30
min, at 4 ˚C (Hettich Zentrifugen, Mikro 200R). Then, the absorbance of the supernatant was
measured at a wavelength of 600 nm and the value obtained compared with that of the
membrane permeates [35].
2.2.7 Plasmid DNA and RNA quantification
Plasmid DNA and RNA concentrations in lysates, were obtained by hydrophobic
interaction chromatography (HIC) [13]. Briefly, a 15 PHE PE column (Amersham Biosciences –
GE Healthcare) connected to an AKTA purifier HPLC System was used. The column was
initially equilibrated with 1.5 M (NH4)2SO4 in a 10 mM Tris–HCl buffer (pH 8.00). Prior to the
injection, the suspended solids in lysates were removed by centrifugation, as described in
Section 2.2.6.
Samples from the supernatants were directly injected in the column. The injected
volume in each run was 20 µL and the samples were eluted at a constant flow rate of 1
mL/min. Two minutes after the injection, the eluent was instantly changed to 10 mM Tris–HCl
buffer (pH =8.00), in order to elute bounded species. This concentration was maintained for 5
min before the re-equilibration of the column, which was carried out with 1.5 M (NH4)2SO4 in
Chapter II: Materials & Methods Chapter I: Introduction ________________________________________________________________________
25
a 10mM Tris–HCl buffer (pH8.00), in order to prepare the column for the next run. The
absorbance of the eluate at 260 nm was monitored. The concentration of pDNA in each
sample was calculated from the area of the pDNA peak and a calibration curve, obtained with
pure pVAX1-lacZ standard solutions. The filtration yield, in each test, was calculated as the
ratio of the amount of pDNA in the whole collected permeate, to the amount of pDNA in the
lysate. The RNA removal was calculated as 1-(VpCRNA,p)/(VlysCRNA,lys) where CRNA,p is the RNA
concentration in the whole collected permeate and CRNA,lys is the RNA concentration in the
lysate, Vp is the volume of whole the permeate collected and Vlys is the volume of lysate
processed in each run.
2.2.8 Scanning electron microscopy
The morphology of all the membranes was analyzed by scanning electron microscopy
(SEM). Samples were air-dried overnight and then mounted on an aluminum board using a
double-side adhesive tape and covered with gold using an Emitech K550 (London, England)
sputter coater. The samples were analyzed using a Hitachi S-2700 (Tokyo, Japan) scanning
electron microscope operated at an accelerating voltage of 20 kV and at different
amplifications [35].
The diameter distribution of the nanofibers in the ENMs was determined from 50
measurements, at least, using ImageJ (National Institutes of Health, Bethesda (MD), USA).
2.2.9 Attenuated total reflectance-fourier transform infrared spectroscopy
PEO, SA, PCL and polymer coated ENMs spectra were acquired in the range of 4000–
500 cm-1, using a JASCO 4200 FTIR spectrophotometer, operating in ATR mode (MKII
GoldenGate™ Single Reflexion ATR System). Data collection was performed with a 4 cm-1
spectral resolution and after 64 scans [35].
2.2.10 Contact angle determination
Contact angles of the membranes were determined using a Data Physics Contact Angle
System OCAH 200 apparatus, operating in static mode. For each sample, water drops were
placed at various locations of the analyzed surface, at room temperature. The reported
contact angles are the average of at least three measurements [35].
Chapter II: Materials & Methods Chapter I: Introduction ________________________________________________________________________
26
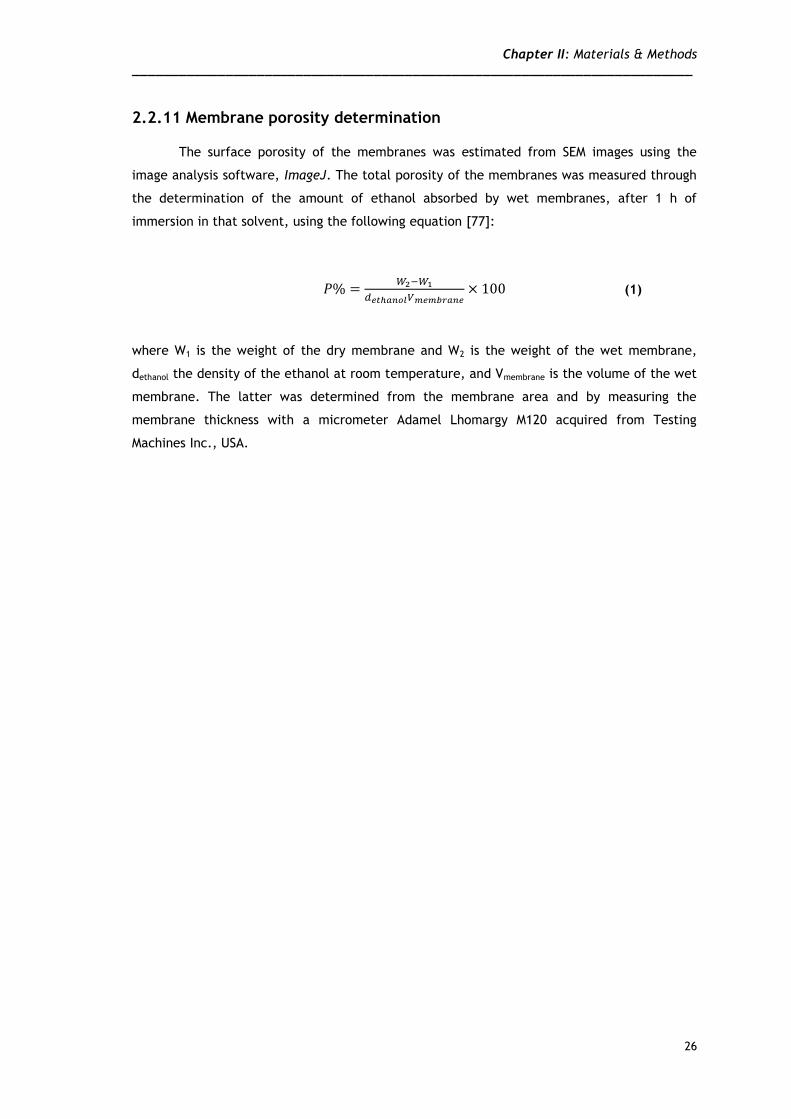
2.2.11 Membrane porosity determination
The surface porosity of the membranes was estimated from SEM images using the
image analysis software, ImageJ. The total porosity of the membranes was measured through
the determination of the amount of ethanol absorbed by wet membranes, after 1 h of
immersion in that solvent, using the following equation [77]:
where W1 is the weight of the dry membrane and W2 is the weight of the wet membrane,
dethanol the density of the ethanol at room temperature, and Vmembrane is the volume of the wet
membrane. The latter was determined from the membrane area and by measuring the
membrane thickness with a micrometer Adamel Lhomargy M120 acquired from Testing
Machines Inc., USA.
(1)
Results & Discussion
Chapter III
Chapter III: Results & Discussion Chapter I: Introduction ________________________________________________________________________
28
3. Results and discussion
3.1 ENMs characterization
3.1.1 Morphological characterization
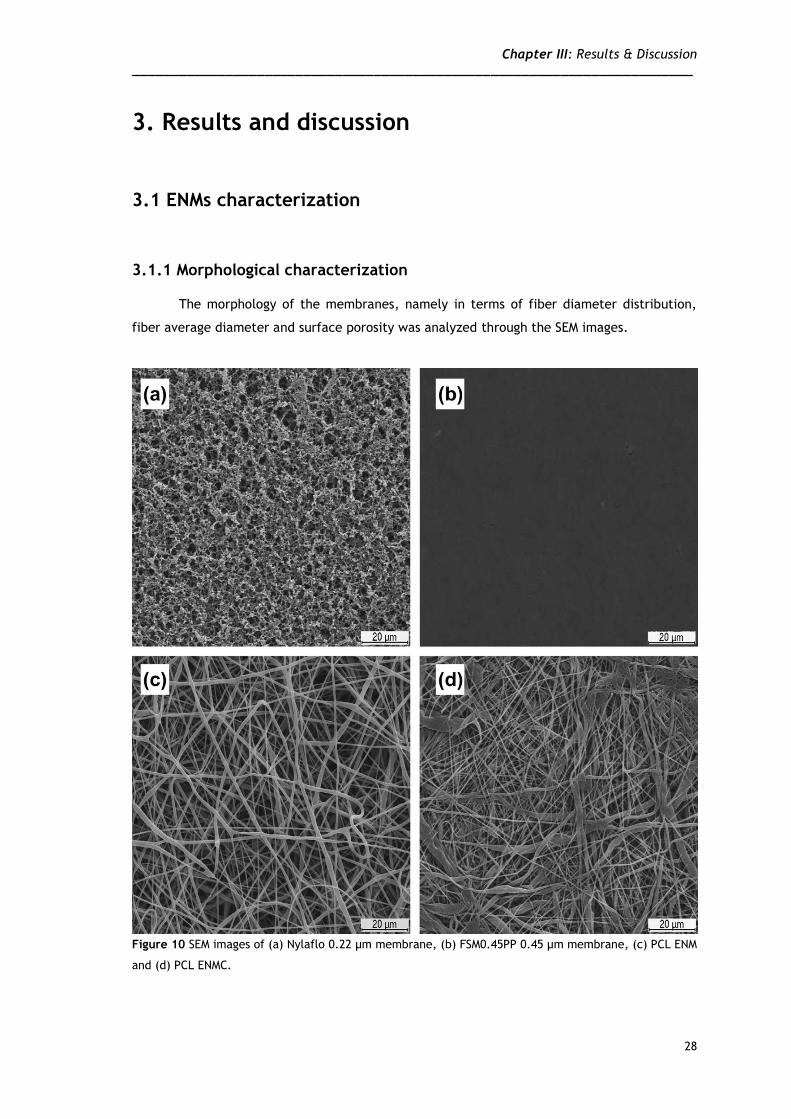
The morphology of the membranes, namely in terms of fiber diameter distribution,
fiber average diameter and surface porosity was analyzed through the SEM images.
Figure 10 SEM images of (a) Nylaflo 0.22 µm membrane, (b) FSM0.45PP 0.45 µm membrane, (c) PCL ENM
and (d) PCL ENMC.
Chapter III: Results & Discussion Chapter I: Introduction ________________________________________________________________________
29
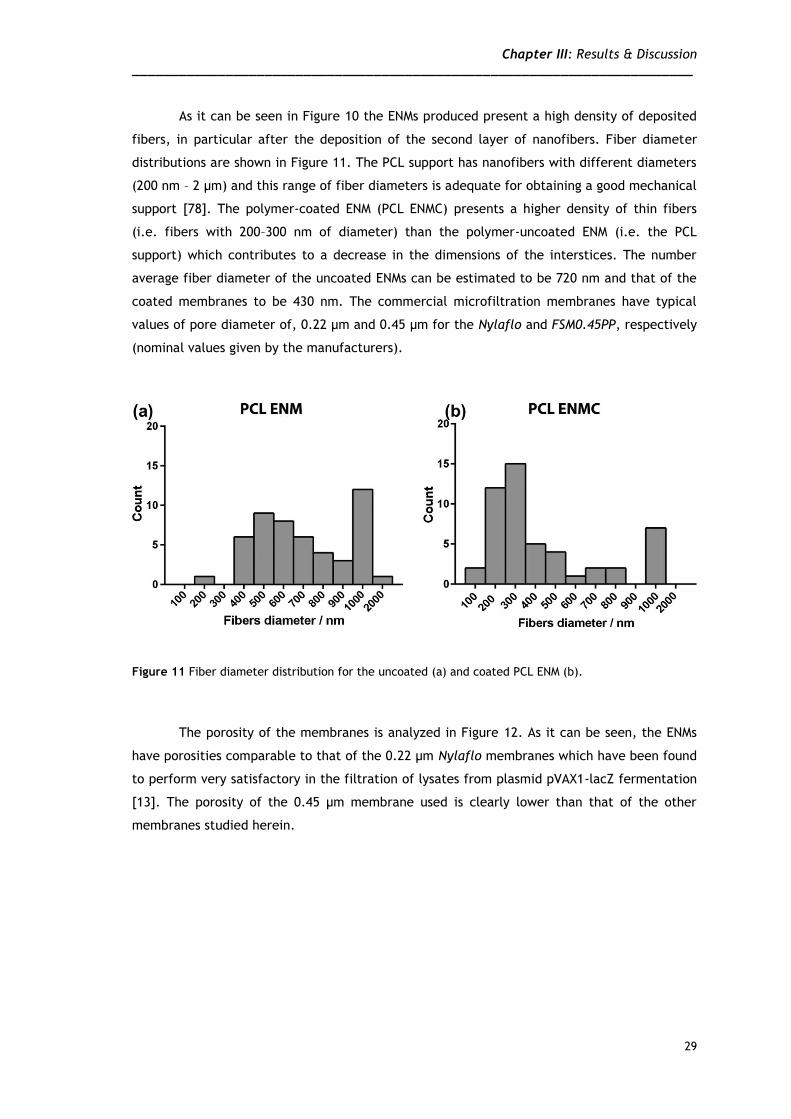
As it can be seen in Figure 10 the ENMs produced present a high density of deposited
fibers, in particular after the deposition of the second layer of nanofibers. Fiber diameter
distributions are shown in Figure 11. The PCL support has nanofibers with different diameters
(200 nm – 2 µm) and this range of fiber diameters is adequate for obtaining a good mechanical
support [78]. The polymer-coated ENM (PCL ENMC) presents a higher density of thin fibers
(i.e. fibers with 200–300 nm of diameter) than the polymer-uncoated ENM (i.e. the PCL
support) which contributes to a decrease in the dimensions of the interstices. The number
average fiber diameter of the uncoated ENMs can be estimated to be 720 nm and that of the
coated membranes to be 430 nm. The commercial microfiltration membranes have typical
values of pore diameter of, 0.22 µm and 0.45 µm for the Nylaflo and FSM0.45PP, respectively
(nominal values given by the manufacturers).
Figure 11 Fiber diameter distribution for the uncoated (a) and coated PCL ENM (b).
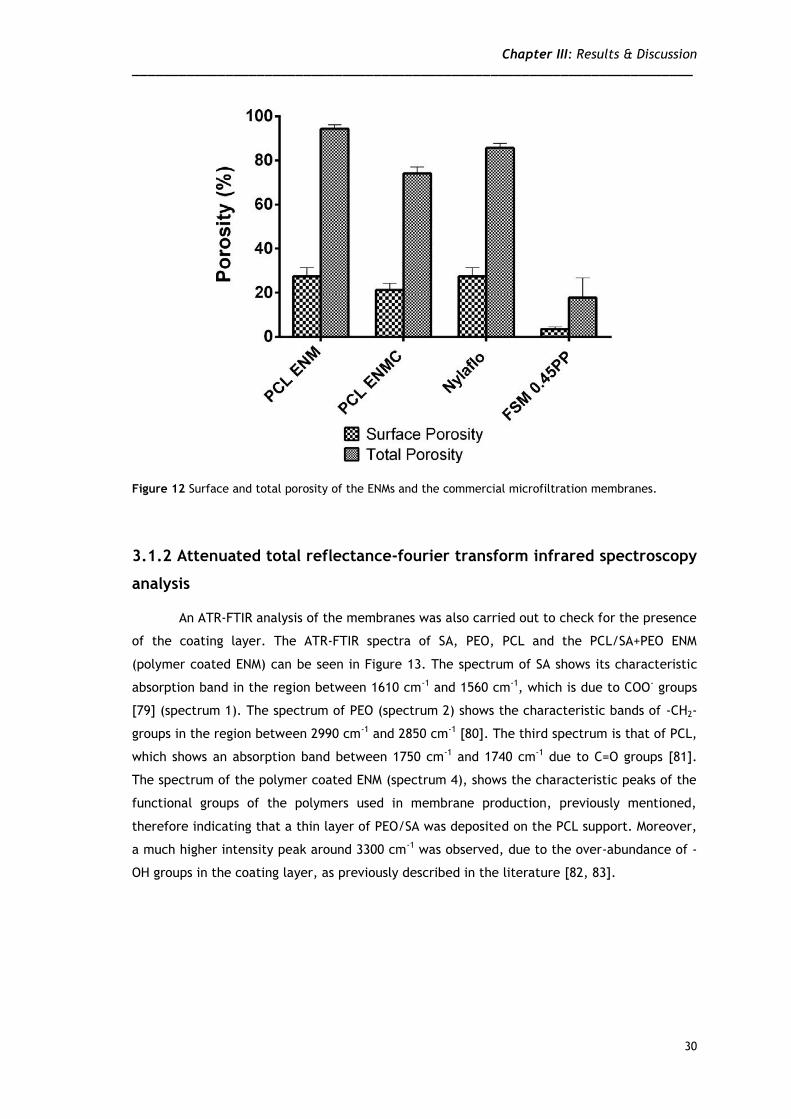
The porosity of the membranes is analyzed in Figure 12. As it can be seen, the ENMs
have porosities comparable to that of the 0.22 µm Nylaflo membranes which have been found
to perform very satisfactory in the filtration of lysates from plasmid pVAX1-lacZ fermentation
[13]. The porosity of the 0.45 µm membrane used is clearly lower than that of the other
membranes studied herein.
Chapter III: Results & Discussion Chapter I: Introduction ________________________________________________________________________
30
Figure 12 Surface and total porosity of the ENMs and the commercial microfiltration membranes.
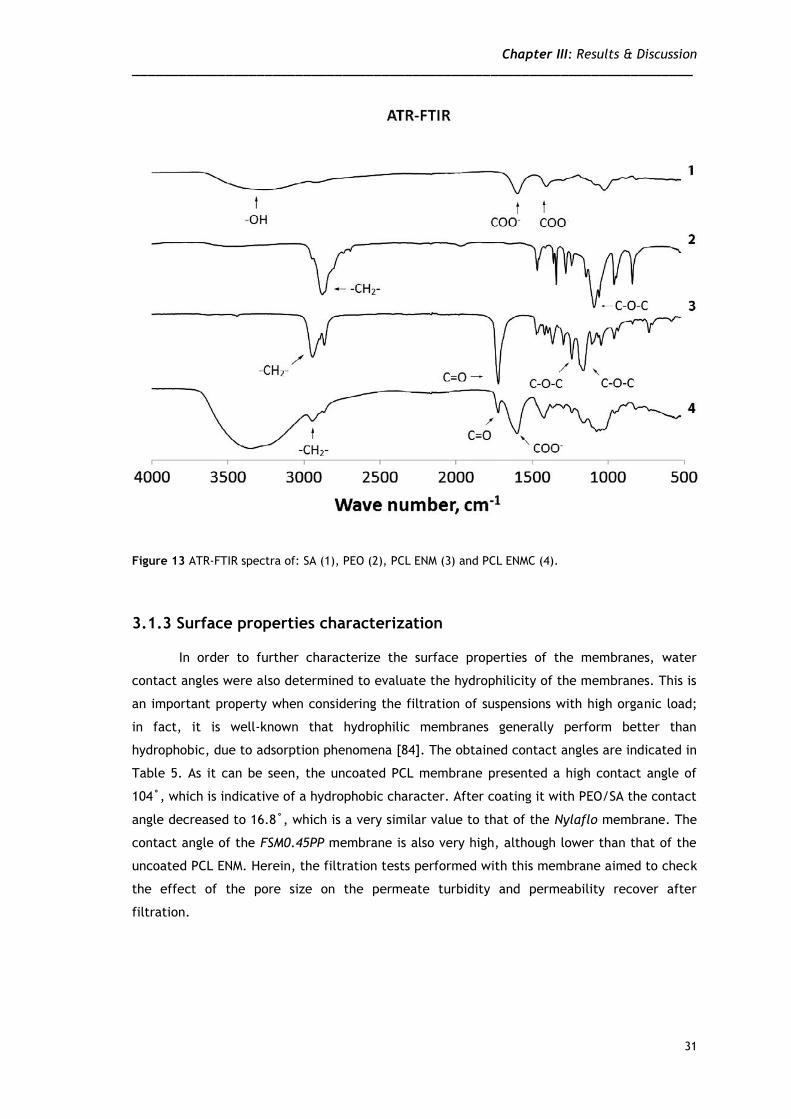
3.1.2 Attenuated total reflectance-fourier transform infrared spectroscopy
analysis
An ATR-FTIR analysis of the membranes was also carried out to check for the presence
of the coating layer. The ATR-FTIR spectra of SA, PEO, PCL and the PCL/SA+PEO ENM
(polymer coated ENM) can be seen in Figure 13. The spectrum of SA shows its characteristic
absorption band in the region between 1610 cm-1 and 1560 cm-1, which is due to COO- groups
[79] (spectrum 1). The spectrum of PEO (spectrum 2) shows the characteristic bands of -CH2-
groups in the region between 2990 cm-1 and 2850 cm-1 [80]. The third spectrum is that of PCL,
which shows an absorption band between 1750 cm-1 and 1740 cm-1 due to C=O groups [81].
The spectrum of the polymer coated ENM (spectrum 4), shows the characteristic peaks of the
functional groups of the polymers used in membrane production, previously mentioned,
therefore indicating that a thin layer of PEO/SA was deposited on the PCL support. Moreover,
a much higher intensity peak around 3300 cm-1 was observed, due to the over-abundance of -
OH groups in the coating layer, as previously described in the literature [82, 83].
Chapter III: Results & Discussion Chapter I: Introduction ________________________________________________________________________
31
Figure 13 ATR-FTIR spectra of: SA (1), PEO (2), PCL ENM (3) and PCL ENMC (4).
3.1.3 Surface properties characterization
In order to further characterize the surface properties of the membranes, water
contact angles were also determined to evaluate the hydrophilicity of the membranes. This is
an important property when considering the filtration of suspensions with high organic load;
in fact, it is well-known that hydrophilic membranes generally perform better than
hydrophobic, due to adsorption phenomena [84]. The obtained contact angles are indicated in
Table 5. As it can be seen, the uncoated PCL membrane presented a high contact angle of
104˚, which is indicative of a hydrophobic character. After coating it with PEO/SA the contact
angle decreased to 16.8˚, which is a very similar value to that of the Nylaflo membrane. The
contact angle of the FSM0.45PP membrane is also very high, although lower than that of the
uncoated PCL ENM. Herein, the filtration tests performed with this membrane aimed to check
the effect of the pore size on the permeate turbidity and permeability recover after
filtration.
Chapter III: Results & Discussion Chapter I: Introduction ________________________________________________________________________
32
Table 5 Contact angles of the FSM0.45PP, Nylaflo, uncoated ENM (PCL support) and PCL coated ENM.
Membranes Water contact angle
FSM0.45PP – 0.45 µm 85.5˚ ± 3.5˚
Nylaflo – 0.22 µm 18.4˚ ± 0.1˚
PCL ENM 104˚ ± 7˚
PCL ENMC 16.8˚ ± 2.4˚
3.2 Membrane filtration studies
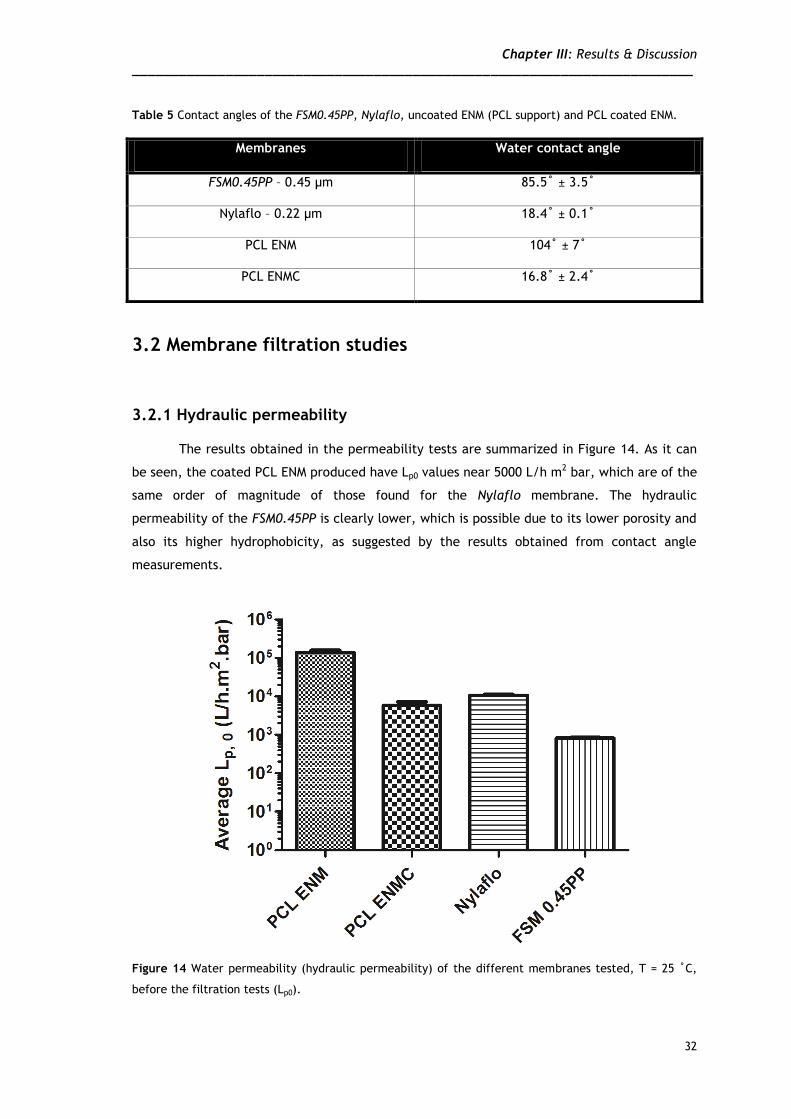
3.2.1 Hydraulic permeability
The results obtained in the permeability tests are summarized in Figure 14. As it can
be seen, the coated PCL ENM produced have Lp0 values near 5000 L/h m2 bar, which are of the
same order of magnitude of those found for the Nylaflo membrane. The hydraulic
permeability of the FSM0.45PP is clearly lower, which is possible due to its lower porosity and
also its higher hydrophobicity, as suggested by the results obtained from contact angle
measurements.
Figure 14 Water permeability (hydraulic permeability) of the different membranes tested, T = 25 ˚C,
before the filtration tests (Lp0).
Chapter III: Results & Discussion Chapter I: Introduction ________________________________________________________________________
33
3.2.2 Microfiltration of lysates
After the cell lysis procedure is completed (using the method described in section
2.2.1), a suspension containing a large quantity of precipitates and cell debris is formed,
nearly 2.4 g of suspended solids per gram (wet weight) of cells, as described elsewhere [85].
In respect to solids removal, the coated PCL ENMs and the Nylaflo membranes gave identical
results. Almost, all solids were removed during the filtration, as can be seen by the turbidity
measurements (Table 6). This indicates that both membranes have a similar average pore
size. The fact that the uncoated ENMs have lower solids retention than the coated is in
agreement with their higher average fiber diameter, considering that the dimension of the
interstices between fibers becomes smaller as the fiber diameter decreases.
Table 6 Turbidity of the processed lysates.
Centrifugation * PCL ENM PCL ENMC Nylaflo FSM0.45PP
0.002 ± 0.001 0.030 ± 0.001 0.0060 ± 0.0009 0.0065 ± 0.0009 0.024 ± 0.008
* As described in section 2.2.6.
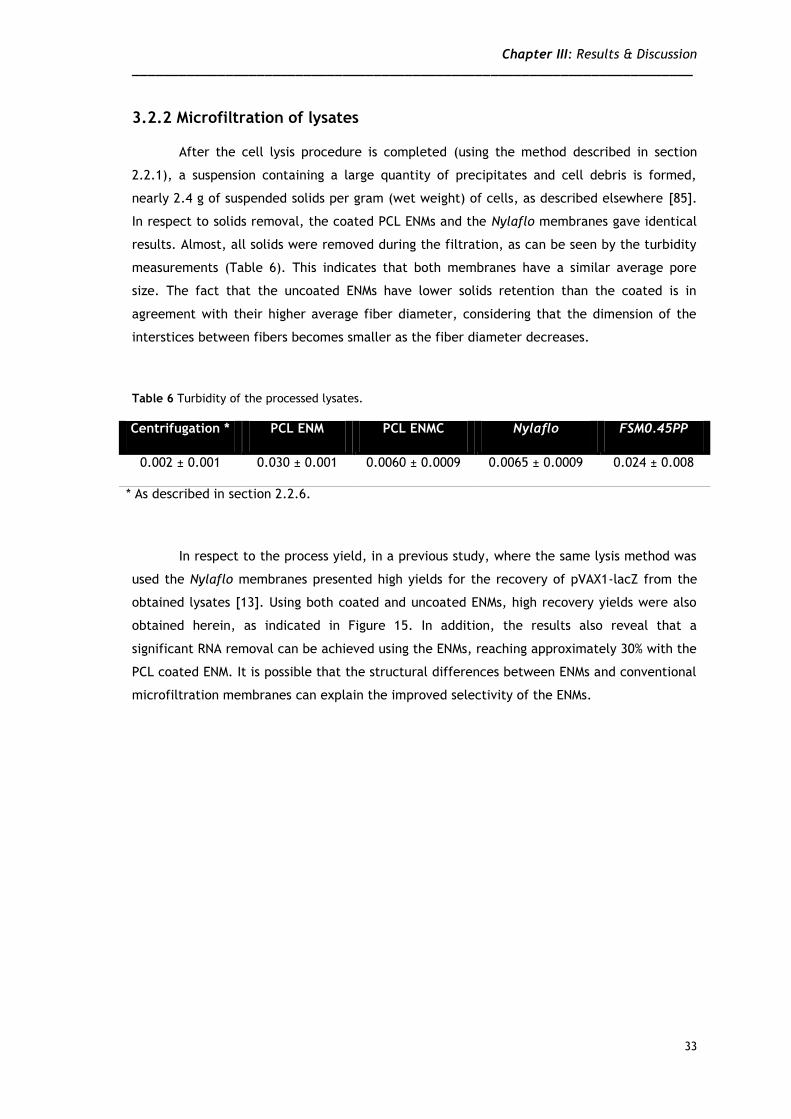
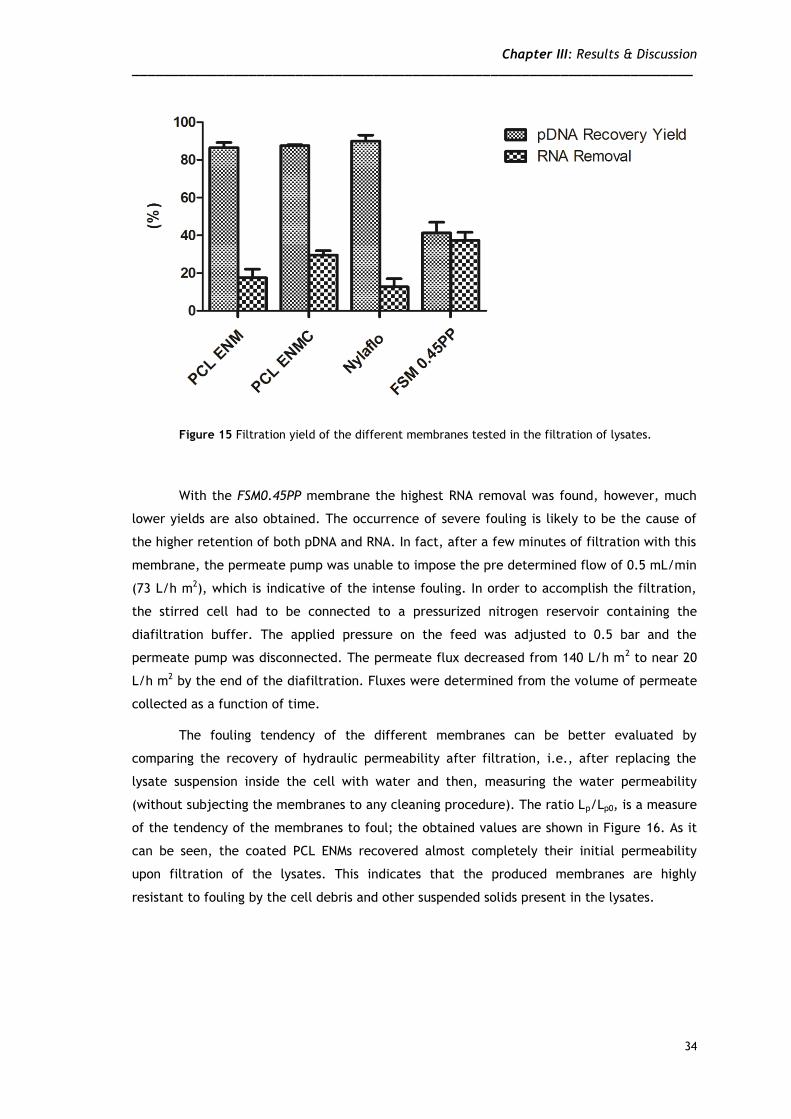
In respect to the process yield, in a previous study, where the same lysis method was
used the Nylaflo membranes presented high yields for the recovery of pVAX1-lacZ from the
obtained lysates [13]. Using both coated and uncoated ENMs, high recovery yields were also
obtained herein, as indicated in Figure 15. In addition, the results also reveal that a
significant RNA removal can be achieved using the ENMs, reaching approximately 30% with the
PCL coated ENM. It is possible that the structural differences between ENMs and conventional
microfiltration membranes can explain the improved selectivity of the ENMs.
Chapter III: Results & Discussion Chapter I: Introduction ________________________________________________________________________
34
Figure 15 Filtration yield of the different membranes tested in the filtration of lysates.
With the FSM0.45PP membrane the highest RNA removal was found, however, much
lower yields are also obtained. The occurrence of severe fouling is likely to be the cause of
the higher retention of both pDNA and RNA. In fact, after a few minutes of filtration with this
membrane, the permeate pump was unable to impose the pre determined flow of 0.5 mL/min
(73 L/h m2), which is indicative of the intense fouling. In order to accomplish the filtration,
the stirred cell had to be connected to a pressurized nitrogen reservoir containing the
diafiltration buffer. The applied pressure on the feed was adjusted to 0.5 bar and the
permeate pump was disconnected. The permeate flux decreased from 140 L/h m2 to near 20
L/h m2 by the end of the diafiltration. Fluxes were determined from the volume of permeate
collected as a function of time.
The fouling tendency of the different membranes can be better evaluated by
comparing the recovery of hydraulic permeability after filtration, i.e., after replacing the
lysate suspension inside the cell with water and then, measuring the water permeability
(without subjecting the membranes to any cleaning procedure). The ratio Lp/Lp0, is a measure
of the tendency of the membranes to foul; the obtained values are shown in Figure 16. As it
can be seen, the coated PCL ENMs recovered almost completely their initial permeability
upon filtration of the lysates. This indicates that the produced membranes are highly
resistant to fouling by the cell debris and other suspended solids present in the lysates.
Chapter III: Results & Discussion Chapter I: Introduction ________________________________________________________________________
35
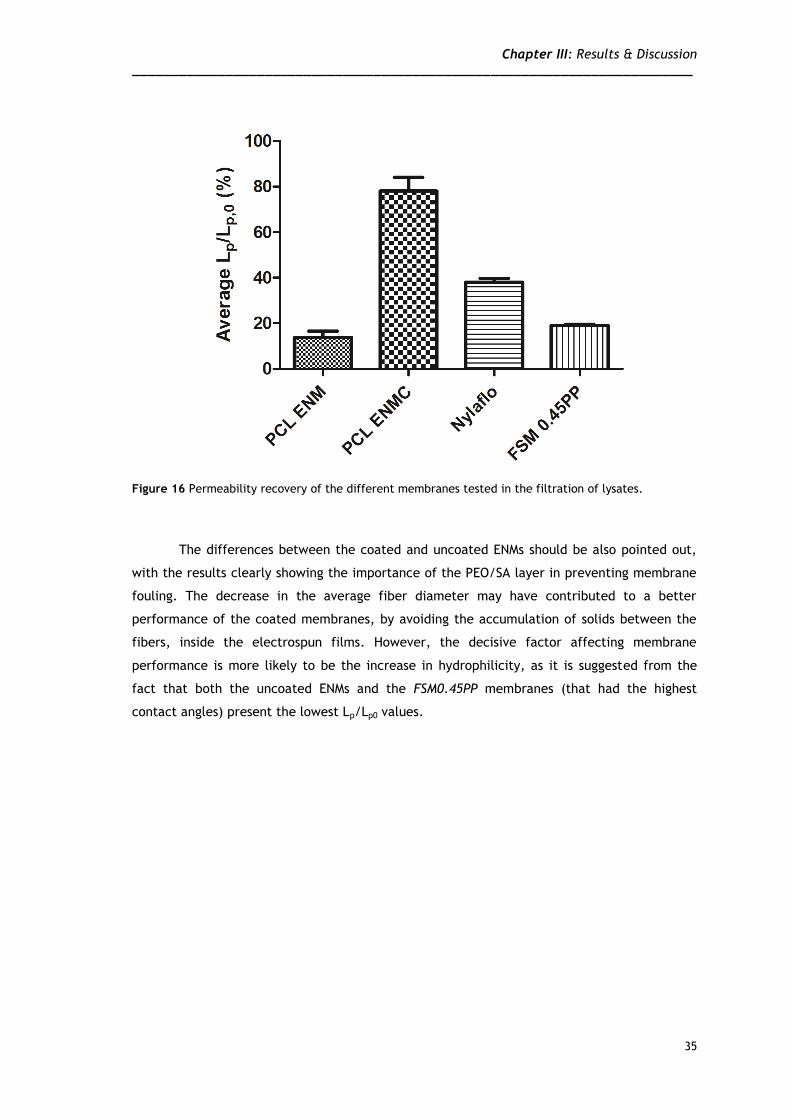
Figure 16 Permeability recovery of the different membranes tested in the filtration of lysates.
The differences between the coated and uncoated ENMs should be also pointed out,
with the results clearly showing the importance of the PEO/SA layer in preventing membrane
fouling. The decrease in the average fiber diameter may have contributed to a better
performance of the coated membranes, by avoiding the accumulation of solids between the
fibers, inside the electrospun films. However, the decisive factor affecting membrane
performance is more likely to be the increase in hydrophilicity, as it is suggested from the
fact that both the uncoated ENMs and the FSM0.45PP membranes (that had the highest
contact angles) present the lowest Lp/Lp0 values.
37
Conclusion & Future Perspectives
Chapter IV
Chapter IV: Conclusion & Future Perspectives Chapter I: Introduction ________________________________________________________________________
37
4. Conclusion and future perspectives
In this work a bi-layer membrane was produced, by deposition of a PEO/SA layer on a
PCL support. Both layers were produced by electrospinning. Electrospun nanofibers that have
been previously used in a practical and cost-effective way for the production of polymer
scaffolds are shown here to be also suitable to be used as microfiltration membranes, for
processing complex suspensions of solids, with high fouling potential (which is the case of cell
lysates). The bi-layer arrangement provided both the selectivity and hydrophilicity required
for this application. In fact, the experimental results point out that the bi-layer ENM
produced can perform, at least, at the same level as commercial microfiltration membranes,
showing a comparable selectivity for retaining the suspended solids while allowing the total
permeation of the solute of interest (i.e., the plasmid), with an improved selectivity to retain
RNA and an even better resistance to fouling. Moreover, the membranes produced are
environmentally friendly due to their known biodegradability.
Despite the potential shown by the obtained results, there are some issues that need
to be addressed before considering this work for industrial purposes. The most relevant one
is, with no doubt, the reproducibility when producing a membrane. The production process
should be optimized so that is obtained a narrow range of fiber diameters, and subsequently
an even distribution of the pore size. This would definitely improve the reproducibility of the
when using the ENM, as the control of the fiber diameter distribution is very important when
defining the correct selectivity of a membrane separation process. Furthermore, plasmid DNA
recovery yield and RNA removal could be enhanced, by testing other polymer combinations
and working around the membrane surface charge with the purpose of retaining undesired
contaminants.

Bibliography
Chapter V
Chapter V: Bibliography Chapter I: Introduction ________________________________________________________________________
39
5. Bibliography
1. Kalyanpur, M., Downstream processing in the biotechnology industry. Molecular
biotechnology, 2002. 22(1): p. 87-98.
2. Ratledge, C. and B. Kristiansen, Basic Biotechnology. 2nd ed. 2001: Cambridge
University Press.
3. De Jong, J., R. Lammertink, and M. Wessling, Membranes and microfluidics: a review.
Lab on a Chip, 2006. 6(9): p. 1125-1139.
4. Zeman, L.J. and A.L. Zydney, Microfiltration and ultrafiltration: principles and
applications. 1996: M. Dekker.
5. Charcosset, C., Membrane processes in biotechnology: An overview. Biotechnology
Advances, 2006. 24(5): p. 482-492.
6. Hughes, R., Industrial membrane separation technology. 1996: Springer.
7. Membrane Filtration, 1999, National Drinking Water ClearingHouse.
8. Abels, C., F. Carstensen, and M. Wessling, Membrane Processes in Biorefinery
Applications. Journal of Membrane Science, 2013 444: p. 285-317.
9. Van Der Bruggen, B., C. Vandecasteele, T. Van Gestel, W. Doyen, and R. Leysen, A
review of pressure‐driven membrane processes in wastewater treatment and drinking
water production. Environmental progress, 2003. 22(1): p. 46-56.
10. Van Reis, R. and A. Zydney, Membrane separations in biotechnology. Current Opinion
in Biotechnology, 2001. 12(2): p. 208-211.
11. van Reis, R. and A. Zydney, Bioprocess membrane technology. Journal of Membrane
Science, 2007. 297(1): p. 16-50.
12. Kahn, D.W., M.D. Butler, D.L. Cohen, M. Gordon, J.W. Kahn, and M.E. Winkler,
Purification of plasmid DNA by tangential flow filtration. Biotechnology and
bioengineering, 2000. 69(1): p. 101-106.
13. Nunes, J.C., A.M. Morão, C. Nunes, M.T. Pessoa de Amorim, I.C. Escobar, and J.A.
Queiroz, Plasmid DNA recovery from fermentation broths by a combined process of
micro-and ultrafiltration: modeling and application. Journal of Membrane Science,
2012. 415: p. 24-35.
14. Baker, R., Membrane technology and applications. 3rd ed. 2012: Wiley.
15. Wijmans, J. and R. Baker, The solution-diffusion model: a review. Journal of
membrane science, 1995. 107(1): p. 1-21.
Chapter V: Bibliography Chapter I: Introduction ________________________________________________________________________
40
16. Mehta, A. and A.L. Zydney, Effect of membrane charge on flow and protein transport
during ultrafiltration. Biotechnology progress, 2006. 22(2): p. 484-492.
17. Hallström, B. and M. Lopez-Leiva, Description of a rotating ultrafiltration module.
Desalination, 1977. 24(1): p. 273-279.
18. Chung, K.Y., R. Bates, and G. Belfort, Dean vortices with wall flux in a curved
channel membrane system. IV: Effect of vortices on permeation fluxes of suspensions
in microporous membrane. Journal of membrane science, 1993. 81(1-2): p. 139-150.
19. Ni, B.-J., B.E. Rittmann, and H.-Q. Yu, Soluble microbial products and their
implications in mixed culture biotechnology. Trends in biotechnology, 2011. 29(9): p.
454-463.
20. Liu, F., Y. Song, and D. Liu, Hydrodynamics-based transfection in animals by systemic
administration of plasmid DNA. Gene therapy, 1999. 6(7): p. 1258-1266.
21. Horn, N.A., J.A. Meek, G. Budahazi, and Magda Marquet, Cancer gene therapy using
plasmid DNA: purification of DNA for human clinical trials. Human Gene Therapy,
1995. 6(5): p. 565-573.
22. McConkey, S.J., W.H.H. Reece, V.S. Moorthy, D. Webster, S. Dunachie, G. Butcher,
J.M. Vuola, T.J. Blanchard, P. Gothard, K. Watkins, C.M. Hannan, S. Everaere, K.
Brown, K.E. Kester, J. Cummings, J. Williams, D.G. Heppner, A. Pathan, K. Flanagan,
N. Arulanantham, M.T.M. Roberts, M. Roy, G.L. Smith, J. Schneider, T. Peto, R.E.
Sinden, S.C. Gilbert, and A.V.S. Hill, Enhanced T-cell immunogenicity of plasmid DNA
vaccines boosted by recombinant modified vaccinia virus Ankara in humans. Nature
medicine, 2003. 9(6): p. 729-735.
23. Tang, D., M. DeVit, and S.A. Johnston, Genetic immunization is a simple method for
eliciting an immune response. Nature, 1992. 356(6365): p. 152-154.
24. Prather, K.J., S. Sagar, J. Murphy, and M. Chartrain, Industrial scale production of
plasmid DNA for vaccine and gene therapy: plasmid design, production, and
purification. Enzyme and microbial technology, 2003. 33(7): p. 865-883.
25. Donnelly, J.J., B. Wahren, and M.A. Liu, DNA vaccines: progress and challenges. The
Journal of Immunology, 2005. 175(2): p. 633-639.
26. Carlson, A., M. Signs, L. Liermann, R. Boor, and K. Jim Jem, Mechanical disruption of
Escherichia coli for plasmid recovery. Biotechnology and bioengineering, 1995. 48(4):
p. 303-315.
27. Zhu, K., H. Jin, Y. Ma, Z. Ren, C. Xiao, Z. He, F. Zhang, Q. Zhu, and B. Wang, A
continuous thermal lysis procedure for the large-scale preparation of plasmid DNA.
Journal of biotechnology, 2005. 118(3): p. 257-264.
Chapter V: Bibliography Chapter I: Introduction ________________________________________________________________________
41
28. Bimboim, H. and J. Doly, A rapid alkaline extraction procedure for screening
recombinant plasmid DNA. Nucleic acids research, 1979. 7(6): p. 1513-1523.
29. Ondarcuhu, T. and C. Joachim, Drawing a single nanofibre over hundreds of microns.
EPL (Europhysics Letters), 1998. 42(2): p. 215-220.
30. Feng, L., S. Li, H. Li, J. Zhai, Y. Song, L. Jiang, and D. Zhu, Super‐hydrophobic
surface of aligned polyacrylonitrile nanofibers. Angewandte Chemie, 2002. 114(7): p.
1269-1271.
31. Liu, X. and P.X. Ma, Phase separation, pore structure, and properties of nanofibrous
gelatin scaffolds. Biomaterials, 2009. 30(25): p. 4094.
32. Niece, K.L., J.D. Hartgerink, J.J.J.M. Donners, and S.I. Stupp, Self-assembly
combining two bioactive peptide-amphiphile molecules into nanofibers by
electrostatic attraction. Journal of the American Chemical Society, 2003. 125(24): p.
7146-7147.
33. Liu, H. and C. Tang, Electrospinning of cellulose acetate in solvent mixture N, N-
dimethylacetamide (DMAc)/acetone. Polymer Journal, 2006. 39(1): p. 65-72.
34. Huang, Z.-M., Y.-Z. Zhang, M. Kotaki, and S. Ramakrishna, A review on polymer
nanofibers by electrospinning and their applications in nanocomposites. Composites
science and technology, 2003. 63(15): p. 2223-2253.
35. Correia, T.R., B.P. Antunes, P.H. Castilho, J.C. Nunes, M.T. Pessoa de Amorim, I.C.
Escobar, J.A. Queiroz, I.J. Correia, and A.M. Morão, A bi-layer electrospun nanofiber
membrane for plasmid DNA recovery from fermentation broths. Separation and
Purification Technology, 2013. 112: p. 20-25.
36. Zussman, E., A. Theron, and A. Yarin, Formation of nanofiber crossbars in
electrospinning. Applied physics letters, 2003. 82(6): p. 973-975.
37. He, J.-H., Y.-Q. Wan, and J.-Y. Yu, Scaling law in electrospinning: relationship
between electric current and solution flow rate. Polymer, 2005. 46(8): p. 2799-2801.
38. Bhardwaj, N. and S.C. Kundu, Electrospinning: a fascinating fiber fabrication
technique. Biotechnology Advances, 2010. 28(3): p. 325-347.
39. Nandakumar, A., H. Fernandes, J. de Boer, L. Moroni, P. Habibovic, C.A. van
Blitterswijk, Fabrication of bioactive composite scaffolds by electrospinning for bone
regeneration. Macromolecular bioscience, 2010. 10(11): p. 1365-1373.
40. Yang, Y., T. Xia, F. Chen, W. Wei, C. Liu, S. He, and X. Li, Electrospun fibers with
plasmid bFGF polyplex loadings promote skin wound healing in diabetic rats.
Molecular Pharmaceutics, 2011. 9(1): p. 48-58.
41. Kim, Y.J., M. Ebara, and T. Aoyagi, A Smart Nanofiber Web That Captures and
Releases Cells. Angewandte Chemie, 2012. 124(42): p. 10689-10693.
Chapter V: Bibliography Chapter I: Introduction ________________________________________________________________________
42
42. Scampicchio, M., A. Bulbarello, A. Arecchi, M.S. Cosio, S. Benedetti, and S. Mannino,
Electrospun Nonwoven Nanofibrous Membranes for Sensors and Biosensors.
Electroanalysis, 2012. 24(4): p. 719-725.
43. Wu, H., L. Hu, M.W. Rowell, D. Kong, J.J. Cha, J.R. McDonough, J. Zhu, Y. Yang, M.D.
McGehee, and Y. Cui, Electrospun metal nanofiber webs as high-performance
transparent electrode. Nano letters, 2010. 10(10): p. 4242-4248.
44. Fong, H. and D.H. Reneker, Electrospinning and the formation of nanofibers. Vol. 6.
2001: chapter.
45. Taylor, G., Electrically driven jets. Proceedings of the Royal Society of London. A.
Mathematical and Physical Sciences, 1969. 313(1515): p. 453-475.
46. Doshi, J. and D.H. Reneker, Electrospinning process and applications of electrospun
fibers. Journal of electrostatics, 1995. 35(2): p. 151-160.
47. Fong, H., I. Chun, and D. Reneker, Beaded nanofibers formed during electrospinning.
Polymer, 1999. 40(16): p. 4585-4592.
48. Demir, M.M., I. Yilgor, E. Yilgor, and B. Erman, Electrospinning of polyurethane
fibers. Polymer, 2002. 43(11): p. 3303-3309.
49. Torres‐Giner, S., M. Ocio, and J. Lagaron, Development of Active Antimicrobial
Fiber‐Based Chitosan Polysaccharide Nanostructures using Electrospinning.
Engineering in Life Sciences, 2008. 8(3): p. 303-314.
50. Ramakrishna, S., An introduction to electrospinning and nanofibers. 2005: World
Scientific Publishing Company.
51. Koski, A., K. Yim, and S. Shivkumar, Effect of molecular weight on fibrous PVA
produced by electrospinning. Materials Letters, 2004. 58(3): p. 493-497.
52. Li, D. and Y. Xia, Electrospinning of nanofibers: reinventing the wheel? Advanced
materials, 2004. 16(14): p. 1151-1170.
53. Ramakrishna, S., K. Fujihara, W.-E. Teo, T. Yong, Z. Ma, and R. Ramaseshan,
Electrospun nanofibers: solving global issues. Materials Today, 2006. 9(3): p. 40-50.
54. Liang, D., B.S. Hsiao, and B. Chu, Functional electrospun nanofibrous scaffolds for
biomedical applications. Advanced drug delivery reviews, 2007. 59(14): p. 1392-1412.
55. He, W., S.W. Horn, and M.D. Hussain, Improved bioavailability of orally administered
mifepristone from PLGA nanoparticles. International journal of pharmaceutics, 2007.
334(1): p. 173-178.
56. Li, W.-J., C.T. Laurencin, E.J. Caterson, R.S. Tuan, F.K. Ko, Electrospun nanofibrous
structure: a novel scaffold for tissue engineering. Journal of biomedical materials
research, 2002. 60(4): p. 613-621.
Chapter V: Bibliography Chapter I: Introduction ________________________________________________________________________
43
57. Friess, W., Collagen–biomaterial for drug delivery. European Journal of
Pharmaceutics and Biopharmaceutics, 1998. 45(2): p. 113-136.
58. Thorvaldsson, A., H. Stenhamre, P. Gatenholm, and P. Walkenström, Electrospinning
of highly porous scaffolds for cartilage regeneration. Biomacromolecules, 2008. 9(3):
p. 1044-1049.
59. Venugopal, J. and S. Ramakrishna, Biocompatible nanofiber matrices for the
engineering of a dermal substitute for skin regeneration. Tissue engineering, 2005.
11(5-6): p. 847-854.
60. Zhang, Y., J.R. Venugopal, A. El-Turki, S. Ramakrishna, B. Su, and C.T. Lim,
Electrospun biomimetic nanocomposite nanofibers of hydroxyapatite/chitosan for
bone tissue engineering. Biomaterials, 2008. 29(32): p. 4314-4322.
61. Xu, C.Y., R. Inai, M. Kotaki, and S. Ramakrishna, Aligned biodegradable nanofibrous
structure: a potential scaffold for blood vessel engineering. Biomaterials, 2004.
25(5): p. 877-886.
62. Zong, X., H. Bien, C.-Y. Chung, L. Yin, D. Fang, B.S. Hsiao, B. Chu, and E. Entcheva,
Electrospun fine-textured scaffolds for heart tissue constructs. Biomaterials, 2005.
26(26): p. 5330-5338.
63. Yang, F., R. Murugan, S. Ramakrishna, X. Wang, Y.-X. Ma, and S. Wang, Fabrication of
nano-structured porous PLLA scaffold intended for nerve tissue engineering.
Biomaterials, 2004. 25(10): p. 1891-1900.
64. Bosworth, L.A. and S. Downes, Physicochemical characterisation of degrading
polycaprolactone scaffolds. Polymer Degradation and Stability, 2010. 95(12): p. 2269-
2276.
65. Qin, X. and D. Wu, Effect of different solvents on poly (caprolactone)(PCL)
electrospun nonwoven membranes. Journal of thermal analysis and calorimetry, 2012.
107(3): p. 1007-1013.
66. Lu, J.-W., Y.-L. Zhu, Z.-X. Guo, P. Hu, and J. Yu, Electrospinning of sodium alginate
with poly (ethylene oxide). Polymer, 2006. 47(23): p. 8026-8031.
67. Wang, R., Y. Liu, B. Li, B.S. Hsiao, and B. Chu, Electrospun nanofibrous membranes
for high flux microfiltration. Journal of Membrane Science, 2012. 392: p. 167-174.
68. Gopal, R., S. Kaur, Z. Ma, C. Chan, S. Ramakrishna, and T. Matsuura, Electrospun
nanofibrous filtration membrane. Journal of Membrane Science, 2006. 281(1): p.
581-586.
69. Subbiah, T., G.S. Bhat, R.W. Tock, S. Parameswaran, and S.S. Ramkumar,
Electrospinning of nanofibers. Journal of Applied Polymer Science, 2005. 96(2): p.
557-569.

Chapter V: Bibliography Chapter I: Introduction ________________________________________________________________________
44
70. Tsai, P.P., H. Schreuder-Gibson, and P. Gibson, Different electrostatic methods for
making electret filters. Journal of Electrostatics, 2002. 54(3): p. 333-341.
71. Liu, Y., R. Wang, H. Ma, B.S. Hsiao, and B. Chu, High-flux microfiltration filters
based on electrospun polyvinylalcohol nanofibrous membranes. Polymer, 2012. 54(2):
548-556.
72. Tang, Z., J. Wei, L. Yung, B. Ji, H. Ma, C. Qiu, K. Yoon, F. Wan, D. Fang, B.S. Hsiao,
and B. Chu, UV-cured poly (vinyl alcohol) ultrafiltration nanofibrous membrane
based on electrospun nanofiber scaffolds. Journal of Membrane Science, 2009.
328(1): p. 1-5.
73. Tang, Z., C. Qiu, J.R. McCutcheon, K. Yoon, H. Ma, D. Fang, E. Lee, C. Kopp, B.S.
Hsiao, and B. Chu, Design and fabrication of electrospun polyethersulfone
nanofibrous scaffold for high‐flux nanofiltration membranes. Journal of Polymer
Science Part B: Polymer Physics, 2009. 47(22): p. 2288-2300.
74. Gaspar, V.M., F. Sousa, J.A. Queiroz, and I.J. Correia, Formulation of chitosan–TPP–
pDNA nanocapsules for gene therapy applications. Nanotechnology, 2011. 22(1): p. 1-
12.
75. Zargarian, S.S. and V. Haddadi-Asl, A nanofibrous composite scaffold of
PCL/hydroxyapatite-chitosan/PVA prepared by electrospinning. Iranian Polymer
Journal, 2010. 19(6): p. 457-468.
76. Ma, G., D. Fang, Y. Liu, X. Zhu, and J. Nie, Electrospun sodium alginate/poly
(ethylene oxide) core–shell nanofibers scaffolds potential for tissue engineering
applications. Carbohydrate Polymers, 2012. 87(1): p. 737-743.
77. Nie, H.-L. and L.-M. Zhu, Adsorption of papain with Cibacron Blue F3GA carrying
chitosan-coated nylon affinity membranes. International journal of biological
macromolecules, 2007. 40(3): p. 261-267.
78. Bazargan, A.M., M. Keyanpour-rad, F.A. Hesari, and M. Esmaeilpour Ganji, A study on
the microfiltration behavior of self-supporting electrospun nanofibrous membrane in
water using an optical particle counter. Desalination, 2011. 265(1): p. 148-152.
79. Sartori, C., D.S. Finch, and B. Ralph, Determination of the cation content of alginate
thin films by< i> FT</i> ir spectroscopy. Polymer, 1997. 38(1): p. 43-51.
80. Ojha, S.S., D.R. Stevens, T.J. Hoffman, K. Stano, R. Klossner, M.C. Scott, W. Krause,
L.I. Clarke, and R.E. Gorga, Fabrication and characterization of electrospun chitosan
nanofibers formed via templating with polyethylene oxide. Biomacromolecules,
2008. 9(9): p. 2523-2529.
Chapter V: Bibliography Chapter I: Introduction ________________________________________________________________________
45
81. Yang, J., S.-B. Park, H.-G. Yoon, Y.-M. Huh, and S. Haam, Preparation of poly ɛ-
caprolactone nanoparticles containing magnetite for magnetic drug carrier.
International journal of pharmaceutics, 2006. 324(2): p. 185-190.
82. Tang, C.Y., Y.-N. Kwon, and J.O. Leckie, Probing the nano-and micro-scales of
reverse osmosis membranes—A comprehensive characterization of physiochemical
properties of uncoated and coated membranes by XPS, TEM, ATR-FTIR, and streaming
potential measurements. Journal of membrane science, 2007. 287(1): p. 146-156.
83. Tang, C.Y., Y.-N. Kwon, and J.O. Leckie, Effect of membrane chemistry and coating
layer on physiochemical properties of thin film composite polyamide RO and NF
membranes: I. FTIR and XPS characterization of polyamide and coating layer
chemistry. Desalination, 2009. 242(1): p. 149-167.
84. Chang, I.-S., S.-O. Bag, and C.-H. Lee, Effects of membrane fouling on solute
rejection during membrane filtration of activated sludge. Process Biochemistry,
2001. 36(8): p. 855-860.
85. Theodossiou, I., I.J. Collins, J.M. Ward, O.R.T. Thomas, and P. Dunnill, The
processing of a plasmid-based gene from E. coli. Primary recovery by filtration.
Bioprocess Engineering, 1997. 16(3): p. 175-183.
Appendix
Chapter VI
Microencapsulated chitosanedextran sulfate nanoparticles for controled deliveryof bioactive molecules and cells in bone regeneration
J.F.A. Valente 1, V.M. Gaspar 1, B.P. Antunes, P. Countinho, I.J. Correia*
CICS-UBI e Centro de Investigação em Ciências da Saúde, Universidade da Beira Interior, Av. Infante D. Henrique, 6200-506 Covilhã, Portugal
a r t i c l e i n f o
Article history:Received 1 October 2012Accepted 15 October 2012Available online 9 November 2012
Keywords:Alginate microparticlesChitosanedextran sulfate nanoparticlesProtein and cell delivery
a b s t r a c t
This research work aimed to synthesize and characterize a novel dual delivery system comprised of BSA-loaded in chitosanedextran sulfate nanoparticulated carriers and mesenchymal stem cells that areencapsulated into alginate microparticles. The physicochemical and biological characteristics of thisnovel system, such as, morphology, release, swelling, and cytotoxicity were thoroughly characterized.The results obtained from confocal microscopy demonstrate that chitosanedextran sulfate nanoparticlesand cells are fully encapsulated within alginate microparticles, and spatially dispersed in the micro-particle matrix. Moreover, scanning electron microscopy images revealed that these micro-sized carrierspossess a rough surface, an important parameter that also promoted proper cell migration and adhesion.Notably, the incorporation of BSA in this duplex nano-micro delivery system extended its release profilethroughout time, in comparison with microparticles alone, whilst not eliciting any cell damage. Takentogether, these findings suggest that this dual carrier is a versatile delivery system with potential fora spatiotemporally controlled release of bioactive molecules and cells.
� 2012 Elsevier Ltd. All rights reserved.
1. Introduction
The regeneration of bone tissue is preemptively dependent onthe establishment of a complex cascade of biological eventssynergically controlled by numerous bioactive molecules, such asgrowth factors (GFs) that are responsible for triggering the regen-erative signaling cascades at injury sites [1]. These dynamic eventsfurther promote bone healing by recruiting progenitor andinflammatory cells that mediate healing processes [2]. In order toenhance its regeneration process several strategies have beenassayed, such as scaffolds, micro and nanoparticles have been usedfor delivery and controlled release molecules [3e5]. Among thesedelivery systems, several are being currently designed to releasecells and growth factors for regenerative medicine applications.Recently, Trouche and coworkers described the use of alginatemicrospheres and microcapsules for the delivery of mesenchymalstem cells (MSCs) for cell therapy of solid organs [6]. This studyrevealed that the inclusion of MSCs in alginate microspheresmaintained cell viability and cellular function. Furthermore,poly(lactic-co-glycolic acid (PLGA) microspheres have also beendescribed as delivery systems of dexamethasone with sustainable
in vivo release kinetics that ultimately led to a moderate control ofinflammation at a lesion site [7]. Despite the fact that these reportsemphasize the versatility of microparticle-based platforms for drugand cell delivery they also underline the urging necessity ofdeveloping versatile delivery systems that can mimic, activate andpromote regenerative events to a therapeutically relevant scale.Actually, the majority of the delivery systems such as those beforementioned are formulated to release only a single type of biomol-ecule, a major restriction, since the regeneration process is far frombeing efficiently promoted with this approach. These restrictivecharacteristics further demonstrate the need to deliver multiplesignals such as GFs and other biomolecules that participate in thehealing process and homeostasis [6,7]. Particularly, for thecontrolled release of GFs, microparticles are quite interestingcandidates for delivery, mostly due to their intrinsic benefits suchas the ability to provide a larger surface area and also to promotemass transfer of small molecules with precise kinetics from and tothe surrounding fluids [8]. Among the polymeric systems currentlyemployed, alginate renders itself as a valuable biomaterial [9e11].
This natural biocompatible polysaccharide contains 1,4-linkedbeta-D-mannuronic and alpha-L-guluronic acid residues and is ableto formwater-insoluble gels upon crosslinking with divalent cations(e.g., Ca2þ, Zn2þ) [12]. This gentle crosslinking behavior is one of themost important advantages of alginate microparticles and enablesthe establishment of mild conditions for cell or biomolecule encap-sulation [13]. The encapsulation of living cells into hydrogel
* Corresponding author. Tel.: þ351 275 329 002; fax: þ351 275 329 099.E-mail addresses: [email protected], [email protected] (I.J. Correia).
1 Co-first authors.
Contents lists available at SciVerse ScienceDirect
Polymer
journal homepage: www.elsevier .com/locate/polymer
0032-3861/$ e see front matter � 2012 Elsevier Ltd. All rights reserved.http://dx.doi.org/10.1016/j.polymer.2012.10.032
Polymer 54 (2013) 5e15
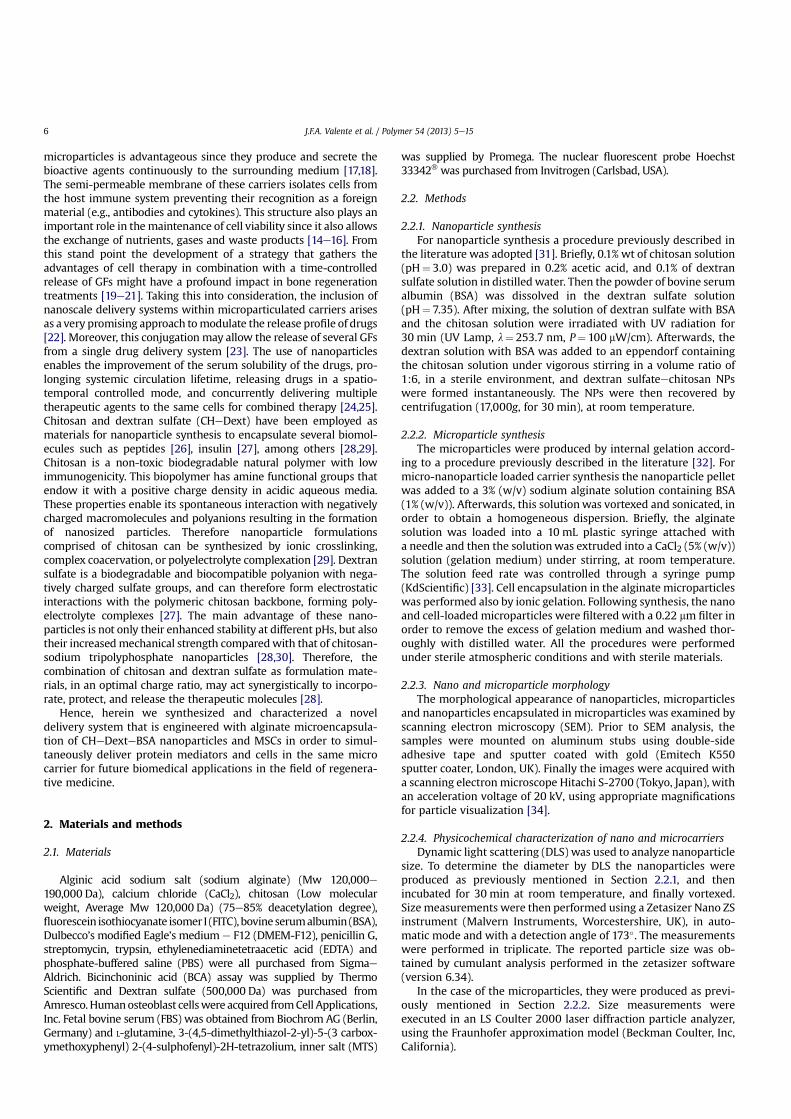
microparticles is advantageous since they produce and secrete thebioactive agents continuously to the surrounding medium [17,18].The semi-permeable membrane of these carriers isolates cells fromthe host immune system preventing their recognition as a foreignmaterial (e.g., antibodies and cytokines). This structure also plays animportant role in the maintenance of cell viability since it also allowsthe exchange of nutrients, gases and waste products [14e16]. Fromthis stand point the development of a strategy that gathers theadvantages of cell therapy in combination with a time-controlledrelease of GFs might have a profound impact in bone regenerationtreatments [19e21]. Taking this into consideration, the inclusion ofnanoscale delivery systems within microparticulated carriers arisesas a very promising approach tomodulate the release profile of drugs[22]. Moreover, this conjugation may allow the release of several GFsfrom a single drug delivery system [23]. The use of nanoparticlesenables the improvement of the serum solubility of the drugs, pro-longing systemic circulation lifetime, releasing drugs in a spatio-temporal controlled mode, and concurrently delivering multipletherapeutic agents to the same cells for combined therapy [24,25].Chitosan and dextran sulfate (CHeDext) have been employed asmaterials for nanoparticle synthesis to encapsulate several biomol-ecules such as peptides [26], insulin [27], among others [28,29].Chitosan is a non-toxic biodegradable natural polymer with lowimmunogenicity. This biopolymer has amine functional groups thatendow it with a positive charge density in acidic aqueous media.These properties enable its spontaneous interaction with negativelycharged macromolecules and polyanions resulting in the formationof nanosized particles. Therefore nanoparticle formulationscomprised of chitosan can be synthesized by ionic crosslinking,complex coacervation, or polyelectrolyte complexation [29]. Dextransulfate is a biodegradable and biocompatible polyanion with nega-tively charged sulfate groups, and can therefore form electrostaticinteractions with the polymeric chitosan backbone, forming poly-electrolyte complexes [27]. The main advantage of these nano-particles is not only their enhanced stability at different pHs, but alsotheir increasedmechanical strength comparedwith that of chitosan-sodium tripolyphosphate nanoparticles [28,30]. Therefore, thecombination of chitosan and dextran sulfate as formulation mate-rials, in an optimal charge ratio, may act synergistically to incorpo-rate, protect, and release the therapeutic molecules [28].
Hence, herein we synthesized and characterized a noveldelivery system that is engineered with alginate microencapsula-tion of CHeDexteBSA nanoparticles and MSCs in order to simul-taneously deliver protein mediators and cells in the same microcarrier for future biomedical applications in the field of regenera-tive medicine.
2. Materials and methods
2.1. Materials
Alginic acid sodium salt (sodium alginate) (Mw 120,000e190,000 Da), calcium chloride (CaCl2), chitosan (Low molecularweight, Average Mw 120,000 Da) (75e85% deacetylation degree),fluorescein isothiocyanate isomer I (FITC), bovine serumalbumin (BSA),Dulbecco’s modified Eagle’s medium e F12 (DMEM-F12), penicillin G,streptomycin, trypsin, ethylenediaminetetraacetic acid (EDTA) andphosphate-buffered saline (PBS) were all purchased from SigmaeAldrich. Bicinchoninic acid (BCA) assay was supplied by ThermoScientific and Dextran sulfate (500,000 Da) was purchased fromAmresco. Humanosteoblast cellswere acquired fromCell Applications,Inc. Fetal bovine serum (FBS) was obtained from Biochrom AG (Berlin,Germany) and L-glutamine, 3-(4,5-dimethylthiazol-2-yl)-5-(3 carbox-ymethoxyphenyl) 2-(4-sulphofenyl)-2H-tetrazolium, inner salt (MTS)
was supplied by Promega. The nuclear fluorescent probe Hoechst33342� was purchased from Invitrogen (Carlsbad, USA).
2.2. Methods
2.2.1. Nanoparticle synthesisFor nanoparticle synthesis a procedure previously described in
the literature was adopted [31]. Briefly, 0.1% wt of chitosan solution(pH¼ 3.0) was prepared in 0.2% acetic acid, and 0.1% of dextransulfate solution in distilled water. Then the powder of bovine serumalbumin (BSA) was dissolved in the dextran sulfate solution(pH¼ 7.35). After mixing, the solution of dextran sulfate with BSAand the chitosan solution were irradiated with UV radiation for30 min (UV Lamp, l¼ 253.7 nm, P¼ 100 mW/cm). Afterwards, thedextran solution with BSA was added to an eppendorf containingthe chitosan solution under vigorous stirring in a volume ratio of1:6, in a sterile environment, and dextran sulfateechitosan NPswere formed instantaneously. The NPs were then recovered bycentrifugation (17,000g, for 30 min), at room temperature.
2.2.2. Microparticle synthesisThe microparticles were produced by internal gelation accord-
ing to a procedure previously described in the literature [32]. Formicro-nanoparticle loaded carrier synthesis the nanoparticle pelletwas added to a 3% (w/v) sodium alginate solution containing BSA(1% (w/v)). Afterwards, this solutionwas vortexed and sonicated, inorder to obtain a homogeneous dispersion. Briefly, the alginatesolution was loaded into a 10 mL plastic syringe attached witha needle and then the solutionwas extruded into a CaCl2 (5% (w/v))solution (gelation medium) under stirring, at room temperature.The solution feed rate was controlled through a syringe pump(KdScientific) [33]. Cell encapsulation in the alginate microparticleswas performed also by ionic gelation. Following synthesis, the nanoand cell-loaded microparticles were filtered with a 0.22 mm filter inorder to remove the excess of gelation medium and washed thor-oughly with distilled water. All the procedures were performedunder sterile atmospheric conditions and with sterile materials.
2.2.3. Nano and microparticle morphologyThe morphological appearance of nanoparticles, microparticles
and nanoparticles encapsulated in microparticles was examined byscanning electron microscopy (SEM). Prior to SEM analysis, thesamples were mounted on aluminum stubs using double-sideadhesive tape and sputter coated with gold (Emitech K550sputter coater, London, UK). Finally the images were acquired witha scanning electronmicroscope Hitachi S-2700 (Tokyo, Japan), withan acceleration voltage of 20 kV, using appropriate magnificationsfor particle visualization [34].
2.2.4. Physicochemical characterization of nano and microcarriersDynamic light scattering (DLS) was used to analyze nanoparticle
size. To determine the diameter by DLS the nanoparticles wereproduced as previously mentioned in Section 2.2.1, and thenincubated for 30 min at room temperature, and finally vortexed.Size measurements were then performed using a Zetasizer Nano ZSinstrument (Malvern Instruments, Worcestershire, UK), in auto-matic mode and with a detection angle of 173�. The measurementswere performed in triplicate. The reported particle size was ob-tained by cumulant analysis performed in the zetasizer software(version 6.34).
In the case of the microparticles, they were produced as previ-ously mentioned in Section 2.2.2. Size measurements wereexecuted in an LS Coulter 2000 laser diffraction particle analyzer,using the Fraunhofer approximation model (Beckman Coulter, Inc,California).
J.F.A. Valente et al. / Polymer 54 (2013) 5e156
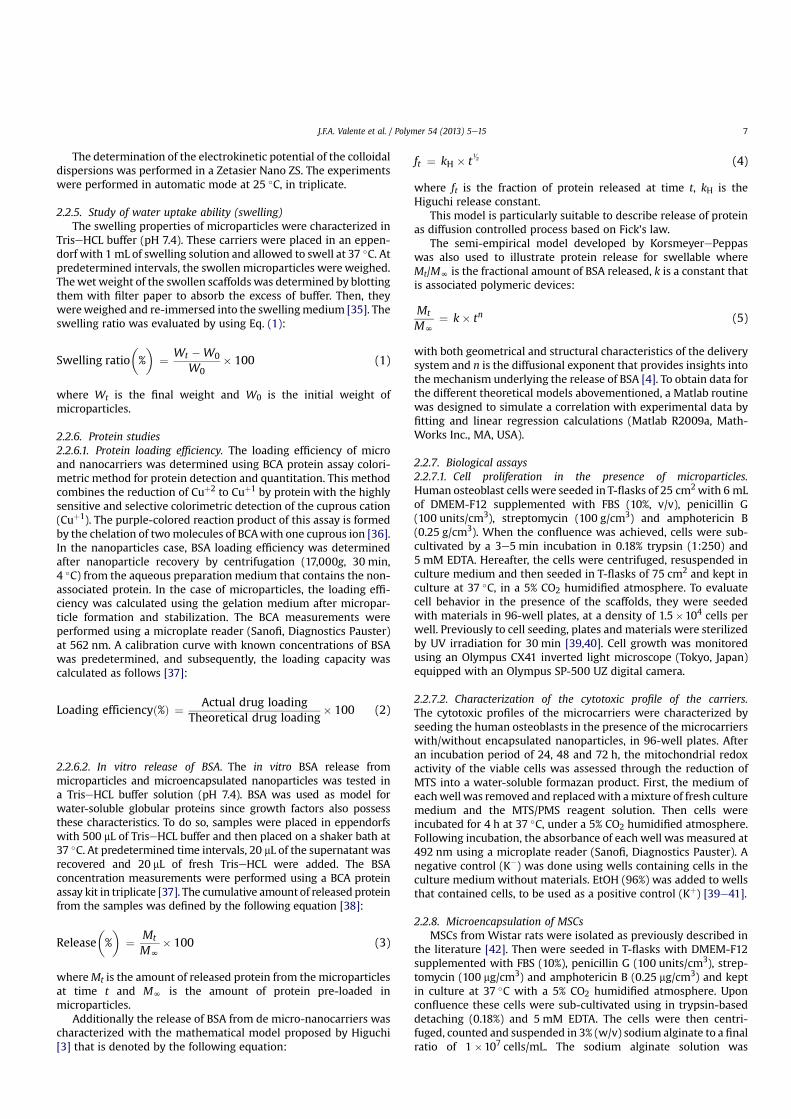
The determination of the electrokinetic potential of the colloidaldispersions was performed in a Zetasier Nano ZS. The experimentswere performed in automatic mode at 25 �C, in triplicate.
2.2.5. Study of water uptake ability (swelling)The swelling properties of microparticles were characterized in
TriseHCL buffer (pH 7.4). These carriers were placed in an eppen-dorf with 1 mL of swelling solution and allowed to swell at 37 �C. Atpredetermined intervals, the swollen microparticles wereweighed.Thewet weight of the swollen scaffolds was determined by blottingthem with filter paper to absorb the excess of buffer. Then, theywereweighed and re-immersed into the swellingmedium [35]. Theswelling ratio was evaluated by using Eq. (1):
Swelling ratio�%�
¼ Wt �W0
W0� 100 (1)
where Wt is the final weight and W0 is the initial weight ofmicroparticles.
2.2.6. Protein studies2.2.6.1. Protein loading efficiency. The loading efficiency of microand nanocarriers was determined using BCA protein assay colori-metric method for protein detection and quantitation. This methodcombines the reduction of Cuþ2 to Cuþ1 by protein with the highlysensitive and selective colorimetric detection of the cuprous cation(Cuþ1). The purple-colored reaction product of this assay is formedby the chelation of twomolecules of BCAwith one cuprous ion [36].In the nanoparticles case, BSA loading efficiency was determinedafter nanoparticle recovery by centrifugation (17,000g, 30 min,4 �C) from the aqueous preparation medium that contains the non-associated protein. In the case of microparticles, the loading effi-ciency was calculated using the gelation medium after micropar-ticle formation and stabilization. The BCA measurements wereperformed using a microplate reader (Sanofi, Diagnostics Pauster)at 562 nm. A calibration curve with known concentrations of BSAwas predetermined, and subsequently, the loading capacity wascalculated as follows [37]:
Loading efficiencyð%Þ ¼ Actual drug loadingTheoretical drug loading
� 100 (2)
2.2.6.2. In vitro release of BSA. The in vitro BSA release frommicroparticles and microencapsulated nanoparticles was tested ina TriseHCL buffer solution (pH 7.4). BSA was used as model forwater-soluble globular proteins since growth factors also possessthese characteristics. To do so, samples were placed in eppendorfswith 500 mL of TriseHCL buffer and then placed on a shaker bath at37 �C. At predetermined time intervals, 20 mL of the supernatant wasrecovered and 20 mL of fresh TriseHCL were added. The BSAconcentration measurements were performed using a BCA proteinassay kit in triplicate [37]. The cumulative amount of released proteinfrom the samples was defined by the following equation [38]:
Release�%�
¼ Mt
MN� 100 (3)
whereMt is the amount of released protein from the microparticlesat time t and MN is the amount of protein pre-loaded inmicroparticles.
Additionally the release of BSA from de micro-nanocarriers wascharacterized with the mathematical model proposed by Higuchi[3] that is denoted by the following equation:
ft ¼ kH � t1 =
2 (4)
where ft is the fraction of protein released at time t, kH is theHiguchi release constant.
This model is particularly suitable to describe release of proteinas diffusion controlled process based on Fick’s law.
The semi-empirical model developed by KorsmeyerePeppaswas also used to illustrate protein release for swellable whereMt/MN is the fractional amount of BSA released, k is a constant thatis associated polymeric devices:
Mt
MN¼ k� tn (5)
with both geometrical and structural characteristics of the deliverysystem and n is the diffusional exponent that provides insights intothe mechanism underlying the release of BSA [4]. To obtain data forthe different theoretical models abovementioned, a Matlab routinewas designed to simulate a correlation with experimental data byfitting and linear regression calculations (Matlab R2009a, Math-Works Inc., MA, USA).
2.2.7. Biological assays2.2.7.1. Cell proliferation in the presence of microparticles.Human osteoblast cells were seeded in T-flasks of 25 cm2with 6 mLof DMEM-F12 supplemented with FBS (10%, v/v), penicillin G(100 units/cm3), streptomycin (100 g/cm3) and amphotericin B(0.25 g/cm3). When the confluence was achieved, cells were sub-cultivated by a 3e5 min incubation in 0.18% trypsin (1:250) and5 mM EDTA. Hereafter, the cells were centrifuged, resuspended inculture medium and then seeded in T-flasks of 75 cm2 and kept inculture at 37 �C, in a 5% CO2 humidified atmosphere. To evaluatecell behavior in the presence of the scaffolds, they were seededwith materials in 96-well plates, at a density of 1.5�104 cells perwell. Previously to cell seeding, plates and materials were sterilizedby UV irradiation for 30 min [39,40]. Cell growth was monitoredusing an Olympus CX41 inverted light microscope (Tokyo, Japan)equipped with an Olympus SP-500 UZ digital camera.
2.2.7.2. Characterization of the cytotoxic profile of the carriers.The cytotoxic profiles of the microcarriers were characterized byseeding the human osteoblasts in the presence of the microcarrierswith/without encapsulated nanoparticles, in 96-well plates. Afteran incubation period of 24, 48 and 72 h, the mitochondrial redoxactivity of the viable cells was assessed through the reduction ofMTS into a water-soluble formazan product. First, the medium ofeachwell was removed and replacedwith amixture of fresh culturemedium and the MTS/PMS reagent solution. Then cells wereincubated for 4 h at 37 �C, under a 5% CO2 humidified atmosphere.Following incubation, the absorbance of each well was measured at492 nm using a microplate reader (Sanofi, Diagnostics Pauster). Anegative control (K�) was done using wells containing cells in theculture medium without materials. EtOH (96%) was added to wellsthat contained cells, to be used as a positive control (Kþ) [39e41].
2.2.8. Microencapsulation of MSCsMSCs from Wistar rats were isolated as previously described in
the literature [42]. Then were seeded in T-flasks with DMEM-F12supplemented with FBS (10%), penicillin G (100 units/cm3), strep-tomycin (100 mg/cm3) and amphotericin B (0.25 mg/cm3) and keptin culture at 37 �C with a 5% CO2 humidified atmosphere. Uponconfluence these cells were sub-cultivated using in trypsin-baseddetaching (0.18%) and 5 mM EDTA. The cells were then centri-fuged, counted and suspended in 3% (w/v) sodium alginate to a finalratio of 1 �107 cells/mL. The sodium alginate solution was
J.F.A. Valente et al. / Polymer 54 (2013) 5e15 7
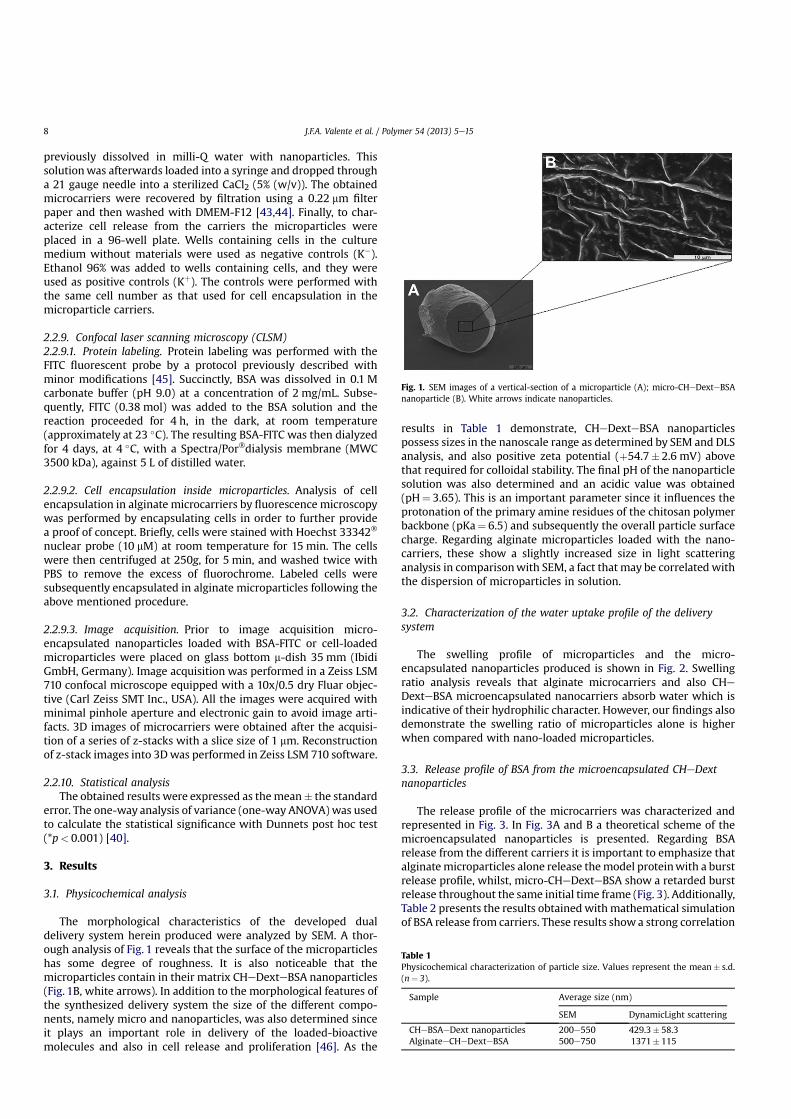
previously dissolved in milli-Q water with nanoparticles. Thissolutionwas afterwards loaded into a syringe and dropped througha 21 gauge needle into a sterilized CaCl2 (5% (w/v)). The obtainedmicrocarriers were recovered by filtration using a 0.22 mm filterpaper and then washed with DMEM-F12 [43,44]. Finally, to char-acterize cell release from the carriers the microparticles wereplaced in a 96-well plate. Wells containing cells in the culturemedium without materials were used as negative controls (K�).Ethanol 96% was added to wells containing cells, and they wereused as positive controls (Kþ). The controls were performed withthe same cell number as that used for cell encapsulation in themicroparticle carriers.
2.2.9. Confocal laser scanning microscopy (CLSM)2.2.9.1. Protein labeling. Protein labeling was performed with theFITC fluorescent probe by a protocol previously described withminor modifications [45]. Succinctly, BSA was dissolved in 0.1 Mcarbonate buffer (pH 9.0) at a concentration of 2 mg/mL. Subse-quently, FITC (0.38 mol) was added to the BSA solution and thereaction proceeded for 4 h, in the dark, at room temperature(approximately at 23 �C). The resulting BSA-FITC was then dialyzedfor 4 days, at 4 �C, with a Spectra/Por�dialysis membrane (MWC3500 kDa), against 5 L of distilled water.
2.2.9.2. Cell encapsulation inside microparticles. Analysis of cellencapsulation in alginate microcarriers by fluorescence microscopywas performed by encapsulating cells in order to further providea proof of concept. Briefly, cells were stained with Hoechst 33342�
nuclear probe (10 mM) at room temperature for 15 min. The cellswere then centrifuged at 250g, for 5 min, and washed twice withPBS to remove the excess of fluorochrome. Labeled cells weresubsequently encapsulated in alginate microparticles following theabove mentioned procedure.
2.2.9.3. Image acquisition. Prior to image acquisition micro-encapsulated nanoparticles loaded with BSA-FITC or cell-loadedmicroparticles were placed on glass bottom m-dish 35 mm (IbidiGmbH, Germany). Image acquisition was performed in a Zeiss LSM710 confocal microscope equipped with a 10x/0.5 dry Fluar objec-tive (Carl Zeiss SMT Inc., USA). All the images were acquired withminimal pinhole aperture and electronic gain to avoid image arti-facts. 3D images of microcarriers were obtained after the acquisi-tion of a series of z-stacks with a slice size of 1 mm. Reconstructionof z-stack images into 3Dwas performed in Zeiss LSM 710 software.
2.2.10. Statistical analysisThe obtained results were expressed as themean� the standard
error. The one-way analysis of variance (one-way ANOVA) was usedto calculate the statistical significance with Dunnets post hoc test(*p< 0.001) [40].
3. Results
3.1. Physicochemical analysis
The morphological characteristics of the developed dualdelivery system herein produced were analyzed by SEM. A thor-ough analysis of Fig. 1 reveals that the surface of the microparticleshas some degree of roughness. It is also noticeable that themicroparticles contain in their matrix CHeDexteBSA nanoparticles(Fig. 1B, white arrows). In addition to the morphological features ofthe synthesized delivery system the size of the different compo-nents, namely micro and nanoparticles, was also determined sinceit plays an important role in delivery of the loaded-bioactivemolecules and also in cell release and proliferation [46]. As the
results in Table 1 demonstrate, CHeDexteBSA nanoparticlespossess sizes in the nanoscale range as determined by SEM and DLSanalysis, and also positive zeta potential (þ54.7� 2.6 mV) abovethat required for colloidal stability. The final pH of the nanoparticlesolution was also determined and an acidic value was obtained(pH¼ 3.65). This is an important parameter since it influences theprotonation of the primary amine residues of the chitosan polymerbackbone (pKa¼ 6.5) and subsequently the overall particle surfacecharge. Regarding alginate microparticles loaded with the nano-carriers, these show a slightly increased size in light scatteringanalysis in comparisonwith SEM, a fact that may be correlated withthe dispersion of microparticles in solution.
3.2. Characterization of the water uptake profile of the deliverysystem
The swelling profile of microparticles and the micro-encapsulated nanoparticles produced is shown in Fig. 2. Swellingratio analysis reveals that alginate microcarriers and also CHeDexteBSA microencapsulated nanocarriers absorb water which isindicative of their hydrophilic character. However, our findings alsodemonstrate the swelling ratio of microparticles alone is higherwhen compared with nano-loaded microparticles.
3.3. Release profile of BSA from the microencapsulated CHeDextnanoparticles
The release profile of the microcarriers was characterized andrepresented in Fig. 3. In Fig. 3A and B a theoretical scheme of themicroencapsulated nanoparticles is presented. Regarding BSArelease from the different carriers it is important to emphasize thatalginatemicroparticles alone release themodel proteinwith a burstrelease profile, whilst, micro-CHeDexteBSA show a retarded burstrelease throughout the same initial time frame (Fig. 3). Additionally,Table 2 presents the results obtained withmathematical simulationof BSA release from carriers. These results showa strong correlation
Fig. 1. SEM images of a vertical-section of a microparticle (A); micro-CHeDexteBSAnanoparticle (B). White arrows indicate nanoparticles.
Table 1Physicochemical characterization of particle size. Values represent the mean� s.d.(n¼ 3).
Sample Average size (nm)
SEM DynamicLight scattering
CHeBSAeDext nanoparticles 200e550 429.3� 58.3AlginateeCHeDexteBSA 500e750 1371� 115
J.F.A. Valente et al. / Polymer 54 (2013) 5e158
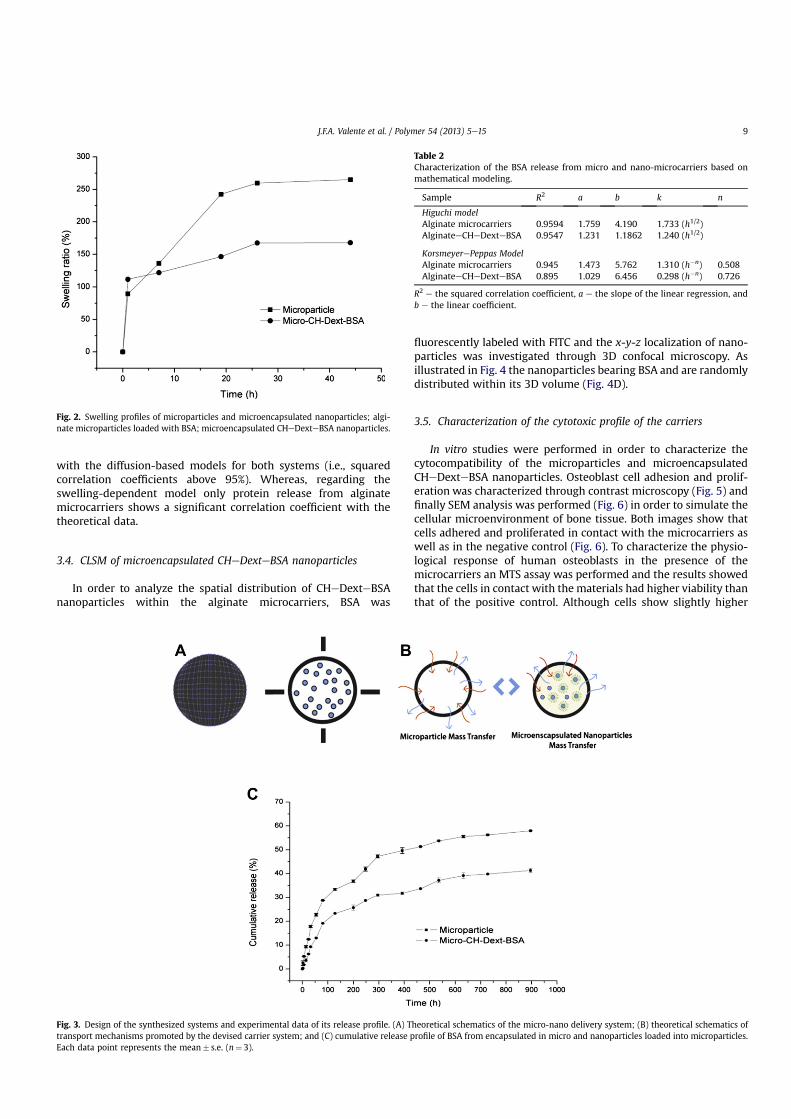
with the diffusion-based models for both systems (i.e., squaredcorrelation coefficients above 95%). Whereas, regarding theswelling-dependent model only protein release from alginatemicrocarriers shows a significant correlation coefficient with thetheoretical data.
3.4. CLSM of microencapsulated CHeDexteBSA nanoparticles
In order to analyze the spatial distribution of CHeDexteBSAnanoparticles within the alginate microcarriers, BSA was
fluorescently labeled with FITC and the x-y-z localization of nano-particles was investigated through 3D confocal microscopy. Asillustrated in Fig. 4 the nanoparticles bearing BSA and are randomlydistributed within its 3D volume (Fig. 4D).
3.5. Characterization of the cytotoxic profile of the carriers
In vitro studies were performed in order to characterize thecytocompatibility of the microparticles and microencapsulatedCHeDexteBSA nanoparticles. Osteoblast cell adhesion and prolif-eration was characterized through contrast microscopy (Fig. 5) andfinally SEM analysis was performed (Fig. 6) in order to simulate thecellular microenvironment of bone tissue. Both images show thatcells adhered and proliferated in contact with the microcarriers aswell as in the negative control (Fig. 6). To characterize the physio-logical response of human osteoblasts in the presence of themicrocarriers an MTS assay was performed and the results showedthat the cells in contact with the materials had higher viability thanthat of the positive control. Although cells show slightly higher
Fig. 2. Swelling profiles of microparticles and microencapsulated nanoparticles; algi-nate microparticles loaded with BSA; microencapsulated CHeDexteBSA nanoparticles.
Fig. 3. Design of the synthesized systems and experimental data of its release profile. (A) Theoretical schematics of the micro-nano delivery system; (B) theoretical schematics oftransport mechanisms promoted by the devised carrier system; and (C) cumulative release profile of BSA from encapsulated in micro and nanoparticles loaded into microparticles.Each data point represents the mean� s.e. (n¼ 3).
Table 2Characterization of the BSA release from micro and nano-microcarriers based onmathematical modeling.
Sample R2 a b k n
Higuchi modelAlginate microcarriers 0.9594 1.759 4.190 1.733 (h1/2)AlginateeCHeDexteBSA 0.9547 1.231 1.1862 1.240 (h1/2)
KorsmeyerePeppas ModelAlginate microcarriers 0.945 1.473 5.762 1.310 (h�n) 0.508AlginateeCHeDexteBSA 0.895 1.029 6.456 0.298 (h�n) 0.726
R2 e the squared correlation coefficient, a e the slope of the linear regression, andb e the linear coefficient.
J.F.A. Valente et al. / Polymer 54 (2013) 5e15 9
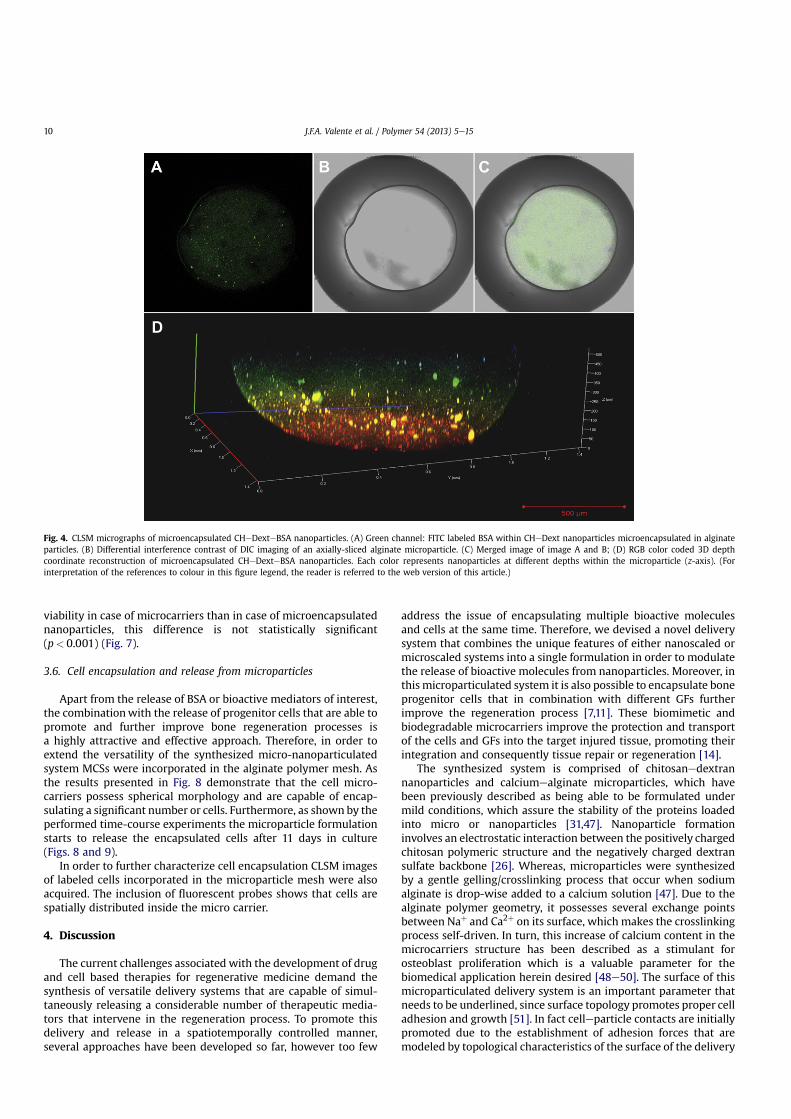
viability in case of microcarriers than in case of microencapsulatednanoparticles, this difference is not statistically significant(p< 0.001) (Fig. 7).
3.6. Cell encapsulation and release from microparticles
Apart from the release of BSA or bioactive mediators of interest,the combinationwith the release of progenitor cells that are able topromote and further improve bone regeneration processes isa highly attractive and effective approach. Therefore, in order toextend the versatility of the synthesized micro-nanoparticulatedsystem MCSs were incorporated in the alginate polymer mesh. Asthe results presented in Fig. 8 demonstrate that the cell micro-carriers possess spherical morphology and are capable of encap-sulating a significant number or cells. Furthermore, as shown by theperformed time-course experiments the microparticle formulationstarts to release the encapsulated cells after 11 days in culture(Figs. 8 and 9).
In order to further characterize cell encapsulation CLSM imagesof labeled cells incorporated in the microparticle mesh were alsoacquired. The inclusion of fluorescent probes shows that cells arespatially distributed inside the micro carrier.
4. Discussion
The current challenges associated with the development of drugand cell based therapies for regenerative medicine demand thesynthesis of versatile delivery systems that are capable of simul-taneously releasing a considerable number of therapeutic media-tors that intervene in the regeneration process. To promote thisdelivery and release in a spatiotemporally controlled manner,several approaches have been developed so far, however too few
address the issue of encapsulating multiple bioactive moleculesand cells at the same time. Therefore, we devised a novel deliverysystem that combines the unique features of either nanoscaled ormicroscaled systems into a single formulation in order to modulatethe release of bioactive molecules from nanoparticles. Moreover, inthismicroparticulated system it is also possible to encapsulate boneprogenitor cells that in combination with different GFs furtherimprove the regeneration process [7,11]. These biomimetic andbiodegradable microcarriers improve the protection and transportof the cells and GFs into the target injured tissue, promoting theirintegration and consequently tissue repair or regeneration [14].
The synthesized system is comprised of chitosanedextrannanoparticles and calciumealginate microparticles, which havebeen previously described as being able to be formulated undermild conditions, which assure the stability of the proteins loadedinto micro or nanoparticles [31,47]. Nanoparticle formationinvolves an electrostatic interaction between the positively chargedchitosan polymeric structure and the negatively charged dextransulfate backbone [26]. Whereas, microparticles were synthesizedby a gentle gelling/crosslinking process that occur when sodiumalginate is drop-wise added to a calcium solution [47]. Due to thealginate polymer geometry, it possesses several exchange pointsbetween Naþ and Ca2þ on its surface, which makes the crosslinkingprocess self-driven. In turn, this increase of calcium content in themicrocarriers structure has been described as a stimulant forosteoblast proliferation which is a valuable parameter for thebiomedical application herein desired [48e50]. The surface of thismicroparticulated delivery system is an important parameter thatneeds to be underlined, since surface topology promotes proper celladhesion and growth [51]. In fact celleparticle contacts are initiallypromoted due to the establishment of adhesion forces that aremodeled by topological characteristics of the surface of the delivery
Fig. 4. CLSM micrographs of microencapsulated CHeDexteBSA nanoparticles. (A) Green channel: FITC labeled BSA within CHeDext nanoparticles microencapsulated in alginateparticles. (B) Differential interference contrast of DIC imaging of an axially-sliced alginate microparticle. (C) Merged image of image A and B; (D) RGB color coded 3D depthcoordinate reconstruction of microencapsulated CHeDexteBSA nanoparticles. Each color represents nanoparticles at different depths within the microparticle (z-axis). (Forinterpretation of the references to colour in this figure legend, the reader is referred to the web version of this article.)
J.F.A. Valente et al. / Polymer 54 (2013) 5e1510
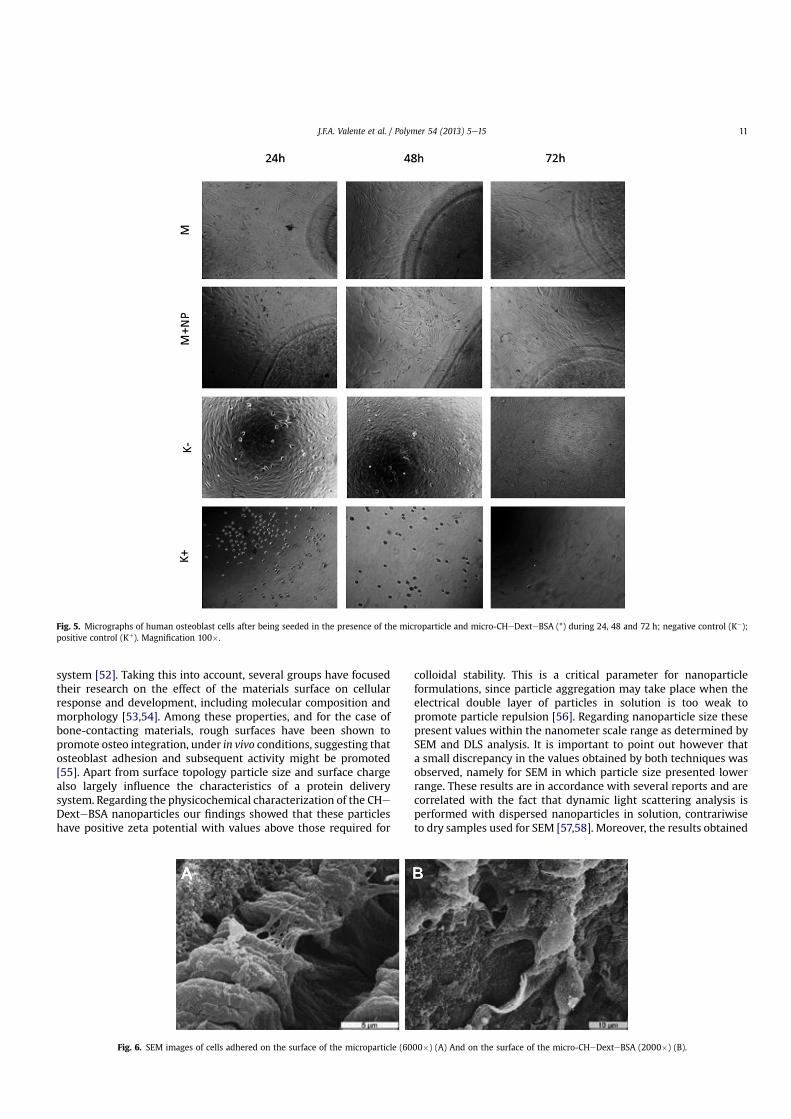
system [52]. Taking this into account, several groups have focusedtheir research on the effect of the materials surface on cellularresponse and development, including molecular composition andmorphology [53,54]. Among these properties, and for the case ofbone-contacting materials, rough surfaces have been shown topromote osteo integration, under in vivo conditions, suggesting thatosteoblast adhesion and subsequent activity might be promoted[55]. Apart from surface topology particle size and surface chargealso largely influence the characteristics of a protein deliverysystem. Regarding the physicochemical characterization of the CHeDexteBSA nanoparticles our findings showed that these particleshave positive zeta potential with values above those required for
colloidal stability. This is a critical parameter for nanoparticleformulations, since particle aggregation may take place when theelectrical double layer of particles in solution is too weak topromote particle repulsion [56]. Regarding nanoparticle size thesepresent values within the nanometer scale range as determined bySEM and DLS analysis. It is important to point out however thata small discrepancy in the values obtained by both techniques wasobserved, namely for SEM in which particle size presented lowerrange. These results are in accordance with several reports and arecorrelated with the fact that dynamic light scattering analysis isperformed with dispersed nanoparticles in solution, contrariwiseto dry samples used for SEM [57,58]. Moreover, the results obtained
Fig. 5. Micrographs of human osteoblast cells after being seeded in the presence of the microparticle and micro-CHeDexteBSA (*) during 24, 48 and 72 h; negative control (K�);positive control (Kþ). Magnification 100�.
Fig. 6. SEM images of cells adhered on the surface of the microparticle (6000�) (A) And on the surface of the micro-CHeDexteBSA (2000�) (B).
J.F.A. Valente et al. / Polymer 54 (2013) 5e15 11
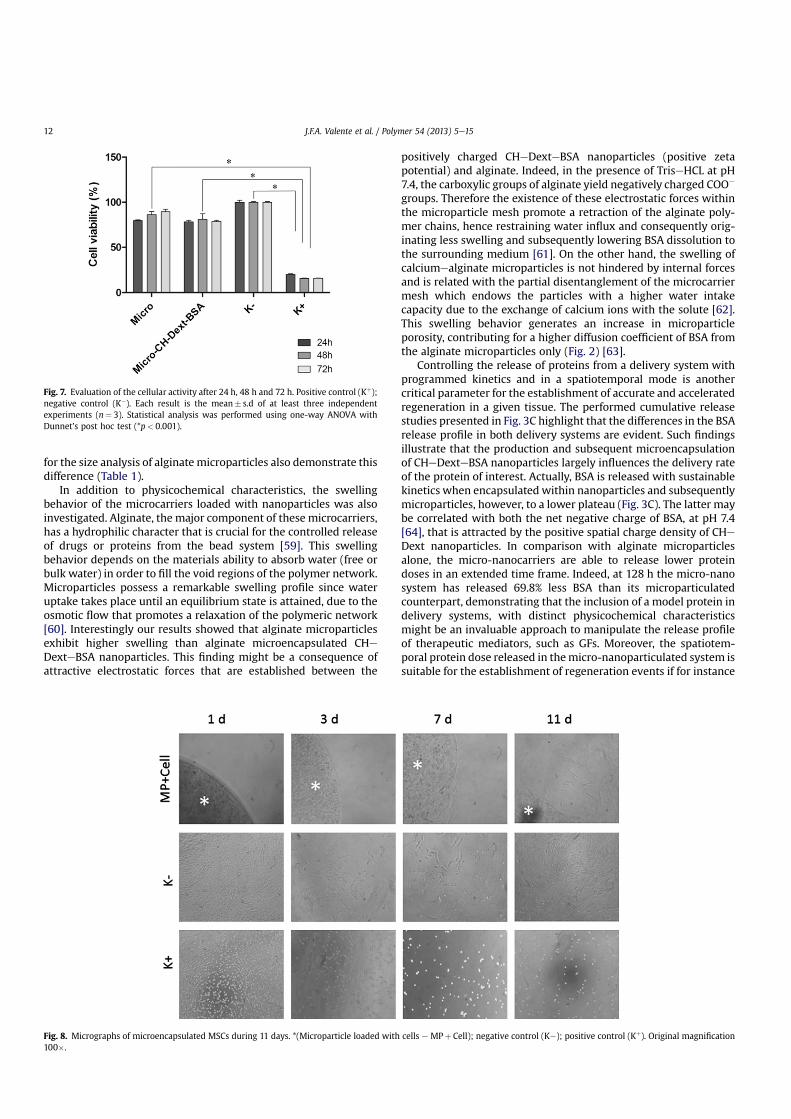
for the size analysis of alginate microparticles also demonstrate thisdifference (Table 1).
In addition to physicochemical characteristics, the swellingbehavior of the microcarriers loaded with nanoparticles was alsoinvestigated. Alginate, the major component of these microcarriers,has a hydrophilic character that is crucial for the controlled releaseof drugs or proteins from the bead system [59]. This swellingbehavior depends on the materials ability to absorb water (free orbulk water) in order to fill the void regions of the polymer network.Microparticles possess a remarkable swelling profile since wateruptake takes place until an equilibrium state is attained, due to theosmotic flow that promotes a relaxation of the polymeric network[60]. Interestingly our results showed that alginate microparticlesexhibit higher swelling than alginate microencapsulated CHeDexteBSA nanoparticles. This finding might be a consequence ofattractive electrostatic forces that are established between the
positively charged CHeDexteBSA nanoparticles (positive zetapotential) and alginate. Indeed, in the presence of TriseHCL at pH7.4, the carboxylic groups of alginate yield negatively charged COO�
groups. Therefore the existence of these electrostatic forces withinthe microparticle mesh promote a retraction of the alginate poly-mer chains, hence restraining water influx and consequently orig-inating less swelling and subsequently lowering BSA dissolution tothe surrounding medium [61]. On the other hand, the swelling ofcalciumealginate microparticles is not hindered by internal forcesand is related with the partial disentanglement of the microcarriermesh which endows the particles with a higher water intakecapacity due to the exchange of calcium ions with the solute [62].This swelling behavior generates an increase in microparticleporosity, contributing for a higher diffusion coefficient of BSA fromthe alginate microparticles only (Fig. 2) [63].
Controlling the release of proteins from a delivery system withprogrammed kinetics and in a spatiotemporal mode is anothercritical parameter for the establishment of accurate and acceleratedregeneration in a given tissue. The performed cumulative releasestudies presented in Fig. 3C highlight that the differences in the BSArelease profile in both delivery systems are evident. Such findingsillustrate that the production and subsequent microencapsulationof CHeDexteBSA nanoparticles largely influences the delivery rateof the protein of interest. Actually, BSA is released with sustainablekinetics when encapsulated within nanoparticles and subsequentlymicroparticles, however, to a lower plateau (Fig. 3C). The latter maybe correlated with both the net negative charge of BSA, at pH 7.4[64], that is attracted by the positive spatial charge density of CHeDext nanoparticles. In comparison with alginate microparticlesalone, the micro-nanocarriers are able to release lower proteindoses in an extended time frame. Indeed, at 128 h the micro-nanosystem has released 69.8% less BSA than its microparticulatedcounterpart, demonstrating that the inclusion of a model protein indelivery systems, with distinct physicochemical characteristicsmight be an invaluable approach to manipulate the release profileof therapeutic mediators, such as GFs. Moreover, the spatiotem-poral protein dose released in themicro-nanoparticulated system issuitable for the establishment of regeneration events if for instance
Fig. 7. Evaluation of the cellular activity after 24 h, 48 h and 72 h. Positive control (Kþ);negative control (K�). Each result is the mean� s.d of at least three independentexperiments (n¼ 3). Statistical analysis was performed using one-way ANOVA withDunnet’s post hoc test (*p< 0.001).
Fig. 8. Micrographs of microencapsulated MSCs during 11 days. *(Microparticle loaded with cells e MPþ Cell); negative control (K�); positive control (Kþ). Original magnification100�.
J.F.A. Valente et al. / Polymer 54 (2013) 5e1512
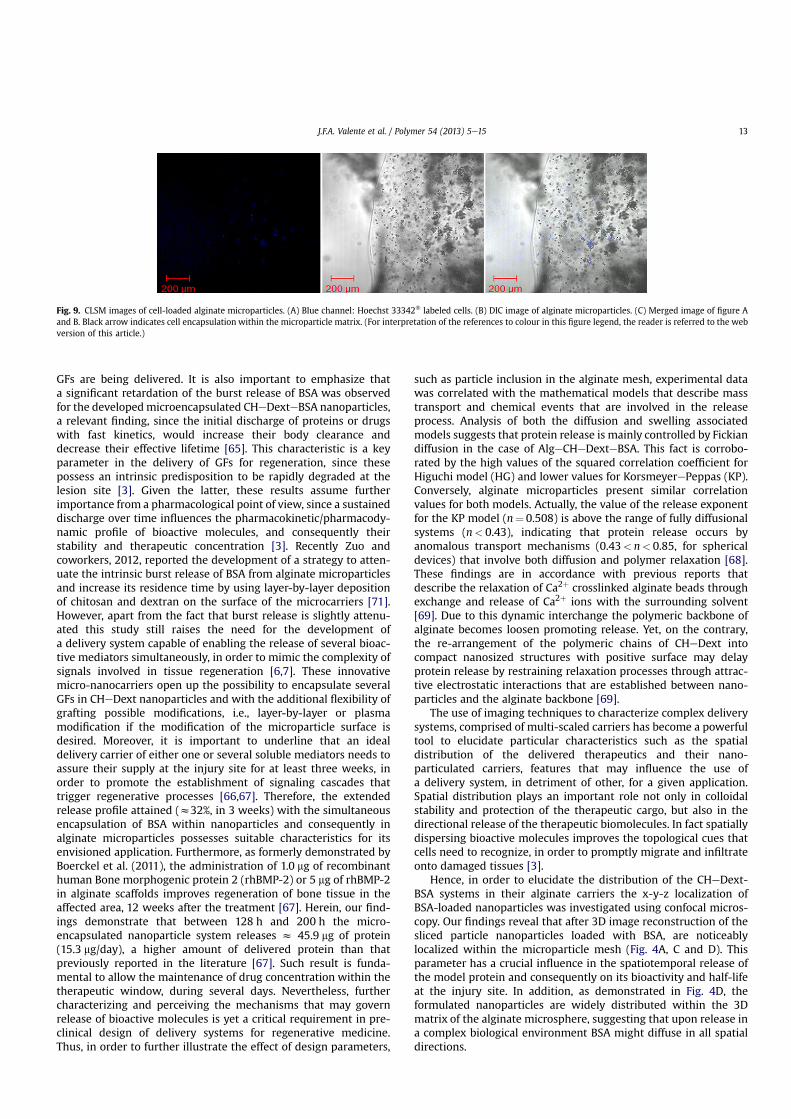
GFs are being delivered. It is also important to emphasize thata significant retardation of the burst release of BSA was observedfor the developedmicroencapsulated CHeDexteBSA nanoparticles,a relevant finding, since the initial discharge of proteins or drugswith fast kinetics, would increase their body clearance anddecrease their effective lifetime [65]. This characteristic is a keyparameter in the delivery of GFs for regeneration, since thesepossess an intrinsic predisposition to be rapidly degraded at thelesion site [3]. Given the latter, these results assume furtherimportance from a pharmacological point of view, since a sustaineddischarge over time influences the pharmacokinetic/pharmacody-namic profile of bioactive molecules, and consequently theirstability and therapeutic concentration [3]. Recently Zuo andcoworkers, 2012, reported the development of a strategy to atten-uate the intrinsic burst release of BSA from alginate microparticlesand increase its residence time by using layer-by-layer depositionof chitosan and dextran on the surface of the microcarriers [71].However, apart from the fact that burst release is slightly attenu-ated this study still raises the need for the development ofa delivery system capable of enabling the release of several bioac-tive mediators simultaneously, in order to mimic the complexity ofsignals involved in tissue regeneration [6,7]. These innovativemicro-nanocarriers open up the possibility to encapsulate severalGFs in CHeDext nanoparticles and with the additional flexibility ofgrafting possible modifications, i.e., layer-by-layer or plasmamodification if the modification of the microparticle surface isdesired. Moreover, it is important to underline that an idealdelivery carrier of either one or several soluble mediators needs toassure their supply at the injury site for at least three weeks, inorder to promote the establishment of signaling cascades thattrigger regenerative processes [66,67]. Therefore, the extendedrelease profile attained (z32%, in 3 weeks) with the simultaneousencapsulation of BSA within nanoparticles and consequently inalginate microparticles possesses suitable characteristics for itsenvisioned application. Furthermore, as formerly demonstrated byBoerckel et al. (2011), the administration of 1.0 mg of recombinanthuman Bone morphogenic protein 2 (rhBMP-2) or 5 mg of rhBMP-2in alginate scaffolds improves regeneration of bone tissue in theaffected area, 12 weeks after the treatment [67]. Herein, our find-ings demonstrate that between 128 h and 200 h the micro-encapsulated nanoparticle system releases z 45.9 mg of protein(15.3 mg/day), a higher amount of delivered protein than thatpreviously reported in the literature [67]. Such result is funda-mental to allow the maintenance of drug concentration within thetherapeutic window, during several days. Nevertheless, furthercharacterizing and perceiving the mechanisms that may governrelease of bioactive molecules is yet a critical requirement in pre-clinical design of delivery systems for regenerative medicine.Thus, in order to further illustrate the effect of design parameters,
such as particle inclusion in the alginate mesh, experimental datawas correlated with the mathematical models that describe masstransport and chemical events that are involved in the releaseprocess. Analysis of both the diffusion and swelling associatedmodels suggests that protein release is mainly controlled by Fickiandiffusion in the case of AlgeCHeDexteBSA. This fact is corrobo-rated by the high values of the squared correlation coefficient forHiguchi model (HG) and lower values for KorsmeyerePeppas (KP).Conversely, alginate microparticles present similar correlationvalues for both models. Actually, the value of the release exponentfor the KP model (n¼ 0.508) is above the range of fully diffusionalsystems (n< 0.43), indicating that protein release occurs byanomalous transport mechanisms (0.43< n< 0.85, for sphericaldevices) that involve both diffusion and polymer relaxation [68].These findings are in accordance with previous reports thatdescribe the relaxation of Ca2þ crosslinked alginate beads throughexchange and release of Ca2þ ions with the surrounding solvent[69]. Due to this dynamic interchange the polymeric backbone ofalginate becomes loosen promoting release. Yet, on the contrary,the re-arrangement of the polymeric chains of CHeDext intocompact nanosized structures with positive surface may delayprotein release by restraining relaxation processes through attrac-tive electrostatic interactions that are established between nano-particles and the alginate backbone [69].
The use of imaging techniques to characterize complex deliverysystems, comprised of multi-scaled carriers has become a powerfultool to elucidate particular characteristics such as the spatialdistribution of the delivered therapeutics and their nano-particulated carriers, features that may influence the use ofa delivery system, in detriment of other, for a given application.Spatial distribution plays an important role not only in colloidalstability and protection of the therapeutic cargo, but also in thedirectional release of the therapeutic biomolecules. In fact spatiallydispersing bioactive molecules improves the topological cues thatcells need to recognize, in order to promptly migrate and infiltrateonto damaged tissues [3].
Hence, in order to elucidate the distribution of the CHeDext-BSA systems in their alginate carriers the x-y-z localization ofBSA-loaded nanoparticles was investigated using confocal micros-copy. Our findings reveal that after 3D image reconstruction of thesliced particle nanoparticles loaded with BSA, are noticeablylocalized within the microparticle mesh (Fig. 4A, C and D). Thisparameter has a crucial influence in the spatiotemporal release ofthe model protein and consequently on its bioactivity and half-lifeat the injury site. In addition, as demonstrated in Fig. 4D, theformulated nanoparticles are widely distributed within the 3Dmatrix of the alginate microsphere, suggesting that upon release ina complex biological environment BSA might diffuse in all spatialdirections.
Fig. 9. CLSM images of cell-loaded alginate microparticles. (A) Blue channel: Hoechst 33342� labeled cells. (B) DIC image of alginate microparticles. (C) Merged image of figure Aand B. Black arrow indicates cell encapsulation within the microparticle matrix. (For interpretation of the references to colour in this figure legend, the reader is referred to the webversion of this article.)
J.F.A. Valente et al. / Polymer 54 (2013) 5e15 13
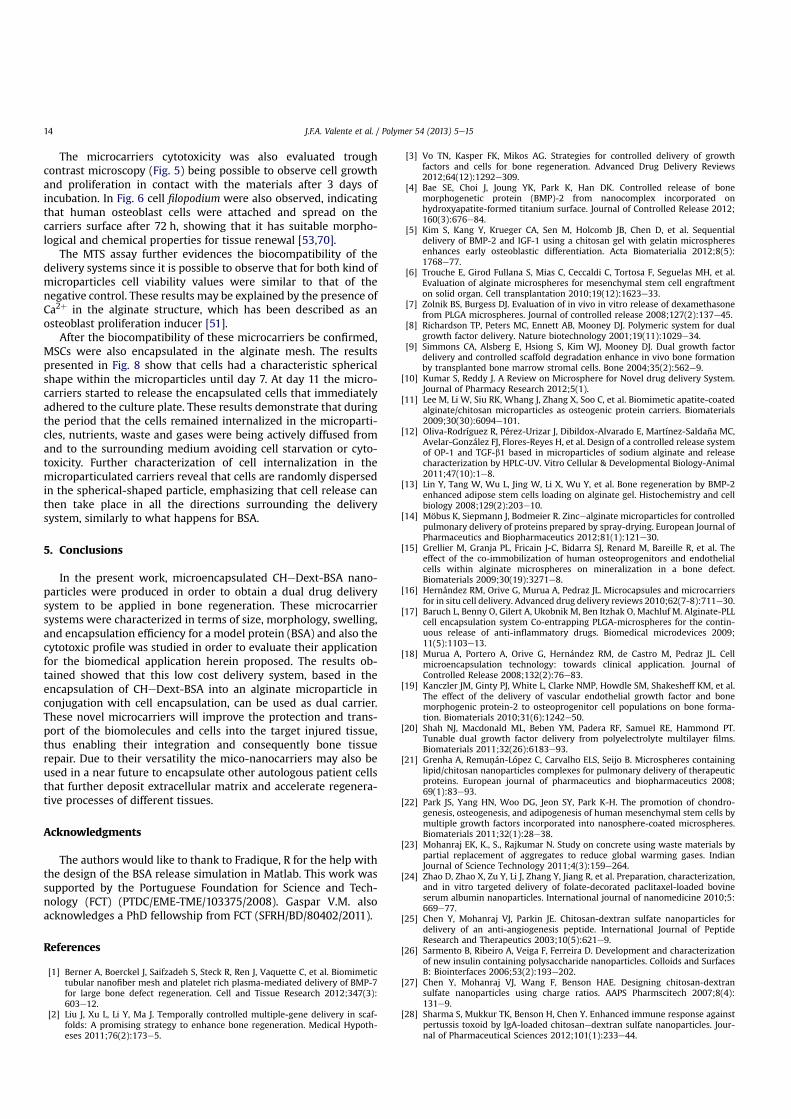
The microcarriers cytotoxicity was also evaluated troughcontrast microscopy (Fig. 5) being possible to observe cell growthand proliferation in contact with the materials after 3 days ofincubation. In Fig. 6 cell filopodium were also observed, indicatingthat human osteoblast cells were attached and spread on thecarriers surface after 72 h, showing that it has suitable morpho-logical and chemical properties for tissue renewal [53,70].
The MTS assay further evidences the biocompatibility of thedelivery systems since it is possible to observe that for both kind ofmicroparticles cell viability values were similar to that of thenegative control. These results may be explained by the presence ofCa2þ in the alginate structure, which has been described as anosteoblast proliferation inducer [51].
After the biocompatibility of these microcarriers be confirmed,MSCs were also encapsulated in the alginate mesh. The resultspresented in Fig. 8 show that cells had a characteristic sphericalshape within the microparticles until day 7. At day 11 the micro-carriers started to release the encapsulated cells that immediatelyadhered to the culture plate. These results demonstrate that duringthe period that the cells remained internalized in the microparti-cles, nutrients, waste and gases were being actively diffused fromand to the surrounding medium avoiding cell starvation or cyto-toxicity. Further characterization of cell internalization in themicroparticulated carriers reveal that cells are randomly dispersedin the spherical-shaped particle, emphasizing that cell release canthen take place in all the directions surrounding the deliverysystem, similarly to what happens for BSA.
5. Conclusions
In the present work, microencapsulated CHeDext-BSA nano-particles were produced in order to obtain a dual drug deliverysystem to be applied in bone regeneration. These microcarriersystems were characterized in terms of size, morphology, swelling,and encapsulation efficiency for a model protein (BSA) and also thecytotoxic profile was studied in order to evaluate their applicationfor the biomedical application herein proposed. The results ob-tained showed that this low cost delivery system, based in theencapsulation of CHeDext-BSA into an alginate microparticle inconjugation with cell encapsulation, can be used as dual carrier.These novel microcarriers will improve the protection and trans-port of the biomolecules and cells into the target injured tissue,thus enabling their integration and consequently bone tissuerepair. Due to their versatility the mico-nanocarriers may also beused in a near future to encapsulate other autologous patient cellsthat further deposit extracellular matrix and accelerate regenera-tive processes of different tissues.
Acknowledgments
The authors would like to thank to Fradique, R for the help withthe design of the BSA release simulation in Matlab. This work wassupported by the Portuguese Foundation for Science and Tech-nology (FCT) (PTDC/EME-TME/103375/2008). Gaspar V.M. alsoacknowledges a PhD fellowship from FCT (SFRH/BD/80402/2011).
References
[1] Berner A, Boerckel J, Saifzadeh S, Steck R, Ren J, Vaquette C, et al. Biomimetictubular nanofiber mesh and platelet rich plasma-mediated delivery of BMP-7for large bone defect regeneration. Cell and Tissue Research 2012;347(3):603e12.
[2] Liu J, Xu L, Li Y, Ma J. Temporally controlled multiple-gene delivery in scaf-folds: A promising strategy to enhance bone regeneration. Medical Hypoth-eses 2011;76(2):173e5.
[3] Vo TN, Kasper FK, Mikos AG. Strategies for controlled delivery of growthfactors and cells for bone regeneration. Advanced Drug Delivery Reviews2012;64(12):1292e309.
[4] Bae SE, Choi J, Joung YK, Park K, Han DK. Controlled release of bonemorphogenetic protein (BMP)-2 from nanocomplex incorporated onhydroxyapatite-formed titanium surface. Journal of Controlled Release 2012;160(3):676e84.
[5] Kim S, Kang Y, Krueger CA, Sen M, Holcomb JB, Chen D, et al. Sequentialdelivery of BMP-2 and IGF-1 using a chitosan gel with gelatin microspheresenhances early osteoblastic differentiation. Acta Biomaterialia 2012;8(5):1768e77.
[6] Trouche E, Girod Fullana S, Mias C, Ceccaldi C, Tortosa F, Seguelas MH, et al.Evaluation of alginate microspheres for mesenchymal stem cell engraftmenton solid organ. Cell transplantation 2010;19(12):1623e33.
[7] Zolnik BS, Burgess DJ. Evaluation of in vivo in vitro release of dexamethasonefrom PLGA microspheres. Journal of controlled release 2008;127(2):137e45.
[8] Richardson TP, Peters MC, Ennett AB, Mooney DJ. Polymeric system for dualgrowth factor delivery. Nature biotechnology 2001;19(11):1029e34.
[9] Simmons CA, Alsberg E, Hsiong S, Kim WJ, Mooney DJ. Dual growth factordelivery and controlled scaffold degradation enhance in vivo bone formationby transplanted bone marrow stromal cells. Bone 2004;35(2):562e9.
[10] Kumar S, Reddy J. A Review on Microsphere for Novel drug delivery System.Journal of Pharmacy Research 2012;5(1).
[11] Lee M, Li W, Siu RK, Whang J, Zhang X, Soo C, et al. Biomimetic apatite-coatedalginate/chitosan microparticles as osteogenic protein carriers. Biomaterials2009;30(30):6094e101.
[12] Oliva-Rodríguez R, Pérez-Urizar J, Dibildox-Alvarado E, Martínez-Saldaña MC,Avelar-González FJ, Flores-Reyes H, et al. Design of a controlled release systemof OP-1 and TGF-b1 based in microparticles of sodium alginate and releasecharacterization by HPLC-UV. Vitro Cellular & Developmental Biology-Animal2011;47(10):1e8.
[13] Lin Y, Tang W, Wu L, Jing W, Li X, Wu Y, et al. Bone regeneration by BMP-2enhanced adipose stem cells loading on alginate gel. Histochemistry and cellbiology 2008;129(2):203e10.
[14] Möbus K, Siepmann J, Bodmeier R. Zincealginate microparticles for controlledpulmonary delivery of proteins prepared by spray-drying. European Journal ofPharmaceutics and Biopharmaceutics 2012;81(1):121e30.
[15] Grellier M, Granja PL, Fricain J-C, Bidarra SJ, Renard M, Bareille R, et al. Theeffect of the co-immobilization of human osteoprogenitors and endothelialcells within alginate microspheres on mineralization in a bone defect.Biomaterials 2009;30(19):3271e8.
[16] Hernández RM, Orive G, Murua A, Pedraz JL. Microcapsules and microcarriersfor in situ cell delivery. Advanced drug delivery reviews 2010;62(7-8):711e30.
[17] Baruch L, Benny O, Gilert A, Ukobnik M, Ben Itzhak O, Machluf M. Alginate-PLLcell encapsulation system Co-entrapping PLGA-microspheres for the contin-uous release of anti-inflammatory drugs. Biomedical microdevices 2009;11(5):1103e13.
[18] Murua A, Portero A, Orive G, Hernández RM, de Castro M, Pedraz JL. Cellmicroencapsulation technology: towards clinical application. Journal ofControlled Release 2008;132(2):76e83.
[19] Kanczler JM, Ginty PJ, White L, Clarke NMP, Howdle SM, Shakesheff KM, et al.The effect of the delivery of vascular endothelial growth factor and bonemorphogenic protein-2 to osteoprogenitor cell populations on bone forma-tion. Biomaterials 2010;31(6):1242e50.
[20] Shah NJ, Macdonald ML, Beben YM, Padera RF, Samuel RE, Hammond PT.Tunable dual growth factor delivery from polyelectrolyte multilayer films.Biomaterials 2011;32(26):6183e93.
[21] Grenha A, Remunán-López C, Carvalho ELS, Seijo B. Microspheres containinglipid/chitosan nanoparticles complexes for pulmonary delivery of therapeuticproteins. European journal of pharmaceutics and biopharmaceutics 2008;69(1):83e93.
[22] Park JS, Yang HN, Woo DG, Jeon SY, Park K-H. The promotion of chondro-genesis, osteogenesis, and adipogenesis of human mesenchymal stem cells bymultiple growth factors incorporated into nanosphere-coated microspheres.Biomaterials 2011;32(1):28e38.
[23] Mohanraj EK, K., S., Rajkumar N. Study on concrete using waste materials bypartial replacement of aggregates to reduce global warming gases. IndianJournal of Science Technology 2011;4(3):159e264.
[24] Zhao D, Zhao X, Zu Y, Li J, Zhang Y, Jiang R, et al. Preparation, characterization,and in vitro targeted delivery of folate-decorated paclitaxel-loaded bovineserum albumin nanoparticles. International journal of nanomedicine 2010;5:669e77.
[25] Chen Y, Mohanraj VJ, Parkin JE. Chitosan-dextran sulfate nanoparticles fordelivery of an anti-angiogenesis peptide. International Journal of PeptideResearch and Therapeutics 2003;10(5):621e9.
[26] Sarmento B, Ribeiro A, Veiga F, Ferreira D. Development and characterizationof new insulin containing polysaccharide nanoparticles. Colloids and SurfacesB: Biointerfaces 2006;53(2):193e202.
[27] Chen Y, Mohanraj VJ, Wang F, Benson HAE. Designing chitosan-dextransulfate nanoparticles using charge ratios. AAPS Pharmscitech 2007;8(4):131e9.
[28] Sharma S, Mukkur TK, Benson H, Chen Y. Enhanced immune response againstpertussis toxoid by IgA-loaded chitosanedextran sulfate nanoparticles. Jour-nal of Pharmaceutical Sciences 2012;101(1):233e44.
J.F.A. Valente et al. / Polymer 54 (2013) 5e1514
[29] Pan Y, Li Y, Zhao H, Zheng J, Xu H, Wei G, et al. Bioadhesive polysaccharide inprotein delivery system: chitosan nanoparticles improve the intestinalabsorption of insulin in vivo. International journal of pharmaceutics 2002;249(1):139e47.
[30] Anitha A, Deepagan V, Rani V, Menon D, Nair S, Jayakumar R. Preparationcharacterization in vitro drug release and biological studies of curcuminloaded dextran sulfate-chitosan nanoparticles. Carbohydrate Polymers 2011;84(3):1158e64.
[31] Li Z, Chen X, Xu X, Ye, Wang J. Preparation of chitosanesodium alginatemicrocapsules containing ZnS nanoparticles and its effect on the drug release.Materials Science and Engineering: C 2009;29(7):2250e3.
[32] Xu Y, Hanna MA. Electrosprayed bovine serum albumin-loaded tripolyphos-phate cross-linked chitosan capsules: Synthesis and characterization. Journalof microencapsulation 2007;24(2):143e51.
[33] Gaspar V, Sousa F, Queiroz J, Correia I. Formulation of chitosaneTPPepDNAnanocapsules for gene therapy applications. Nanotechnology 2011;22.015101.
[34] Zhang L, Guo J, Peng X, Jin Y. Preparation and release behavior of carbox-ymethylated chitosan/alginate microspheres encapsulating bovine serumalbumin. Journal of applied polymer science 2004;92(2):878e82.
[35] Scientific, T., BCA-based Protein Assays. Thermo Scientific Pierce Protein AssayTechnical Handbook: 15.
[36] Han Y, Tian H, He, Chen X, Jing X. Insulin nanoparticle preparation andencapsulation into poly (lactic-co-glycolic acid) microspheres by using ananhydrous system. International journal of pharmaceutics 2009;378(1-2):159e66.
[37] Yu CY, Zhang XC, Zhou FZ, Zhang XZ, Cheng SX, Zhuo RX. Sustained release ofantineoplastic drugs from chitosan-reinforced alginate microparticle drugdelivery systems. International journal of pharmaceutics 2008;357(1):15e21.
[38] Higuchi T. Mechanism of sustained-action medication. Theoretical analysis ofrate of release of solid drugs dispersed in solid matrices. Journal of pharma-ceutical sciences 1963;52(12):1145e9.
[39] Costa, Sousa Lobo JM. Modeling and comparison of dissolution profiles.European journal of pharmaceutical sciences 2001;13(2):123e33.
[40] Ribeiro MP, Espiga A, Silva D, Baptista J, Henriques, Ferreira C, et al. Devel-opment of a new chitosan hydrogel for wound dressing. Wound Repair andRegeneration 2009;17(6):817e24.
[41] Coimbra P, Ferreira H, de Sousa, Batista M, Rodrigues, Correia I, et al. Sodiumhyaluronate/chitosan polyelectrolyte complex scaffolds for dental pulpregeneration: Synthesis and characterization. International Journal of Bio-logical Macromolecules 2011;49(4):573e9.
[42] da Silva MS, Viveiros R, Morgado PI, Aguiar-Ricardo A, Correia IJ, Casimiro T.Development of 2-(dimethylamino) ethyl methacrylate-based molecularrecognition devices for controlled drug delivery using supercritical fluidtechnology. International journal of pharmaceutics 2011;416(1):61e8.
[43] Xu S, De Becker A, Van Camp B, Vanderkerken K, Van Riet I. An improvedharvest and in vitro expansion protocol for murine bone marrow-derivedmesenchymal stem cells. Journal of Biomedicine and Biotechnology 2010;2010:10.
[44] Hunt N, Smith AM, Gbureck U, Shelton R, Grover L. Encapsulation of fibro-blasts causes accelerated alginate hydrogel degradation. Acta Biomaterialia2010;6(9):3649e56.
[45] Gonçalves A, Costa MT, Rodrigues IR, Dias RL, Reis, Gomes ME. Effect of flowperfusion conditions in the chondrogenic differentiation of bone marrowstromal cells cultured onto starch based biodegradable scaffolds. Acta Bio-materialia 2011;7(4):1644e52.
[46] Hungerford G, Benesch J, Mano JF, Reis RL. Effect of the labelling ratio on thephotophysics of fluorescein isothiocyanate (FITC) conjugated to bovine serumalbumin. Photochem. Photobiol. Sci. 2007;6(2):152e8.
[47] Causa F, Netti PA, Ambrosio L. A multi-functional scaffold for tissue regener-ation: The need to engineer a tissue analogue. Biomaterials 2007;28(34):5093e9.
[48] Gombotz WR, Wee SF. Protein release from alginate matrices. Advanced DrugDelivery Reviews 1998;31(3):267e85.
[49] Tu J, Bolla S, Barr J, Miedema J, Li X, Jasti B. Alginate microparticles prepared bysprayecoagulation method: Preparation, drug loading and release charac-terization. International journal of pharmaceutics 2005;303(1):171e81.
[50] Iijima M, Hatakeyama T, Nakamura K, Hatakeyama H. Thermomechanicalanalysis of calcium alginate hydrogels in water. Journal of thermal analysisand calorimetry 2002;70(3):807e14.
[51] Moudgil S, Ying JY. Calcium-Doped Organosilicate Nanoparticles as GeneDelivery Vehicles for Bone Cells. Advanced Materials 2007;19(20):3130e5.
[52] Hatano K, Inoue H, Kojo T, Matsunaga T, Tsujisawa T, Uchiyama C, et al. Effectof surface roughness on proliferation and alkaline phosphatase expression ofrat calvarial cells cultured on polystyrene. Bone 1999;25(4):439e45.
[53] Huang S, Fu X. Cell behavior on microparticles with different surfacemorphology. Journal of Alloys and Compounds 2010;493(1):246e51.
[54] Chu PK, Chen J, Wang L, Huang N. Plasma-surface modification of biomate-rials. Materials Science and Engineering: R: Reports 2002;36(5-6):143e206.
[55] Price RL, Ellison K, Haberstroh KM, Webster TJ. Nanometer surface roughnessincreases select osteoblast adhesion on carbon nanofiber compacts. Journal ofBiomedical Materials Research Part A 2004;70(1):129e38.
[56] Roach P, Parker T, Gadegaard N, Alexander M. Surface strategies for control ofneuronal cell adhesion: A review. Surface Science Reports 2010;65(6):145e73.
[57] Richardi J. One-dimensional assemblies of charged nanoparticles in water: Asimulation study. The Journal of chemical physics 2009;130. 044701.
[58] Bessa PC, Machado R, Nürnberger S, Dopler D, Banerjee A, Cunha AM, et al.Thermoresponsive self-assembled elastin-based nanoparticles for delivery ofBMPs. Journal of Controlled Release 2010;142(3):312e8.
[59] Mahl D, Diendorf J, Meyer-Zaika W, Epple M. Possibilities and limitations ofdifferent analytical methods for the size determination of a bimodal disper-sion of metallic nanoparticles. Colloids and Surfaces A: Physicochemical andEngineering Aspects 2011;377(1e3):386e92.
[60] Al-Kassas RS, Al-Gohary O, Al-Faadhel MM. Controlling of systemic absorptionof gliclazide through incorporation into alginate beads. International journalof pharmaceutics 2007;341(1-2):230e7.
[61] Pasparakis G, Bouropoulos N. Swelling studies and in vitro release of verap-amil from calcium alginate and calcium alginateechitosan beads. Interna-tional journal of pharmaceutics 2006;323(1):34e42.
[62] Bajpai S, Tankhiwale R. Investigation of water uptake behavior and stability ofcalcium alginate/chitosan bi-polymeric beads: Part-1. Reactive and FunctionalPolymers 2006;66(6):645e58.
[63] Gao C, Liu M, Chen J, Zhang X. Preparation and controlled degradation ofoxidized sodium alginate hydrogel. Polymer Degradation and Stability 2009;94(9):1405e10.
[64] Chretien C, Chaumeil J. Release of a macromolecular drug from alginate-impregnated microspheres. International journal of pharmaceutics 2005;304(1):18e28.
[65] Huang X, Brazel CS. On the importance and mechanisms of burst release inmatrix-controlled drug delivery systems. Journal of Controlled Release 2001;73(2):121e36.
[66] Dimitriou R, Tsiridis E, Giannoudis PV. Current concepts of molecular aspectsof bone healing. Injury 2005;36(12):1392e404.
[67] Boerckel JD, Kolambkar YM, Dupont KM, Uhrig BA, Phelps EA, Stevens HY,et al. Effects of protein dose and delivery system on BMP-mediated boneregeneration. Biomaterials 2011;32(22):5241e5251.
[68] Arifin DY, Lee LY, Wang CH. Mathematical modeling and simulation of drugrelease from microspheres: Implications to drug delivery systems. Advanceddrug delivery reviews 2006;58(12):1274e325.
[69] Bajpai SK, Sharma S. Investigation of swelling/degradation behaviour ofalginate beads crosslinked with Ca2+ and Ba2+ ions. Reactive and FunctionalPolymers 2004;59(2):129e40.
[70] Zhou H, Xu HHK. The fast release of stem cells from alginate-fibrin microbeadsin injectable scaffolds for bone tissue engineering. Biomaterials 2011;32(30):7503e13.
[71] Zuo Q, Lu J, Hong A, Zhong D, Xie S, Liu Q, et al. Preparation and character-ization of PEM-coated alginate microgels for controlled release of protein.Biomedical Materials 2012;(3):7. 035012.
J.F.A. Valente et al. / Polymer 54 (2013) 5e15 15

A bi-layer electrospun nanofiber membrane for plasmid DNA recovery from fermentation broths
Tiago R. Correia a, Bernardo P. Antunes a, Pedro H. Castilho a, José C. Nunes a, Maria T. Pessoa de Amorim b,Isabel C. Escobar c, João A. Queiroz a, Ilídio J. Correia a,⇑, António M. Morão a
a CICS-UBI – Health Sciences Research Center, Faculty of Health Sciences, University of Beira Interior, Covilhã, Portugal b Department of Textile Engineering, University of Minho, 4800-058 Guimarães, Portugal c Department of Chemical and Environmental Engineering, University of Toledo, Toledo, OH 43606, United States
a r t i c l e i n f o
Article history:Received 2 February 2013 Received in revised form 28 March 2013 Accepted 29 March 2013 Available online 6 April 2013
Keywords:MicrofiltrationElectrospinningBi-layer membrane LysatePlasmid DNA
a b s t r a c t
The demanding ever-increasing quantities of highly purified biomolecules by bio-industries, has triggered the development of new, more efficient, purification techniques. The application of mem- brane-bas ed technologies has become very attractive in this field, for their high throughput capability,simplicity of operation and scale-up.
Herein we report the produc tion of a bi-layer membra ne by electrospinning (ES), in which a support ofpoly e-caprolactone nanofibers was coated with a polyethylene oxide/sodium alginate layer, and subse- quently cross-linked with calcium chloride. The membranes were characterized by SEM, ATR-FTIR,contact angle measurements, and were applied in the recovery process of a plasmid. The results show that membranes retained the suspended solids while allowing the permeation of plasmid DNA, with high recovery yields and improved RNA retention. Moreover, they also showed a very low fouling tendency. Tothe best of our knowledg e it is the first time that ES membranes are applied in this type of bioprocess.
� 2013 Elsevier B.V. All rights reserved.
1. Introduction
The developmen t of new separation technologies suitable for the large-scale production of highly purified plasmid DNA (pDNA)for gene therapy applications and the production of DNA vaccines has found increasing interest in the recent years [1–4]. The use ofmicrofiltration and ultrafiltration membranes for pDNA recovery and purification from fermentation broths has been demonstrated as a promising alternative to conventional separation methods,namely those involving precipitatio n with solvents and centrifuga- tion [5].
Electrospinni ng is an easy and cheap method of producing nanofibrous materials. These can be obtained from a wide variety of polymers by controlling the solution properties and the process- ing condition s [6]. The simplicity of this procedure and the wide range of applications found in recent years, including tissue engineering applications, such as bone repair, wound healing and drug delivery carriers [7–9], in sensors and biosensors [10], in elec- trodes [11] and that of filtration [12–14] are important factors that lead to an increasing interest in developing new types of electro- spun nanofiber membranes (ENMs) [15]. Commonly, nanofibers
are electrospun into a support or produced in layer by layer arrangem ents [16,17]. In either case fiber deposition should be al- ways carried out on a support which provides the required mechanical strength to the films produced [16].
In the present study, a poly e-caprolactone (PCL) support was prepared by a conventional electrospi nning process. This polymer was selected based on the good mechanical properties that PCL meshes present [18] and also for being environmentall y friendly [19]. A coating based on an electrospun mixture of two polymers,sodium alginate (SA) combined with poly(ethylene) oxide (PEO)was deposited on the support. SA was selected for ENMs coating due to its high hydrophilici ty, relatively low cost and the ability of producing small diameter fibers by electrospinni ng, when mixed with PEO [20]. This asymmetric arrangement of two different lay- ers provides the membrane with adequate mechanical robustnes swhereas separation selective ness is regulated predominantl y bythe ultrathin layer of nanofibers.
The bi-layer membranes produced were characteri zed in terms of their morphology, hydrophilici ty and hydraulic permeabilit yprior to the filtration tests. The performance of the ENMs onthe filtration of cell lysates, obtained immediately after the cell lysis step, was evaluated and compared with that of commercial microfiltration membran es. From the best of our knowledge, this is the first time that ENMs are tested in the recovery process ofbiomolec ules from fermentation broths.
1383-5866/$ - see front matter � 2013 Elsevier B.V. All rights reserved.http://dx.doi.org/10.1016/j.seppur.2013.03.049
⇑ Corresponding author. Address: Av. Infante D. Henrique, 6200-506 Covilhã,Portugal. Tel.: +351 275 329 002; fax: +351 275 329 099.
E-mail address: [email protected] (I.J. Correia).
Separation and Purification Technology 112 (2013) 20–25
Contents lists available at SciVerse ScienceDi rect
Sepa ration and Purification Techn ology
journal homepage: www.elsevier .com/locate /seppur
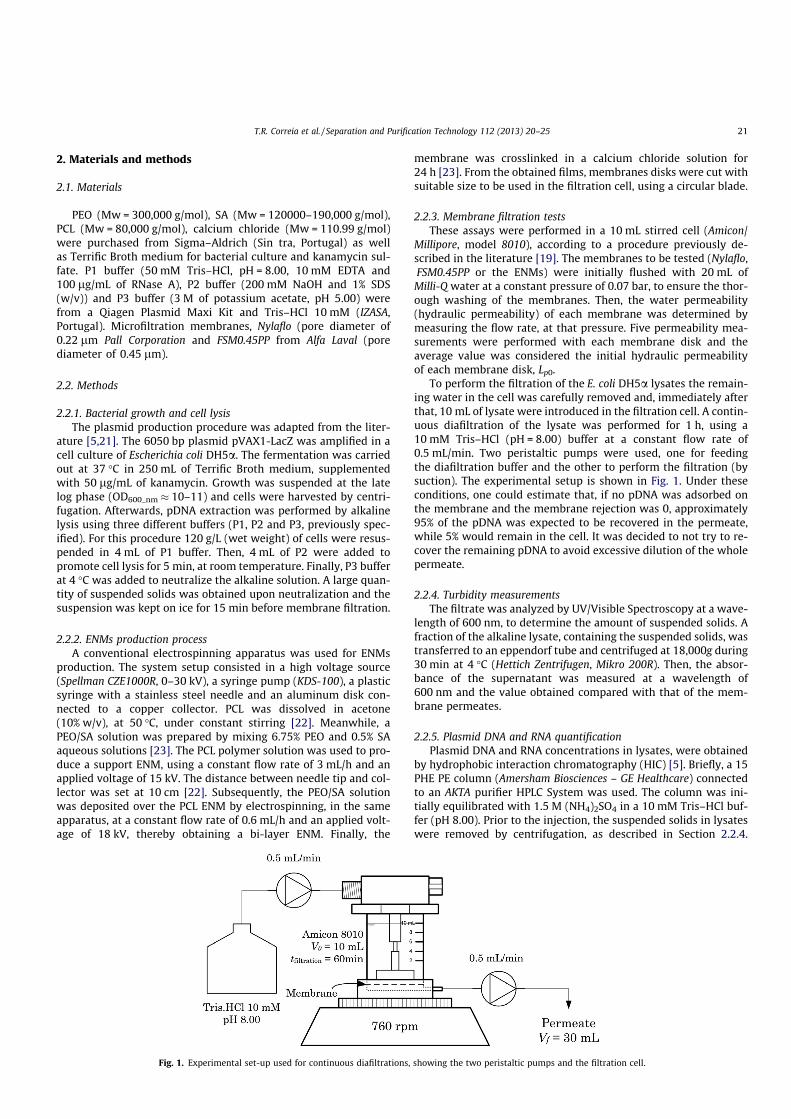
2. Materials and methods
2.1. Materials
PEO (Mw = 300,000 g/mol), SA (Mw = 120000–190,000 g/mol),PCL (Mw = 80,000 g/mol), calcium chloride (Mw = 110.99 g/mol)were purchased from Sigma–Aldrich (Sin tra, Portugal) as well as Terrific Broth medium for bacterial culture and kanamycin sul- fate. P1 buffer (50 mM Tris–HCl, pH = 8.00, 10 mM EDTA and 100 lg/mL of RNase A), P2 buffer (200 mM NaOH and 1% SDS (w/v)) and P3 buffer (3 M of potassium acetate, pH 5.00) were from a Qiagen Plasmid Maxi Kit and Tris–HCl 10 mM (IZASA,Portugal). Microfiltration membranes , Nylaflo (pore diameter of0.22 lm Pall Corporation and FSM0.45PP from Alfa Laval (porediameter of 0.45 lm).
2.2. Methods
2.2.1. Bacterial growth and cell lysis The plasmid production procedure was adapted from the liter-
ature [5,21]. The 6050 bp plasmid pVAX1-LacZ was amplified in acell culture of Escherichia coli DH5a. The fermentati on was carried out at 37 �C in 250 mL of Terrific Broth medium, supplemented with 50 lg/mL of kanamycin. Growth was suspended at the late log phase (OD600_nm � 10–11) and cells were harvested by centri- fugation. Afterwards, pDNA extraction was performed by alkaline lysis using three different buffers (P1, P2 and P3, previously spec- ified). For this procedure 120 g/L (wet weight) of cells were resus- pended in 4 mL of P1 buffer. Then, 4 mL of P2 were added topromote cell lysis for 5 min, at room temperature. Finally, P3 buffer at 4 �C was added to neutralize the alkaline solution. A large quan- tity of suspended solids was obtained upon neutralization and the suspension was kept on ice for 15 min before membran e filtration.
2.2.2. ENMs production process A conventional electrospinning apparatu s was used for ENMs
production. The system setup consisted in a high voltage source (Spellman CZE1000R , 0–30 kV), a syringe pump (KDS-100), a plastic syringe with a stainless steel needle and an aluminum disk con- nected to a copper collector. PCL was dissolved in acetone (10% w/v), at 50 �C, under constant stirring [22]. Meanwhile, aPEO/SA solution was prepared by mixing 6.75% PEO and 0.5% SAaqueous solutions [23]. The PCL polymer solution was used to pro- duce a support ENM, using a constant flow rate of 3 mL/h and anapplied voltage of 15 kV. The distance between needle tip and col- lector was set at 10 cm [22]. Subsequentl y, the PEO/SA solution was deposited over the PCL ENM by electrospinni ng, in the same apparatus, at a constant flow rate of 0.6 mL/h and an applied volt- age of 18 kV, thereby obtaining a bi-layer ENM. Finally, the
membran e was crosslinked in a calcium chloride solution for 24 h [23]. From the obtained films, membranes disks were cut with suitable size to be used in the filtration cell, using a circular blade.
2.2.3. Membrane filtration tests These assays were performed in a 10 mL stirred cell (Amicon/
Millipore, model 8010), according to a procedure previously de- scribed in the literature [19]. The membranes to be tested (Nylaflo,FSM0.45PP or the ENMs) were initially flushed with 20 mL ofMilli-Q water at a constant pressure of 0.07 bar, to ensure the thor- ough washing of the membranes . Then, the water permeabilit y(hydraulic permeabilit y) of each membrane was determined bymeasuring the flow rate, at that pressure . Five permeability mea- suremen ts were performed with each membrane disk and the average value was considered the initial hydraulic permeabilit yof each membran e disk, Lp0.
To perform the filtration of the E. coli DH5a lysates the remain- ing water in the cell was carefully removed and, immediatel y after that, 10 mL of lysate were introduce d in the filtration cell. A contin- uous diafiltration of the lysate was performed for 1 h, using a10 mM Tris–HCl (pH = 8.00) buffer at a constant flow rate of0.5 mL/min. Two peristaltic pumps were used, one for feeding the diafiltration buffer and the other to perform the filtration (bysuction). The experimental setup is shown in Fig. 1. Under these condition s, one could estimate that, if no pDNA was adsorbed onthe membrane and the membran e rejection was 0, approximat ely 95% of the pDNA was expected to be recovered in the permeate,while 5% would remain in the cell. It was decided to not try to re- cover the remaining pDNA to avoid excessive dilution of the whole permeate .
2.2.4. Turbidity measurements The filtrate was analyzed by UV/Visible Spectroscopy at a wave-
length of 600 nm, to determine the amount of suspended solids. Afraction of the alkaline lysate, containing the suspended solids, was transferred to an eppendorf tube and centrifuged at 18,000 g during30 min at 4 �C (Hettich Zentrifugen , Mikro 200R ). Then, the absor- bance of the supernatant was measure d at a wavelength of600 nm and the value obtained compare d with that of the mem- brane permeates.
2.2.5. Plasmid DNA and RNA quantification Plasmid DNA and RNA concentrations in lysates, were obtained
by hydrophobic interactio n chromatogr aphy (HIC) [5]. Briefly, a 15PHE PE column (Amersham Biosciences – GE Healthcare ) connected to an AKTA purifier HPLC System was used. The column was ini- tially equilibrated with 1.5 M (NH4)2SO4 in a 10 mM Tris–HCl buf- fer (pH 8.00). Prior to the injection, the suspended solids in lysates were removed by centrifugati on, as described in Section 2.2.4.
Fig. 1. Experimental set-up used for continuous diafiltrations, showing the two peristaltic pumps and the filtration cell.
T.R. Correia et al. / Separation and Purification Technology 112 (2013) 20–25 21
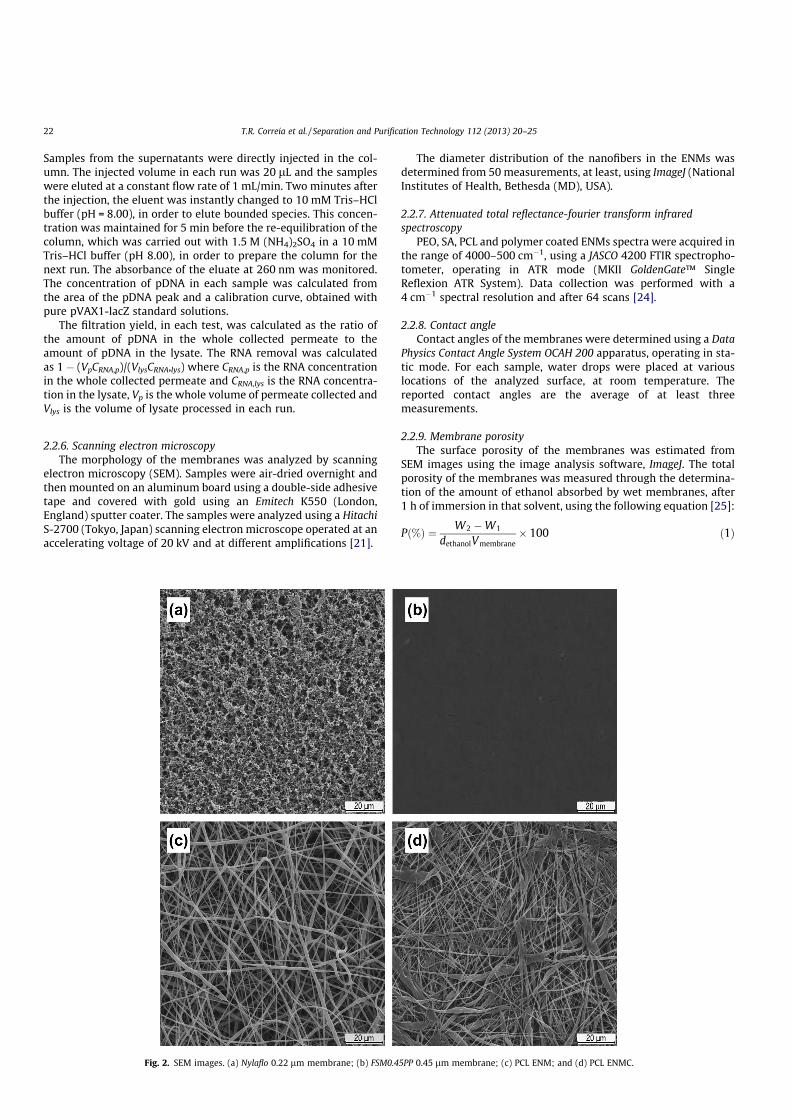
Samples from the supernatants were directly injected in the col- umn. The injected volume in each run was 20 lL and the samples were eluted at a constant flow rate of 1 mL/min. Two minutes after the injection , the eluent was instantly changed to 10 mM Tris–HClbuffer (pH = 8.00), in order to elute bounded species. This concen- tration was maintained for 5 min before the re-equilibra tion of the column, which was carried out with 1.5 M (NH4)2SO4 in a 10 mMTris–HCl buffer (pH 8.00), in order to prepare the column for the next run. The absorbance of the eluate at 260 nm was monitored.The concentration of pDNA in each sample was calculated from the area of the pDNA peak and a calibration curve, obtained with pure pVAX1-lacZ standard solutions.
The filtration yield, in each test, was calculated as the ratio ofthe amount of pDNA in the whole collected permeate to the amount of pDNA in the lysate. The RNA removal was calculated as 1 � (VpCRNA,p)/(VlysCRNA,lys) where CRNA,p is the RNA concentratio nin the whole collected permeate and CRNA,lys is the RNA concentra- tion in the lysate, Vp is the whole volume of permeate collected and Vlys is the volume of lysate processed in each run.
2.2.6. Scanning electron microscopy The morphology of the membranes was analyzed by scanning
electron microscopy (SEM). Samples were air-dried overnight and then mounted on an aluminum board using a double-side adhesive tape and covered with gold using an Emitech K550 (London,England) sputter coater. The samples were analyzed using a HitachiS-2700 (Tokyo, Japan) scanning electron microscope operated at anaccelerating voltage of 20 kV and at different amplifications [21].
The diameter distribution of the nanofibers in the ENMs was determined from 50 measurements , at least, using ImageJ (NationalInstitutes of Health, Bethesda (MD), USA).
2.2.7. Attenuated total reflectance-fourier transform infrared spectrosco py
PEO, SA, PCL and polymer coated ENMs spectra were acquired inthe range of 4000–500 cm�1, using a JASCO 4200 FTIR spectropho- tometer, operating in ATR mode (MKII GoldenGate™ Single Reflexion ATR System). Data collection was performed with a4 cm�1 spectral resolution and after 64 scans [24].
2.2.8. Contact angle Contact angles of the membranes were determined using a Data
Physics Contact Angle System OCAH 200 apparatu s, operating in sta- tic mode. For each sample, water drops were placed at various locations of the analyzed surface, at room temperature. The reported contact angles are the average of at least three measure ments.
2.2.9. Membrane porosity The surface porosity of the membranes was estimated from
SEM images using the image analysis software, ImageJ. The total porosity of the membranes was measured through the determina- tion of the amount of ethanol absorbed by wet membranes, after 1 h of immersion in that solvent, using the following equation [25]:
Pð%Þ ¼ W2 �W1
dethanolVmembrane� 100 ð1Þ
Fig. 2. SEM images. (a) Nylaflo 0.22 lm membrane; (b) FSM0.45PP 0.45 lm membrane; (c) PCL ENM; and (d) PCL ENMC.
22 T.R. Correia et al. / Separation and Purification Technology 112 (2013) 20–25
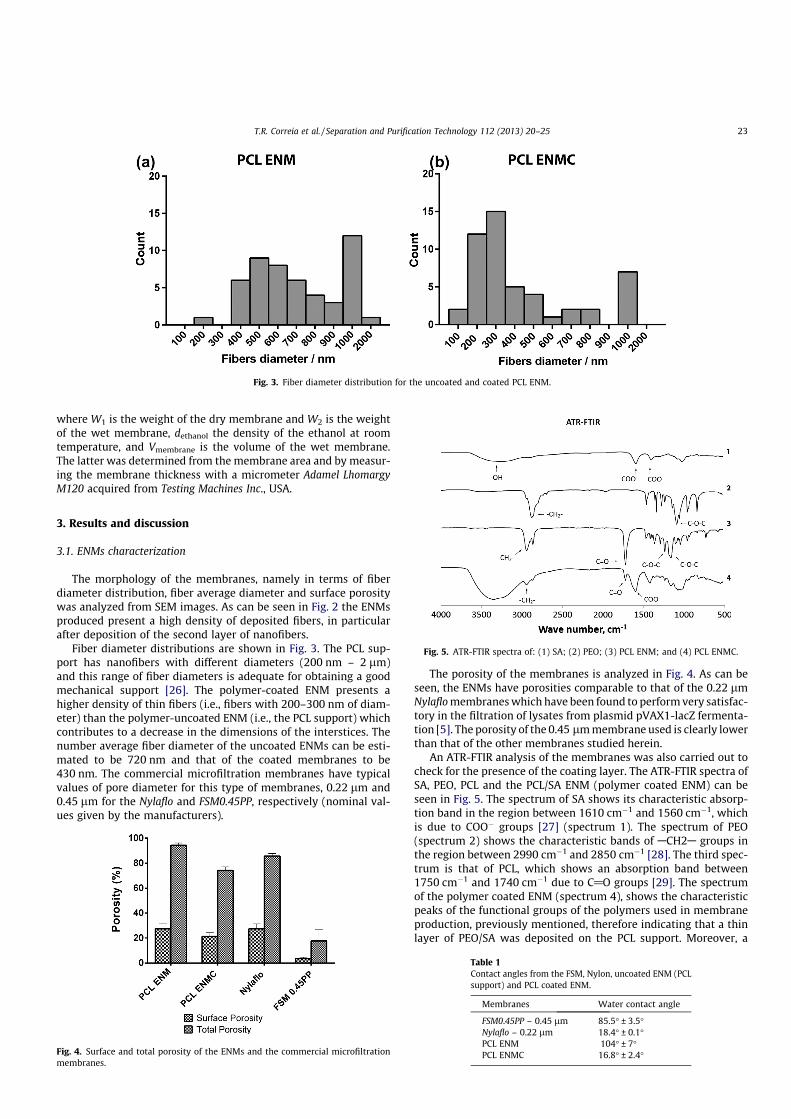
where W1 is the weight of the dry membrane and W2 is the weight of the wet membrane , dethanol the density of the ethanol at room temperatu re, and Vmembrane is the volume of the wet membrane .The latter was determine d from the membrane area and by measur- ing the membrane thickness with a micrometer Adamel Lhoma rgy M120 acquired from Testing Machi nes Inc ., USA.
3. Results and discussion
3.1. ENMs characterization
The morphology of the membranes , namely in terms of fiberdiameter distribution , fiber average diameter and surface porosity was analyzed from SEM images. As can be seen in Fig. 2 the ENMs produced present a high density of deposited fibers, in particular after deposition of the second layer of nanofibers.
Fiber diameter distribut ions are shown in Fig. 3. The PCL sup- port has nanofibers with different diameters (200 nm – 2 lm)and this range of fiber diameters is adequate for obtaining a good mechanical support [26]. The polymer-co ated ENM presents ahigher density of thin fibers (i.e., fibers with 200–300 nm of diam- eter) than the polymer-uncoate d ENM (i.e., the PCL support) which contributes to a decrease in the dimensions of the interstices. The number average fiber diameter of the uncoated ENMs can be esti- mated to be 720 nm and that of the coated membran es to be430 nm. The commerc ial microfiltration membran es have typical values of pore diameter for this type of membranes, 0.22 lm and 0.45 lm for the Nylaflo and FSM0.45PP, respectively (nominal val- ues given by the manufacturers).
The porosity of the membranes is analyzed in Fig. 4. As can beseen, the ENMs have porosities comparable to that of the 0.22 lmNylaflo membranes which have been found to perform very satisfac- tory in the filtration of lysates from plasmid pVAX1-lacZ fermenta- tion [5]. The porosity of the 0.45 lm membran e used is clearly lower than that of the other membran es studied herein.
An ATR-FTIR analysis of the membranes was also carried out tocheck for the presence of the coating layer. The ATR-FTIR spectra ofSA, PEO, PCL and the PCL/SA ENM (polymer coated ENM) can beseen in Fig. 5. The spectrum of SA shows its characterist ic absorp- tion band in the region between 1610 cm�1 and 1560 cm�1, which is due to COO � groups [27] (spectrum 1). The spectrum of PEO (spectrum 2) shows the characterist ic bands of ACH2A groups inthe region between 2990 cm�1 and 2850 cm�1 [28]. The third spec- trum is that of PCL, which shows an absorption band between 1750 cm�1 and 1740 cm�1 due to C@O groups [29]. The spectrum of the polymer coated ENM (spectrum 4), shows the characteristic peaks of the functional groups of the polymers used in membrane production, previously mentioned, therefore indicating that a thin layer of PEO/SA was deposited on the PCL support. Moreover, a
Fig. 3. Fiber diameter distribution for the uncoated and coated PCL ENM.
Fig. 4. Surface and total porosity of the ENMs and the commercial microfiltrationmembranes.
Fig. 5. ATR-FTIR spectra of: (1) SA; (2) PEO; (3) PCL ENM; and (4) PCL ENMC.
Table 1Contact angles from the FSM, Nylon, uncoated ENM (PCLsupport) and PCL coated ENM.
Membranes Water contact angle
FSM0.45PP – 0.45 lm 85.5 � ± 3.5 �Nylaflo – 0.22 lm 18.4 � ± 0.1 �PCL ENM 104 � ± 7�PCL ENMC 16.8 � ± 2.4 �
T.R. Correia et al. / Separation and Purification Technology 112 (2013) 20–25 23
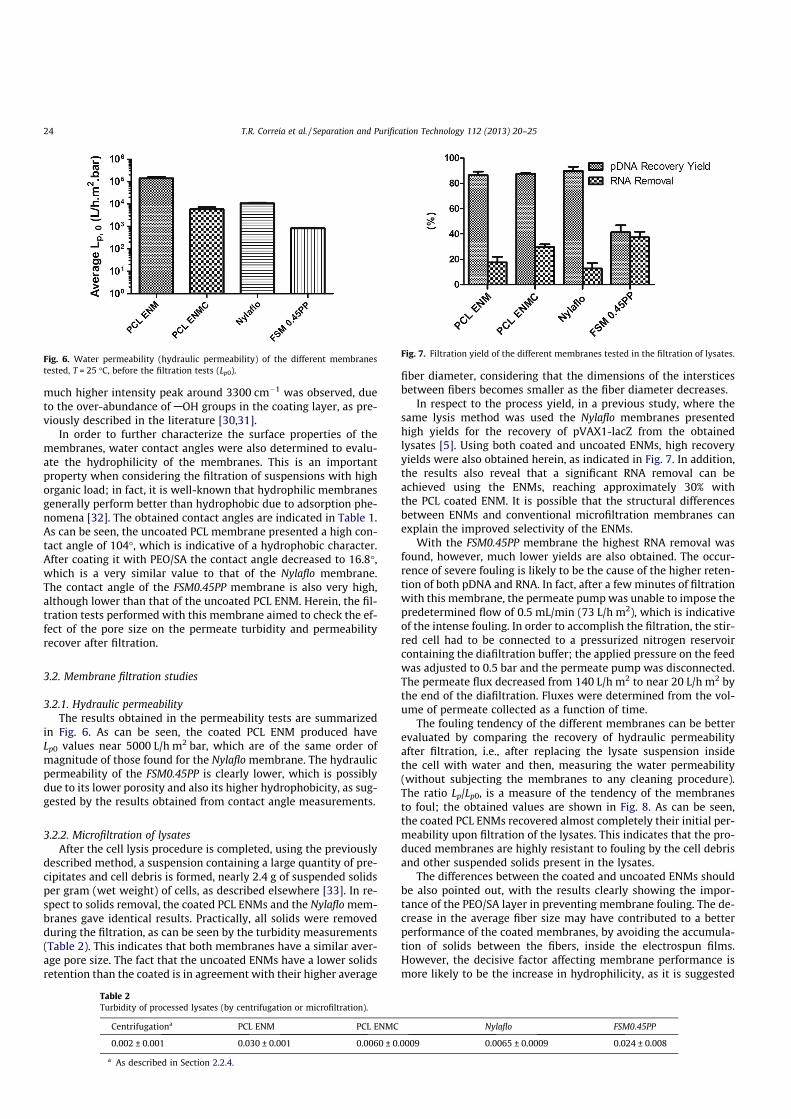
much higher intensity peak around 3300 cm�1 was observed, due to the over-abundanc e of AOH groups in the coating layer, as pre- viously described in the literature [30,31].
In order to further characterize the surface properties of the membranes , water contact angles were also determined to evalu- ate the hydrophilici ty of the membranes. This is an important property when considering the filtration of suspensions with high organic load; in fact, it is well-known that hydrophilic membranes generally perform better than hydrophobi c due to adsorption phe- nomena [32]. The obtained contact angles are indicated in Table 1.As can be seen, the uncoated PCL membrane presente d a high con- tact angle of 104 �, which is indicative of a hydrophobic character.After coating it with PEO/SA the contact angle decreased to 16.8 �,which is a very similar value to that of the Nylaflo membrane.The contact angle of the FSM0.45PP membrane is also very high,although lower than that of the uncoated PCL ENM. Herein, the fil-tration tests performed with this membrane aimed to check the ef- fect of the pore size on the permeate turbidity and permeabilit yrecover after filtration.
3.2. Membrane filtration studies
3.2.1. Hydraulic permeabili tyThe results obtained in the permeabilit y tests are summarized
in Fig. 6. As can be seen, the coated PCL ENM produced have Lp0 values near 5000 L/h m2 bar, which are of the same order ofmagnitude of those found for the Nylaflo membrane. The hydraulic permeabilit y of the FSM0.45PP is clearly lower, which is possibly due to its lower porosity and also its higher hydrophobici ty, as sug- gested by the results obtained from contact angle measureme nts.
3.2.2. Microfiltration of lysates After the cell lysis procedure is complete d, using the previously
described method, a suspension containing a large quantity of pre- cipitates and cell debris is formed, nearly 2.4 g of suspended solids per gram (wet weight) of cells, as described elsewhere [33]. In re- spect to solids removal, the coated PCL ENMs and the Nylaflo mem-branes gave identical results. Practically, all solids were removed during the filtration, as can be seen by the turbidity measurements (Table 2). This indicates that both membranes have a similar aver- age pore size. The fact that the uncoated ENMs have a lower solids retention than the coated is in agreement with their higher average
fiber diameter, consideri ng that the dimensio ns of the interstices between fibers becomes smaller as the fiber diameter decreases.
In respect to the process yield, in a previous study, where the same lysis method was used the Nylaflo membranes presented high yields for the recovery of pVAX1-lacZ from the obtained lysates [5]. Using both coated and uncoated ENMs, high recovery yields were also obtained herein, as indicated in Fig. 7. In addition,the results also reveal that a significant RNA removal can beachieved using the ENMs, reaching approximat ely 30% with the PCL coated ENM. It is possible that the structural differences between ENMs and conventional microfiltration membranes can explain the improved selectivity of the ENMs.
With the FSM0.45PP membrane the highest RNA removal was found, however, much lower yields are also obtained. The occur- rence of severe fouling is likely to be the cause of the higher reten- tion of both pDNA and RNA. In fact, after a few minutes of filtrationwith this membrane, the permeate pump was unable to impose the predeterm ined flow of 0.5 mL/min (73 L/h m2), which is indicative of the intense fouling. In order to accomplish the filtration, the stir- red cell had to be connected to a pressurized nitrogen reservoir containing the diafiltration buffer; the applied pressure on the feed was adjusted to 0.5 bar and the permeate pump was disconnected.The permeate flux decreased from 140 L/h m2 to near 20 L/h m2 bythe end of the diafiltration. Fluxes were determined from the vol- ume of permeate collected as a function of time.
The fouling tendency of the different membran es can be better evaluated by comparing the recovery of hydraulic permeabilit yafter filtration, i.e., after replacing the lysate suspension inside the cell with water and then, measuring the water permeabilit y(without subjecting the membranes to any cleaning procedure).The ratio Lp/Lp0, is a measure of the tendency of the membranes to foul; the obtained values are shown in Fig. 8. As can be seen,the coated PCL ENMs recovered almost completely their initial per- meability upon filtration of the lysates. This indicates that the pro- duced membranes are highly resistant to fouling by the cell debris and other suspended solids present in the lysates.
The differences between the coated and uncoated ENMs should be also pointed out, with the results clearly showing the impor- tance of the PEO/SA layer in preventing membrane fouling. The de- crease in the average fiber size may have contributed to a better performanc e of the coated membranes , by avoiding the accumula- tion of solids between the fibers, inside the electrospun films.However , the decisive factor affecting membran e performance ismore likely to be the increase in hydrophilicity, as it is suggested
Fig. 6. Water permeability (hydraulic permeability) of the different membranes tested, T = 25 �C, before the filtration tests (Lp0).
Table 2Turbidity of process ed lysates (by centrifugation or microfiltration).
Centrifugationa PCL ENM PCL ENMC Nylaflo FSM0 .45PP
0.002 ± 0.001 0.030 ± 0.001 0.0060 ± 0.0009 0.0065 ± 0.0009 0.024 ± 0.008
a As described in Section 2.2.4.
Fig. 7. Filtration yield of the different membranes tested in the filtration of lysates.
24 T.R. Correia et al. / Separation and Purification Technology 112 (2013) 20–25
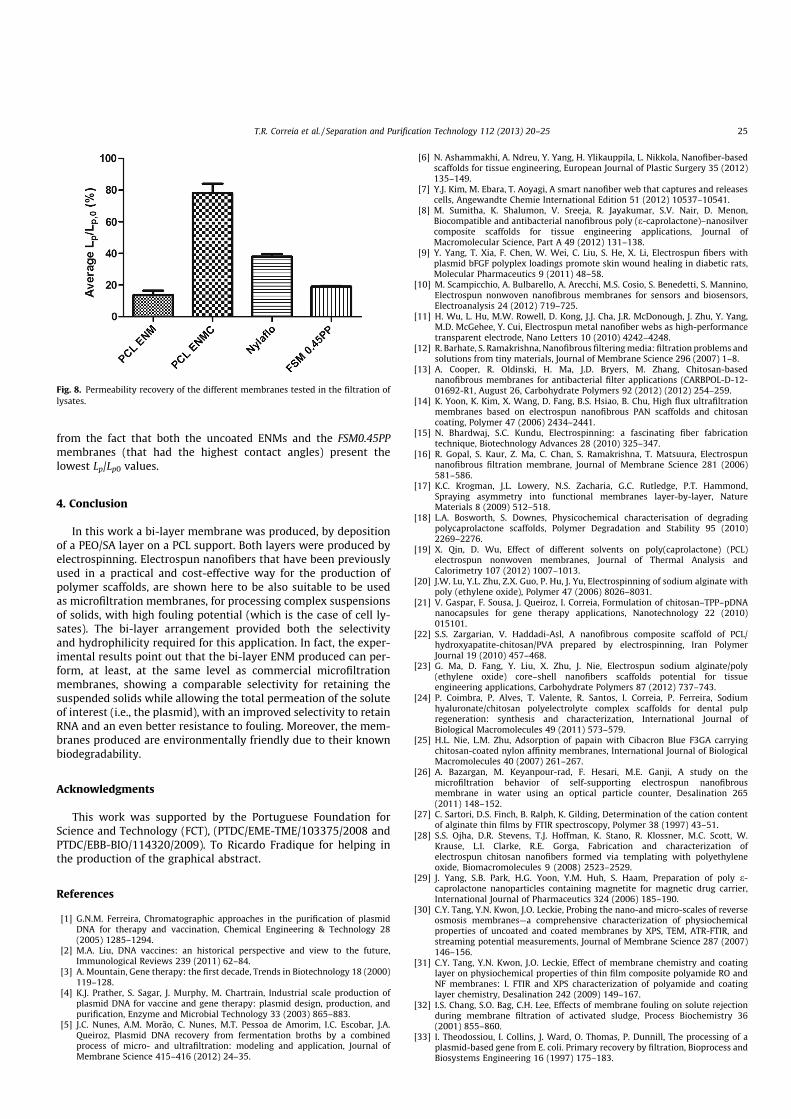
from the fact that both the uncoated ENMs and the FSM0.45PPmembranes (that had the highest contact angles) present the lowest Lp/Lp0 values.
4. Conclusion
In this work a bi-layer membrane was produced, by depositio nof a PEO/SA layer on a PCL support. Both layers were produced byelectrospinni ng. Electrospun nanofibers that have been previously used in a practical and cost-effecti ve way for the production ofpolymer scaffolds, are shown here to be also suitable to be used as microfiltration membranes , for processing complex suspensions of solids, with high fouling potential (which is the case of cell ly- sates). The bi-layer arrangement provided both the selectivity and hydrophilici ty required for this application. In fact, the exper- imental results point out that the bi-layer ENM produced can per- form, at least, at the same level as commercial microfiltrationmembranes , showing a compara ble selectivity for retaining the suspended solids while allowing the total permeation of the solute of interest (i.e., the plasmid), with an improved selectivity to retain RNA and an even better resistance to fouling. Moreover, the mem- branes produced are environmental ly friendly due to their known biodegradab ility.
Acknowled gments
This work was supported by the Portugue se Foundation for Science and Technology (FCT), (PTDC/EME-TME/103375/20 08 and PTDC/EBB-B IO/114320/2009). To Ricardo Fradique for helping inthe production of the graphical abstract.
References
[1] G.N.M. Ferreira, Chromatographic approaches in the purification of plasmid DNA for therapy and vaccination, Chemical Engineering & Technology 28(2005) 1285–1294.
[2] M.A. Liu, DNA vaccines: an historical perspective and view to the future,Immunological Reviews 239 (2011) 62–84.
[3] A. Mountain, Gene therapy: the first decade, Trends in Biotechnology 18 (2000)119–128.
[4] K.J. Prather, S. Sagar, J. Murphy, M. Chartrain, Industrial scale production ofplasmid DNA for vaccine and gene therapy: plasmid design, production, and purification, Enzyme and Microbial Technology 33 (2003) 865–883.
[5] J.C. Nunes, A.M. Morão, C. Nunes, M.T. Pessoa de Amorim, I.C. Escobar, J.A.Queiroz, Plasmid DNA recovery from fermentation broths by a combined process of micro- and ultrafiltration: modeling and application, Journal ofMembrane Science 415–416 (2012) 24–35.
[6] N. Ashammakhi, A. Ndreu, Y. Yang, H. Ylikauppila, L. Nikkola, Nanofiber-basedscaffolds for tissue engineering, European Journal of Plastic Surgery 35 (2012)135–149.
[7] Y.J. Kim, M. Ebara, T. Aoyagi, A smart nanofiber web that captures and releases cells, Angewandte Chemie International Edition 51 (2012) 10537–10541.
[8] M. Sumitha, K. Shalumon, V. Sreeja, R. Jayakumar, S.V. Nair, D. Menon,Biocompatible and antibacterial nanofibrous poly (e-caprolactone)–nanosilvercomposite scaffolds for tissue engineering applications, Journal ofMacromolecular Science, Part A 49 (2012) 131–138.
[9] Y. Yang, T. Xia, F. Chen, W. Wei, C. Liu, S. He, X. Li, Electrospun fibers with plasmid bFGF polyplex loadings promote skin wound healing in diabetic rats,Molecular Pharmaceutics 9 (2011) 48–58.
[10] M. Scampicchio, A. Bulbarello, A. Arecchi, M.S. Cosio, S. Benedetti, S. Mannino,Electrospun nonwoven nanofibrous membranes for sensors and biosensors,Electroanalysis 24 (2012) 719–725.
[11] H. Wu, L. Hu, M.W. Rowell, D. Kong, J.J. Cha, J.R. McDonough, J. Zhu, Y. Yang,M.D. McGehee, Y. Cui, Electrospun metal nanofiber webs as high-performance transparent electrode, Nano Letters 10 (2010) 4242–4248.
[12] R. Barhate, S. Ramakrishna, Nanofibrous filtering media: filtration problems and solutions from tiny materials, Journal of Membrane Science 296 (2007) 1–8.
[13] A. Cooper, R. Oldinski, H. Ma, J.D. Bryers, M. Zhang, Chitosan-based nanofibrous membranes for antibacterial filter applications (CARBPOL-D-12-01692-R1, August 26, Carbohydrate Polymers 92 (2012) (2012) 254–259.
[14] K. Yoon, K. Kim, X. Wang, D. Fang, B.S. Hsiao, B. Chu, High flux ultrafiltrationmembranes based on electrospun nanofibrous PAN scaffolds and chitosan coating, Polymer 47 (2006) 2434–2441.
[15] N. Bhardwaj, S.C. Kundu, Electrospinning: a fascinating fiber fabrication technique, Biotechnology Advances 28 (2010) 325–347.
[16] R. Gopal, S. Kaur, Z. Ma, C. Chan, S. Ramakrishna, T. Matsuura, Electrospun nanofibrous filtration membrane, Journal of Membrane Science 281 (2006)581–586.
[17] K.C. Krogman, J.L. Lowery, N.S. Zacharia, G.C. Rutledge, P.T. Hammond,Spraying asymmetry into functional membranes layer-by-layer, Nature Materials 8 (2009) 512–518.
[18] L.A. Bosworth, S. Downes, Physicochemical characterisation of degrading polycaprolactone scaffolds, Polymer Degradation and Stability 95 (2010)2269–2276.
[19] X. Qin, D. Wu, Effect of different solvents on poly(caprolactone) (PCL)electrospun nonwoven membranes, Journal of Thermal Analysis and Calorimetry 107 (2012) 1007–1013.
[20] J.W. Lu, Y.L. Zhu, Z.X. Guo, P. Hu, J. Yu, Electrospinning of sodium alginate with poly (ethylene oxide), Polymer 47 (2006) 8026–8031.
[21] V. Gaspar, F. Sousa, J. Queiroz, I. Correia, Formulation of chitosan–TPP–pDNAnanocapsules for gene therapy applications, Nanotechnology 22 (2010)015101.
[22] S.S. Zargarian, V. Haddadi-Asl, A nanofibrous composite scaffold of PCL/ hydroxyapatite-chitosan/PVA prepared by electrospinning, Iran Polymer Journal 19 (2010) 457–468.
[23] G. Ma, D. Fang, Y. Liu, X. Zhu, J. Nie, Electrospun sodium alginate/poly (ethylene oxide) core–shell nanofibers scaffolds potential for tissue engineering applications, Carbohydrate Polymers 87 (2012) 737–743.
[24] P. Coimbra, P. Alves, T. Valente, R. Santos, I. Correia, P. Ferreira, Sodium hyaluronate/chitosan polyelectrolyte complex scaffolds for dental pulp regeneration: synthesis and characterization, International Journal ofBiological Macromolecules 49 (2011) 573–579.
[25] H.L. Nie, L.M. Zhu, Adsorption of papain with Cibacron Blue F3GA carrying chitosan-coated nylon affinity membranes, International Journal of Biological Macromolecules 40 (2007) 261–267.
[26] A. Bazargan, M. Keyanpour-rad, F. Hesari, M.E. Ganji, A study on the microfiltration behavior of self-supporting electrospun nanofibrousmembrane in water using an optical particle counter, Desalination 265 (2011) 148–152.
[27] C. Sartori, D.S. Finch, B. Ralph, K. Gilding, Determination of the cation content of alginate thin films by FTIR spectroscopy, Polymer 38 (1997) 43–51.
[28] S.S. Ojha, D.R. Stevens, T.J. Hoffman, K. Stano, R. Klossner, M.C. Scott, W.Krause, L.I. Clarke, R.E. Gorga, Fabrication and characterization ofelectrospun chitosan nanofibers formed via templating with polyethylene oxide, Biomacromolecules 9 (2008) 2523–2529.
[29] J. Yang, S.B. Park, H.G. Yoon, Y.M. Huh, S. Haam, Preparation of poly e-caprolactone nanoparticles containing magnetite for magnetic drug carrier,International Journal of Pharmaceutics 324 (2006) 185–190.
[30] C.Y. Tang, Y.N. Kwon, J.O. Leckie, Probing the nano-and micro-scales of reverse osmosis membranes—a comprehensive characterization of physiochemical properties of uncoated and coated membranes by XPS, TEM, ATR-FTIR, and streaming potential measurements, Journal of Membrane Science 287 (2007)146–156.
[31] C.Y. Tang, Y.N. Kwon, J.O. Leckie, Effect of membrane chemistry and coating layer on physiochemical properties of thin film composite polyamide RO and NF membranes: I. FTIR and XPS characterization of polyamide and coating layer chemistry, Desalination 242 (2009) 149–167.
[32] I.S. Chang, S.O. Bag, C.H. Lee, Effects of membrane fouling on solute rejection during membrane filtration of activated sludge, Process Biochemistry 36(2001) 855–860.
[33] I. Theodossiou, I. Collins, J. Ward, O. Thomas, P. Dunnill, The processing of aplasmid-based gene from E. coli. Primary recovery by filtration, Bioprocess and Biosystems Engineering 16 (1997) 175–183.
Fig. 8. Permeability recovery of the different membranes tested in the filtration oflysates.
T.R. Correia et al. / Separation and Purification Technology 112 (2013) 20–25 25