Production of multilayer tablets via the novel Gluing ...
90
Valjon Demiri Production of multilayer tablets via the novel Gluing Pills Technology and their characterization MASTER'S THESIS to achieve the university degree of Master of Science Master's degree programme: Chemical and Pharmaceutical Engineering submitted to Graz University of Technology Supervisor Univ.-Prof. DI Dr. Johannes Khinast Research Center Pharmaceutical Engineering GmbH Dr. Sharareh Salar - Behzadi Research Center Pharmaceutical Engineering GmbH Graz, June 2017
Transcript of Production of multilayer tablets via the novel Gluing ...
Valjon Demiri
Production of multilayer tablets via the novel Gluing Pills Technology and
their characterization
MASTER'S THESIS
to achieve the university degree of Master of Science
Master's degree programme: Chemical and Pharmaceutical Engineering
submitted to
Graz University of Technology
Supervisor
Univ.-Prof. DI Dr. Johannes Khinast Research Center Pharmaceutical Engineering GmbH
Dr. Sharareh Salar - Behzadi Research Center Pharmaceutical Engineering GmbH
Graz, June 2017

AFFIDAVIT
I declare that I have authored this thesis independently, that I have not used other
than the declared sources/resources, and that I have explicitly indicated all material
which has been quoted either literally or by content from the sources used. The text
document uploaded to TUGRAZ online is identical to the present master‘s thesis.
Date Signature
4
Acknowledgements
Firstly, I would like to thank my supervisor Professor Johannes Khinast and co-
supervisor Sharareh – Salar Behzadi, for their professional support and guidance
throughout this master’s thesis. A thank you goes to Professor Heidrun Gruber –
Woelfler for backing me up on the master’s final examination. As well as, a thank you
to the RCPE’s team for their scientific and technical support.
I would like to show my appreciation to the Graz University of Technology, for
the financial support over two years of my studies, it has been a great help and boost.
A big thank to Zeko, Fatima, Armin and Denis for the warm welcoming in the
beginning of my studies in Graz.
A huge thank you goes to my parents Gazi and Axhere, my sisters Afërdita and
Shpenzije, and my relatives for their patience, understanding and being ready to help
me at any time I asked. Further, a thank you for my other family, my beloved Snezana
that listened and advised me in my every difficult moment, my sis Carolina, and bros
Ian and Hector, and all my friends at my hometown Gostivar for the endless
encouragement and moral support.
Happiness lies in the joy of achievement
and the thrill of creative effort.
- Franklin D. Roosevelt -
5
Abstract
During the last two decades, there is a growing interest in the manufacturing of
multilayer tablets. The conventional manufacturing method is via rotary tablet
presses by filling the raw materials as powder or granular blends into the die
separately and compacting either simultaneously or consecutively. Drawbacks of this
method are inaccurate layer weight control, insufficient interfacial bonding of layers,
and cross-contamination.
In the present study, the processability of the novel “Gluing Pills Technology”
was investigated for the manufacturing of multilayer tablets. In this technology, the
tablet bodies are compressed separately and glued together in an additional process
by applying a polymeric gluing agent to produce multilayer tablets. Plastically
deforming Avicel Ph 102 and the brittle dibasic calcium phosphate dihydrate (DCPD)
were used as excipients for preparing high load blends with ibuprofen free acid (30%
w/w) or caffeine anhydrous (40% w/w) as active pharmaceutical ingredients (API).
The compaction simulator Stylcam 200R® was used for assessing the deformation
behavior of pure excipients and their binary blends with API using the Heckel’s
equation. Tensile strength and elastic recovery of tablets after production was
measured. Tablets composing possible combinations of excipient and API were
manufactured using 10 and 20 kN compaction force. Mean roughness parameter Ra of
the tablet bodies was determined via Optical Coherence Tomography (OCT) and the
taken images were analyzed using image analysis software. Aqueous solutions of fish
gelatin and PVP K90 were used as gluing agents for manufacturing of multilayer
tablets of caffeine and ibuprofen. The tendency of bilayer tablets to delamination was
investigated via friability test. The impact of tablet’s physical properties such as
bonding behavior, elastic recovery, tensile strength, compression force and the type
of gluing agent on the interfacial adherence of layers and the tendency to delamination
was studied. The release profile of the API from the tablets was investigated within 2
hours and 24 hours via dissolution test.
Elastic recovery of tablets together with deformation behavior was the most
important factor, its mismatching between layers significantly affected the
delamination tendency. The lower viscous fish gelatin solution showed better

6
adhesive properties than the PVP K90, which may be due to its better penetration into
the pores and microstructures on the tablet surface. The results of this study point out
that by careful selection of the materials and the production process parameters, the
production of quality multilayer tablets via the Gluing Pills Technology is feasible. This
technology can be used for manufacturing of personalized medicine and offers the
flexible and individual combinations of APIs with different release profile.
7
Zusammenfassung
In den letzten zwei Jahrzehnten ist das Interesse an der Herstellung von
mehrschichtigen Tabletten stetig gewachsen. Das herkömmliche
Herstellungsverfahren erfolgt über Rotationstablettenpressen, in denen
Rohmaterialien als Pulver oder Granulat in die Matrize einzeln gefüllt und gleichzeitig
oder nacheinander verdichtet werden. Nachteile dieses Verfahrens sind nicht präzise
Regelung des Schichtgewichts, unzureichende Grenzflächenbindung von Schichten
und Kreuzkontamination.
In dieser Studie wurde die Verarbeitbarkeit der neuartigen "Gluing Pills"
Technologie für die Herstellung von mehrschichtigen Tabletten untersucht. Bei dieser
Technologie werden die Tablettenkörper separat gepresst und in einem weiteren
Verfahren zusammengeklebt, indem ein polymeres Klebemittel aufgebracht wird, um
mehrschichtige Tabletten herzustellen. Plastisch verformendes Avicel Ph 102 und das
spröde dibasische Kalziumphosphatdihydrat (DCPD) wurden als Hilfsstoffe zur
Herstellung von Hochleistungsmischungen mit Ibuprofen-freier Säure (30% w/w)
oder wasserfreiem Koffein (40% w/w) als pharmazeutischer Wirkstoff (API). Der
Verdichtungssimulator Stylcam 200R® wurde zur Beurteilung des
Verformungsverhaltens von reinen Hilfsstoffen und deren binären Mischungen mit
API unter Verwendung der Gleichung nach Heckel verwendet. Zugfestigkeit und
elastische Rückgewinnung von Tabletten nach der Produktion wurden gemessen.
Tabletten, zusammengesetzt aus möglichen Kombinationen von Hilfsstoff und API,
wurden unter Verwendung von 10 und 20 kN Verdichtungskraft hergestellt. Der
mittlere Rauheitsparameter Ra der Tablettenkörper wurde mittels optischer
Kohärenztomographie (OCT) bestimmt und die aufgenommenen Bilder wurden
mittels Bildanalyse-Software analysiert. Wässrige Lösungen von Fischgelatine und
PVP K90 wurden als Klebstoffe für die Herstellung von mehrschichtigen Tabletten aus
Koffein und Ibuprofen verwendet. Die Tendenz von Zweischichttabletten zur
Delaminierung wurde mittels Zerreibbarkeitstest untersucht. Die Auswirkung der
physikalischen Eigenschaften der Tabletten wie Bindungsverhalten, elastische
Rückgewinnung, Zugfestigkeit, Druckkraft und die Art des Klebemittels auf die
Grenzflächenhaftung der Schichten und die Tendenz zur Delaminierung wurde

8
untersucht. Das Freisetzungsprofil des API aus den Tabletten wurde innerhalb von 2
Stunden und 24 Stunden mittels Auflösungstest untersucht.
Die elastische Rückgewinnung von Tabletten in Kombination mit dem
Deformationsverhalten war der wichtigste Faktor, dessen Mismatching zwischen den
Schichten die Delaminierungstendenz signifikant beeinflusste. Die niedrigviskose
Fischgelatinelösung zeigte bessere Klebeeigenschaften als PVP K90, die auf eine
bessere Penetration in die Poren und Mikrostrukturen auf der Tablettenoberfläche
zurückzuführen ist. Die Ergebnisse dieser Studie weisen darauf hin, dass durch die
sorgfältige Auswahl der Materialien und der Produktionsprozessparameter die
Herstellung von hochwertigen mehrschichtigen Tabletten mittels der „Gluing Pills“
Technologie möglich ist. Diese Technologie kann für die Herstellung von
personalisierter Medizin verwendet werden und bietet die flexible und individuelle
Kombination von APIs mit verschiedenen Freisetzungsprofilen.
9
Contents
Acknowledgements ....................................................................................................................................... 4
Abstract .............................................................................................................................................................. 5
Zusammenfassung ......................................................................................................................................... 7
1 Introduction ......................................................................................................................................... 11
2 Theoretical part ................................................................................................................................. 12
2.1 Oral Drug Delivery .................................................................................................................... 12
2.2 Tablets as the most conventional oral dosage form and tableting ..................... 13
2.2.1 Tablet presses ..................................................................................................................... 16
2.2.2 Compression and Compaction analysis .................................................................. 19
2.3 Multilayer tablets....................................................................................................................... 28
2.3.1 Manufacturing process ................................................................................................... 30
2.3.2 Problems/challenges in manufacturing of multilayer tablets ..................... 30
2.4 Gluing Pills Technology .......................................................................................................... 32
2.4.1 Overview ............................................................................................................................... 32
2.4.2 Equipment design and operation .............................................................................. 33
3 Aims of the thesis .............................................................................................................................. 34
4 Materials ................................................................................................................................................ 35
5 Methods ................................................................................................................................................. 39
5.1 Tableting ........................................................................................................................................ 39
5.1.1 Preparation of blends for each tablet layer .......................................................... 39
5.1.2 Tablet compaction ............................................................................................................ 40
5.1.3 Tablet porosity calculation ........................................................................................... 40
5.2 Compression analysis .............................................................................................................. 41
5.2.1 Preparation of blends for compression analysis ................................................ 41
5.2.2 True density measurements ........................................................................................ 42
5.2.3 Heckel’s analysis ............................................................................................................... 42
5.2.4 Elastic recovery measurements ................................................................................. 43
10
5.3 Multilayer tablet production ................................................................................................ 43
5.3.1 Preparation of the gluing solutions .......................................................................... 43
5.3.2 Gluing of tablet layers ..................................................................................................... 43
5.4 Analytical methods ................................................................................................................... 45
5.4.1 Surface roughness characterization......................................................................... 45
5.5 Single layer and multilayer tablet characterization .................................................. 49
5.5.1 Weight uniformity ............................................................................................................ 49
5.5.2 Hardness ............................................................................................................................... 49
5.5.4 Friability test ....................................................................................................................... 50
5.5.5 Dissolution test and HPLC analysis .......................................................................... 50
5.5.6 Content assay and UV-Vis analysis ........................................................................... 51
5.6 Characterization of gluing agents - Viscosity ............................................................... 52
5 Results and Discussion ................................................................................................................... 53
5.1 Compression Analysis ............................................................................................................. 53
5.2 Surface roughness analysis ................................................................................................... 59
5.3 Viscosity of polymeric solutions (Gluing agents) ....................................................... 65
5.4 Investigation of the delamination tendency of bilayer tablets ............................. 66
5.5 Dissolution profiles of multilayer tablets ....................................................................... 70
6 Conclusions and Outlook ............................................................................................................... 78
Bibliography .................................................................................................................................................. 80
List of figures ................................................................................................................................................. 86
List of tables................................................................................................................................................... 88
List of abbreviations .................................................................................................................................. 89
11
1 Introduction
Latterly, multilayer tablets have become an interesting approach in drug delivery,
especially employed in Fixed Dose Combination (FDC) products and in treating
diseases that request polypharmacy [1]–[3].
Conventional manufacturing of multilayer tablets is the compression of layers
in sequence [4]. The challenges involved with this approach are inaccurate weight
control, cross contamination in the interfacial layer, mismatch of elastic/plastic
properties and impact of the storage conditions on the adhesion layer can lead to
delamination, and insufficient hardness, affecting the quality of the end product [5],
[6].
In the present work a novel technique of producing multilayer tablets is
presented, the Gluing Pills Technology (GPT), it differs from the abovementioned
manufacturing of multilayer tablets in many aspects, the layers or tablet bodies are
pressed separately via conventional tableting and glued together by using a polymeric
solution as a gluing agent. This technology overcomes some of the challenges
encountered in common manufacturing of multilayer tablets, however, enough
attention should be paid to elastic/plastic match of the layers, sufficient adherence in
the interface between the gluing layer and the two individual layers, and producing a
robust product to withstand the manufacturing process, storage conditions and
transportation.
In this work, the processability of the GPT was evaluated. The characterization
of the compaction properties of powders (excipients and mixtures with relatively high
content of API) that differ in their properties, the surface characterization of the
produced tablets and the selection of the appropriate gluing agent, were conducted.
The impact of storage conditions was investigated by storing the samples at
room temperature (RT) and accelerated conditions (AC) i.e. 40°C and 75% relative
humidity (RH).
Finally, the characterization of the individual tablet bodies and the produced
multilayer tablets was conducted.

12
2 Theoretical part
2.1 Oral Drug Delivery
The oral route of drug administration is the most common route for drug delivery,
amongst the oral dosage forms, tablets and capsules are the most used ones. Even
though other routes of administration have many advantages (e.g. parenteral route is
characterized by fast onset of action, lower dose, and bypass of the first pass effect),
oral drug delivery is very often the first choice. Main advantages are the ease of
administration, pain avoidance, accurate dose, flexibility in the design of the dosage
forms, ease of providing desirable physical and chemical stability of the formulation,
least aseptic constraints, etc. Drawbacks that should be mentioned are, i) difficulty in
swallowing of tablets and capsules as most conventional dosage forms, especially by
elderly and pediatric population, ii) not suitable for emergency cases, iii) possible
bioavailability problems due to slow disintegration and dissolution, and iv) irritant
effects on the gastrointestinal tract (GIT) [1].
In order to have a better understanding of the oral administration of drugs, one
should consider the pathway which the dosage form passes through the GIT, a brief
overview on the anatomical and physiological characteristics of different sections of
the GIT is represented in Table 1 [2].
Table 1. Overview of the anatomical and physiological characteristics of the GIT
Section Length
[m]
Absorption
surface [m2]
pH Transition
time [h] Details*
Fasted Fed
Stomach 0.2 0.1 1.5-3 2-5 1-3 HCl, P, L
Duodenum 0.3 0.1 5 5.5
3-5
Bile acids, T, A,
PR, L, N, M
Jejunum 3.0 60 6.1 6.1 M, A, S, LC
Ileum 4.0 60 7-8 7-8 E, L, N
Colon 1.35 0.25 8 / 4-16
R, ES, SU, AD
Rectum 0.12 Very small 7 /
*Enzymes: P=Peptidase; L=Lipase; T=Trypsin; A=Amylase; PR=Protease; N=Nuclease; M=Maltase;
S=Sucrase; LC=Lactase; R=Reductase; ES=Esterase; SU=Sulfatase; AD=Amidase; E=Enteropeptidase.
13
The natural function of the GIT is to break down food into nutrients that can be
absorbed into the circulatory system in a selective, safe and effective manner. Passing
through the GIT, basic nutrients i.e. proteins, carbohydrates, lipids, and nucleic acids
are broken down into smaller fragments or building blocks by specific enzymes and
then selectively absorbed. Large protein fragments are cleaved into small peptides
which furthermore are cut from peptidases into amino acids and/or di- and tri-
peptides; complex carbohydrates are cut into mono- and di-saccharides; lipids first
solubilized from the bile acids and then cut into free fatty acids, mono- and tri-
glycerides; polynucleic acids into nucleosides; similarly, vitamins and co-factors are
extracted from the diet and absorbed [3].
The anatomy and physiology of the GIT and mechanisms involved in digestion
are far more complex, more detailed information can be found in many medical
textbooks [4].
From the above mentioned, it is clear that the GIT represents a very harsh
environment for any drug substance. Hence, the development of oral dosage forms
that successfully deliver the drug to its site of action becomes quite challenging,
especially for the drug substances which belong to classes III and IV of the
Biopharmaceutics Classification System (BCS) which are not readily absorbed. Many
studies and advancements in the last decade try in various creative ways to overcome
biological, chemical, and physical barriers of the GIT [3], [5].
2.2 Tablets as the most conventional oral dosage form and tableting
United States Pharmacopeia (USP) defines tablets as “solid dosage forms in which the
API is blended with excipients and compressed into the final dosage” [6].
Their advantages such as ease of accurate dosing, good chemical and physical
stability during the shelf life, competitive unit production costs, high level of patient
acceptability and high convenience, easy to package and ship, simple to identify, self-
administration, makes them the most used dosage form. Whereas their oral
administration is liable for their disadvantages, as mentioned above [1], [7].
There are various types of tablets, a summary of classes of tablets depending
on their application is shown in Table 2 [1],[8].

14
Table 2. Types of tablets classed by their application Tablets administered orally Tablets used in the oral cavity
Standard compressed tablets
Multiple compressed tablets
(multilayer, compression coated, inlay
tablets)
Modified release tablets
Controlled release tablets
Delayed release tablets
Targeted tablets (gastro retentive or
floating tablets, colon targeted tablets)
Chewable tablets
Buccal and Sublingual tablets
Lozenges
Dental cones
Administered by other routes
Implant tablets
Vaginal tablets
Tablets for solution preparation
Effervescent; Dispersible;
Hypodermic; Tablet triturates.
Manufacturing process of tablets involves several unit operations. Usually, the
tablet production process starts with mixing/blending of the powder materials i.e. the
API and excipients, and in the case of poor flowability of the powder mixture a
granulation step is employed, which can be wet or dry granulation, and the last step is
the compaction of the powder using tablet presses. The main purpose of granulation
is the increase in size of the particles thus the flowability is enhanced, and the filling
of the die is more uniform, therefore, the weight and content variation of the tablets is
lowered.
In some cases when the powder mixture possesses good flowability the
granulation step can be skipped and the production of tablets via direct compaction
becomes feasible.
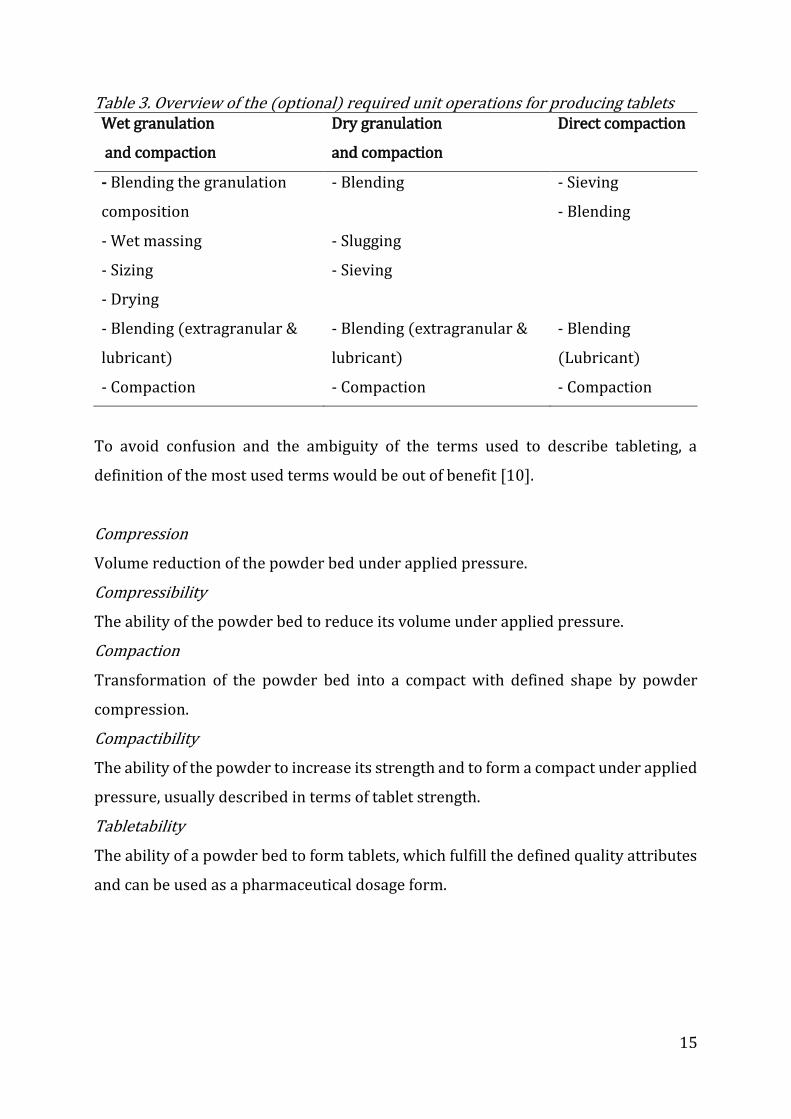
The required unit operations for producing tablets as end-product are listed in
Table 3 [9].
15
Table 3. Overview of the (optional) required unit operations for producing tablets Wet granulation
and compaction
Dry granulation
and compaction
Direct compaction
- Blending the granulation
composition
- Wet massing
- Sizing
- Drying
- Blending (extragranular &
lubricant)
- Compaction
- Blending
- Slugging
- Sieving
- Blending (extragranular &
lubricant)
- Compaction
- Sieving
- Blending
- Blending
(Lubricant)
- Compaction
To avoid confusion and the ambiguity of the terms used to describe tableting, a
definition of the most used terms would be out of benefit [10].
Compression
Volume reduction of the powder bed under applied pressure.
Compressibility
The ability of the powder bed to reduce its volume under applied pressure.
Compaction
Transformation of the powder bed into a compact with defined shape by powder
compression.
Compactibility
The ability of the powder to increase its strength and to form a compact under applied
pressure, usually described in terms of tablet strength.
Tabletability
The ability of a powder bed to form tablets, which fulfill the defined quality attributes
and can be used as a pharmaceutical dosage form.
16
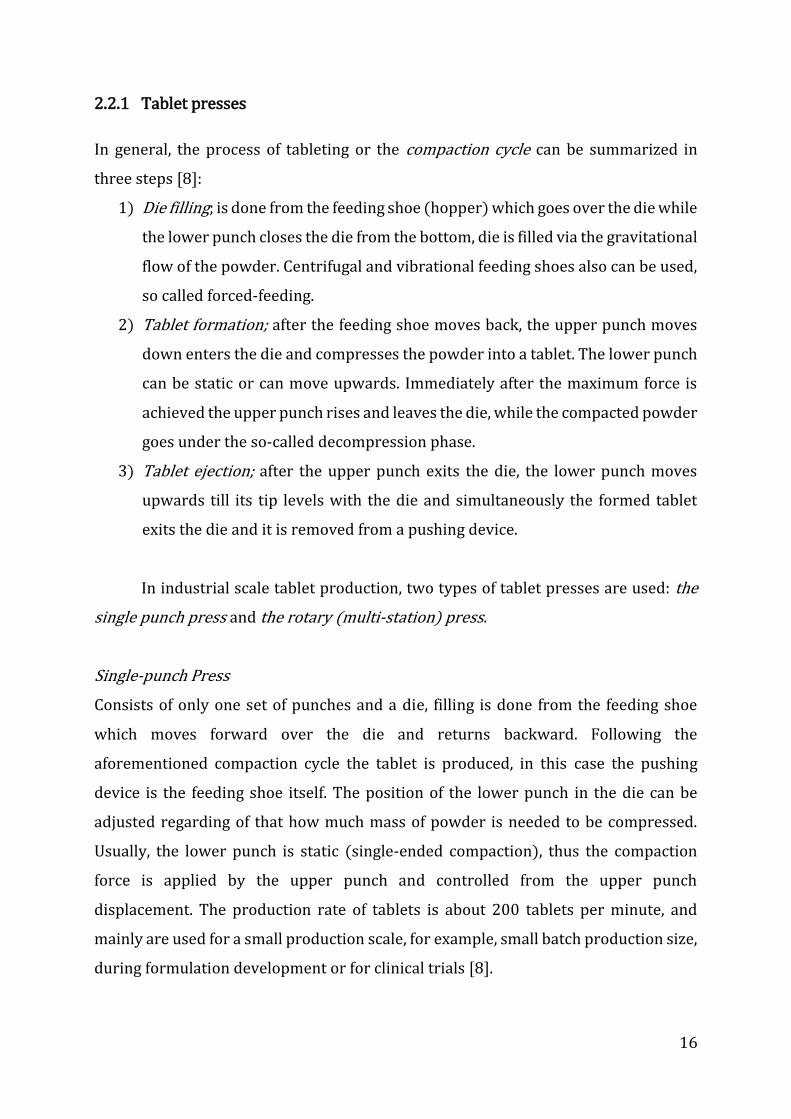
2.2.1 Tablet presses
In general, the process of tableting or the compaction cycle can be summarized in
three steps [8]:
1) Die filling; is done from the feeding shoe (hopper) which goes over the die while
the lower punch closes the die from the bottom, die is filled via the gravitational
flow of the powder. Centrifugal and vibrational feeding shoes also can be used,
so called forced-feeding.
2) Tablet formation; after the feeding shoe moves back, the upper punch moves
down enters the die and compresses the powder into a tablet. The lower punch
can be static or can move upwards. Immediately after the maximum force is
achieved the upper punch rises and leaves the die, while the compacted powder
goes under the so-called decompression phase.
3) Tablet ejection; after the upper punch exits the die, the lower punch moves
upwards till its tip levels with the die and simultaneously the formed tablet
exits the die and it is removed from a pushing device.
In industrial scale tablet production, two types of tablet presses are used: the
single punch press and the rotary (multi-station) press.
Single-punch Press
Consists of only one set of punches and a die, filling is done from the feeding shoe
which moves forward over the die and returns backward. Following the
aforementioned compaction cycle the tablet is produced, in this case the pushing
device is the feeding shoe itself. The position of the lower punch in the die can be
adjusted regarding of that how much mass of powder is needed to be compressed.
Usually, the lower punch is static (single-ended compaction), thus the compaction
force is applied by the upper punch and controlled from the upper punch
displacement. The production rate of tablets is about 200 tablets per minute, and
mainly are used for a small production scale, for example, small batch production size,
during formulation development or for clinical trials [8].

17
Rotary (multi-station) Press
It operates with more than one set of punches and dies, can be more than 60, thus the
production rate can reach more than 10 000 tablets per minute. Punches are mounted
in a circle track which passes over rolls and cams and moves on the vertical axis. Lower
punches position into the die regulates the amount of powder, while the upper
punches are responsible for the compression, in here the lower punch is not stationary
but penetrates into the die in the moment of compression (double-ended
compaction). Dies are mounted in the circular die table, which rotates along with the
punches, so for every die corresponds the same set of punches. Feeding of the powder
is performed from the hopper which stands above the die table and it is static, filling
of the die is accomplished by the feed frame. After ejection, the tablet is pushed away
by a pushing device [8].
Usually, tablet presses are instrumented at least with transducers to measure
the force of the punches during the production process, as it is an important
information related to the weight uniformity, the goal being the control over the
tableting process [8].
Compaction Simulators
Latterly, in contrary to industry, in research and development compaction simulators
are used, they are presses with a single punch or a rotary press type coupled with data
acquisition system, and are useful for the evaluation of the compaction process and
scale-up of tableting process for powders with different properties [8], [11].
In general, data acquisition system represents a pathway of the registered
signal from the physical system (e.g. force in the punch) recorded by the sensor
(transducer), following the signal conditioning (e.g. amplification of the received
signal), then the latter i.e. the analog signal is converted to a digital one, which can be
“read” from the computer and analyzed via analysis software. A brief schematic
overview of the data acquisition system is represented in Figure 1, [11].

18
Figure 1. Digital Data Acquisition System; adapted from Ref. [12]
Compaction simulators represent a very complex tablet press instrumentation
system, or data acquisition system. They offer the possibility of accurate measurement
of the force in the both punches and the die, punch displacement, distance between
punches, ejection force, punch speed, etc., during the entire cycle of compaction, thus
compaction simulators make it possible to simulate many presses which operate on a
bigger scale, and are helpful in the design space for tableting in the context of Quality
by Design. It should be mentioned that the calibration, resolution of the measuring
system and the reproducibility of the results are very important for attaining reliable
results [10], [11], [13].
There are three types: hydraulic, mechanical linear and mechanical rotary cam
compaction simulators. In the present work, the compaction analysis was performed
using a mechanical compaction simulator, some of the advantages and disadvantages
of this type of simulator are listed in Table 4 [11].
19
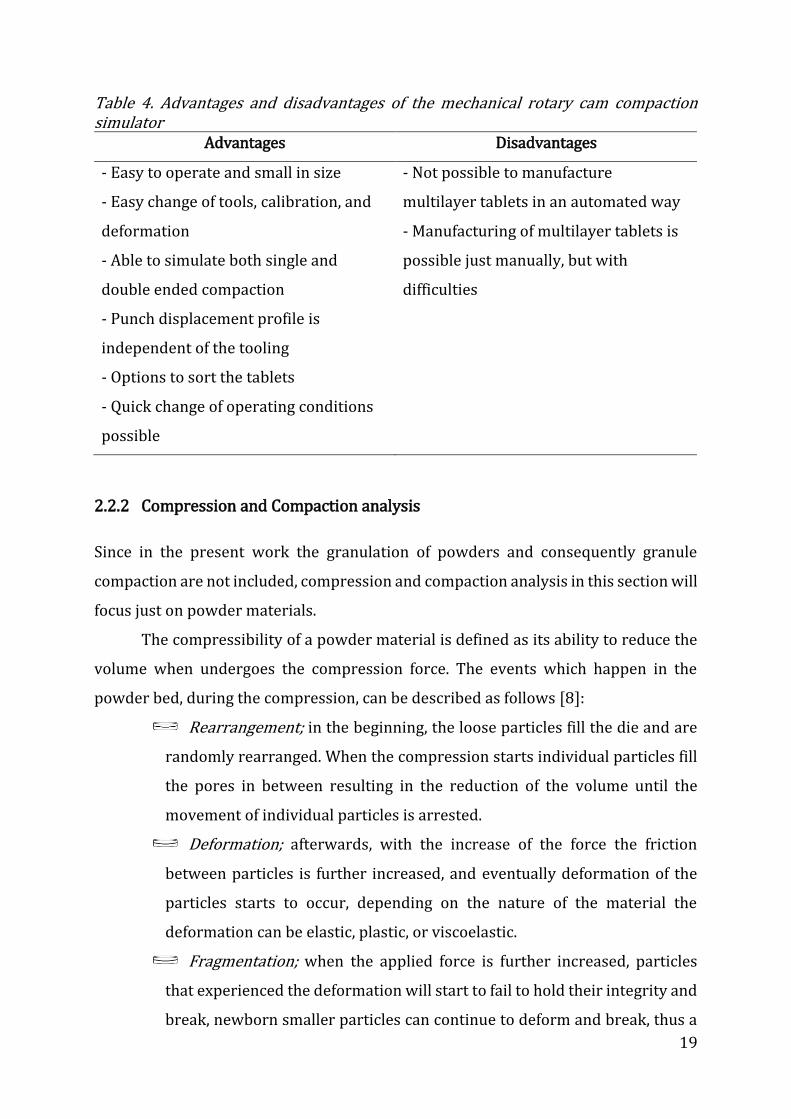
Table 4. Advantages and disadvantages of the mechanical rotary cam compaction simulator
Advantages Disadvantages
- Easy to operate and small in size
- Easy change of tools, calibration, and
deformation
- Able to simulate both single and
double ended compaction
- Punch displacement profile is
independent of the tooling
- Options to sort the tablets
- Quick change of operating conditions
possible
- Not possible to manufacture
multilayer tablets in an automated way
- Manufacturing of multilayer tablets is
possible just manually, but with
difficulties
2.2.2 Compression and Compaction analysis
Since in the present work the granulation of powders and consequently granule
compaction are not included, compression and compaction analysis in this section will
focus just on powder materials.
The compressibility of a powder material is defined as its ability to reduce the
volume when undergoes the compression force. The events which happen in the
powder bed, during the compression, can be described as follows [8]:
Rearrangement; in the beginning, the loose particles fill the die and are
randomly rearranged. When the compression starts individual particles fill
the pores in between resulting in the reduction of the volume until the
movement of individual particles is arrested.
Deformation; afterwards, with the increase of the force the friction
between particles is further increased, and eventually deformation of the
particles starts to occur, depending on the nature of the material the
deformation can be elastic, plastic, or viscoelastic.
Fragmentation; when the applied force is further increased, particles
that experienced the deformation will start to fail to hold their integrity and
break, newborn smaller particles can continue to deform and break, thus a
20
particle can experience these events several times. Fragmentation of brittle
materials is governed from brittle fracture of the particles rather than
elastic or plastic deformation.
Particles during the compression undergo relatively high stress, which brings their
surfaces in juxtaposition and eventually interparticle bonds can emerge.
Particle size and shape, surface roughness, and surface area of particles are
factors which affect the compression and compaction mechanism, these
factors/properties are prone to change during the compression process, for instance
by fragmenting their shape and surface area changes, revealing more contact points
which can lead to successful bonding in between particles. Crystallinity and crystal
habit (geometry of the crystal) of the materials affects the compaction process, while
amorphous materials have the propensity to deform plastically, the crystalline ones
deform by brittle fracture [11].
Elastic, plastic and viscoelastic deformation
It is worth to note that the deformation mechanism of the majority of the
pharmaceutical powder materials is not strictly distinguishable between brittle,
elastic or plastic, but their behavior is mostly a combination of different deformation
mechanisms, known as viscoelastic deformation [8].
Elastic deformation
An ideal elastic material recovers to its previous state after the stress is removed, thus
no deformation remains, i.e. the deformation mechanism obeys the Hooke’s law [14].
For the pharmaceutical production of tablets, this property can cause problems such
as capping and lamination, also cracks can develop on the surface which is critical for
coated tablets for instance. These problems arise due to the total elastic recovery after
the tablet is ejected from the die and lasts for a certain time after. This phenomenon
shows to have a correlation with the compression speed, at high speed the elastic
recovery is higher [11].

21
Elasticity is a time-independent process, i.e. it doesn’t depend on the time in
which the stress is applied, but just the magnitude. Mathematical expression which
describes the elasticity of the materials (Hooke’s law), is given in Equation 1.
𝜎 = 𝐸𝜀 (1)
Where 𝜎 [𝑃𝑎] is the applied stress, E [𝑃𝑎] represents the Young’s modulus (specific
constant for each material), and 𝜀 [−] is the deformation (in case of a spring is the
ratio of the elongation of the spring and its original length) [15].
Plastic deformation
In contrary to elastic materials, the ideal plastic material preserves the deformation
induced by the applied force, i.e. the deformation remains after the stress is removed.
In the context of tablet formation, the plasticity of the material gives the likelihood of
bond formation between particles, by forming interparticle contacts which do not
separate due to the nonexistence of elastic recovery phenomenon [11].
Plasticity is a time-independent process and can be represented as the balance
given in Equation 2.
𝜎 = 𝜎𝑦 (2)
Where 𝜎𝑦[𝑃𝑎] is the yield stress or the minimal applied stress which deforms the
material plastically [10].
Viscoelastic deformation
It is a time-depended process which comprises of elastic and viscous elements, i.e.
deformation mechanism is in between the purely elastic deformation and the viscous
one [8].
Viscosity is a material property which relates the deformation rate with the
applied stress for a certain time span, Equation 3 [15], [16].
𝜎(𝑡) = 𝜂𝜕𝜀
𝜕𝑡 (3)
Where 𝜂 [𝑃𝑎 ∙ 𝑠] is the dynamic viscosity, 𝜎[𝑃𝑎] is the applied stress for a certain time,
and 𝜕𝜀
𝜕𝑡[𝑠−1] is the deformation rate.
For the description of the deformation behavior of the viscoelastic materials
several mechanical models exist, these models consist of springs (elastic component)

22
and dashpots (viscous component), combining these components a deformation
behavior of a material can be modeled, and thus predicted under certain stress
conditions. Simple models like Maxwell model (series of springs and dashpots) and
Voigt model (parallel combination of springs and dashpots) exist but are
oversimplified for instance, Maxwell model cannot describe the creep motion,
whereas the Voigt model cannot describe the stress relaxation. More advanced
models, as the complex combination of spring and dashpot elements and particle-
based models (numerical simulations, DEM [17], etc.) are used with the attempt to
describe more accurately the viscoelastic deformation behavior. It is very important
in the context of the formulation design and to satisfy the quality attributes of the end
product to have a model that successfully describes the material’s mechanistic
behavior when it undergoes stress conditions during tableting [11].
Bonding mechanisms
Bond formation between small particles according to Rumpf classification [18] can
occur via five different mechanisms, which can be enlisted as follows:
1. Solid bridges
2. Moveable liquids (capillary and surface tension forces)
3. Non-moveable liquids (viscous binders and adsorption layers)
4. Inter-particle attraction forces
5. Mechanical interlocking
Solid bridges, inter-particle attraction forces, and mechanical interlocking are
more relevant for the description of the bonding mechanism in the compaction of
powder materials than the forces created by the presence of movable and non-
movable liquids between particles which are important for bonding in granule
formation [11], [19].

23
Solid bridges
Due to the friction and high pressure at the inter-particle contact points during the
compaction of pharmaceutical materials, temperature increases locally which brings
to the melting of the asperities of the particles in contact, this localized melting
crystallizes after the release of pressure (melting temperature over all the sample is
not reached, but just locally), and thus particles ‘fuse’ together via the solid bridge
formation, which occurs between more than two individual particles and a net-like
structure is created giving the compact high strength [20]. Formation of solid bridges
during compaction is similar to the sintering process, but no temperature is applied
to the system [21].
Amorphous or semi-amorphous materials have higher propensity to form solid
bridges than the pure crystalline ones, this becomes important in the case when the
API content is relatively high, and hence the crystalline properties of the drug can
affect the bonding mechanism of the tablet. The appropriate moisture content of the
material is also an influencing factor, it facilitates the movement of the amorphous
phase and it acts as a plasticizer, thus improving the bridge formation and
consequently the strength of the tablet [11].
Interparticle attraction forces
Within the interparticle attraction forces, major contributors to tablet formation are
Van der Waals forces and hydrogen bonding.
Van der Waals forces are classified as of three types: Dipole - dipole interaction
or Keesome forces, occur between molecules which are permanent dipoles, and thus
they orient their respective local counter charges to one another and attract each
other. One kind of such attraction force is the hydrogen bonding, in the formation of
hydrogen bonds the hydrogen atom of a molecule loses the single electron, and thus
just the proton remains which can create bond with the negatively charged region of
another molecule; Dipole - induced dipole or Debye forces, in this case, the polarized
molecule induces a polarization to the adjacent non-polar molecule creating attraction
force in between molecules; Induced dipole - induced dipole forces or London
dispersion, occurs between non-dipole molecules, via a complex quantic mechanism
in the presence of each other both molecules are able to form induced dipole [10], [11].
24
Mechanical interlocking
It is strongly influenced by the particle shape of materials involved in a compaction
process and their deformation mechanism. Irregular particles which have an atypical
shape and usually relatively high roughness is likely to interlock or hook to each other,
and thus raising the strength of the whole compact [8], [11].
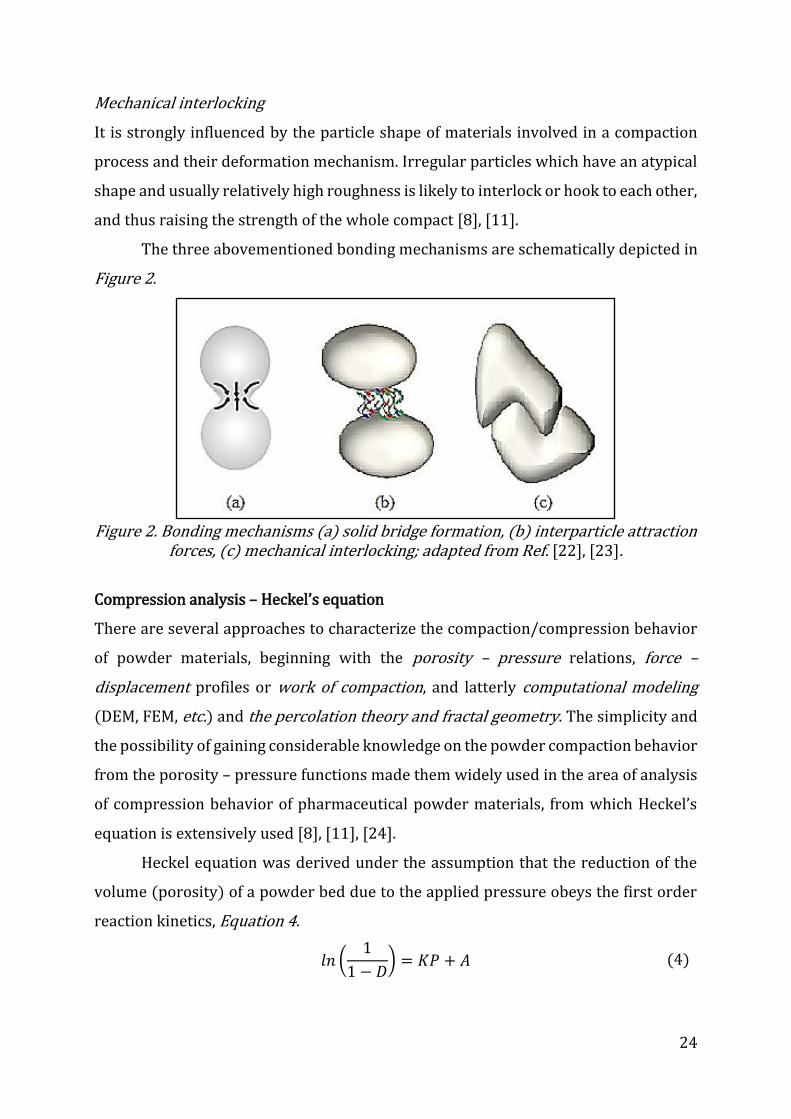
The three abovementioned bonding mechanisms are schematically depicted in
Figure 2.
Figure 2. Bonding mechanisms (a) solid bridge formation, (b) interparticle attraction
forces, (c) mechanical interlocking; adapted from Ref. [22], [23].
Compression analysis – Heckel’s equation
There are several approaches to characterize the compaction/compression behavior
of powder materials, beginning with the porosity – pressure relations, force –
displacement profiles or work of compaction, and latterly computational modeling
(DEM, FEM, etc.) and the percolation theory and fractal geometry. The simplicity and
the possibility of gaining considerable knowledge on the powder compaction behavior
from the porosity – pressure functions made them widely used in the area of analysis
of compression behavior of pharmaceutical powder materials, from which Heckel’s
equation is extensively used [8], [11], [24].
Heckel equation was derived under the assumption that the reduction of the
volume (porosity) of a powder bed due to the applied pressure obeys the first order
reaction kinetics, Equation 4.
𝑙𝑛 (1
1 − 𝐷) = 𝐾𝑃 + 𝐴 (4)
25
Where D [-] is the relative density while (1-D) is the porosity usually denoted with
the symbol ε [-], K is the slope of the function, P [𝑃𝑎] represents the compression
pressure and A[-] is the intersect of the linear function with the abscissa [25].
Relevant information that should be known beforehand is the true density,
usually determined via helium pycnometry.
It is distinguished between “in die” or “at pressure” and “ejected tablet” or “at
zero pressure” methods on how to obtain data which are relevant for the use of
Heckel’s equation.
“In die method” relies on the use of compaction simulator or instrumented
press which is able to measure the height of the filled powder into the die and the
distance between punches and to record the force in the both punches during the
entire compaction cycle. Knowing the distance between punches at any time and the
dimensions of the die/punches one can easily calculate the volume of the powder bed,
after the ejection the weight of the compact has to be measured accurately, thus the
apparent density of the powder in the column can be determined, from which the ratio
of the apparent density and the true density gives the relative density D. The
registered force is simply converted to pressure by knowing the diameter or the area
of the punch tip [8], [25].
“At zero pressure” or “ejected tablet method” requires the measurement of
dimensions of the compact after it is ejected, and the registration of the maximum
compression pressure. Again, by knowing the true density and the volume of the
compact/tablet apparent density is determined and relative density can be calculated.
Several compacts are needed to obtain the data required for the use of Heckel
equation, which makes the at zero pressure method tedious [8], [25].
Information on the compaction behavior that can be extracted from the
Heckel’s analysis are [10], [25]:
The yield pressure Py, which is the inverse of the slope of the linear
region obtained from the Heckel’s plots. It is a constant specific for each
material and relates the ability of the material to deform plastically when it
undergoes certain pressure. High values would mean that the material
deforms dominantly via a brittle/fracture mechanism, and low values are
related to plastic deformation.
26
The parameter A, indicates the low pressure densification of the powder.
At zero pressure relative density of the powder filled in the die is denoted
as DA and represents the total degree of densification and is calculated by
the Equation 5; the ratio of the bulk density and the true density is denoted
as D0 and it describes the rearrangement of the powder when it fills the die;
and the relative density Db is calculated as the difference between DA and D0
representing the initial phase of compression (particle fragmentation)
𝐷𝐴 = 1 − 𝑒−𝐴 (5)
Depending on the material properties and their compaction behavior the
Heckel’s plots are classified mainly into three types: Type A, materials which undergo
plastic deformation; Type B, an intermediate behavior between plastic and
brittle/fracture deformation; Type C, are harder brittle materials and the dominant
deformation mechanism is by fragmentation [25], [26].
Even though the Heckel equation itself is linear the Heckel plots obtained from
experimental data are not, but they consist of three different regions: Region I, at the
beginning there is a distinguishable curvature of the plot, which is regarded to the
particle rearrangement and particle fragmentation; Region II, the so-called linear
region from which the slope K and A parameter are obtained, describe either elastic
or plastic deformation; Region III, is regarded to the elastic deformation, and
sometimes it is referred to as the work hardening of the compact [24].
In Figure 3, three main types of Heckel’s plots and the three distinct regions are
depicted.

27
Figure 3. Three main types of Heckel plots (a), three regions of a Heckel profile (b);
adapted from Ref. [24], [26]
General remarks on Heckel analysis
The use of Heckel equation as a tool to describe the compaction behavior of powders
is accepted as fairly accurate, but it has its own limitations. Variable pressure yield
parameter for the same material, which is attributed to the different methods to
determine the linear region. Some deviations can originate from the true density
measurements and the accuracy and reliability of the obtained data from the
instrumented press. The tableting parameters such as maximal compression force,
punch velocity, the diameter of the punch, and the machine deformation strongly
affect the results obtained from the Heckel analysis. Furthermore, the effect of particle
size distribution of the materials and the degree of lubrication on the variability of the
results is known [24], [25], [27].
28
2.3 Multilayer tablets
Multilayer tablets have been gaining more interest over the last two decades, because
of the increased demand on the development of effective and cost-saving therapeutic
strategies for improving the patient adherence to therapy [28], [29]. A considerable
number of therapies indicated in type 2 diabetes, HIV/AIDS, cardiovascular diseases,
pain, asthma, parkinsonism, Alzheimer’s, etc., require polypharmacy, which negatively
affects the patients’ adherence to treatment strategies. Development of FDC is highly
supported by U.S. Food and Drug Administration (FDA), World Health Organization
(WHO) and European Medical Agency (EMA) as the effective measure against
polypharmacy by reducing the number of taken dosage forms per day. Multilayer
tablets are the most common form of such FDCs [30], [31].
Multilayer tableting offers several advantages. There are many reported cases
of incompatibilities between APIs and excipients in the case of dosage forms
containing more than one API [32]–[34]. Multilayer tablets offer the benefit of physical
separation of incompatible substances, also the best possible composition of the
materials can be selected for each layer. In addition to the conventional purpose of
multilayer tablets, i.e., having different APIs with same or different release profiles in
different layers, this dosage form can also be designed with the same API in the layers
but with each layer having a different API release profile. In these manners the dosing
unit burden is reduced and patient compliance improved, also the patent life of the
product can be prolonged (Life Cycle Management) [35].
Some different design of formulations for achieving modified release profile are
listed below, which use the multilayer tableting approach [29]:
Zero order sustained release
The system consists of the core (matrix) which can either be hydrophobic or
hydrophilic and barrier layers which are pressed to the both faces of the core layer
leaving the side face of the core uncovered and revealed to the dissolution media.
Hydrophilic or hydrophobic barrier layers usually are of polymeric nature [36].
29
Quick/slow delivery system
This system contains an immediate release layer, a modulating barrier in the middle
and a third slow release layer. The objective is to develop a new system bioequivalent
to the sustained release formulations, which is characterized by a rapid rise in the
plasma concentration, followed by an extended release at a constant rate [37].
Time-programmed delivery system (press coated tablets)
The system is able to release the drug at predetermined time point, which is preferable
for drugs used in diseases which depend on the circadian rhythm, and subsequently
the chance of developing tolerance is reduced. The core tablet (conventional or
modified release formulation) is press coated within the barrier layer, the latter can
be either erodible (hydrophobic) barrier or swellable barrier (hydrophilic),
depending on the time the barrier layer is eroded or swelled the release of the API can
be regulatedfrom the core tablet. [38].
Bimodal release profile
As the pH across the different sections of the GIT and the absorption rate are different
to achieve a zero order release profile or to maintain the absorption level constant, the
bimodal release is desirable. A bimodal release is characterized by possessing an
initial immediate (rapid) release, followed by a constant release and a second step of
a rapid release of API from the system. This can be achieved by employing multilayer
tablet which consists of the core tablet which on two sides has barrier layers, and on
top an initial dose layer. It is intended to compensate the slow absorption in the
stomach by the initial rapid release of API from the initial dose layer. The following
slow release from the core tablet is helped by the barrier layers, as a result, the high
absorption rate of the small intestine is retarded, and at the end after the
disintegration of the barrier layers an immediate release from the exposed core tablet
should compensate the slow absorption rate of the large intestine [39].
Several techniques use the aforementioned design approaches, i.e. applying
multilayer tableting, e.g. OROS® push-pull technology, L-OROS®, EN SO TROL®,
DUROS®, DUREDAS®, Geomatrix® technology, etc. [28].
30
2.3.1 Manufacturing process
Compaction of multi-layered powders shares many similarities with the compaction
of conventional tablets. The tableting of multilayer tablets is performed in special
rotary tablet presses in the following sequence: The first powder layer is filled in the
die and tampered with a low pressure; on top of the first layer is placed the second
powder layer and pressed with the main compression force; consequently the bilayer
tablet is ejected from the die; in the case when more than two layers are wanted the
steps can be repeated [40].
Recently several presses are developed for the production of multilayer tablets.
Korsch XL 400 FT® is one example of a very sophisticated press, which gives the
opportunity of production of a single layer, bilayer, trilayer and compression coated
tablets, by customizing its working mode via exchangeable components [41].
2.3.2 Problems/challenges in manufacturing of multilayer tablets
The most common problems are i) inaccurate layer weight control, ii) the risk of
delamination as the consequence of the difference in the compaction behavior of the
layers and/or the insufficient adherence between the layers, iii) cross contamination,
due to the direct contact between the layers, especially in case of potential
incompatibility between APIs or API and excipients in different layers, resulting in the
instability of the end-product during the shelf-life.
To produce a multilayer tablet that meets the quality requirements, the
formulation composition of each layer and the process parameters should be selected
carefully [35].
Comments on the mentioned important problems/challenges and the possible
ways to avoid them are given below.
Inaccurate layer weight control
In conventional tableting of single layer tablets two ways of controlling the weight and
thus the content uniformity are employed, force controlled compression and
compression with constant thickness. The same principles are employed in the

31
production of multilayer tablets. However, in manufacturing of multilayer/bilayer
tablets, no press is able to sample separately the second layer and thus measure its
weight. Therefore, the material of the second layer should have a very good
flowability, in order to be able to fill the die properly and thus to reduce the variability
in weight and content. [35], [42].
Delamination of layers:
- Impact of the mechanistic properties of selected material
Differences in the deformation mechanism of materials and their compaction behavior
and elastic recovery can lead to delamination of layers. Therefore, mechanistic
properties of layers should be matched to avoid this problem [35].
Another factor that influences the adhesive strength between layers is the
surface characteristics of each layer, which are dependent on the mechanistic
properties of the material, the rougher surface would mean better adhesion of the
layers [42].
- Impact of the compression forces
The magnitude of the compression force applied to the first layer and then the main
compression force compacting both layers have a strong influence on the adhesion
and interfacial strength between two layers. Plastic materials are sensitive to the
compression force for the both layers, increasing the force for tampering the first layer
results in a decrease of the adhesion strength, this is attributed to the reduction of the
surface roughness. On the other hand, brittle materials don’t show strong sensitivity
to the increase of compression force of the first layer and provide higher interfacial
strength. Keeping a low compression force for the first layer gives more chance of
interfacial bonding during the main compression, but low force gives rise to the lack
of accuracy of weight force control system [35].
Cross-contamination
The risk of cross contamination exists due to the available dust/powder residue from
the two different powder blends during the production. Many presses consider the
solving of available dust/powder problem by employing clean in place (CIP)
techniques like scrapers, suction nozzles, and also some technical solutions like
32
interchangeable turrets and centrifugal die filling. Cross contamination can originate
also from the direct interfacial contact between the two layers, a clear separation is
desired, which is difficult to achieve. Sometimes the problem was tried to solve by
applying a buffer layer between two main layers [35].
Characterization of multilayer tablets
Using conventional characterization approaches as for single layer tablets is not
completely applicable for the multilayer tablets, thus the challenge of developing new
testing approaches is evident. Non-invasive methods like X-ray micro computed
tomography is used to detect defects in the interfacial bonding and density
distribution. The bonding strength between layers is tested with new techniques like
the tensile tester and flexural bending test [35], [43], [44].
2.4 Gluing Pills Technology
In this thesis, the novel GPT was used for the production of the multilayer tablets and
overcoming the mentioned challenges involved with their conventional
manufacturing. The prototype machine was co-developed from the Research Center
Pharmaceutical Engineering1 (RCPE) and M&R Automation2 and as it is in its first
phase of development, it is intended for small scale laboratory production.
2.4.1 Overview
The basic production principle of this new approach differs from the abovementioned
manufacturing of multilayer tablets, the layers or tablet bodies are pressed separately
via conventional tableting and glued together by using a polymer as a gluing agent, the
latter makes the gluing layer.
This manufacturing principle is developed to overcome the mentioned main
problems/challenges encountered in the conventional manufacturing of multilayer
tablets i.e. the inaccurate layer weight control, the risk of delamination and the risk of
cross-contamination during the production process.
1 Research Center Pharmaceutical Engineering GmbH, Inffeldgasse 13, 8010 Graz, Austria 2 M&R Automation GmbH, Teslastraße 8, 8074 Grambach/Graz, Austria
33
The adhesion between two layers in this case mainly depends on the adhesive
properties of the gluing agent. Migration of the APIs between the layers is just possible,
if the API is soluble in the gluing agent and can cross-over the gluing layer. Thus,
special care is required for selecting the gluing agent and medium [45].
As same as conventional production of multilayer tablets, the characterization
of the produced multilayer tablets via this new technique requires tests, which are
different from the classical ones dedicated to the single layer tablets.
2.4.2 Equipment design and operation
The operation is carried out in an automated process consisting of several stations,
the main stations are for feeding of the first tablet layer, application of gluing agent,
feeding of the second tablet layer, hardening the gluing agent between the two tablet
layers, resulting in the production of bilayer tablets, and unloading of bilayer tablets.
Multilayer production can be applied, if necessary. The prototype machine
consists of grips for holding the first tablet layer and transferring it from one to
another station. The gluing station comprises of a syringe-like cartridge which is filled
with the gluing agent either dissolved in a proper medium or in the molten sate. The
nozzle system for glue application is a high-speed micro dispensing system based on
piezo technology. It has a heating unit for melting the gluing medium in the nozzle.
Both aqueous and organic solutions of binding agents can be applied. Molten polymers
can be used as a gluing agent by using the nozzle, combined with the heating unit [46].
The system operates via a combination of electrical components and pressure
driven parts, air pressure is used to operate the grips and the nozzle.
34
3 Aims of the thesis
The main objective of this thesis was to evaluate the novel GPT as a new technique for
the production of multilayer tablet. Physical properties that might influence the
quality of the end product were investigated, specifically:
To determine the compaction behavior of the excipients and the
formulations, and to investigate the effect of different compaction
mechanisms by producing each layer separately, on the lamination
tendency of the multilayer tablets
To investigate the influence of elastic recovery of single layer tablets on
the lamination tendency
To investigate the influence of combination of single layer tablets
compacted at different forces on the delamination tendency
To investigate the impact of surface roughness, as a function of different
tableting compositions or different compaction forces on the binding
strength between two layers with the glue layer
To investigate the impact of changes in surface roughness, due to the
storage conditions, on the binding strength between two layers with the
glue layer
To evaluate the binding strength of polymeric solutions with different
viscosities
To determine if there is a significant change in the dissolution profiles
due to the storage conditions and the type of the glue layer
35
4 Materials
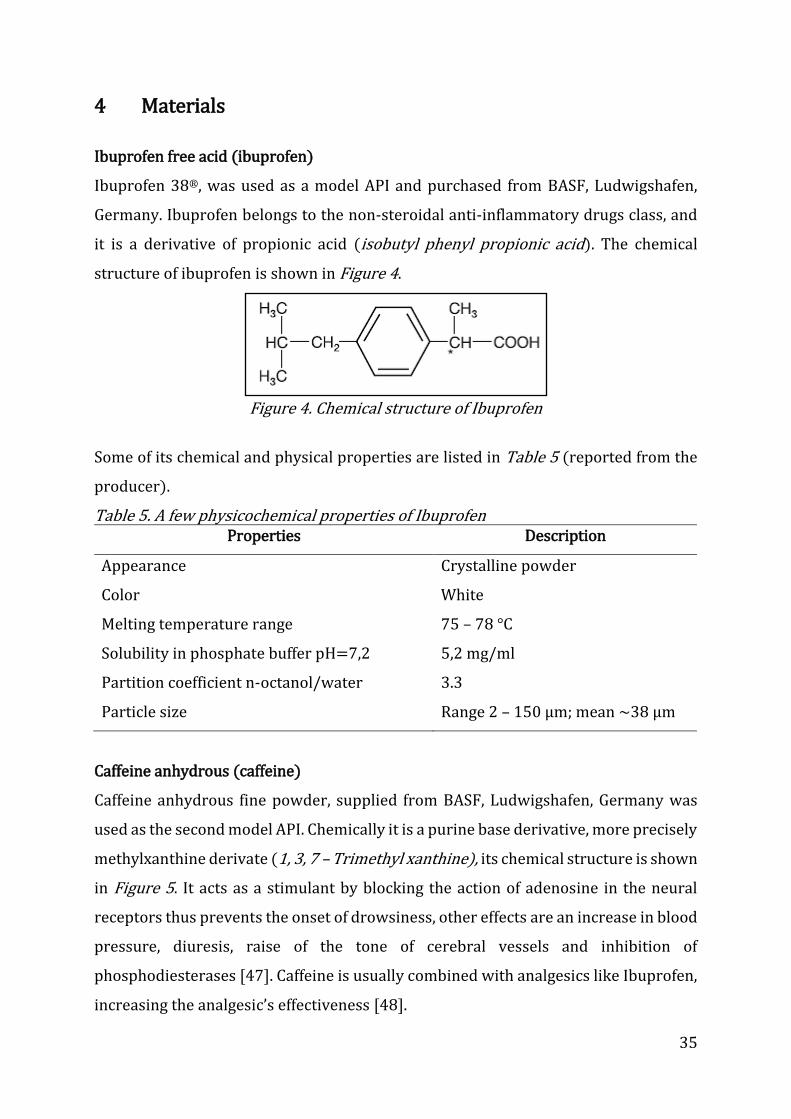
Ibuprofen free acid (ibuprofen)
Ibuprofen 38®, was used as a model API and purchased from BASF, Ludwigshafen,
Germany. Ibuprofen belongs to the non-steroidal anti-inflammatory drugs class, and
it is a derivative of propionic acid (isobutyl phenyl propionic acid). The chemical
structure of ibuprofen is shown in Figure 4.
Figure 4. Chemical structure of Ibuprofen
Some of its chemical and physical properties are listed in Table 5 (reported from the
producer).
Table 5. A few physicochemical properties of Ibuprofen Properties Description
Appearance Crystalline powder
Color White
Melting temperature range 75 – 78 °C
Solubility in phosphate buffer pH=7,2 5,2 mg/ml
Partition coefficient n-octanol/water
Particle size
3.3
Range 2 – 150 µm; mean ~38 µm
Caffeine anhydrous (caffeine)
Caffeine anhydrous fine powder, supplied from BASF, Ludwigshafen, Germany was
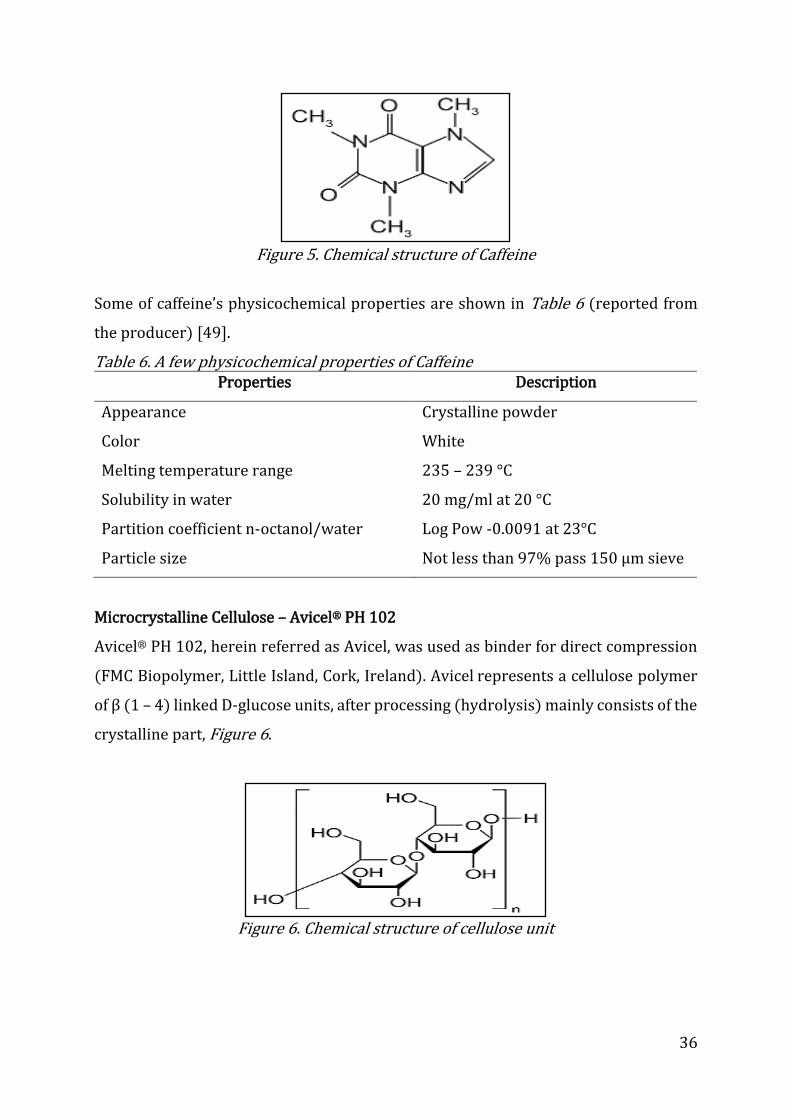
used as the second model API. Chemically it is a purine base derivative, more precisely
methylxanthine derivate (1, 3, 7 – Trimethyl xanthine), its chemical structure is shown
in Figure 5. It acts as a stimulant by blocking the action of adenosine in the neural
receptors thus prevents the onset of drowsiness, other effects are an increase in blood
pressure, diuresis, raise of the tone of cerebral vessels and inhibition of
phosphodiesterases [47]. Caffeine is usually combined with analgesics like Ibuprofen,
increasing the analgesic’s effectiveness [48].
36
Figure 5. Chemical structure of Caffeine
Some of caffeine’s physicochemical properties are shown in Table 6 (reported from
the producer) [49].
Table 6. A few physicochemical properties of Caffeine Properties Description
Appearance Crystalline powder
Color White
Melting temperature range 235 – 239 °C
Solubility in water 20 mg/ml at 20 °C
Partition coefficient n-octanol/water
Particle size
Log Pow -0.0091 at 23°C
Not less than 97% pass 150 µm sieve
Microcrystalline Cellulose – Avicel® PH 102
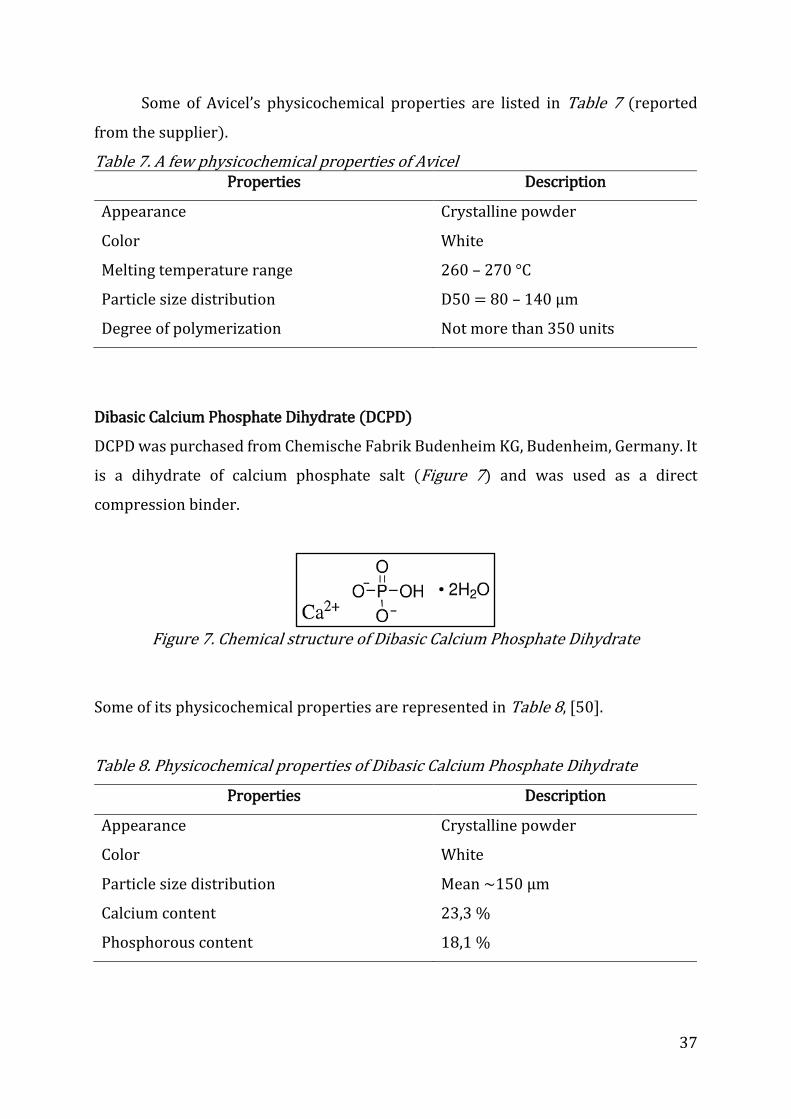
Avicel® PH 102, herein referred as Avicel, was used as binder for direct compression
(FMC Biopolymer, Little Island, Cork, Ireland). Avicel represents a cellulose polymer
of β (1 – 4) linked D-glucose units, after processing (hydrolysis) mainly consists of the
crystalline part, Figure 6.
Figure 6. Chemical structure of cellulose unit
37
Some of Avicel’s physicochemical properties are listed in Table 7 (reported
from the supplier).
Table 7. A few physicochemical properties of Avicel Properties Description
Appearance Crystalline powder
Color White
Melting temperature range 260 – 270 °C
Particle size distribution D50 = 80 – 140 µm
Degree of polymerization Not more than 350 units
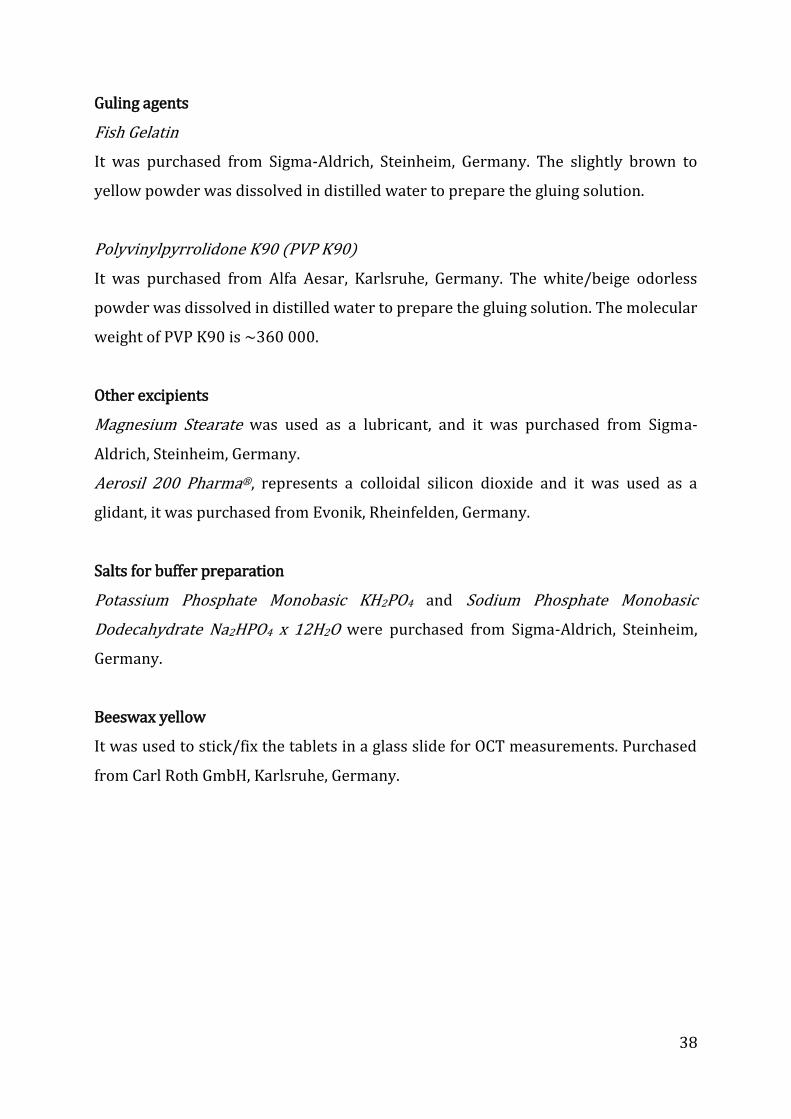
Dibasic Calcium Phosphate Dihydrate (DCPD)
DCPD was purchased from Chemische Fabrik Budenheim KG, Budenheim, Germany. It
is a dihydrate of calcium phosphate salt (Figure 7) and was used as a direct
compression binder.
Figure 7. Chemical structure of Dibasic Calcium Phosphate Dihydrate
Some of its physicochemical properties are represented in Table 8, [50].
Table 8. Physicochemical properties of Dibasic Calcium Phosphate Dihydrate
Properties Description
Appearance Crystalline powder
Color White
Particle size distribution Mean ~150 µm
Calcium content
Phosphorous content
23,3 %
18,1 %
38
Guling agents
Fish Gelatin
It was purchased from Sigma-Aldrich, Steinheim, Germany. The slightly brown to
yellow powder was dissolved in distilled water to prepare the gluing solution.
Polyvinylpyrrolidone K90 (PVP K90)
It was purchased from Alfa Aesar, Karlsruhe, Germany. The white/beige odorless
powder was dissolved in distilled water to prepare the gluing solution. The molecular
weight of PVP K90 is ~360 000.
Other excipients
Magnesium Stearate was used as a lubricant, and it was purchased from Sigma-
Aldrich, Steinheim, Germany.
Aerosil 200 Pharma®, represents a colloidal silicon dioxide and it was used as a
glidant, it was purchased from Evonik, Rheinfelden, Germany.
Salts for buffer preparation
Potassium Phosphate Monobasic KH2PO4 and Sodium Phosphate Monobasic
Dodecahydrate Na2HPO4 x 12H2O were purchased from Sigma-Aldrich, Steinheim,
Germany.
Beeswax yellow
It was used to stick/fix the tablets in a glass slide for OCT measurements. Purchased
from Carl Roth GmbH, Karlsruhe, Germany.

39
5 Methods
5.1 Tableting
5.1.1 Preparation of blends for each tablet layer
Ibuprofen free acid and caffeine anhydrous were selected as model substances. Avicel
and DCPC were used as fillers for direct compaction. Formulations containing either
ibuprofen free acid or caffeine anhydrous with either Avicel or DCPD were prepared
for tableting. These formulations and the blending/mixing procedure are presented in
Table 9.
Table 9. Formulation recipes for each tablet layer, and the blend preparation procedure
Formulation
code Recipe
Content
w/w Procedure
CA
Caffeine anhydrous
Avicel
Magnesium stearate
Aerosil 200
40 %
59 %
0.5 %
0.5 %
Manually sieved using 630
µm sieve tray
Mixing in Stephan Mixer
for 15 min at 12% of the
maximal rotation speed
CD
Caffeine anhydrous
DCPD
Magnesium stearate
40 %
59 %
1 %
Manually sieved using 630
µm sieve tray
Blending for 10 min in
Turbula blender at 62 rpm
IA
Ibuprofen free acid
Avicel
Magnesium stearate
30 %
69 %
1 %
Manually sieved using 630
µm sieve tray
Blending for 10 min in
Turbula blender at 62 rpm
ID
Ibuprofen free acid
DCPD
Magnesium stearate
30 %
69 %
1 %
Manually sieved using 630
µm sieve tray
Blending for 10 min in
Turbula blender at 62 rpm
40
Blending of the powders was performed in the Turbula blender TC2 (Willy A.
Bachofen Maschinenfabrik, Muttenz, Switzerland), for the CA formulation which was
more cohesive the Stephan Mixer (Stephan machinery GmbH, Hameln, Germany) was
used with the intent to employ higher energetic mixing, and in addition glidant
(Aerosil 200 Pharma) was added to enhance the flowability.
5.1.2 Tablet compaction
Production of tablets was carried out in the Stylcam 200R (Medelpharm, Beynost,
France) compaction simulator, flat faced cylindrical tablets were produced, the
diameter of the punches (Euro-B standard) and the die (Natoli Engineering Company
Inc., Missouri, USA) was 8 mm.
Every formulation was compressed in two different compression forces 10 and
20 kN, except for the formulation IA which consists of Ibuprofen free acid and Avicel
which was compressed just in 10 kN, compression in 20 kN was not feasible due to
lamination or capping of the tablets during the compaction cycle. No pre-compaction
step was involved.
Tablets produced by the abovementioned parameters were used for tablet
characterization tests and for the production of the multilayer tablets.
5.1.3 Tablet porosity calculation
Porosity of the single layer cylindrical tablets was calculated from the measured
dimensions i.e. height and diameter out of 10 tablets, thus the volume of the tablets
was computed. Knowing the true density of the powder blend and the mass of each
tablet the solid fraction volume was calculated. Difference between tablet volume and
solid fraction volume resulted in the porosity of the tablets, Equation 6.
𝜀𝑡[%] = (𝑉𝑡 − 𝑉𝑠
𝑉𝑡) ∙ 100 ⟹ 𝑉𝑡 =
𝑑2𝜋
4𝐻 𝑎𝑛𝑑 𝑉𝑠 =
𝑚𝑡
𝜌𝑡𝑟𝑢𝑒 (6)
Where, 𝜀𝑡[%] is the porosity of the tablet, 𝑉𝑡[𝑚𝑚3] tablet’s volume, 𝑉𝑠[𝑚𝑚3] solid
fraction volume, 𝑑[𝑚𝑚] diameter and 𝐻[𝑚𝑚] height of the cylindrical tablet, 𝑚𝑡[𝑚𝑔]
mass of the tablet and 𝜌𝑡𝑟𝑢𝑒 [𝑚𝑔
𝑚𝑚3] is the true density of the specific powder blend.
41
5.2 Compression analysis
5.2.1 Preparation of blends for compression analysis
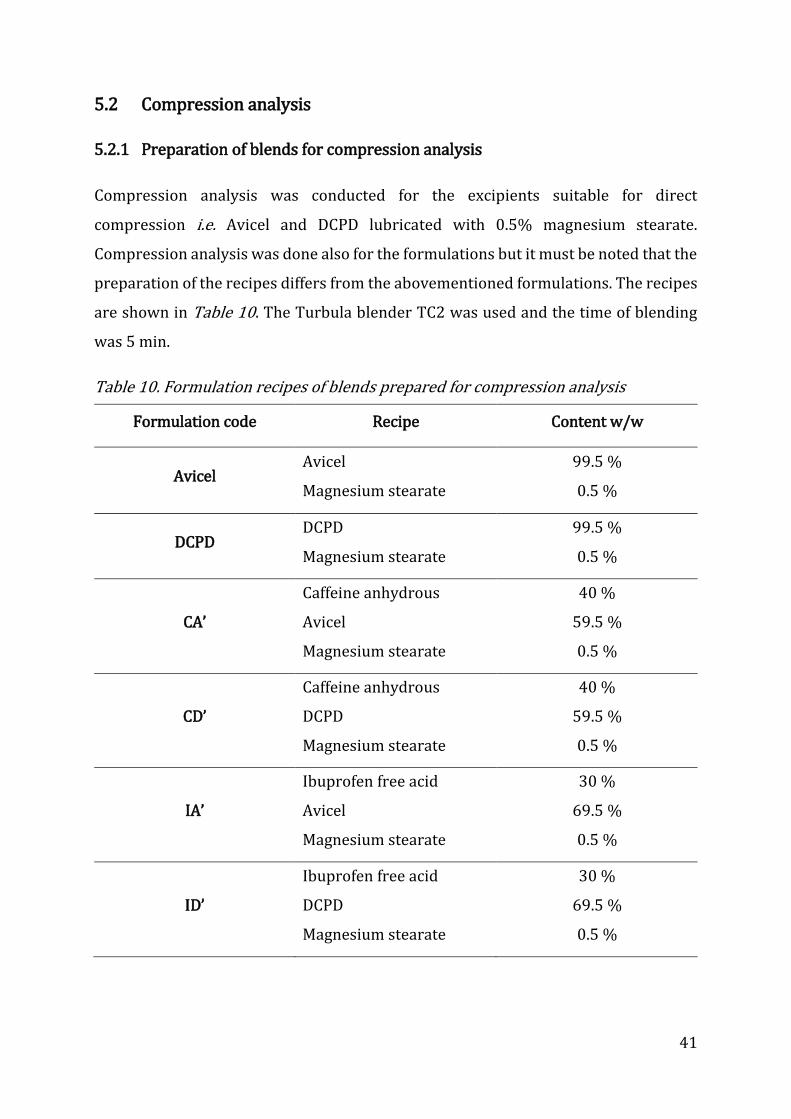
Compression analysis was conducted for the excipients suitable for direct
compression i.e. Avicel and DCPD lubricated with 0.5% magnesium stearate.
Compression analysis was done also for the formulations but it must be noted that the
preparation of the recipes differs from the abovementioned formulations. The recipes
are shown in Table 10. The Turbula blender TC2 was used and the time of blending
was 5 min.
Table 10. Formulation recipes of blends prepared for compression analysis
Formulation code Recipe Content w/w
Avicel Avicel
Magnesium stearate
99.5 %
0.5 %
DCPD DCPD
Magnesium stearate
99.5 %
0.5 %
CA’
Caffeine anhydrous
Avicel
Magnesium stearate
40 %
59.5 %
0.5 %
CD’
Caffeine anhydrous
DCPD
Magnesium stearate
40 %
59.5 %
0.5 %
IA’
Ibuprofen free acid
Avicel
Magnesium stearate
30 %
69.5 %
0.5 %
ID’
Ibuprofen free acid
DCPD
Magnesium stearate
30 %
69.5 %
0.5 %
42
5.2.2 True density measurements
True density measurements were performed for each prepared blend for compression
analysis. The helium pycnometer AccuPyc II 1340 (Micromeritics, Georgia, USA) was
used. Mean of five runs was reported, the measured true densities were used to
calculate the relative density of the powders in the compaction analysis i.e. using
Heckel’s equation.
5.2.3 Heckel’s analysis
Different tableting parameters were used to conduct the compaction analysis of the
powders, the same Stylcam 200R compaction simulator was used but the diameter of
the punches (Euro-B standard) and die (Natoli Engineering Company Inc., Missouri,
USA) in this case was 11.28 mm, and the compression pressure was 300 MPa.
Up to ten replicates were compacted, the weight of each compact was set to be
the equivalent of 0.250 cm3 powder and was calculated using the true density of
powders, five replicates for which a 300 MPa compression pressure was achieved
were selected for analysis. From the acquired data using the ANALIS Software
(Medelpharm, Beynost, France) which is coupled with the Stylcam 200R compaction
simulator the force in the upper and the lower punch, and the distance between
punches recorded during the entire compaction cycle were extracted and saved in an
Excel spreadsheet (Excel 2013, Microsoft Office), which was used to construct the
Heckel’s plots using the Heckel’s equation (Equation 4) and by visual inspection of the
graphs the linear region was selected to fit the linear function, fitting was also done
using the Excel’s linear regression fit from which the linear function was obtained.
Pressure yield Py parameter was calculated from the inverse of the value of the
slope of the linear function, and parameter A was obtained from the intersect of the
linear function with abscissa, D0 was calculated from the ratio of the bulk density of
the powder in the column and the true density of the powder, DA or the total degree of
densification was calculated by Equation 5, and Db is calculated subtracting DA and D0.
These parameters were used for the determination of the compaction behavior of the
powders, and thus the bonding mechanism.
43
5.2.4 Elastic recovery measurements
Elastic recovery of the compacted tablets was determined by measuring the height of
the tablets 2 to 3 days after their compaction using a micrometer (Mitutoyo, Illinois,
USA), the recorded minimal distance between punches corresponding to the highest
compression force was taken as the minimum height of the tablet, Equation 7 was used
to calculate the elastic recovery expressed in percent [44].
𝐸𝑅 =(𝐻𝑚𝑎𝑥 − 𝐻min)
𝐻𝑚𝑖𝑛× 100% (7)
Where ER [%] is the elastic recovery, Hmax [mm] is the height of the tablet measured
after compaction, and Hmin [mm] is the minimum distance between punches that the
tablet has experienced at the highest force.
5.3 Multilayer tablet production
5.3.1 Preparation of the gluing solutions
Fish gelatin, and PVP K90 were selected for the production of the multilayer tablets.
Aqueous solutions of 40% (w/w) and 20% (w/w) of fish gelatin and PVP K90,
respectively, were provided. Distilled water was used as medium, the solutions were
stirred with a magnetic bar at 100 rpm overnight and next day the freshly prepared
glue was used.
5.3.2 Gluing of tablet layers
Multilayer tablets were produced via the GPT, using the available prototype.
The nozzle system used for the application of the gluing agents was a 754V-SS
aseptic dispense valve system (Nordson, Oberhaching, Germany). Nozzle’s
components in contact with the polymeric solution are made of stainless steel and
polytetrafluoroethylene in accordance with the biopharmaceutical regulations. The
amount of the dispensed polymeric solution depends on the valve open time, applied
pressure, fluid viscosity, and tip size. This system allows a precise and uniform
application of aqueous solutions of gluing agents on the tablet.
44
The system is controlled from a touch screen monitor. The amount of the gluing
medium applied on the surface of the tablet is controlled by setting the time of the
applied air pressure to the cartridge. Depending on the type of the polymer and the
desired amount of the glue time can vary, several trials are required until the amount
and time are fixed for a proper operation.
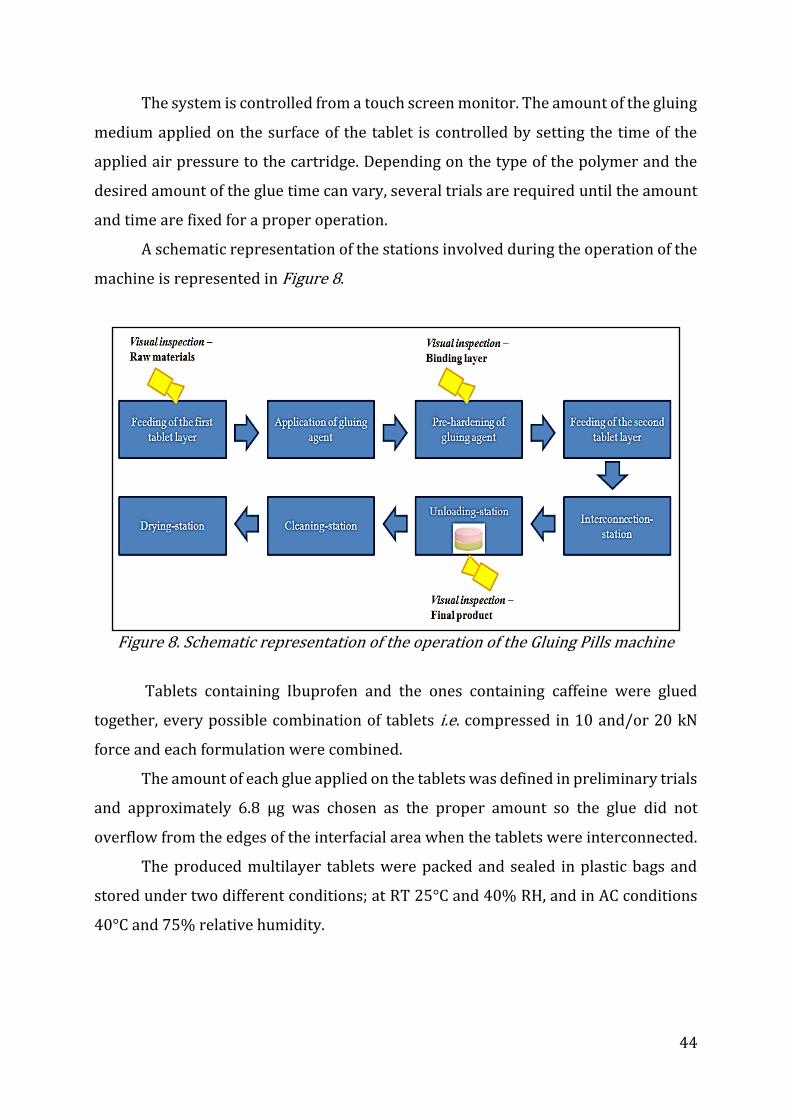
A schematic representation of the stations involved during the operation of the
machine is represented in Figure 8.
Figure 8. Schematic representation of the operation of the Gluing Pills machine
Tablets containing Ibuprofen and the ones containing caffeine were glued
together, every possible combination of tablets i.e. compressed in 10 and/or 20 kN
force and each formulation were combined.
The amount of each glue applied on the tablets was defined in preliminary trials
and approximately 6.8 µg was chosen as the proper amount so the glue did not
overflow from the edges of the interfacial area when the tablets were interconnected.
The produced multilayer tablets were packed and sealed in plastic bags and
stored under two different conditions; at RT 25°C and 40% RH, and in AC conditions
40°C and 75% relative humidity.

45
5.4 Analytical methods
5.4.1 Surface roughness characterization
Optical Coherence Tomography (OCT) measurements
Basic working principle of OCT is low coherence interferometry, which is very suitable
for imaging structures which are made up of layers, e.g. coated tablets, multilayer
tablets and also surface topographical characterization [51], [52].
OCT combines the NIR spectroscopy and Tetrahertz pulse imaging, using NIR
spectrum of the light contrary from the Tetrahertz pulse imaging which employs
submillimeter wavelengths, making the OCT a very fast technique. It uses the
difference in the refractive index of different materials present in the sample and is
sensitive to the density variations (trapped air, cracks, pores etc.) within the sample,
for example layers in the coated tablet, and has a penetration of approximately half a
millimeter. Two dimensional images are produced by using the backscattered light
from the sample and the interferometer combines it with the reference beam, thus the
depth of originated backscattered light within the sample is encoded and then read
from the spectrometer resulting in a spectrogram from which via Fourier
transformation the depth information is decoded, the end result being the so-called A-
scans, repeating A-scans in a line and over the surface of the sample the two
dimensional image or B-scans are obtained [53].
OCT system can be utilized with a software which is able to construct three
dimensional images from typically 512 B-scans. Absorption and attenuation of the
light beam through the sample affects the backscattered light intensity and thus
limiting the penetration into the sample [52].
System description
Spectral-domain OCT system was used for the measurements, the system can be
interchangeably used with the 1D or 2D sensor head, in the present work the 2D
sensor head was used. The system uses a super-luminescent diode as a light source,
the light beam passes a directional coupler DC directing it to the probe head, a non-
polarizing beam splitter BS splits the beam in 50:50 ratio between the probe beam
and the reference. The reference arm is terminated from a gold-coated mirror M, while

46
in the sample arm the beam hits a galvanometer mirror GM which is used to scan a
certain area of the sample, before hitting the sample the beam passes through a
broadband scan lens L1. The back reflected light from both the reference and the
sample arm is directed to the spectrometer via the same directional coupler DC, the
spectrometer comprises of the fiber collimator FC, the transmissive diffraction grating
DG, an achromatic lens L3, and a line scan camera (2048 pixel charged coupled device
array). 1000 A-scans are recorded for each 512 B-scans. Sampling area is computed
from the voltage range of the galvanometer which causes a displacement of the beam
for 2.94 µm. A schematic description of the OCT system can be seen in Figure 9, [54].
Figure 9. Schematic depiction of the OCT system; adapted from Ref. [54]
Preparation of sample tablets for OCT measurements
Single layer tablets of each formulation, with and without glue was measured with
OCT. The application of the glue was performed using the GPT machine. In this case,
the second layer was replaced by a polytetrafluoroethylene layer to spread evenly the
gluing agent on the surface of the tablets. The polytetrafluoroethylene layer was easily
removed after drying, revealing the gluing layer. Twenty samples of each formulation
with each gluing agent were prepared for OCT measurements, then the time zero
measurements were performed. Afterwards, the samples without glue layer were
divided into ten samples each into sealed plastic bags and placed in the storing
chambers keeping constant conditions as explained above.

47
To be able to detect any change of the tablet’s surface over storing time in
different conditions, it was crucial to scan the same area of the samples at time zero
and after two months storage. Therefore, tablets were fixed by sticking them onto
glass slides with beeswax. Also, the position of the mechanical stage of the OCT probe
was fixed to ensure the same positioning of the glass slide and consequently tablets.
Measurement parameters
The OCT Application software developed by RCPE was used to set the selected
measurement parameters, which were the offset filter of 0.09 and a beam quality
factor of 1.7. The beam quality factor determines how much a laser beam variates from
an ideal Gaussian distributed beam. The sampling area was 3.13 mm2; upper
wavelength 875 nm and lower wavelength 750 nm; frame size 1024 x 512 pixels; 512
B-scans were taken for each measurement.
Data processing
The acquired data from the OCT measurements were processed using the OCT Offline
Application software developed by RCPE, the program is able to construct a 3D profile
from the B-scans.
Surface roughness evaluation
From the obtained 3D model generated by OCTOfflineApplication software, a
greyscale snapshot 2D picture with 0.753 contrast was taken, the same was done for
all samples. The collected 2D greyscale pictures were evaluated using the image
analysis software Gwyddion® [55], the software offers the possibility of statistical
analysis of the greyscale pictures including the assessment of the surface roughness
parameters. Schematic representation of the surface roughness evaluation procedure
is shown in Figure 10.
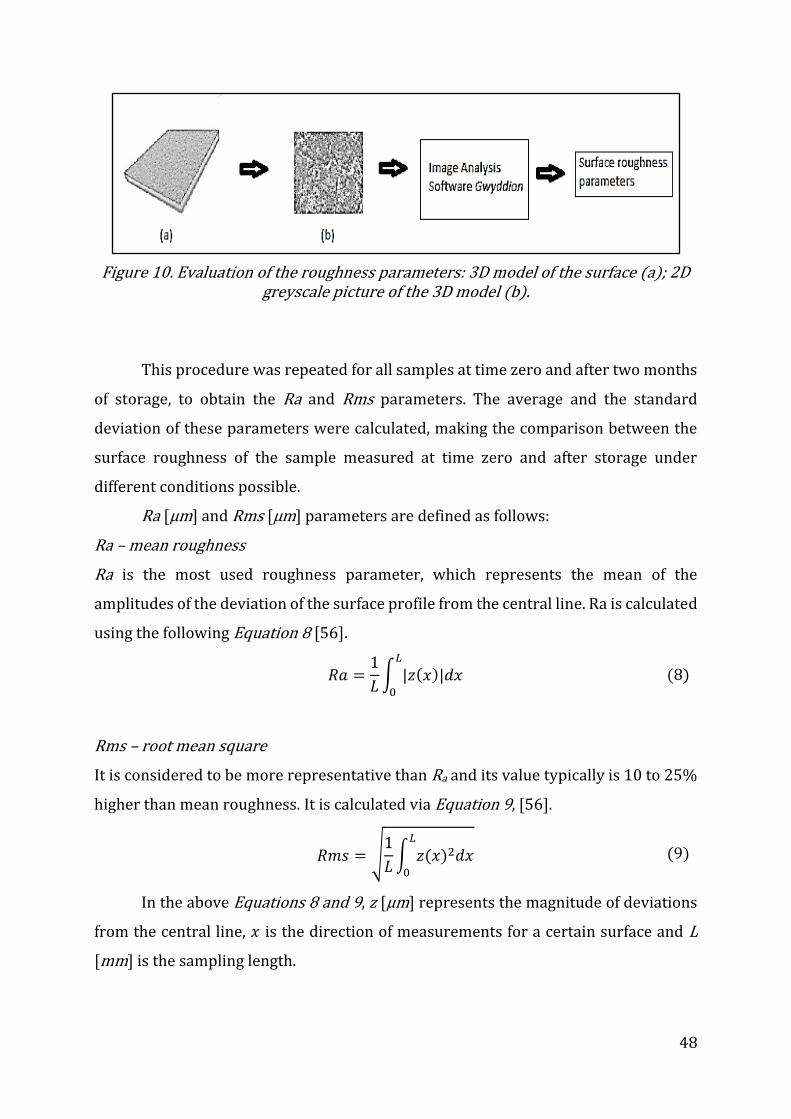
48
Figure 10. Evaluation of the roughness parameters: 3D model of the surface (a); 2D greyscale picture of the 3D model (b).
This procedure was repeated for all samples at time zero and after two months
of storage, to obtain the Ra and Rms parameters. The average and the standard
deviation of these parameters were calculated, making the comparison between the
surface roughness of the sample measured at time zero and after storage under
different conditions possible.
Ra [µm] and Rms [µm] parameters are defined as follows:
Ra – mean roughness
Ra is the most used roughness parameter, which represents the mean of the
amplitudes of the deviation of the surface profile from the central line. Ra is calculated
using the following Equation 8 [56].
𝑅𝑎 =1
𝐿∫ |𝑧(𝑥)|𝑑𝑥
𝐿
0
(8)
Rms – root mean square
It is considered to be more representative than Ra and its value typically is 10 to 25%
higher than mean roughness. It is calculated via Equation 9, [56].
𝑅𝑚𝑠 = √1
𝐿∫ 𝑧(𝑥)2𝑑𝑥
𝐿
0
(9)
In the above Equations 8 and 9, z [µm] represents the magnitude of deviations
from the central line, 𝑥 is the direction of measurements for a certain surface and L
[mm] is the sampling length.

49
Remarks
The calculated roughness parameters are reported in micrometers. Nevertheless, the
obtained values from the image analysis software are not physically true because the
grayscale height label was manually set to 1mm and the software’s algorithm
calculates the roughness according to the given scale. This means that the software
creates its own profile of the surface which is not identical to the one obtained via OCT
measurements [55]. However, these reference values are helpful in determining the
change of the texture of 2D images after the storage time of the same sample, because
the same area was measured and the measurement parameters were kept constant.
5.5 Single layer and multilayer tablet characterization
The following standardized tests were conducted in accordance with Ph. Eur. 8.0.
5.5.1 Weight uniformity
Measurements for weight uniformity were performed for single layer tablets, the
weight of individual 20 tablets was measured using the analytical scale Sartorius BT
224S (Sartorius AG, Goettingen, Germany). The average and the relative standard
deviation of the weight were reported.
5.5.2 Hardness
The crushing strength test was carried out for 10 tablets using the hardness tester
Pharma Test PTB 311E (Pharma Test, Hainburg, Germany). The diametral tensile
strength of the tablets was calculated using Equation 10 [26].
𝜎𝑡𝑠 =2𝐹
𝜋𝑑𝐻 (10)
Where 𝜎𝑡𝑠[𝑀𝑃𝑎] is the tensile strength, 𝐹 [𝑁] represents the crushing force, d [mm] is
the diameter and H [mm] the height of the cylindrical tablet.

50
5.5.4 Friability test
The friability tester PTF 20E/ER (Pharma Test, Hainburg, Germany) was used.
Friability test was performed both for single layer tablets and multilayer tablets. For
the multilayer tablets, friability test was used with the intent of investigating the
delamination tendency of multilayer tablets, after 100 rotations per minute the
number of delaminated tablets was counted.
5.5.5 Dissolution test and HPLC analysis
Dissolution test of multilayer tablets was performed in triplicates using the automatic
sampling dissolution tester DT820LH (Erweka, Heusenstamm, Germany) applying a
paddle stirring speed of 100 rpm. The dissolution medium was phosphate buffer pH
6.8 (±0.1), temperature 37°C (±0.5°C) and the vessels were filled with 500 ml buffer.
Sampling volume was 1 ml. At first, the sampling times were set as follows; point zero
(baseline), 30 min, 60 min and 120 minutes. As it was not possible to achieve 100% of
API release after 120 minutes for all formulations, for the remaining multilayer tablets
dissolution test was performed for total run time of 24 hours. The sampling times
were point zero (baseline), 30 min, 60 min, 120 min, 180 min, 240 min, 300 min, 360
min, 420 min, 480 min, 540 min, 600 min, 660 min, 720 min, 24h.
Samples from the dissolution test were analyzed using two HPLC instruments.
On Waters Alliance 2695 (Waters, Milford, Connecticut) equipped with auto-sampler
and UV-Visible photodiode array detector Waters 2996. The other instrument was
Agilent 1260 series Infinity HPLC system (Agilent, Waldbronn, Germany) equipped
with an autosampler and an UV-visible diode array detector Agilent 1260 (Agilent
Technologies, Santa Clara, CA). Detection was performed at 225 nm.
A Hibar Purospher STAR RP-18 end capped column (125 x 4 mm, 5 μm, Merck,
Darmstadt, Germany) served as a stationary phase, whereas mobile phase was a
mixture of 670 ml acetonitrile, 5 ml of 8.5 % o-phosphoric acid filled up with water to
1 liter. Analyses were carried out under isocratic elution conditions with a flow rate
of 0.7 ml/min. The column temperature was set to 21 °C and an aliquot of 7 µl of the
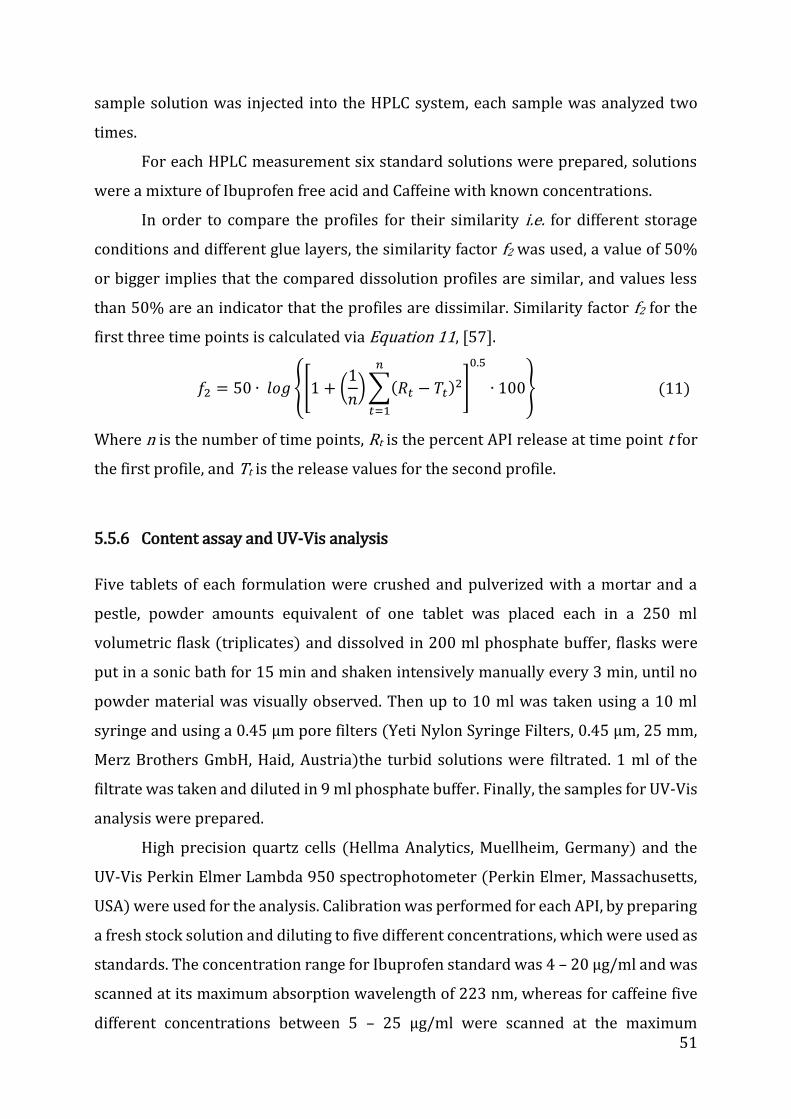
51
sample solution was injected into the HPLC system, each sample was analyzed two
times.
For each HPLC measurement six standard solutions were prepared, solutions
were a mixture of Ibuprofen free acid and Caffeine with known concentrations.
In order to compare the profiles for their similarity i.e. for different storage
conditions and different glue layers, the similarity factor f2 was used, a value of 50%
or bigger implies that the compared dissolution profiles are similar, and values less
than 50% are an indicator that the profiles are dissimilar. Similarity factor f2 for the
first three time points is calculated via Equation 11, [57].
𝑓2 = 50 ∙ 𝑙𝑜𝑔 {[1 + (1
𝑛) ∑(𝑅𝑡 − 𝑇𝑡)2
𝑛
𝑡=1
]
0.5
∙ 100}
(11)
Where n is the number of time points, Rt is the percent API release at time point t for
the first profile, and Tt is the release values for the second profile.
5.5.6 Content assay and UV-Vis analysis
Five tablets of each formulation were crushed and pulverized with a mortar and a
pestle, powder amounts equivalent of one tablet was placed each in a 250 ml
volumetric flask (triplicates) and dissolved in 200 ml phosphate buffer, flasks were
put in a sonic bath for 15 min and shaken intensively manually every 3 min, until no
powder material was visually observed. Then up to 10 ml was taken using a 10 ml
syringe and using a 0.45 μm pore filters (Yeti Nylon Syringe Filters, 0.45 μm, 25 mm,
Merz Brothers GmbH, Haid, Austria)the turbid solutions were filtrated. 1 ml of the
filtrate was taken and diluted in 9 ml phosphate buffer. Finally, the samples for UV-Vis
analysis were prepared.
High precision quartz cells (Hellma Analytics, Muellheim, Germany) and the
UV-Vis Perkin Elmer Lambda 950 spectrophotometer (Perkin Elmer, Massachusetts,
USA) were used for the analysis. Calibration was performed for each API, by preparing
a fresh stock solution and diluting to five different concentrations, which were used as
standards. The concentration range for Ibuprofen standard was 4 – 20 µg/ml and was
scanned at its maximum absorption wavelength of 223 nm, whereas for caffeine five
different concentrations between 5 – 25 µg/ml were scanned at the maximum

52
absorption wavelength of 273 nm. The maximum absorption for each API was
determined by scanning the solutions in the wavelength range of 200-400 nm.
Results of the calibration are shown in the following linear equations including
the correlation coefficient R-squared, for ibuprofen Equation 12 and for caffeine
Equation 13.
Ibuprofen:
𝑦 = 0.0466𝑥; 𝑅2 = 0.9979 (12)
Caffeine:
𝑦 = 0.0508𝑥; 𝑅2 = 0.9979 (13)
5.6 Characterization of gluing agents - Viscosity
The adhesiveness strength of the gluing agents depends on various parameters such
as viscosity, the evaporation time of solvents and the thickness of applied gluing layer.
In this work, the viscosity was chosen as the critical parameter which affects the
binding strength.
Viscosity measurements were carried out with the Physica MCR 300 rheometer
(Anton Paar, Graz, Austria). Analyses were performed using a temperature range of
20-80 °C. The selected aqueous solutions were fish gelatin 40(%w/w), PVP K90
20(%w/w).
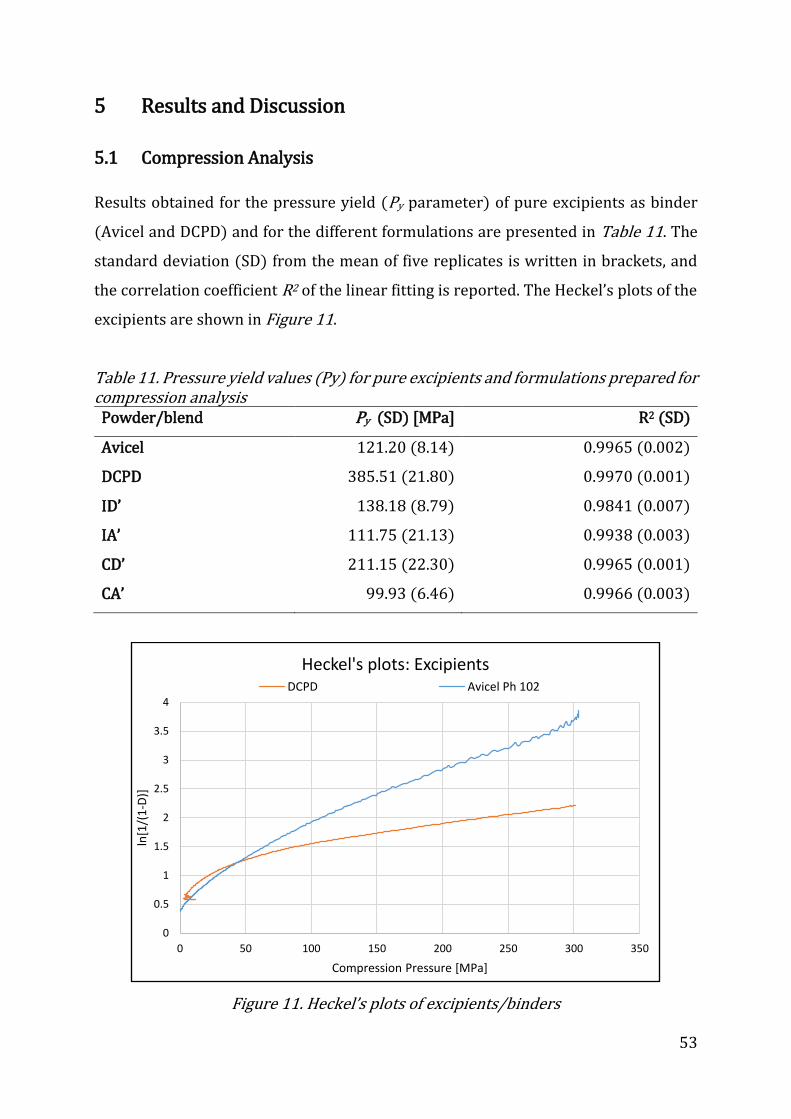
53
5 Results and Discussion
5.1 Compression Analysis
Results obtained for the pressure yield (Py parameter) of pure excipients as binder
(Avicel and DCPD) and for the different formulations are presented in Table 11. The
standard deviation (SD) from the mean of five replicates is written in brackets, and
the correlation coefficient R2 of the linear fitting is reported. The Heckel’s plots of the
excipients are shown in Figure 11.
Table 11. Pressure yield values (Py) for pure excipients and formulations prepared for compression analysis Powder/blend Py (SD) [MPa] R2 (SD)
Avicel
DCPD
ID’
IA’
CD’
CA’
121.20 (8.14)
385.51 (21.80)
138.18 (8.79)
111.75 (21.13)
211.15 (22.30)
99.93 (6.46)
0.9965 (0.002)
0.9970 (0.001)
0.9841 (0.007)
0.9938 (0.003)
0.9965 (0.001)
0.9966 (0.003)
Figure 11. Heckel’s plots of excipients/binders
0
0.5
1
1.5
2
2.5
3
3.5
4
0 50 100 150 200 250 300 350
ln[1
/(1
-D)]
Compression Pressure [MPa]
Heckel's plots: ExcipientsDCPD Avicel Ph 102
54
Excipients
The pressure yield (Py) of DCPD was e approximately three folds higher than of Avicel.
This difference is in accordance with the literature and implies that the main
deformation mechanism of DCPD is brittle/fracture, whereas Avicel mainly undergoes
plastic/elastic deformation [58]–[61].
The above statement can be confirmed by the the Heckle profiles of pure
excipients. As can be seen from Figure 11, Avicel gives a type A profile, typical for
materials which undergo plastic deformation, while DCPD belongs to type C,
characteristic for brittle/fracture deformation [25], [62].
In general, reported values for pressure yield in the literature differ from each
other. This is attributed to Heckel’s equation dependency on experimental
parameters, such as compression force, the geometry of the compacts, compression
speed, etc., and also due to the method of fitting the linear function to the linear region
of the Heckel’s plots [27].
According to literature, the main bonding mechanism of microcrystalline
cellulose (Avicel) is via a large number of weak attraction forces (intermolecular
forces), which is attributed to relatively small particle size and pronounced surface
roughness, and the high plasticity of this material. Same for DCPD, as fragmenting
brittle material, its bonding mechanism is dominated by the intermolecular attraction
forces, and its existent but limited plasticity and low elasticity contribute to sufficient
binding strength of the tablet [63].
Binary mixtures
The Heckel’s plots of binary mixtures of DCPD and Avicel with respective APIs are
presented in Figure 12 and Figure 13, respectively.
Since the API load in the formulations was relatively high, it is expected that the
compaction properties of the APIs will affect the overall compaction behavior of the
powder blend.
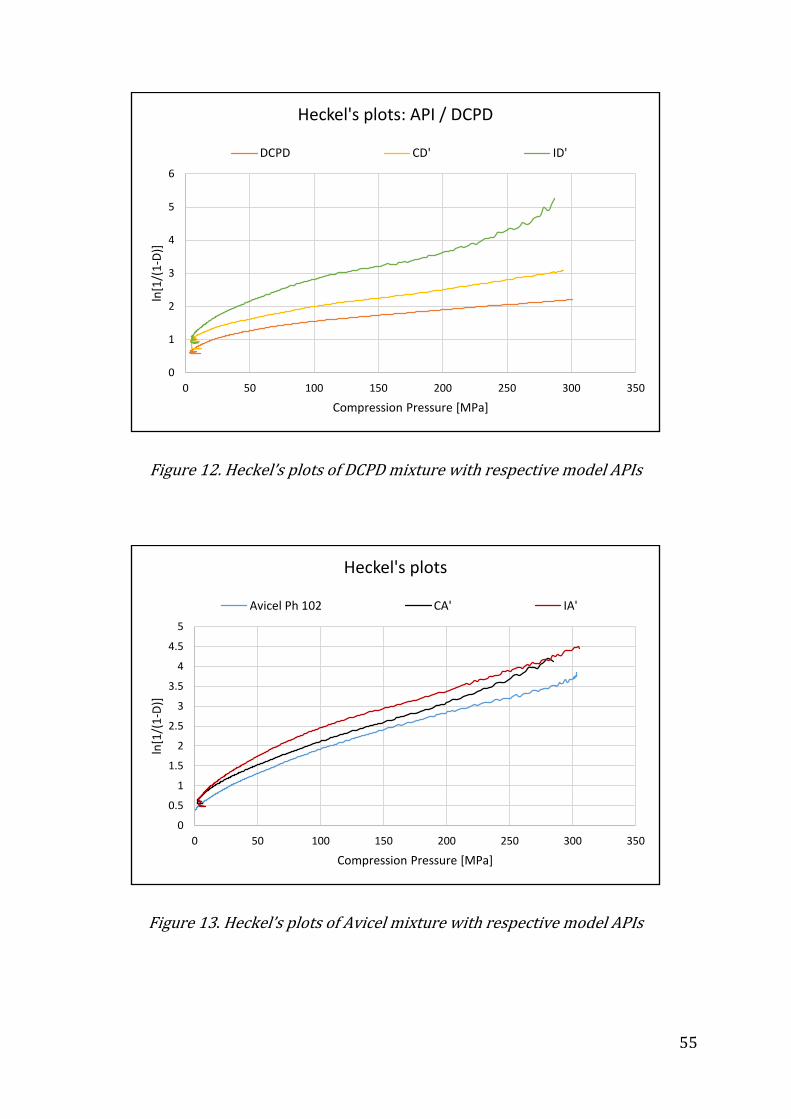
55
Figure 12. Heckel’s plots of DCPD mixture with respective model APIs
Figure 13. Heckel’s plots of Avicel mixture with respective model APIs
0
1
2
3
4
5
6
0 50 100 150 200 250 300 350
ln[1
/(1
-D)]
Compression Pressure [MPa]
Heckel's plots: API / DCPD
DCPD CD' ID'
0
0.5
1
1.5
2
2.5
3
3.5
4
4.5
5
0 50 100 150 200 250 300 350
ln[1
/(1
-D)]
Compression Pressure [MPa]
Heckel's plots
Avicel Ph 102 CA' IA'
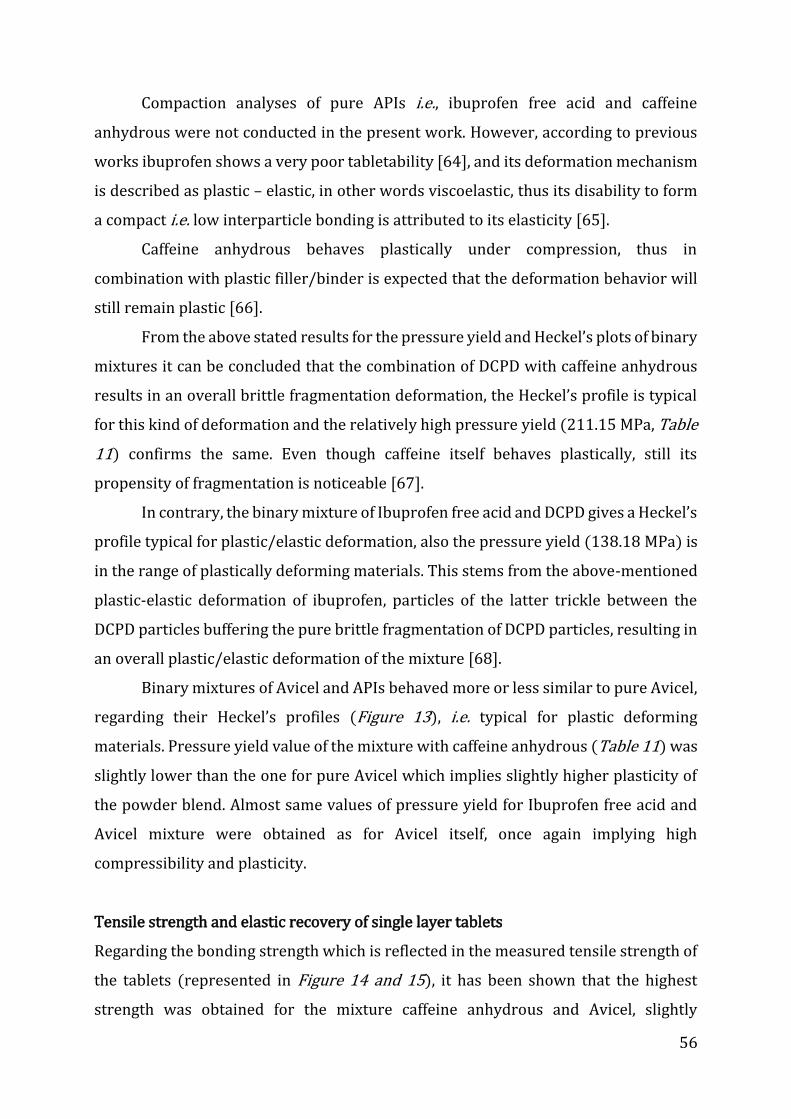
56
Compaction analyses of pure APIs i.e., ibuprofen free acid and caffeine
anhydrous were not conducted in the present work. However, according to previous
works ibuprofen shows a very poor tabletability [64], and its deformation mechanism
is described as plastic – elastic, in other words viscoelastic, thus its disability to form
a compact i.e. low interparticle bonding is attributed to its elasticity [65].
Caffeine anhydrous behaves plastically under compression, thus in
combination with plastic filler/binder is expected that the deformation behavior will
still remain plastic [66].
From the above stated results for the pressure yield and Heckel’s plots of binary
mixtures it can be concluded that the combination of DCPD with caffeine anhydrous
results in an overall brittle fragmentation deformation, the Heckel’s profile is typical
for this kind of deformation and the relatively high pressure yield (211.15 MPa, Table
11) confirms the same. Even though caffeine itself behaves plastically, still its
propensity of fragmentation is noticeable [67].
In contrary, the binary mixture of Ibuprofen free acid and DCPD gives a Heckel’s
profile typical for plastic/elastic deformation, also the pressure yield (138.18 MPa) is
in the range of plastically deforming materials. This stems from the above-mentioned
plastic-elastic deformation of ibuprofen, particles of the latter trickle between the
DCPD particles buffering the pure brittle fragmentation of DCPD particles, resulting in
an overall plastic/elastic deformation of the mixture [68].
Binary mixtures of Avicel and APIs behaved more or less similar to pure Avicel,
regarding their Heckel’s profiles (Figure 13), i.e. typical for plastic deforming
materials. Pressure yield value of the mixture with caffeine anhydrous (Table 11) was
slightly lower than the one for pure Avicel which implies slightly higher plasticity of
the powder blend. Almost same values of pressure yield for Ibuprofen free acid and
Avicel mixture were obtained as for Avicel itself, once again implying high
compressibility and plasticity.
Tensile strength and elastic recovery of single layer tablets
Regarding the bonding strength which is reflected in the measured tensile strength of
the tablets (represented in Figure 14 and 15), it has been shown that the highest
strength was obtained for the mixture caffeine anhydrous and Avicel, slightly

57
exceeding even the tensile strength of the pure excipient. Same, higher values of
tensile strength than the pure DCPD tablets for both compaction forces were observed
for caffeine and DCPD mixture. This may be attributed to the plasticity of the caffeine.
Compaction of ibuprofen free acid with DCPD mixture in 10 kN showed a
slightly higher tensile strength than of the pure excipient. But for the same mixture
compacted in 20 kN, the tensile strength was lower than pure DCPD, this stems from
the elasticity of Ibuprofen which increases the magnitude of axial relaxation.
In the case of Avicel with ibuprofen free acid blend, the compaction was just
possible by applying 10 kN force, compression in 20 kN resulted in capping or
lamination of tablets during the compaction cycle. The low bonding capacity of
mixtures containing Ibuprofen free acid is attributed to its elasticity and very poor
tabletability, shown also at the measured elastic recovery represented in Figure 16,
where the tablets prepared from this mixture showed the highest elastic recovery, this
was additionally a contribute of elasticity of Avicel.
Higher elastic recovery was determined for tablets containing Avicel than DCPD
(Figure 16), certainly, this is attributed to the deformation behavior of Avicel as
mentioned above.
Figure 14. Tensile strength of single layer tablets containing Avicel, compacted in 10 and 20 kN
00.5
11.5
22.5
33.5
44.5
55.5
66.5
77.5
8
10 kN 20 kN
Ten
sile
str
engt
h [
MP
a]
Tensile strength of single layer tablets: Filler Avicel
Avicel CA IA
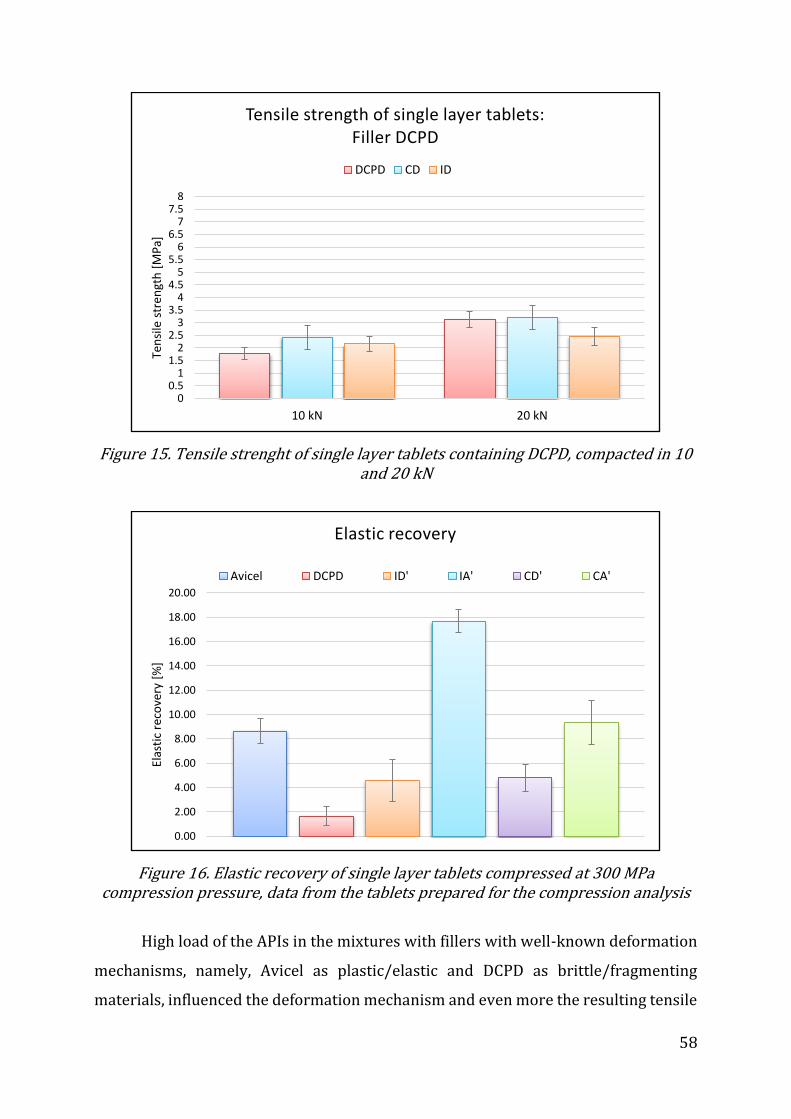
58
Figure 15. Tensile strenght of single layer tablets containing DCPD, compacted in 10 and 20 kN
Figure 16. Elastic recovery of single layer tablets compressed at 300 MPa compression pressure, data from the tablets prepared for the compression analysis
High load of the APIs in the mixtures with fillers with well-known deformation
mechanisms, namely, Avicel as plastic/elastic and DCPD as brittle/fragmenting
materials, influenced the deformation mechanism and even more the resulting tensile
00.5
11.5
22.5
33.5
44.5
55.5
66.5
77.5
8
10 kN 20 kN
Ten
sile
str
engt
h [
MP
a]
Tensile strength of single layer tablets:Filler DCPD
DCPD CD ID
0.00
2.00
4.00
6.00
8.00
10.00
12.00
14.00
16.00
18.00
20.00
Elas
tic
reco
very
[%
]
Elastic recovery
Avicel DCPD ID' IA' CD' CA'

59
strength and elastic recovery of the tablets. Specifically, ibuprofen free acid which
possesses a plastic/elastic behavior with expressed elasticity, in combination with
both APIs, resulted in a plastic/elastic deformation mechanism, significantly higher
elastic recovery than the pure excipient, and low tensile strength. On the other hand,
mixtures with caffeine anhydrous and fillers, rendered in relatively high tensile
strength and low elastic recovery. Caffeine’s deformation behavior is reported as
plastic/elastic but in some extent it shows brittleness, this was shown also in the
mixtures where the blend with Avicel kept the plastic/elastic behavior and the blend
with DCPD showed brittle/fragmenting behavior.
5.2 Surface roughness analysis
Surface roughness of tablets is an important factor which is related to the bonding
strength between two layers when compressed together, or in the case of GPT when
gluing them together, always with the intent of producing multilayer tablets.
Generally, compression of materials with different deformation behavior
results in tablets with different surface roughness. Rougher surface provides more
contact points between the layers, and results in increased probability of mechanical
interlocking and thus stronger adhesion between layers. Decrease in the surface
roughness with the increase of the compaction force has been noticed, especially for
plastic materials [69].
Surface roughness is characterized by the so-called roughness parameters. In
the present work mean roughness Ra and root mean square Rms were evaluated to
characterize the surface roughness of the tablets [56]. The presented data are
considering just the mean roughness Ra, because this parameter is the most used one.
As mentioned above, the evaluated parameter has no physical meaning as the maximal
height of the profile in the image analysis software Gwyddion® was manually set to 1
mm. A high precaution should be taken if one would attempt to compare roughness
parameters in between different types of tablets and tablets with different gluing
layers. However, these measurements are helpful for detecting the alterations in
roughness parameters due to the storage conditions, if the same area of a tablet with
gluing layer is scanned directly after applying the gluing layer and after storage by
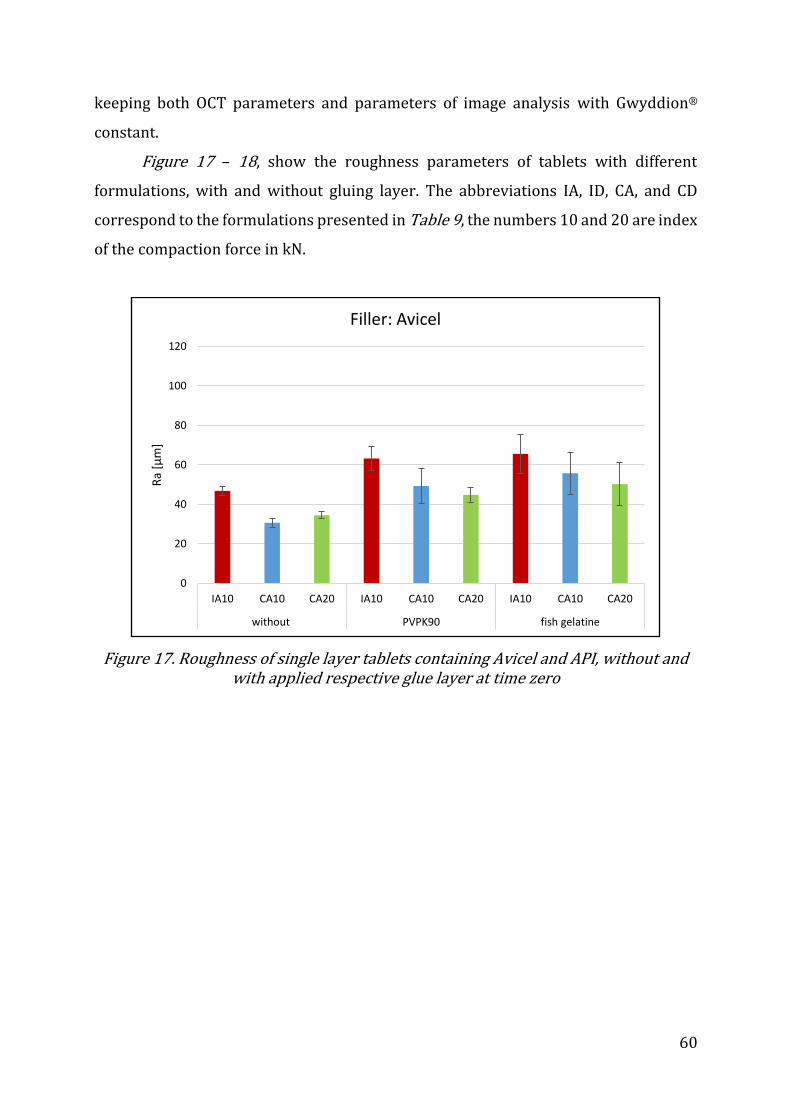
60
keeping both OCT parameters and parameters of image analysis with Gwyddion®
constant.
Figure 17 – 18, show the roughness parameters of tablets with different
formulations, with and without gluing layer. The abbreviations IA, ID, CA, and CD
correspond to the formulations presented in Table 9, the numbers 10 and 20 are index
of the compaction force in kN.
Figure 17. Roughness of single layer tablets containing Avicel and API, without and with applied respective glue layer at time zero
0
20
40
60
80
100
120
IA10 CA10 CA20 IA10 CA10 CA20 IA10 CA10 CA20
without PVPK90 fish gelatine
Ra
[µm
]
Filler: Avicel
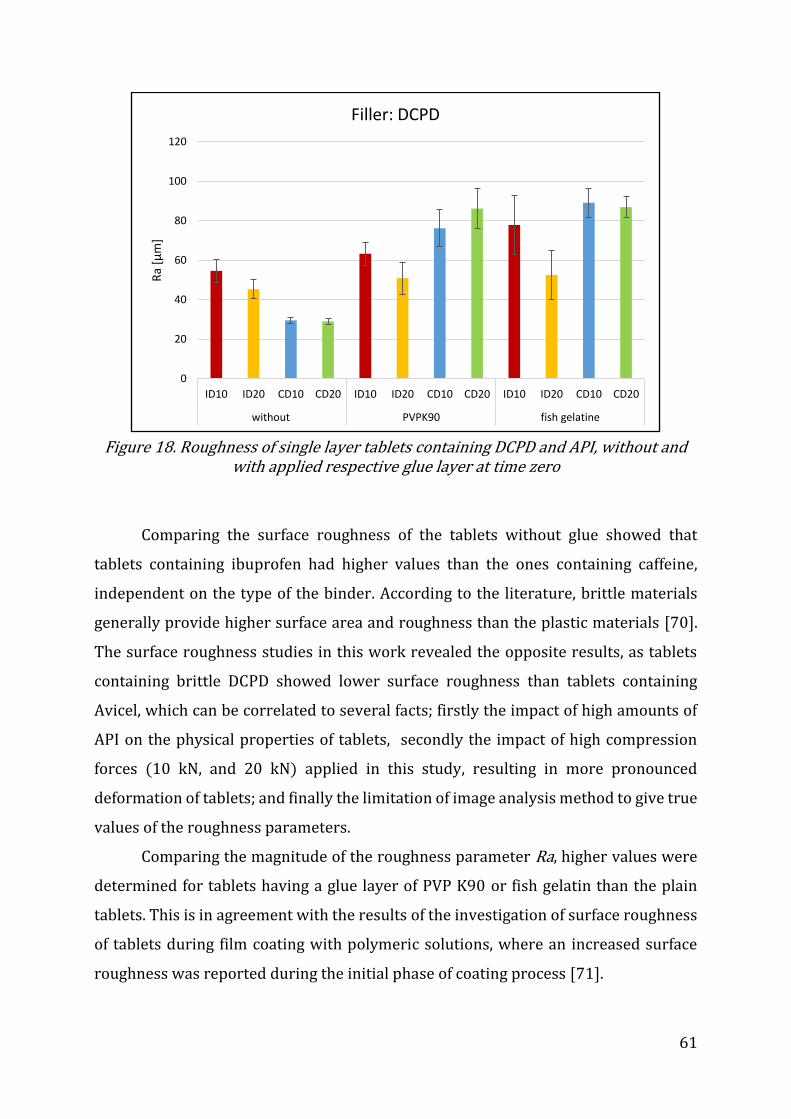
61
Figure 18. Roughness of single layer tablets containing DCPD and API, without and
with applied respective glue layer at time zero
Comparing the surface roughness of the tablets without glue showed that
tablets containing ibuprofen had higher values than the ones containing caffeine,
independent on the type of the binder. According to the literature, brittle materials
generally provide higher surface area and roughness than the plastic materials [70].
The surface roughness studies in this work revealed the opposite results, as tablets
containing brittle DCPD showed lower surface roughness than tablets containing
Avicel, which can be correlated to several facts; firstly the impact of high amounts of
API on the physical properties of tablets, secondly the impact of high compression
forces (10 kN, and 20 kN) applied in this study, resulting in more pronounced
deformation of tablets; and finally the limitation of image analysis method to give true
values of the roughness parameters.
Comparing the magnitude of the roughness parameter Ra, higher values were
determined for tablets having a glue layer of PVP K90 or fish gelatin than the plain
tablets. This is in agreement with the results of the investigation of surface roughness
of tablets during film coating with polymeric solutions, where an increased surface
roughness was reported during the initial phase of coating process [71].
0
20
40
60
80
100
120
ID10 ID20 CD10 CD20 ID10 ID20 CD10 CD20 ID10 ID20 CD10 CD20
without PVPK90 fish gelatine
Ra
[µm
]
Filler: DCPD
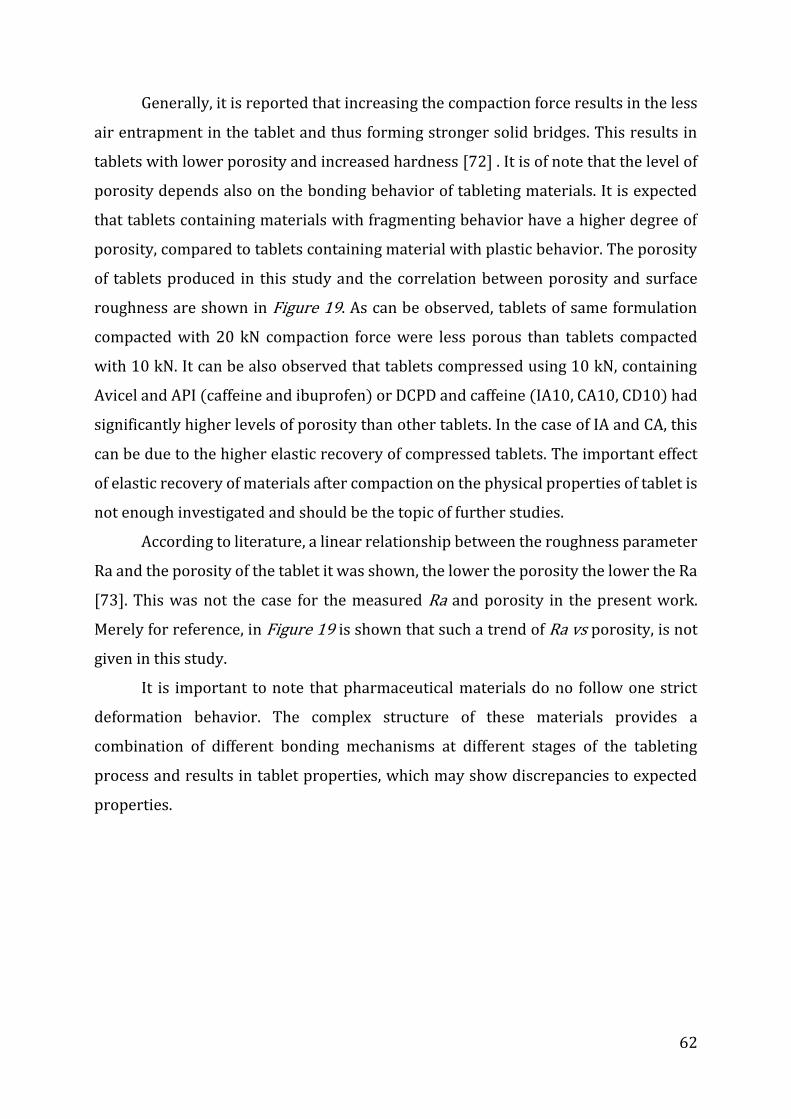
62
Generally, it is reported that increasing the compaction force results in the less
air entrapment in the tablet and thus forming stronger solid bridges. This results in
tablets with lower porosity and increased hardness [72] . It is of note that the level of
porosity depends also on the bonding behavior of tableting materials. It is expected
that tablets containing materials with fragmenting behavior have a higher degree of
porosity, compared to tablets containing material with plastic behavior. The porosity
of tablets produced in this study and the correlation between porosity and surface
roughness are shown in Figure 19. As can be observed, tablets of same formulation
compacted with 20 kN compaction force were less porous than tablets compacted
with 10 kN. It can be also observed that tablets compressed using 10 kN, containing
Avicel and API (caffeine and ibuprofen) or DCPD and caffeine (IA10, CA10, CD10) had
significantly higher levels of porosity than other tablets. In the case of IA and CA, this
can be due to the higher elastic recovery of compressed tablets. The important effect
of elastic recovery of materials after compaction on the physical properties of tablet is
not enough investigated and should be the topic of further studies.
According to literature, a linear relationship between the roughness parameter
Ra and the porosity of the tablet it was shown, the lower the porosity the lower the Ra
[73]. This was not the case for the measured Ra and porosity in the present work.
Merely for reference, in Figure 19 is shown that such a trend of Ra vs porosity, is not
given in this study.
It is important to note that pharmaceutical materials do no follow one strict
deformation behavior. The complex structure of these materials provides a
combination of different bonding mechanisms at different stages of the tableting
process and results in tablet properties, which may show discrepancies to expected
properties.

63
Figure 19. Roughness parameter Ra vs Porosity for different formulations
In order to ease the detection of the change of the Ra parameter of tablets
without glue layer due to the storage conditions, the ratio between values after the
storage and at time zero were calculated and presented in Figure 20 and 21.
Abbreviation RC stands for room conditions (25°C and 40% RH), AC for accelerated
conditions (40°C and 75% RH), and T0 for time zero.
Figure 20. Ratio of Ra values after and before storage, tablets containing Avicel and
no glue layer
0
10
20
30
40
50
60
70
0 2 4 6 8 10 12 14 16 18
Ra
[µm
]
Porosity [%]
Ra vs Porosity
ID20 ID10 CA20 CA10 CD10 CD20 IA10
0
0.2
0.4
0.6
0.8
1
1.2
1.4
1.6
1.8
T0 RC/T0 T0 RC/T0 T0 RC/T0 T0 AC/T0 T0 AC/T0 T0 AC/T0
IA 10 kN CA 10 kN CA 20 kN IA 10 kN CA 10 kN CA 20 kN
Fold
ch
ange
of
Ra
Ratio of Ra after and before storage: Filler Avicel
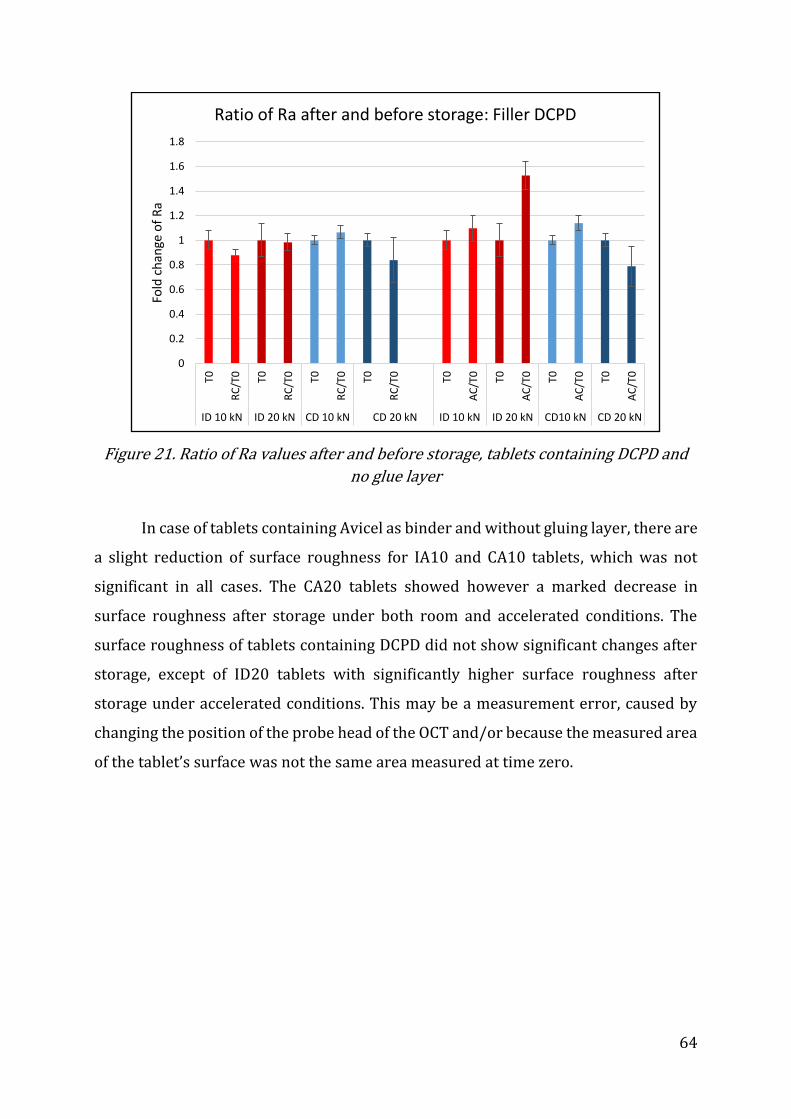
64
Figure 21. Ratio of Ra values after and before storage, tablets containing DCPD and
no glue layer
In case of tablets containing Avicel as binder and without gluing layer, there are
a slight reduction of surface roughness for IA10 and CA10 tablets, which was not
significant in all cases. The CA20 tablets showed however a marked decrease in
surface roughness after storage under both room and accelerated conditions. The
surface roughness of tablets containing DCPD did not show significant changes after
storage, except of ID20 tablets with significantly higher surface roughness after
storage under accelerated conditions. This may be a measurement error, caused by
changing the position of the probe head of the OCT and/or because the measured area
of the tablet’s surface was not the same area measured at time zero.
0
0.2
0.4
0.6
0.8
1
1.2
1.4
1.6
1.8
T0
RC
/T0 T0
RC
/T0 T0
RC
/T0 T0
RC
/T0 T0
AC
/T0 T0
AC
/T0 T0
AC
/T0 T0
AC
/T0
ID 10 kN ID 20 kN CD 10 kN CD 20 kN ID 10 kN ID 20 kN CD10 kN CD 20 kN
Fold
ch
ange
of
Ra
Ratio of Ra after and before storage: Filler DCPD

65
5.3 Viscosity of polymeric solutions (Gluing agents)
The results of the viscosity measurements are shown in Figure 22. PVP K90 with the
concentration of 20% (w/w) has a higher viscosity than fish gelatin 40 % (w/w).
Figure 22. Dynamic viscosity (µ) of polymeric solutions in a 20 – 80 °C temperature range
Regarding the binding strength of polymeric solutions, an analogy to the
granulation process can be drawn, the lower viscosity facilitates the distribution of the
binder solution between particles creating more contact and resulting in a higher
granule strength [74].
Similarly, for the film coating process, a better adhesion was observed when a
lower viscous organic based polymeric binder was used, because of the easier
penetration into the pores and microstructures on the surface of the tablets [75]. The
validity of the same argument for suitability of polymeric solutions with lower
viscosity (fish gelatin in this study) has been proofed for gluing the tablet.
0
1000
2000
3000
4000
5000
6000
7000
8000
9000
0 10 20 30 40 50 60 70 80 90
µ[m
Pa∙s]
Temperature [°C]
Viscosity of gluing agents
Fish Gelatin 40% PVP_K90 20%

66
5.4 Investigation of the delamination tendency of bilayer tablets
All of the monolayer tablets passed the friability test, showing less than 1% friability,
according to Ph. Eur. 0.8 requirements. Delamination tendency of bilayer tablets was
also investigated using the friability test. The results listed in Table 12 and 13,
represent the bilayer combinations which showed no/or just one case of delamination
and bilayer combinations which showed more than one case of delamination,
respectively.
The matching of deformation behavior (DB), elastic recovery (ER), tensile
strength (TS), and compression force (CF) of two combined layers are shown with
“+”, mismatching of the same properties between combined layers is shown as “-“. Of
note, that surface roughness is not listed in Table 12 and 13, as a higher surface
roughness was calculated for tablets containing ibuprofen independent to the kind of
excipient. Therefore calculated roughness for all combinations listed in these two
tables is mismatched.
Table 12. Bilayer tablets without delamination or one delamination after friability test measured at T0, and storage under accelerated condition (AC) and room condition (RC). Abbreviations: ER = elastic recovery, CF = compression force, DB = deformation behaiviour, TS = tensile strength. The matching or mismatching of these properties between two combined layers is shown as “+” or “-“, respectively. Bilayer tablet Physical properties matching between two layers
DB ER TS CF Delamination
IA10_PVPK90_CA10 + - - + no
ID20_PVPK90_CA20 + + - + no
ID10_PVPK90_CA20 + + + - no
ID20_PVPK90_CA10 + + + - no
ID10_PVPK90_CD20 - + + - no
ID20_PVPK90_CD10 - + + - no
ID20_PVPK90_CD20 - + + + AC (1)
ID10_FishGelatin_CD10 - + + + no
ID10_FishGelatin_CA10 + + - + no
ID20_FishGelatin_CD20 - + + + no
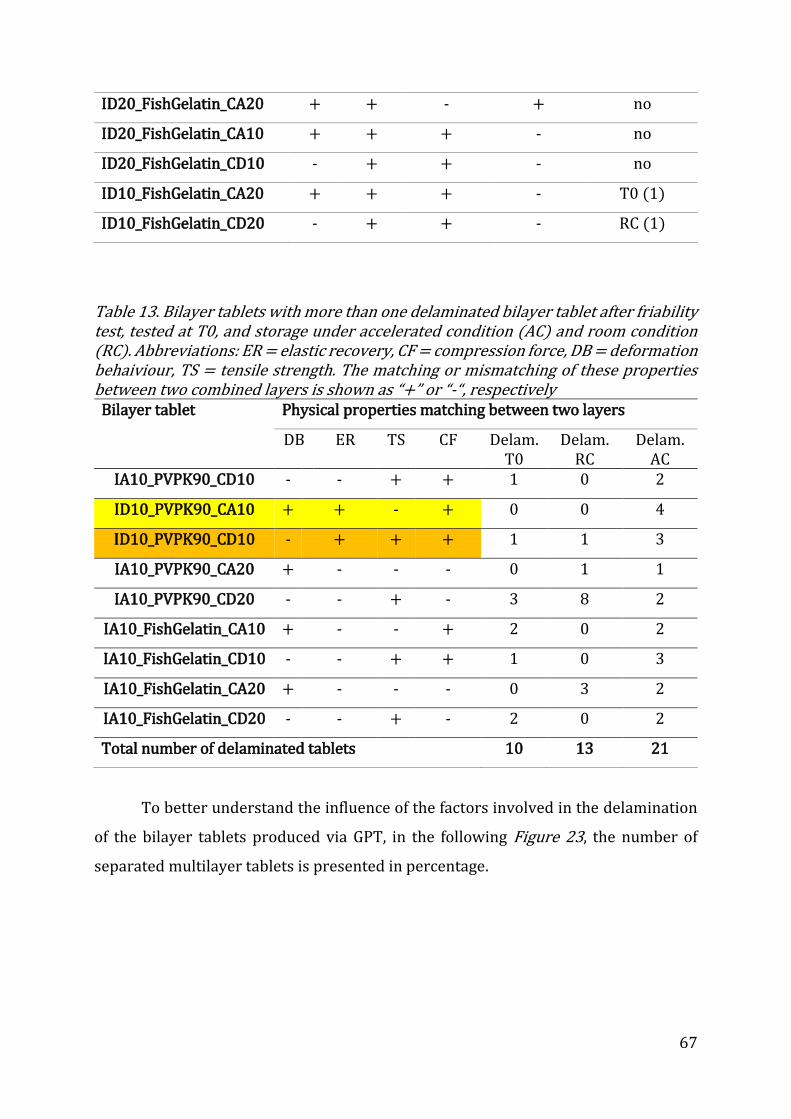
67
ID20_FishGelatin_CA20 + + - + no
ID20_FishGelatin_CA10 + + + - no
ID20_FishGelatin_CD10 - + + - no
ID10_FishGelatin_CA20 + + + - T0 (1)
ID10_FishGelatin_CD20 - + + - RC (1)
Table 13. Bilayer tablets with more than one delaminated bilayer tablet after friability test, tested at T0, and storage under accelerated condition (AC) and room condition (RC). Abbreviations: ER = elastic recovery, CF = compression force, DB = deformation behaiviour, TS = tensile strength. The matching or mismatching of these properties between two combined layers is shown as “+” or “-“, respectively Bilayer tablet Physical properties matching between two layers
DB ER TS CF Delam. T0
Delam. RC
Delam. AC
IA10_PVPK90_CD10 - - + + 1 0 2
ID10_PVPK90_CA10 + + - + 0 0 4
ID10_PVPK90_CD10 - + + + 1 1 3
IA10_PVPK90_CA20 + - - - 0 1 1
IA10_PVPK90_CD20 - - + - 3 8 2
IA10_FishGelatin_CA10 + - - + 2 0 2
IA10_FishGelatin_CD10 - - + + 1 0 3
IA10_FishGelatin_CA20 + - - - 0 3 2
IA10_FishGelatin_CD20 - - + - 2 0 2
Total number of delaminated tablets 10 13 21
To better understand the influence of the factors involved in the delamination
of the bilayer tablets produced via GPT, in the following Figure 23, the number of
separated multilayer tablets is presented in percentage.

68
Figure 23. Effect of different factors on the amount of separated multilayer tablets.
Abbreviations: ER = elastic recovery, CF = compression force, DB = deformation
behaiviour, TS = tensile strength. The matching or mismatching of these properties
between two combined layers is shown as “+” or “-“, respectively
As can be observed from Table 12, the most important factor, whose matching
between layers ensured the enough robustness of bilayer tablets was the elastic
recovery [35]. As can be seen from this table, in all bilayer tablets; except the first
combination, elastic recovery was matched between the layers and the matching of
other three parameters played a role in combination with elastic recovery.
Same in Figure 23, presence of ER mismatch of the tablets in relation with any
of other factors gave the highest amount of separations. Especially combined with a
mismatch in deformation behavior and compaction force.
The highest amount of separations occurred in the combination of tablets with
different deformation behavior coupled with ER mismatch. The mismatch in elastic,
plastic and brittle properties of the two layers has been shown to decrease the
interfacial strength, and thus increase the delamination tendency for bilayer tablets
produced in a conventional way [76]. The mismatch in deformation behavior caused
DB(+):TS(-):CF(+)
DB(+):TS(-):CF(-)
DB(-):TS(+):CF(+)
DB(-):TS(+):CF(-)
0
5
10
15
20
25
30
35
40
ER(-) ER(+)
Am
ou
nt
of
sep
arat
ed t
able
ts [
%]
Effect of elastic recovery and other factors on delamination
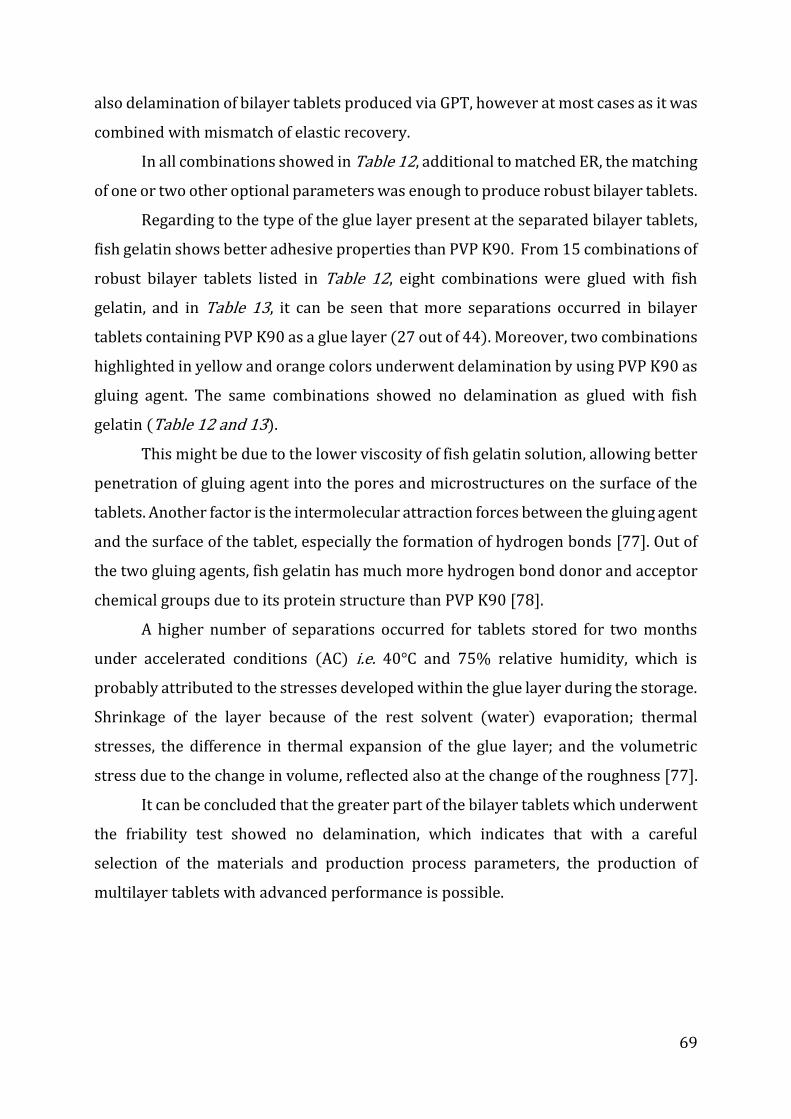
69
also delamination of bilayer tablets produced via GPT, however at most cases as it was
combined with mismatch of elastic recovery.
In all combinations showed in Table 12, additional to matched ER, the matching
of one or two other optional parameters was enough to produce robust bilayer tablets.
Regarding to the type of the glue layer present at the separated bilayer tablets,
fish gelatin shows better adhesive properties than PVP K90. From 15 combinations of
robust bilayer tablets listed in Table 12, eight combinations were glued with fish
gelatin, and in Table 13, it can be seen that more separations occurred in bilayer
tablets containing PVP K90 as a glue layer (27 out of 44). Moreover, two combinations
highlighted in yellow and orange colors underwent delamination by using PVP K90 as
gluing agent. The same combinations showed no delamination as glued with fish
gelatin (Table 12 and 13).
This might be due to the lower viscosity of fish gelatin solution, allowing better
penetration of gluing agent into the pores and microstructures on the surface of the
tablets. Another factor is the intermolecular attraction forces between the gluing agent
and the surface of the tablet, especially the formation of hydrogen bonds [77]. Out of
the two gluing agents, fish gelatin has much more hydrogen bond donor and acceptor
chemical groups due to its protein structure than PVP K90 [78].
A higher number of separations occurred for tablets stored for two months
under accelerated conditions (AC) i.e. 40°C and 75% relative humidity, which is
probably attributed to the stresses developed within the glue layer during the storage.
Shrinkage of the layer because of the rest solvent (water) evaporation; thermal
stresses, the difference in thermal expansion of the glue layer; and the volumetric
stress due to the change in volume, reflected also at the change of the roughness [77].
It can be concluded that the greater part of the bilayer tablets which underwent
the friability test showed no delamination, which indicates that with a careful
selection of the materials and production process parameters, the production of
multilayer tablets with advanced performance is possible.

70
5.5 Dissolution profiles of multilayer tablets
The dissolution profiles of multilayer tablets are shown in
Figure 24 – 27.
Figure 24. Dissolution profiles of the multilayer tablet CD20_ID20 with respective
gluing agents and stored at two different storage conditions
0
20
40
60
80
100
120
0 20 40 60 80 100 120 140
AP
I rel
ease
[%
]
Time [h]
CD20_PVPK90_ID20 (stored at RT)
Caffeine Ibuprofen
0
20
40
60
80
100
120
0 20 40 60 80 100 120 140
AP
I rel
ease
[%
]
Time [min]
D20_PVPK90_ID20 (stored at AC)
Caffeine Ibuprofen
0
20
40
60
80
100
120
0 20 40 60 80 100 120 140
AP
I rel
ease
[%
]
Time [min]
CD20_FishGelatin_ID20 (stored at RT)
Caffeine Ibuprofen
0
20
40
60
80
100
120
0 20 40 60 80 100 120 140
AP
I rel
ease
[%
]
Time [min]
CD20_FishGelatin_ID20 (stored at AC)
Caffeine Ibuprofen
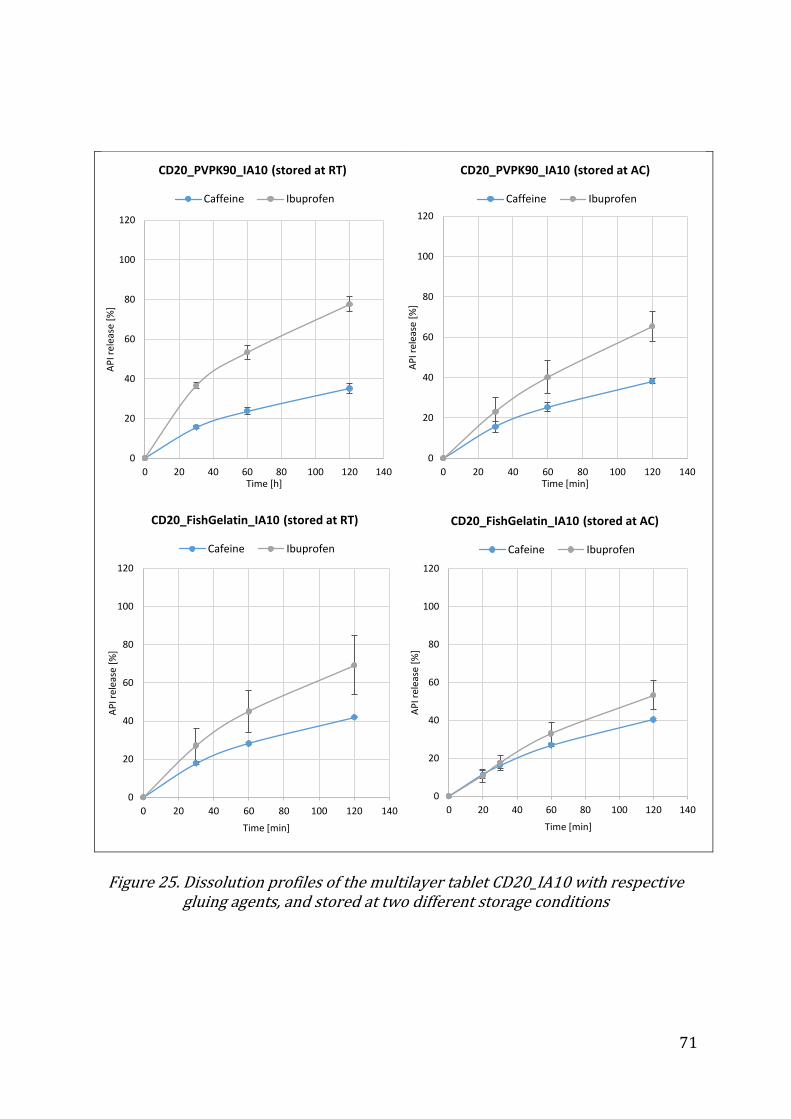
71
Figure 25. Dissolution profiles of the multilayer tablet CD20_IA10 with respective
gluing agents, and stored at two different storage conditions
0
20
40
60
80
100
120
0 20 40 60 80 100 120 140
AP
I rel
ease
[%
]
Time [h]
CD20_PVPK90_IA10 (stored at RT)
Caffeine Ibuprofen
0
20
40
60
80
100
120
0 20 40 60 80 100 120 140
AP
I rel
ease
[%
]
Time [min]
CD20_PVPK90_IA10 (stored at AC)
Caffeine Ibuprofen
0
20
40
60
80
100
120
0 20 40 60 80 100 120 140
AP
I rel
ease
[%
]
Time [min]
CD20_FishGelatin_IA10 (stored at RT)
Cafeine Ibuprofen
0
20
40
60
80
100
120
0 20 40 60 80 100 120 140
AP
I rel
ease
[%
]
Time [min]
CD20_FishGelatin_IA10 (stored at AC)
Cafeine Ibuprofen

72
Figure 26. Dissolution profiles of the multilayer tablet CA20_ID20 with respective
gluing agents, and stored at two different storage conditions
0
20
40
60
80
100
120
0 20 40 60 80 100 120 140
AP
I rel
ease
[%
]
Time [h]
CA20_PVPK90_ID20 (stored at RT)
Caffeine Ibuprofen
0
20
40
60
80
100
120
0 20 40 60 80 100 120 140
AP
I rel
ease
[%
]
Time [min]
CA20_PVPK90_ID20 (stored at AC)
Caffeine Ibuprofen
0
20
40
60
80
100
120
0 20 40 60 80 100 120 140
AP
I rel
ease
[%
]
Time [min]
CA20_FishGelatin_ID20 (stored at RT)
Caffeine Ibuprofen
0
20
40
60
80
100
120
0 20 40 60 80 100 120 140
AP
I rel
ease
[%
]
Time [min]
CA20_FishGelatin_ID20 (stored at AC)
Caffeine Ibuprofen
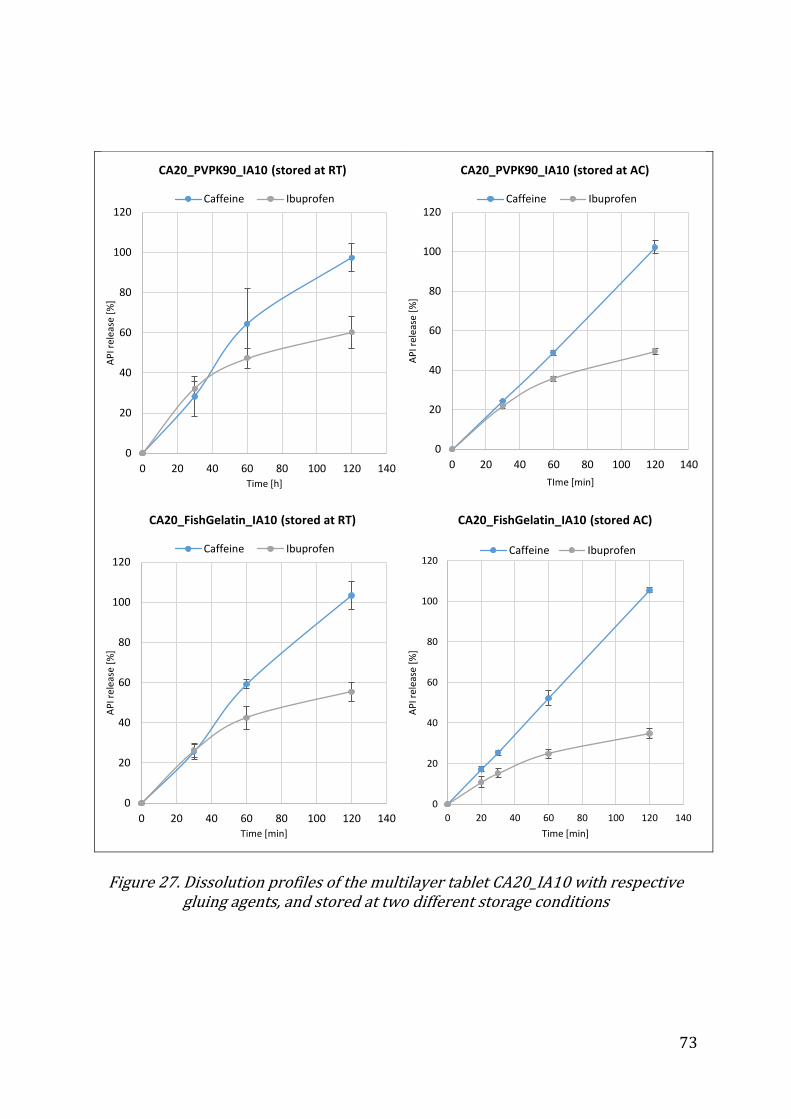
73
Figure 27. Dissolution profiles of the multilayer tablet CA20_IA10 with respective
gluing agents, and stored at two different storage conditions
0
20
40
60
80
100
120
0 20 40 60 80 100 120 140
AP
I rel
ease
[%
]
Time [h]
CA20_PVPK90_IA10 (stored at RT)
Caffeine Ibuprofen
0
20
40
60
80
100
120
0 20 40 60 80 100 120 140
AP
I rel
ease
[%
]
TIme [min]
CA20_PVPK90_IA10 (stored at AC)
Caffeine Ibuprofen
0
20
40
60
80
100
120
0 20 40 60 80 100 120 140
AP
I rel
ease
[%
]
Time [min]
CA20_FishGelatin_IA10 (stored at RT)
Caffeine Ibuprofen
0
20
40
60
80
100
120
0 20 40 60 80 100 120 140
AP
I rel
ease
[%
]
Time [min]
CA20_FishGelatin_IA10 (stored AC)
Caffeine Ibuprofen
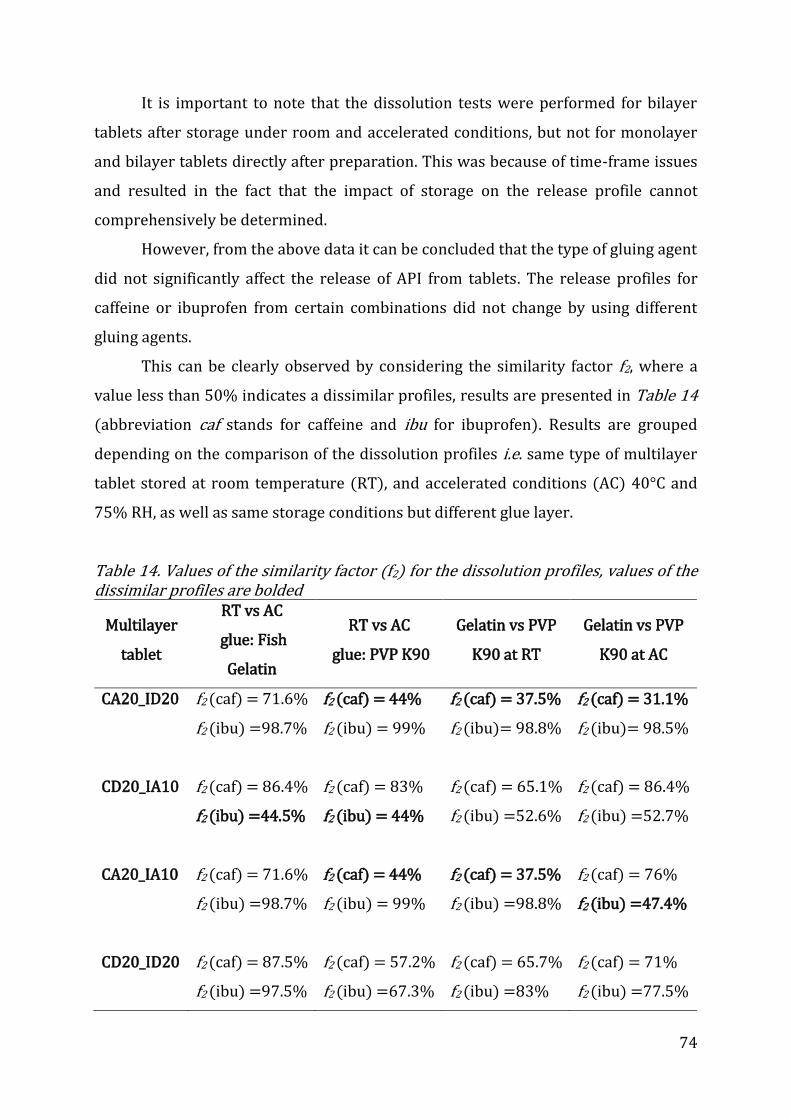
74
It is important to note that the dissolution tests were performed for bilayer
tablets after storage under room and accelerated conditions, but not for monolayer
and bilayer tablets directly after preparation. This was because of time-frame issues
and resulted in the fact that the impact of storage on the release profile cannot
comprehensively be determined.
However, from the above data it can be concluded that the type of gluing agent
did not significantly affect the release of API from tablets. The release profiles for
caffeine or ibuprofen from certain combinations did not change by using different
gluing agents.
This can be clearly observed by considering the similarity factor f2, where a
value less than 50% indicates a dissimilar profiles, results are presented in Table 14
(abbreviation caf stands for caffeine and ibu for ibuprofen). Results are grouped
depending on the comparison of the dissolution profiles i.e. same type of multilayer
tablet stored at room temperature (RT), and accelerated conditions (AC) 40°C and
75% RH, as well as same storage conditions but different glue layer.
Table 14. Values of the similarity factor (f2) for the dissolution profiles, values of the dissimilar profiles are bolded
Multilayer
tablet
RT vs AC
glue: Fish
Gelatin
RT vs AC
glue: PVP K90
Gelatin vs PVP
K90 at RT
Gelatin vs PVP
K90 at AC
CA20_ID20 f2 (caf) = 71.6%
f2 (ibu) =98.7%
f2 (caf) = 44%
f2 (ibu) = 99%
f2 (caf) = 37.5%
f2 (ibu)= 98.8%
f2 (caf) = 31.1%
f2 (ibu)= 98.5%
CD20_IA10 f2 (caf) = 86.4%
f2 (ibu) =44.5%
f2 (caf) = 83%
f2 (ibu) = 44%
f2 (caf) = 65.1%
f2 (ibu) =52.6%
f2 (caf) = 86.4%
f2 (ibu) =52.7%
CA20_IA10 f2 (caf) = 71.6%
f2 (ibu) =98.7%
f2 (caf) = 44%
f2 (ibu) = 99%
f2 (caf) = 37.5%
f2 (ibu) =98.8%
f2 (caf) = 76%
f2 (ibu) =47.4%
CD20_ID20
f2 (caf) = 87.5%
f2 (ibu) =97.5%
f2 (caf) = 57.2%
f2 (ibu) =67.3%
f2 (caf) = 65.7%
f2 (ibu) =83%
f2 (caf) = 71%
f2 (ibu) =77.5%

75
From the f2 results it can be concluded that neither the storage conditions nor
the type of the glue layer had any impact on the dissolution profiles. However, the
dissimilar profiles would rather be related to the off-limit values of the weight
uniformity test for IA10 and CA20 tablets, respectively. The weight uniformity results
for both tablets are shown in Table 15.
Table 15. Weight uniformity of CA20 and IA20 tablets, off-limit values are bolded
CA20 IA10
Tablet Weight [mg] Deviation [%] Weight [mg] Deviation [%]
1 0.1756 8.46 0.1524 0.18
2 0.1656 2.29 0.1539 1.17
3 0.1777 9.76 0.156 2.55
4 0.172 6.24 0.1541 1.30
5 0.1739 7.41 0.16 5.18
6 0.1682 3.89 0.1562 2.68
7 0.1701 5.07 0.1521 0.0098
8 0.1741 7.54 0.151 0.73
9 0.178 9.95 0.156 2.55
10 0.1689 4.33 0.1371 9.87
11 0.1744 7.72 0.1523 0.12
12 0.1646 1.67 0.1581 3.93
13 0.1694 4.63 0.1616 6.23
14 0.1675 3.46 0.119 21.76
15 0.175 8.09 0.1544 1.50
16 0.1678 3.65 0.1543 1.43
17 0.1769 9.27 0.1566 2.94
18 0.1765 9.02 0.147 3.36
19 0.1686 4.14 0.1564 2.81
20 0.172 6.24 0.1538 1.10
Mean 0.17184
0.1521
STD 0.00415
0.00929
RSD 2.41629
6.11293
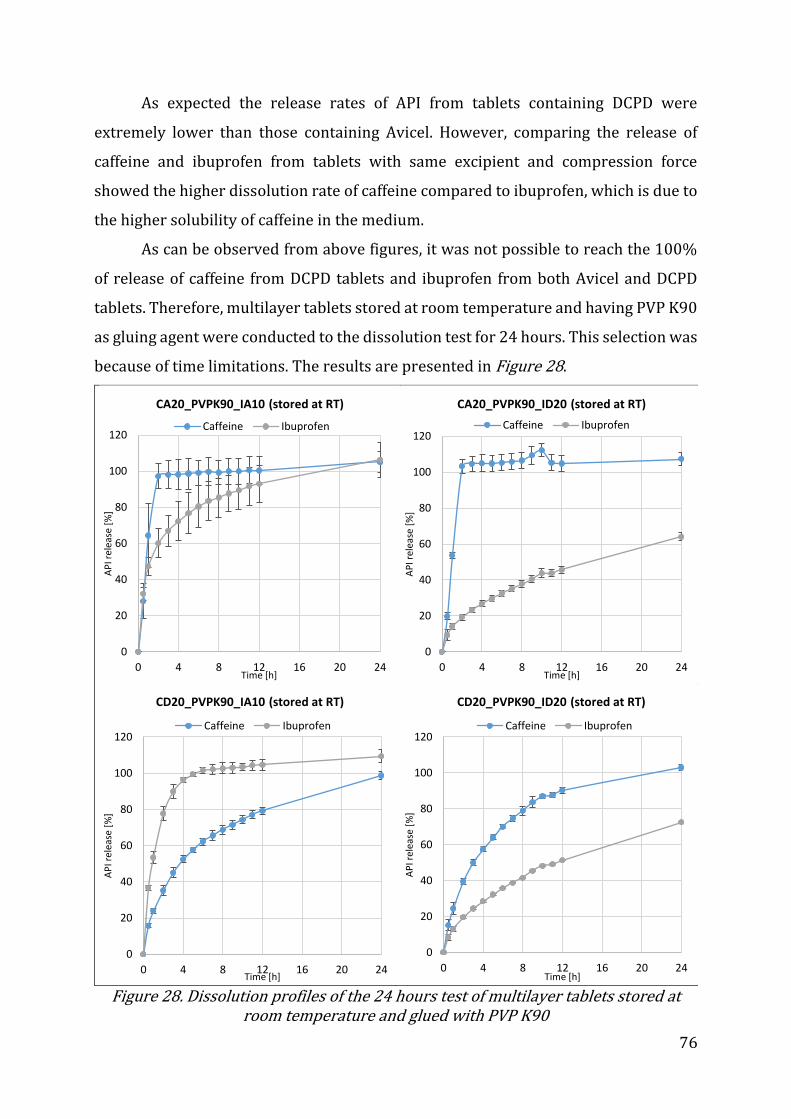
76
As expected the release rates of API from tablets containing DCPD were
extremely lower than those containing Avicel. However, comparing the release of
caffeine and ibuprofen from tablets with same excipient and compression force
showed the higher dissolution rate of caffeine compared to ibuprofen, which is due to
the higher solubility of caffeine in the medium.
As can be observed from above figures, it was not possible to reach the 100%
of release of caffeine from DCPD tablets and ibuprofen from both Avicel and DCPD
tablets. Therefore, multilayer tablets stored at room temperature and having PVP K90
as gluing agent were conducted to the dissolution test for 24 hours. This selection was
because of time limitations. The results are presented in Figure 28.
Figure 28. Dissolution profiles of the 24 hours test of multilayer tablets stored at
room temperature and glued with PVP K90
0
20
40
60
80
100
120
0 4 8 12 16 20 24
AP
I rel
ease
[%
]
Time [h]
CA20_PVPK90_IA10 (stored at RT)
Caffeine Ibuprofen
0
20
40
60
80
100
120
0 4 8 12 16 20 24
AP
I rel
ease
[%
]
Time [h]
CD20_PVPK90_IA10 (stored at RT)
Caffeine Ibuprofen
0
20
40
60
80
100
120
0 4 8 12 16 20 24
AP
I rel
ease
[%
]
Time [h]
CA20_PVPK90_ID20 (stored at RT)
Caffeine Ibuprofen
0
20
40
60
80
100
120
0 4 8 12 16 20 24
AP
I rel
ease
[%
]
Time [h]
CD20_PVPK90_ID20 (stored at RT)
Caffeine Ibuprofen
77
Investigation of the release profile of tablets for 24 h revealed that for all tablets
containing caffeine as API, the 100% release could be achieved 24 h. However, in case
of ibuprofen, the 100% of release could be achieved for tablets containing Avicel as
excipient but still not for tablets containing DCPD as excipients. This is on one hand
due to the better solubility of caffeine than ibuprofen in the dissolution medium, and
on the other hand because of differences in the physical properties of DCPD and Avicel.
The faster release of API from Avicel tablets is because of the easier disintegration of
tablets due to the higher swelling properties of Avicel, compared to DCPD. In contrary,
DCPD as an inorganic compound, provides a slower release kinetic due to its high
density. These observations are in agreement with other studies [79].
These behaviors offer the best condition for providing bilayer tablets with same
or different APIs but different release profiles using GPT. Tablets containing Avicel
could provide an immediate release profile of API and tablets containing DCPD could
provide a sustained release profile. In case of having same API in both layers, the
immediate release profiles will provide the loading dose, while the extended release
profile provides the maintenance dose. Of course the available formulations would
need improvements in order to reach of specifications for proper immediate and
extended released profiles.
78
6 Conclusions and Outlook
The feasibility of GPT was investigated in this work as a novel technology for the
manufacturing of multilayer tablets.
The deformation behavior of Avicel Ph 102 and DCPD and their blends with
caffeine or ibuprofen was investigated. It was concluded that Avicel Ph 102 shows a
plastic/elastic and DCPD brittle/fragmenting deformation behavior. Binary mixtures
of Avicel Ph 102 with caffeine anhydrous and with ibuprofen free acid resulted in
plastic/elastic deformation mechanism, same as the blend of DCPD and ibuprofen free
acid. Whereas, the blend of DCPD with caffeine anhydrous showed a
brittle/fragmenting deformation behavior.
Highest elastic recovery was observed for ibuprofen free acid and Avicel Ph 102
tablets, while for others elastic recovery was relatively low. Tablets containing Avicel
Ph 102 showed more than two fold higher tensile strength than the ones with DCPD,
except the ones with ibuprofen free acid which lowered the strength to the level of the
tablets containing DCPD. These phenomena were attributed to the elasticity of
ibuprofen free acid.
Tablets containing ibuprofen free acid showed higher surface roughness than
the ones with caffeine anhydrous, independently of the binder.
Elastic recovery was the physical property that affected the most the
delamination of the multilayer tablets. A mismatch of elastic recovery, coupled with
the mismatch in deformation behavior of the single layer tablets, exhibited the highest
amount of separations after the friability test of multilayer tablets.
Fish gelatin appeared to have better adhesiveness than the higher viscous PVP
K90, multilayer tablets glued with the latter separated more. The lower viscous films
show better adhesion to the tablet’s surface due to their better penetration and
distribution into the pores and microstructures on the surface.
GPT is a novel technology for producing personalized medicine and has a high
potential for the future developments. Firstly, the problems encountered in the
conventional way of producing bilayer/multilayer tables can be avoided, and secondly
in the near future it can be implemented in the life cycle management of many fixed
dose combination products. It offers the flexible and individual combinations of APIs
79
and doses, especially for the development of new therapeutic strategies for treatment
of HIV/AIDS and multidrug resistance infections, where such individual and flexible
combinations are necessary. Moreover, a real-time production on miniaturized
equipment can be achieved in the field of translational pharmaceutics, immediately
prior to clinical testing, creating the opportunity to modify dose and formulation
compositions in response to emerging clinical data.
However, for manufacturing of robust multilayer tablets via GPT, a mechanistic
understanding on the physical property of materials is necessary to provide proper
matching of physical properties of tablet layers and gluing agents, offering optimal
interfacial strength between layers.
More investigations are necessary on the impact of elastic recovery on tablet’s
physical properties and adherence capacity, and on the impact of surface tension and
tack behavior of gluing agents on adhering properties.
80
Bibliography
[1] S. Aggarwal, N. Syan, and P. Mathur, “Bi-Layer Tablet Technology - Opening New
Ways in Drug Delivery Systems : An Overview,” Int. J. Reasearch Pharm. Biomed.
Sci., vol. 4, no. 1, pp. 8–16, 2013.
[2] J. Swarbrik, Encyclopedia of Pharmaceutical Technology, Third Edition, Vol.2. 2007.
[3] R. J. Mrsny, “Oral drug delivery research in Europe,” J. Control. Release, vol. 161, no.
2, pp. 247–253, 2012.
[4] J. E. Hall and A. C. Guyton, Guyton and Hall Textbook of Medical Physiology, 12th ed.
2011.
[5] L. X. Yu et al., “Biopharmaceutics classification system: the scientific basis for
biowaver extensions,” Pharm. Res., vol. 19, no. 7, pp. 921–925, 2002.
[6] “United States Pharmacopeial Convention,” 2013. [Online]. Available:
http://www.usp.org/.
[7] “Solid dosage forms: Tablets.” [Online]. Available:
http://kinam.com/Lectures/363/4. Tablets Text.pdf.
[8] M. E. Aulton, Pharmaceutics: The science of dosage form design, 2nd ed. 2001.
[9] L. L. Augsburger and S. W. Hoag, Pharmaceutical Dosage Forms: Tablets - Vol2.
Rational Design and Formulation, vol. 2. 2008.
[10] G. Alderborn and C. Nystrom, Pharmaceutical Powder Compaction Technology.
1995.
[11] M. Çelik, Pharmaceutical Powder Compaction Technology, Second Edition. 2011.
[12] Z. Enrique, “Digital Data Acquisition System.” [Online]. Available:
https://en.wikipedia.org/wiki/Data_acquisition.
[13] M. Celik and K. Marshall, “Use of compaction simulator system in tabletting
research,” Drug Dev. Ind. Parmacy, vol. 15(5), pp. 759–800, 1989.
[14] “What is Hooke’s Law?,” 2017. [Online]. Available:
https://www.khanacademy.org/science/physics/work-and-energy/hookes-
law/a/what-is-hookes-law.
[15] W. T. Morehead, “VISCOELASTIC BEHAVIOR OF PHARMACEUTICAL MATERIALS
DURING COMPACTION,” vol. 8, pp. 659–675, 1992.
[16] H. Schlichting, Boundary layer theory. 1960.
[17] B. Harthong, J. F. Jérier, P. Dorémus, D. Imbault, and F. V. Donzé, “Modeling of high-
81
density compaction of granular materials by the Discrete Element Method,” Int. J.
Solids Struct., vol. 46, no. 18–19, pp. 3357–3364, 2009.
[18] H. Rumpf, “Basic principles and methods of granulation I. II.,” Chem. Eng. Tech,
1958.
[19] C. E. Capes, J. C. Williams, and T. Allen, “Particle Size Enlargement,” p. 205, 1980.
[20] P. York and N. Pilpel, “The effect of temperature on the mechanical properties of
powders part 2. Presence of liquid films,” Mater. Sci. Eng., vol. 12, no. 5–6, pp. 295–
304, 1973.
[21] M. I. Fedorchenko and V. V. Skorokhod, “Theory and practice of sintering,” Acad. Sci.
UkrSSR Press, pp. 790–805, 1967.
[22] S. Palzer, “The effect of glass transition on the desired and undesired agglomeration
of amorphous food powders,” Chem. Eng. Sci., vol. 60, no. 14, pp. 3959–3968, 2005.
[23] “Mechanisms of powder interaction,” 2017. [Online]. Available:
http://www.freemantech.co.uk/_powders/powder-flowability-mechanisms-of-
particle-interaction.
[24] I. Klevan, “Compression Analysis of Pharmaceutical Powders: Assessment of
Mechanical Properties and Tablet Manufacturability Prediction,” 2011.
[25] L. L. Augsburger and W. S. Hoag, Pharmaceutical Dosage Forms: Tablets - Vol 1. Unit
Operations and Mechanical Properties, Third. 2008.
[26] F. Michaut, V. Busignies, C. Fouquereau, B. Huet De Barochez, B. Leclerc, and P.
Tchoreloff, “Evaluation of a rotary tablet press simulator as a tool for the
characterization of compaction properties of pharmaceutical products,” J. Pharm.
Sci., vol. 99, no. 6, pp. 2874–2885, 2010.
[27] J. M. Sonnergaard, “A critical evaluation of the Heckel equation,” Int. J. Pharm., vol.
193, no. 1, pp. 63–71, 1999.
[28] S. S. Kale, V. S. Saste, P. L. Ughade, and D. T. Baviskar, “Bilayer tablet,” Int. J. Pharm.
Sci. Rev. Res., vol. 9, no. 1, pp. 25–30, 2011.
[29] S. Abdul and S. S. Poddar, “A flexible technology for modified release of drugs: Multi
layered tablets,” J. Control. Release, vol. 97, no. 3, pp. 393–405, 2004.
[30] P. R. Shinde, “An overview on bilayered tablet technology,” Int. J. Pharma Bio Sci.,
vol. 5, no. 2, pp. 1077–1086, 2014.
[31] L. Benkerrour, A. Olivier Galley, Pornichet Francoise Quinet, Savenay Admassu, and
T. Orvault Peter, “Multilayered tablet containing Pravastatin and Aspirin and
82
method,” US 2004/0115265 A1, 2004.
[32] A. García-Arieta, “Interactions between active pharmaceutical ingredients and
excipients affecting bioavailability: Impact on bioequivalence,” Eur. J. Pharm. Sci.,
vol. 65, pp. 89–97, 2014.
[33] B. Braun Melsungen AG, Drug Incompatibility Risk Prevention in Infusion Therapy.
2011, pp. 1–16.
[34] N. Fathima, T. Mamatha, H. K. Qureshi, N. Anitha, and J. Venkateswara Rao, “Drug-
excipient interaction and its importance in dosage form development,” J. Appl.
Pharm. Sci., vol. 1, no. 6, pp. 66–71, 2011.
[35] A. Abebe, I. Akseli, O. Sprockel, N. Kottala, and A. M. Cuitiño, “Review of bilayer tablet
technology,” Int. J. Pharm., vol. 461, no. 1–2, pp. 549–558, 2014.
[36] Y. Qiu, N. Chidambaram, and K. Flood, “Design and evaluation of layered diffusional
matrices for zero-order sustained-release,” J. Control. Release, vol. 51, no. 2–3, pp.
123–130, 1998.
[37] U. Conte and L. Maggi, “A flexible technology for the linear, pulsatile and delayed
release of drugs, allowing for easy accommodation of difficult in vitro targets,” J.
Control. Release, vol. 64, no. 1–3, pp. 263–268, 2000.
[38] U. Conte, L. Maggi, M. L. Torre, P. Giunchedi, and A. La Manna, “Press-coated tablets
for time-programmed release of drugs,” Biomaterials, vol. 14, no. 13, pp. 1017–
1023, 1993.
[39] A. Streubel, J. Siepmann, N. A. Peppas, and R. Bodmeier, “Bimodal drug release
achieved with multi-layer matrix tablets: Transport mechanisms and device
design,” J. Control. Release, vol. 69, no. 3, pp. 455–468, 2000.
[40] O. Koo, “Manufacturing Process Considerations for Fixed-Dose Combination Drug
Products,” American Pharmaceutical Review, 2015. [Online]. Available:
http://www.americanpharmaceuticalreview.com/Featured-Articles/117118-
Manufacturing-Process-Considerations-for-Fixed-Dose-Combination-Drug-
Products/.
[41] Korsch AG, “XL 400 FT,” 2015. [Online]. Available:
http://www.korsch.com/fileadmin/editor/downloads/KORSCH_XL400FT_en_we
b_01.pdf. [Accessed: 13-Mar-2017].
[42] S. R. Vaithiyalingam and V. A. Sayeed, “Critical factors in manufacturing multi-layer
tablets-Assessing material attributes, in-process controls, manufacturing process
83
and product performance,” Int. J. Pharm., vol. 398, no. 1–2, pp. 9–13, 2010.
[43] I. Akseli, A. Abebe, O. Sprockel, and A. M. Cuitiño, “Mechanistic characterization of
bilayer tablet formulations,” Powder Technol., vol. 236, pp. 30–36, 2013.
[44] V. Busignies, V. Mazel, H. Diarra, and P. Tchoreloff, “Role of the elasticity of
pharmaceutical materials on the interfacial mechanical strength of bilayer tablets,”
Int. J. Pharm., vol. 457, no. 1, pp. 260–267, 2013.
[45] S. S. Behzadi, S. Sandra, L. Josef, S. Sacher, and J. Khinast, “Gluing Pills : A Novel
Approach for Processing of Multi-Layer Tablets,” in 2015 AlChE Annual Meeting,
2015.
[46] S. S. Behzadi, S. Sacher, J. Lingiitz, and J. G. Khinast, “Gluing Pills Technology for the
Production of Multi-Layer Tablets,” Pharm. Technol., vol. 41, no. 4, pp. 50–56, 2017.
[47] BASF, “Caffeine Anhydrous Ph.Eur., USP, JP,” 2010.
[48] S. Diamond, T. K. Balm, and F. G. Freitag, “Ibuprofen plus caffeine in the treatment
of tension-type headache,” Clin. Pharmacol. Ther., vol. 68, no. 3, pp. 312–319, 2000.
[49] OECD/SIDS, “Cafeine CAS 58-08-2,” 2002. [Online]. Available:
http://www.inchem.org/documents/sids/sids/CAFEINE.pdf. [Accessed: 22-Mar-
2017].
[50] “Dicalcium Phosphate Dihydrate, Unmilled,” 2015. [Online]. Available:
https://www.innophos.com/__sitedocs/applications_functionality/di-tab-usp-
pds.pdf.
[51] D. M. Koller, G. Hannesschläger, M. Leitner, and J. G. Khinast, “Non-destructive
analysis of tablet coatings with optical coherence tomography,” Eur. J. Pharm. Sci.,
vol. 44, no. 1–2, pp. 142–148, 2011.
[52] G. Guan, M. Hirsch, W. P. Syam, R. K. Leach, Z. Huang, and A. T. Clare, “Loose powder
detection and surface characterization in selective laser sintering via optical
coherence tomography,” Proc. R. Soc. A Math. Phys. Eng. Sci., vol. 472, no. 2191,
2016.
[53] J. M. . Mauritz, R. S. Morrisby, R. S. Hutton, C. H. Legge, and C. F. Kaminski, “Imaging
Pharmaceutical Tablets with Optical Coherence Tomography,” J. Pharm. Investig.,
vol. 99, no. 1, pp. 385–391, 2010.
[54] D. Markl, G. Hannesschläger, A. Buchsbaum, S. Sacher, J. G. Khinast, and M. Leitner,
“In-line quality control of moving objects by means of spectral-domain OCT,” Opt.
Lasers Eng., vol. 59, pp. 1–10, 2014.
84
[55] D. Necas and K. Petr, “Statistical Analysis.” [Online]. Available:
http://gwyddion.net/documentation/user-guide-en/statistical-analysis.html.
[Accessed: 23-Mar-2017].
[56] D. Whitehouse, Surfaces and their Measurement. Hermes Penton Ltd, 2002.
[57] FDA, “Guidance for Industry Dissolution Testing of Immediate Release Solid Oral
Dosage Forms,” 1997.
[58] Y. Zhang, Y. Law, and S. Chakrabarti, “Physical properties and compact analysis of
commonly used direct compression binders.,” AAPS PharmSciTech, vol. 4, no. 4, p.
E62, 2003.
[59] A. Muñoz-Ruiz, T. Payán Villar, N. Muñoz Muõz, M. C. Monedero Perales, and M. R.
Jiménez-Castellanos, “Analysis of the physical characterization and the tabletability
of calcium phosphate-based materials,” Int. J. Pharm., vol. 110, no. 1, pp. 37–45,
1994.
[60] E. Doelker, “COMPARATIVE COMPACTION PROPERTIES OF VARIOUS
MICROCRYSTALLINE CELLULOSE TYPES AND GENERIC PRODUCTS,” vol. 19, pp.
2399–2471, 1993.
[61] F. Mahmoodi, I. Klevan, J. Nordström, G. Alderborn, and G. Frenning, “A comparison
between two powder compaction parameters of plasticity; The effective medium A
parameter and The Heckel 1/K parameter,” Int. J. Pharm., vol. 453, no. 2, pp. 295–
299, 2013.
[62] M. Celik, “OVERVIEW OF COMPACTION DATA ANALYSIS TECHNIQUES,” Drug Dev.
Ind. Parmacy, pp. 767–810, 1992.
[63] C. Nyström, G. Alderborn, and M. Duberg, “Bonding surface area and bonding
mechanism-two important factors for the understanding of powder
compactability,” Drug Dev. Ind. Pharm., vol. 19, no. 17–18, pp. 2143–2196, 1993.
[64] N. Rasenack and B. W. Müller, “Crystal habit and tableting behavior,” Int. J. Pharm.,
vol. 244, no. 1–2, pp. 45–57, 2002.
[65] P. Di Martino, M. Beccerica, E. Joiris, G. F. Palmieri, A. Gayot, and S. Martelli,
“Influence of crystal habit on the compression and densification mechanism of
ibuprofen,” J. Cryst. Growth, vol. 243, no. 2, pp. 345–355, 2002.
[66] S. Hubert et al., “Process induced transformations during tablet manufacturing:
Phase transition analysis of caffeine using DSC and low frequency micro-Raman
spectroscopy,” Int. J. Pharm., vol. 420, no. 1, pp. 76–83, 2011.

85
[67] H. Leuenberger and R. Leu, “Formation of a tablet: A site and bond percolation
phenomenon,” J. Pharm. Sci., vol. 81, no. 10, pp. 976–982, 1992.
[68] J. Ilkka and P. Paronen, “Prediction of the compression behaviour of powder
mixtures by the Heckel equation,” Int. J. Pharm., vol. 94, no. 1–3, pp. 181–187, 1993.
[69] N. Kottala, A. Abebe, O. Sprockel, I. Akseli, F. Nikfar, and A. M. Cuitiño, “Influence of
compaction properties and interfacial topography on the performance of bilayer
tablets,” Int. J. Pharm., vol. 436, no. 1–2, pp. 171–178, 2012.
[70] P. G. Karehill, M. Glazer, and C. Nyström, “Studies on direct compression of tablets.
XXIII. The importance of surface roughness for the compactability of some directly
compressible materials with different bonding and volume reduction properties,”
Int. J. Pharm., vol. 64, no. 1, pp. 35–43, 1990.
[71] P. Seitavuopio, J. Heinamaki, J. Rantanen, and J. Yliruusi, “Monitoring tablet surface
roughness during the film coating process,” AAPS PharmSciTech, vol. 7, no. 2, pp.
E1–E6, 2006.
[72] E. Macchi and L. A. Felton, “Influence of relative humidity during coating on polymer
deposition and film formation,” Int. J. Pharm., vol. 510, pp. 116–124, 2016.
[73] R. C. ROWE, “The measurement of the adhesion of film coatings to tablet surfaces:
the effect of tablet porosity, surface roughness and film thickness,” J. Pharm.
Pharmacol., vol. 30, no. 1, pp. 343–346, 1978.
[74] T. Monteyne, J. Vancoillie, J. P. Remon, C. Vervaet, and T. De Beer, “Continuous melt
granulation: Influence of process and formulation parameters upon granule and
tablet properties,” Eur. J. Pharm. Biopharm., vol. 107, no. August, pp. 249–262,
2016.
[75] V.-M. Lehtola, J. T. Heinämäki, P. Nikupaavo, and J. K. Yliruusi, “Effect of some
excipjents and compression pressure on the adhesion of aqueous-based
hydroxypropyl methylcellulose film coatings to tablet surface,” Drug Dev. Ind.
Pharm., vol. 21, no. 12, 1995.
[76] I. Akseli, D. Dey, and C. Cetinkaya, “Mechanical Property Characterization of
Bilayered Tablets using Nondestructive Air-Coupled Acoustics,” AAPS
PharmSciTech, vol. 11, no. 1, pp. 90–102, 2010.
[77] L. A. Felton and J. W. McGinity, “Adhesion of polymeric films to pharmaceutical
solids,” Eur. J. Pharm. Biopharm., vol. 47, no. 1, pp. 3–14, 1999.
[78] F. Badii and N. K. Howell, “Fish gelatin: Structure, gelling properties and interaction
86
with egg albumen proteins,” Food Hydrocoll., vol. 20, no. 5, pp. 630–640, 2006.
[79] M. H. Amaral, J. M. S. Lobo, and D. C. Ferreira, “Effect of hydroxypropyl
methylcellulose and hydrogenated castor oil on naproxen release from sustained-
release tablets,” AAPS PharmSciTech, vol. 2, no. 2, pp. 14–21, 2001.
List of figures
Figure 1. Digital Data Acquisition System; adapted from Ref. [12] ..................................... 18
Figure 2. Bonding mechanisms (a) solid bridge formation, (b) interparticle attraction
forces, (c) mechanical interlocking; adapted from Ref. [22], [23]. ...................................... 24
Figure 3. Three main types of Heckel plots (a), three regions of a Heckel profile (b);
adapted from Ref. [24], [26] ................................................................................................................... 27
Figure 4. Chemical structure of Ibuprofen ...................................................................................... 35
Figure 5. Chemical structure of Caffeine .......................................................................................... 36
Figure 6. Chemical structure of cellulose unit ............................................................................... 36
Figure 7. Chemical structure of Dibasic Calcium Phosphate Dihydrate ............................ 37
Figure 8. Schematic representation of the operation of the Gluing Pills machine ....... 44
Figure 9. Schematic depiction of the OCT system; adapted from Ref. [54] ...................... 46
Figure 10. Evaluation of the roughness parameters: 3D model of the surface (a); 2D
greyscale picture of the 3D model (b). .............................................................................................. 48
Figure 11. Heckel’s plots of excipients/binders ........................................................................... 53
Figure 12. Heckel’s plots of DCPD mixture with respective model APIs .......................... 55
Figure 13. Heckel’s plots of Avicel mixture with respective model APIs .......................... 55
Figure 14. Tensile strength of single layer tablets containing Avicel, compacted in 10
and 20 kN ........................................................................................................................................................ 57
Figure 15. Tensile strenght of single layer tablets containing DCPD, compacted in 10
and 20 kN ........................................................................................................................................................ 58
Figure 16. Elastic recovery of single layer tablets compressed at 300 MPa compression
pressure, data from the tablets prepared for the compression analysis .......................... 58
Figure 17. Roughness of single layer tablets containing Avicel and API, without and
with applied respective glue layer at time zero ............................................................................ 60
87
Figure 18. Roughness of single layer tablets containing DCPD and API, without and
with applied respective glue layer at time zero ............................................................................ 61
Figure 19. Roughness parameter Ra vs Porosity for different formulations .................. 63
Figure 20. Ratio of Ra values after and before storage, tablets containing Avicel and no
glue layer ......................................................................................................................................................... 63
Figure 21. Ratio of Ra values after and before storage, tablets containing DCPD and no
glue layer ......................................................................................................................................................... 64
Figure 22. Dynamic viscosity (µ) of polymeric solutions in a 20 – 80 °C temperature
range ................................................................................................................................................................. 65
Figure 23. Effect of different factors on the amount of separated multilayer tablets.
Abbreviations: ER = elastic recovery, CF = compression force, DB = deformation
behaiviour, TS = tensile strength. The matching or mismatching of these properties
between two combined layers is shown as “+” or “-“, respectively .................................... 68
Figure 24. Dissolution profiles of the multilayer tablet CD20_ID20 with respective
gluing agents and stored at two different storage conditions ............................................... 70
Figure 25. Dissolution profiles of the multilayer tablet CD20_IA10 with respective
gluing agents, and stored at two different storage conditions .............................................. 71
Figure 26. Dissolution profiles of the multilayer tablet CA20_ID20 with respective
gluing agents, and stored at two different storage conditions .............................................. 72
Figure 27. Dissolution profiles of the multilayer tablet CA20_IA10 with respective
gluing agents, and stored at two different storage conditions .............................................. 73
Figure 28. Dissolution profiles of the 24 hours test of multilayer tablets stored at room
temperature and glued with PVP K90 ............................................................................................... 76
88
List of tables
Table 1. Overview of the anatomical and physiological characteristics of the GIT ...... 12
Table 2. Types of tablets classed by their application ............................................................... 14
Table 3. Overview of the (optional) required unit operations for producing tablets 15
Table 4. Advantages and disadvantages of the mechanical rotary cam compaction
simulator ......................................................................................................................................................... 19
Table 5. A few physicochemical properties of Ibuprofen ......................................................... 35
Table 6. A few physicochemical properties of Caffeine ............................................................. 36
Table 7. A few physicochemical properties of Avicel ................................................................. 37
Table 8. Physicochemical properties of Dibasic Calcium Phosphate Dihydrate ........... 37
Table 9. Formulation recipes for each tablet layer, and the blend preparation
procedure ....................................................................................................................................................... 39
Table 10. Formulation recipes of blends prepared for compression analysis ............... 41
Table 11. Pressure yield values (Py) for pure excipients and formulations prepared for
compression analysis ................................................................................................................................ 53
Table 12. Bilayer tablets without delamination or one delamination after friability test
measured at T0, and storage under accelerated condition (AC) and room condition
(RC). Abbreviations: ER = elastic recovery, CF = compression force, DB = deformation
behaiviour, TS = tensile strength. The matching or mismatching of these properties
between two combined layers is shown as “+” or “-“, respectively. ................................... 66
Table 13. Bilayer tablets with more than one delaminated bilayer tablet after friability
test, tested at T0, and storage under accelerated condition (AC) and room condition
(RC). Abbreviations: ER = elastic recovery, CF = compression force, DB = deformation
behaiviour, TS = tensile strength. The matching or mismatching of these properties
between two combined layers is shown as “+” or “-“, respectively .................................... 67
Table 14. Values of the similarity factor (f2) for the dissolution profiles, values of the
dissimilar profiles are bolded ............................................................................................................... 74
Table 15. Weight uniformity of CA20 and IA20 tablets, off-limit values are bolded ... 75
89
List of abbreviations
FDC
API
GIT
BSC
USP
DEM
FEM
HIV
AIDS
WHO
EMA
CIP
RCPE
DCPD
Avicel
Caffeine
Ibuprofen
CA
CD
IA
ID
CA'
CD'
IA'
ID'
rpm
Fixed Dose Combination
Active Pharmaceutical Ingredient
Gastrointestinal tract
Biopharmaceutical Classification System
United States Pharmacopeia
Discrete Element Method
Finite Element Method
Human Immunodeficiency Virus
Acquired Immune Deficiency Syndrome
World Health Organization
European Medical Agency
Clean in Place
Research Center Pharmaceutical Engineering
Dibasic Calcium Phosphate Dihydrate
Microcrystaline cellulose – Avicel Ph 102
Caffeine anhydrous
Ibuprofen free acid
Tablets containing Caffeine anhydrous and Avicel PH 102
Tablets containing Caffeine anhydrous and DCPD
Tablets containing Ibuprofen free acid and Avicel PH 102
Tablets containing Ibuprofen free acid and DCPD
Powder mixture of caffeine with Avicel prepared for compression
analysis
Powder mixture of caffeine with DCPD prepared for compression
analysis
Powder mixture of ibuprofen with Avicel prepared for compression
analysis
Powder mixture of ibuprofen with DCPD prepared for compression
analysis
Rotations per minute
90
ER
NIR
Ph.Eur
HPLC
UV-Vis
Py
SD
DB
TS
CF
ibu
caf
Elastic recovery
Near Infrared Spectroscopy
European Pharmacopeia
High Pressure Liquid Chromatography
Ultraviolet – Visible Spectroscopy
Pressure yield
Standard deviation
Deformation behavior
Tensile strength
Compaction force
Ibuprofen
Caffeine