Production of microfibrillated cellulose by LC-refining
87
Erik Sjöström
Transcript of Production of microfibrillated cellulose by LC-refining

Erik Sjöström
Erik Sjöström
Production of microfibrillated cellulose by
LC-refining
Master of Science Thesis
By
Erik Sjöström
Supervisor: Professor Pedro Fardim
Advisor: Jarkko Kutvonen
Guidance: Jan Gustafsson
Laboratory of Fibre and Cellulose Technology
2018

Erik Sjöström
i
PREFACE
This Master of Science Thesis was done in cooperation with Veikko Sajaniemi from Aalto
University and his MSc thesis. Sajaniemi has great expertise on this subject and discussion and
sharing of sources with him helped me in writing this thesis. Utmost thanks to Veikko for being a
splendid working companion, I wish him the best for the future.
This Master of Science Thesis was written within a research project financed by Pöyry Oy. I would
like to offer my sincere gratitude to Pöyry Oy for this opportunity and to Jarkko Kutvonen for his
guidance during this work.
I also would like to offer my thanks to Valmet Oy for their participation in this thesis: our visit to
Inkeroinen and Kajaani provided valuable knowledge and experience. Thanks to Håkan Sjöström
for sharing his expertise in low consistency refining and the aid with the refining experiments.
Thanks to Markku Partanen for his help with the ProlabTM.
I would like to offer my gratitude to Tom Lundin from Chemigate for his aid and knowledge. His
doctoral thesis was especially useful in offering knowledge of low consistency refining.
Thanks to Eero Hiltunen and Jouni Paltakari from Aalto University for their guidance during
meetings.
I want to thank all personnel at the Laboratory of Fiber and Cellulose Technology for all the
support and fun times, especially Jan Gustafsson for all the help and guidance he provided during
this thesis in both writing and practical work.
Lastly, I would like to thank Matias Tuomisalo for still being my friend after all these years.
Erik Sjöström
ii
ABSTRACT
Sjöström Erik: Production of microfibrillated cellulose by LC-refining
Master of Science Thesis, Åbo Akademi University
The work was performed in co-operation with Veikko Sajaniemi at Aalto University under the
supervision of professor Pedro Fardim and the guidance of senior lecturer Jan Gustafsson at Åbo
Akademi University and MSc Jarkko Kutvonen at Pöyry Oy.
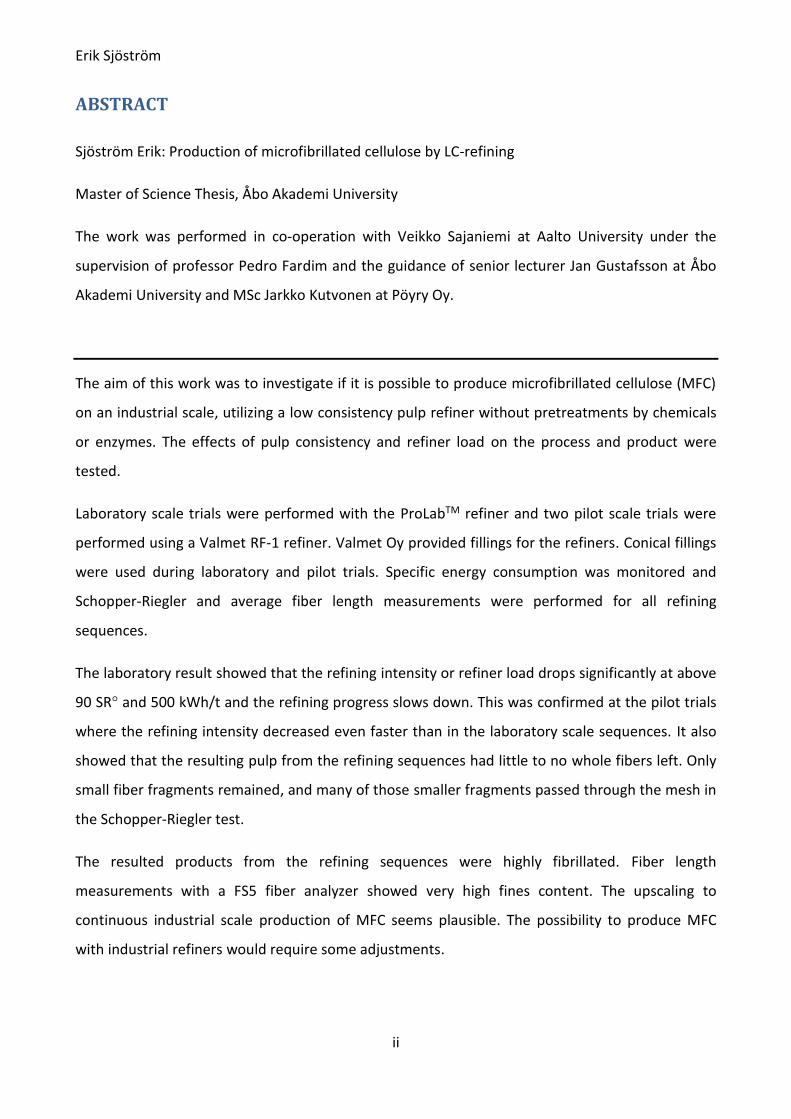
The aim of this work was to investigate if it is possible to produce microfibrillated cellulose (MFC)
on an industrial scale, utilizing a low consistency pulp refiner without pretreatments by chemicals
or enzymes. The effects of pulp consistency and refiner load on the process and product were
tested.
Laboratory scale trials were performed with the ProLabTM refiner and two pilot scale trials were
performed using a Valmet RF-1 refiner. Valmet Oy provided fillings for the refiners. Conical fillings
were used during laboratory and pilot trials. Specific energy consumption was monitored and
Schopper-Riegler and average fiber length measurements were performed for all refining
sequences.
The laboratory result showed that the refining intensity or refiner load drops significantly at above
90 SR° and 500 kWh/t and the refining progress slows down. This was confirmed at the pilot trials
where the refining intensity decreased even faster than in the laboratory scale sequences. It also
showed that the resulting pulp from the refining sequences had little to no whole fibers left. Only
small fiber fragments remained, and many of those smaller fragments passed through the mesh in
the Schopper-Riegler test.
The resulted products from the refining sequences were highly fibrillated. Fiber length
measurements with a FS5 fiber analyzer showed very high fines content. The upscaling to
continuous industrial scale production of MFC seems plausible. The possibility to produce MFC
with industrial refiners would require some adjustments.

Erik Sjöström
iii
REFERAT
Sjöström Erik: Production of microfibrillated cellulose by LC-refining
Diplomarbete, Åbo Akademi
Utfört i samarbete med Veikko Sajaniemi från Aalto-universitetet med övervakning av professor
Pedro Fardim och handledning av akademilektor Jan Gustafsson från Åbo Akademi och MSc Jarkko
Kutvonen från Pöyry Oy.
Målsättningen med diplomarbetet var att undersöka om det är möjligt att tillverka mikrofibrillerad
cellulosa genom lågkonsistensmalning utan förbehandlingar med kemikalier eller enzymer på en
industriell skala. Konsistensens och motorintensitetens påverkan på malningsprocessen och på
slutprodukten undersöktes.
Försök i laboratorieskala utfördes med ProLabTM medan försöken i pilotskala utfördes med en
Valmet RF-1-kvarn. Alla garnityr tillhandahölls av Valmet Oy. Endast koniska garnityr användes för
försöken. Specifik energiförbrukning, fiberlängd och Schopper-Riegler-metoden (SR°) användes för
att övervaka progressionen under malningsförsöken.
Laboratorieresultaten tydde på att när mälden närmade sig en malgrad på 90 SR° började
malningens intensitet minska signifikant. Resultaten bekräftades vid pilotförsöken där detta var
mycket mer tydligt än under ProLabTM-försöken. Den slutliga massan hade nästan inga hela fibrer
kvar utan bara små fiberfragment fanns kvar. Storleken på dessa fragment var så små att en del av
massan kunde gå igenom viran i Schopper-Riegler-testet.
Fiberanalyser med FS5-fiberanalysatorn gav mer pålitliga och mer synliga resultat och visade att
den malda massan hade en hög finmaterialhalt. Upskalning till en kontinuerlig industriell skala av
processen ser ut att vara möjlig med små ändringar i processutrustningen.
Erik Sjöström
iv
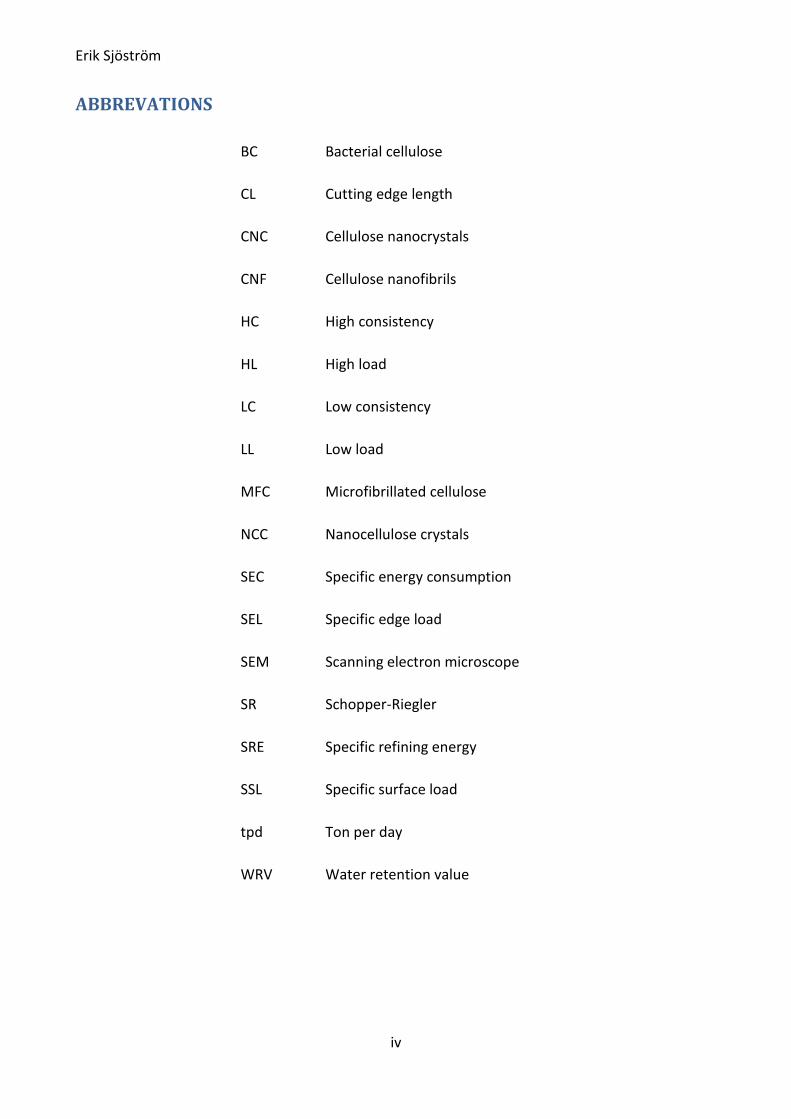
ABBREVATIONS
BC Bacterial cellulose
CL Cutting edge length
CNC Cellulose nanocrystals
CNF Cellulose nanofibrils
HC High consistency
HL High load
LC Low consistency
LL Low load
MFC Microfibrillated cellulose
NCC Nanocellulose crystals
SEC Specific energy consumption
SEL Specific edge load
SEM Scanning electron microscope
SR Schopper-Riegler
SRE Specific refining energy
SSL Specific surface load
tpd Ton per day
WRV Water retention value

Erik Sjöström
v
Contents
PREFACE ................................................................................................................................................ i
ABSTRACT ............................................................................................................................................. ii
REFERAT .............................................................................................................................................. iii
ABBREVATIONS ................................................................................................................................... iv
1 INTRODUCTION ............................................................................................................................. 1
2 Theory ........................................................................................................................................... 2
2.1 Chemical and morphological composition of wood fibers ................................................... 2
2.2 Nanoscale celluloses ............................................................................................................. 4
2.2.1 MFC/CNF ........................................................................................................................ 4
2.2.2 NCC/CNC ........................................................................................................................ 5
2.2.3 BC ................................................................................................................................... 6
3 MFC production ............................................................................................................................ 6
3.1 Homogenization and Microfluidization ................................................................................. 7
3.2 Grinding ................................................................................................................................. 8
4 LC-pulp refining ............................................................................................................................. 9
4.1 The refining ........................................................................................................................... 9
4.2 Refining effects .................................................................................................................... 11
4.3 Refining management ......................................................................................................... 12
4.3.1 Specific energy consumption SEC ................................................................................ 12
4.3.2 Specific edge load theory SEL ...................................................................................... 12
4.3.3 Specific surface load SSL .............................................................................................. 13
4.3.4 C-factor ......................................................................................................................... 15
4.4 Refining parameters ............................................................................................................ 16
4.4.1 Raw material ................................................................................................................ 16
4.4.2 Equipment .................................................................................................................... 17
Erik Sjöström
vi
4.4.3 Process variables .......................................................................................................... 18
5 Different industrial LC-refiners ................................................................................................... 20
5.1 Hollander Beater ................................................................................................................. 20
5.2 Conical Refiners ................................................................................................................... 20
5.2.1 Jordan Refiner (Jordan, Jylhä, Voith) ........................................................................... 21
5.2.2 Claflin refiner ................................................................................................................ 22
5.2.3 OptiFiner ConFlo® refiner ............................................................................................. 22
5.2.4 OptiFiner Pro ................................................................................................................ 23
5.2.5 Triconic Refiner ............................................................................................................ 24
5.3 Disk refiners ......................................................................................................................... 25
5.3.1 Single disk refiner ......................................................................................................... 25
5.3.2 Double disk refiner ....................................................................................................... 25
5.3.3 Cylindrical refiner ......................................................................................................... 26
6 Laboratory refiners ..................................................................................................................... 27
6.1 PFI mill ................................................................................................................................. 27
6.2 Voith laboratory refiner ...................................................................................................... 28
6.3 Masuko Sangyo Co. LTD ...................................................................................................... 28
6.4 Jokro Mill ............................................................................................................................. 29
7 Continuous industrial refiner system design .............................................................................. 30
7.1 Single refiner without recirculation .................................................................................... 30
7.2 Single refiner with recirculation .......................................................................................... 31
7.3 Multiple refiners in series.................................................................................................... 32
7.4 Parallel refiners ................................................................................................................... 32
7.5 Additional setups using screening ....................................................................................... 33
7.6 Industrial MFC production .................................................................................................. 33
8 Experimental ............................................................................................................................... 35
Erik Sjöström
vii
8.1.1 Raw material ................................................................................................................ 35
8.2 Methods .............................................................................................................................. 35
8.3 Refining ................................................................................................................................ 35
8.3.1 ProLabTM ....................................................................................................................... 36
8.3.2 Pulp preparation .......................................................................................................... 37
8.3.3 Fillings ........................................................................................................................... 38
8.3.4 Preliminary tests .......................................................................................................... 38
8.3.5 Tests with LAB-13 fillings ............................................................................................. 40
8.3.6 MFC production with SFD-fillings ................................................................................. 41
8.3.7 Pilot trials ..................................................................................................................... 41
8.4 Pulp and fiber ...................................................................................................................... 43
8.4.1 Schopper-Riegler .......................................................................................................... 43
8.4.2 Microscopy ................................................................................................................... 43
8.4.3 Kajaani Fiberlab ............................................................................................................ 44
8.4.4 Rheology measurements ............................................................................................. 44
8.4.5 Paper sheet tests .......................................................................................................... 44
8.4.6 Analyses at Valmet Automation in Kajaani, Finland .................................................... 45
9 Results and discussion ................................................................................................................ 47
9.1 Preliminary tests .................................................................................................................. 47
9.2 Refining tests with the LAB-13 fillings ................................................................................. 50
9.3 SFD fillings ........................................................................................................................... 51
9.4 Pilot trials ............................................................................................................................. 55
9.5 Comparing the results from the measurements in Kajaani ................................................ 58
9.6 Influence of measurements standards on fiber length value ............................................. 60
9.7 Rheology measurements ..................................................................................................... 61
9.8 Industrial MFC refining ........................................................................................................ 63

Erik Sjöström
viii
9.9 Hardness of filling material ................................................................................................. 64
10 Conclusions and recommendations for future research ........................................................ 66
11 Sammanfattning – Swedish summary .................................................................................... 68
12 References............................................................................................................................... 73
Erik Sjöström
1
1 INTRODUCTION
Pulp and paper industry makes a large percentage of the industry in Finland. Finland exported
paper and board for 6900 million euros and cellulose for ca. 2000 million euros in 2017 (Hakkanen,
2018).
Beating and refining of chemical pulp is a necessary and established step in papermaking, used to
improve paper qualities. Refining of chemical pulp is well studied regarding papermaking. The
object of this thesis, however, is to refine chemical pulp far further than that refined in
papermaking. The target in this study was to produce microfibrillated cellulose, or MFC, by
utilizing only mechanical forces and no enzymes or chemicals. The hypothesis was that the specific
energy consumption of MFC would be around 1000–1500 kWh/t. Mechanical forces would be
applied with ProLabTM laboratory refiner using conical fillings. From studying the refining process
and progression, the possibility of a theoretical designed continuous process was to be discussed.

Erik Sjöström
2
2 Theory
2.1 Chemical and morphological composition of wood fibers
Wood consists of wood cells (Figure 1), called fibers, inter-fiber bondage material (lignin) and
extractives such as waxes, oils. Cellulose and hemicellulose are the main components of the cell
wall. The cell wall consists of several layers (see Figure 1): middle lamella (M), primary wall (P),
outer layer of the secondary wall (S1), middle layer of the secondary wall (S2), inner layer of the
secondary wall (S3) and the warty layer (W).
Coniferous trees are called softwoods and deciduous trees are called hardwoods, which are the
two main types of trees. The concentration of the major components in softwoods and hardwoods
is shown in Figure 2.
The main difference in the fiber properties between the two groups is that hardwood fibers are
shorter compared to softwood fibers. The difference in fiber lengths makes each group preferable
as raw material for their own sort of paper, which is based on the sought-after quality. Mixing of
the two is possible and is done in many paper qualities to fulfill paper printing quality and strength
(Johanson, 2011). There are still other differences between hardwood and softwood species, but
also between trees of the same species and within the same tree.
Cellulose forms the “spine” of the structure of a wood fiber wall. Cellulose is located mostly in the
secondary cell wall S1–S3 (Figure 1). Physically, cellulose is a white material that is found in
crystalline or amorphous forms (Biermann, 1996). Although cellulose is the main material of wood,
there are other sources of cellulose sources, such as cotton, flax, hemp, rice and wheat straw,
algae, fungi or bacteria.
Chemically, cellulose is built up of repeating cellobiose units. Cellulose molecules are completely
linear and have a strong tendency to form intra-intermolecular hydrogen bonds (Sjöström, 1981).
Hydrogen bonding between cellulose molecules results in high strength of the fiber wall. Cellulose
fibers are built up by fibrils, which are built up by microfribrils (Sjöström, 1981).

Erik Sjöström
3
Figure 1: Simplified wood cell wall structure (Côte, 1967).
Figure 2: Average chemical composition of softwoods and hardwoods (Smook, 1992).
Erik Sjöström
4
2.2 Nanoscale celluloses
The use of nanoscale cellulose has been applied in paper, food, medical and hygiene industry. A
big interest in nanoscale cellulose is explained by the possibility of using it as reinforcement in
composite materials. The technical advantages of using nanoscale cellulose as filler in composites
is the abundance of the source material, renewability, good electrical and thermal properties and
low density compared to other nanomaterials used as reinforcements such as metal and glass. The
benefit of replacing synthetic fillers with nanocellulose is the positive environmental effects due to
the possibility to recycle and combust the material (Börjesson & Westman, 2015).
The three different types of nanoscale celluloses are microfibrillated cellulose (MFC),
nanocrystalline cellulose (NCC), bacterial nanocellulose (BC). All of these differ in dimension and
size as well as production methods. There is an ongoing standardization nomenclature process by
Tappi, USA, where MFC and NCC are also known as CNF and CNC respectively.
2.2.1 MFC/CNF
Microfibrillated cellulose (MFC), also known as Cellulose Nanofibrils (CNF), is a product of growing
interest again after year 2000 (Ankerfors, 2015). Both the terms MFC and CNF are used, but the
producer choses the name. Early research and development of production dates back to the 1980s
when Turbak et al. (1983) and Herrick (1983) at ITT Rayonier Inc. produced several patents on
production and usage of MFC (Turbak et al., 1983; Herrick, 1983). Due the expensive production
costs, however, the product was never commercialized. Today, there are multiple MFC and NFC
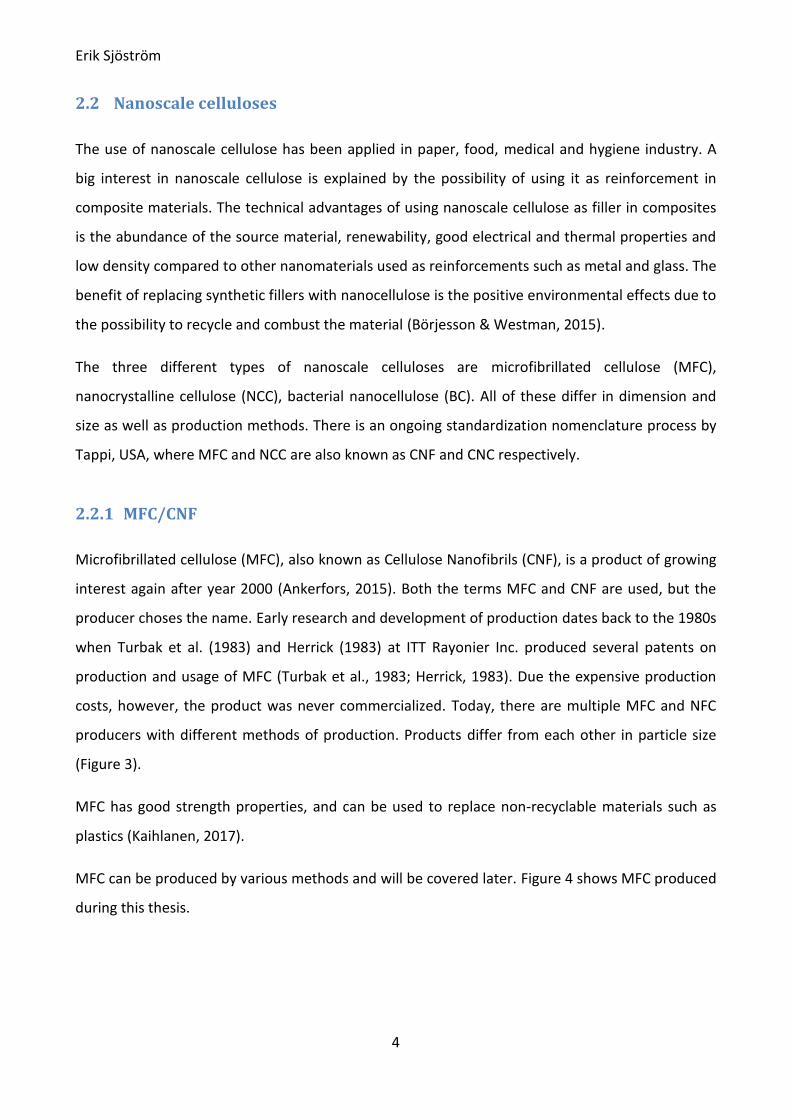
producers with different methods of production. Products differ from each other in particle size
(Figure 3).
MFC has good strength properties, and can be used to replace non-recyclable materials such as
plastics (Kaihlanen, 2017).
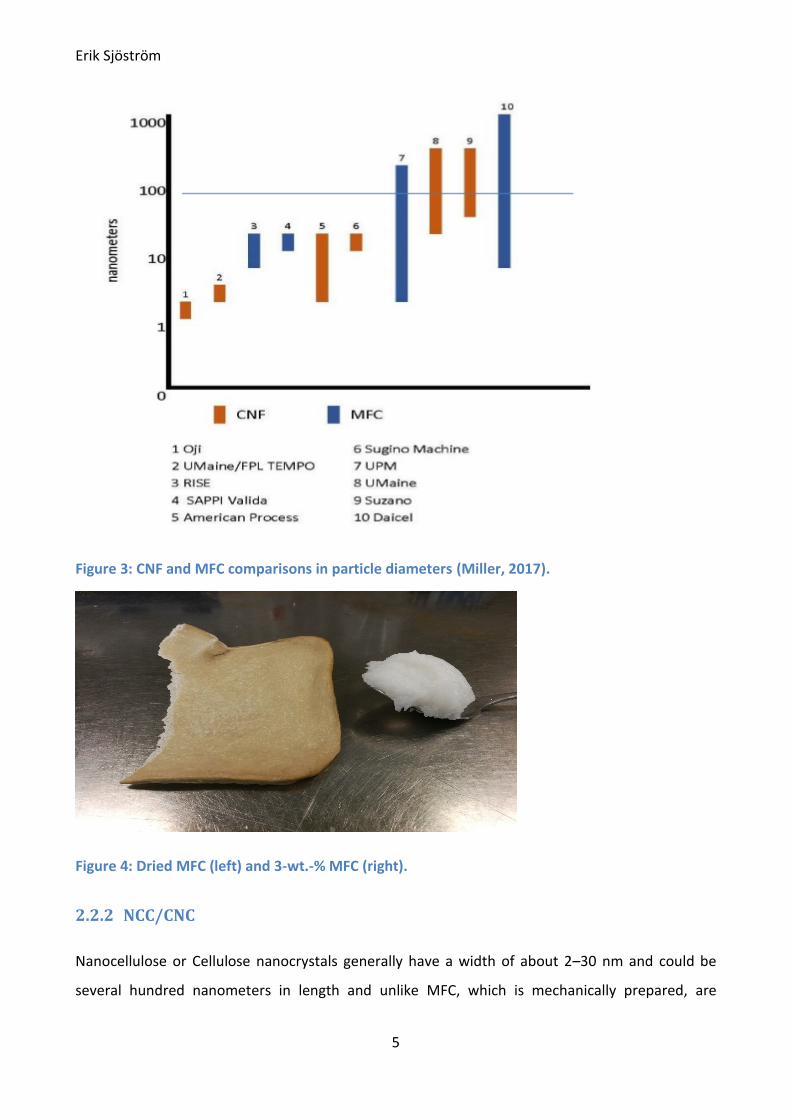
MFC can be produced by various methods and will be covered later. Figure 4 shows MFC produced
during this thesis.
Erik Sjöström
5
Figure 3: CNF and MFC comparisons in particle diameters (Miller, 2017).
Figure 4: Dried MFC (left) and 3-wt.-% MFC (right).
2.2.2 NCC/CNC
Nanocellulose or Cellulose nanocrystals generally have a width of about 2–30 nm and could be
several hundred nanometers in length and unlike MFC, which is mechanically prepared, are

Erik Sjöström
6
formed during acid hydrolysis of cellulose fibers. CNC can be hydrolyzed from different sources
such as hardwood and softwood pulp, but also from non-wood cellulose sources such as cotton,
wheat and rice straw, which all give some differences in the nanocrystal structure (Börjesson &
Westman, 2015).
The acid treatment degrades the pulp by starting at the most accessible parts of the pulp fibers,
the amorphous sections, followed by reducing end groups and crystal surfaces. Parameters such
as heat, reaction time and acid concentration affect the product, which can end up as the
complete hydroxylation of the cellulose crystal or give a high degree of polymerization.
2.2.3 BC
Bacterial nanocellulose is synthesized from special bacteria (for example acetobacter xylinum) that
create nanofibers with a diameter of a nanometer and up to a micrometer in length (Börjesson &
Westman, 2015; Karppinen, 2018). The bacteria synthesize cellulose and build up bundles of
microfibrils.
The low availability, inefficient process synthesizing the cellulose and the high costs make BC a
challenging product to commercialize: furthermore, the process for synthesizing BC does not
produce high quantities.
BC materials have unique properties. They have an extremely pure and fine fiber network
structure and a high polymerization degree. The main usage of BC in the industry is in medical
health and surgical applications. BC is used in bandages and as a substitute for medical materials,
such as blood vessels.
3 MFC production
MFC was first produced by treating wood fibers with a high-pressured homogenizer. Other
methods, such as microfludization, grinding, cryocrushing and ultrasonication, have been and are
used today. MFC production is possible with refining, e.g. Vinay Kumar in his doctoral thesis used
MFC that was produced at the Process Development Center of the University of Maine (Orono,
USA) (Kumar, 2018).

Erik Sjöström
7
Pretreatments can be and have been used to reduce the energy consumption and ease the
mechanical treatment of the fibers. Enzymatic pretreatment or an introduction of charged groups
to the fiber surface with carboxylation affects the fiber surface, which makes the fiber surface
easier to peel (Börjesson & Westman, 2015).
Theory for LC-refining will be covered in the next chapter.
3.1 Homogenization and Microfluidization
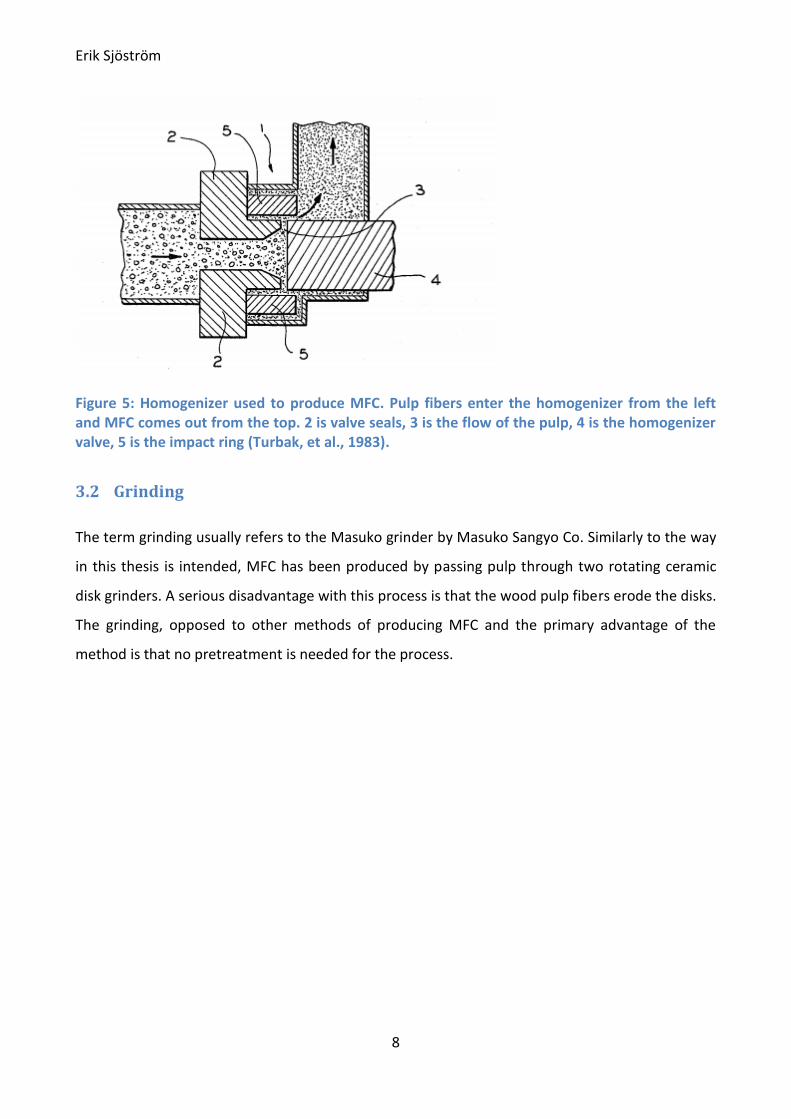
The high-pressure homogenization method involves forcing the pulp suspension through a narrow
channel using a piston (Figure 5). Pressures are highly depending on size but can go up to several
hundred MPa.
The main problems in homogenization are the pulp clogging the homogenizer and high energy
consumption. To avoid this, fibers are pretreated mechanically with grinding, refining,
cryocrushing or ultrasonication before the homogenization process.
Microfluidizers and high-pressure valve homogenizers can be mixed since they are used to the
same sorts of applications. However, they should not be mixed, as they are different technologies
with different results. The Microfluidizer generates a more uniform particle size of the product
compared to the most effective homogenizers (Microfluidics, 2018).
Erik Sjöström
8
Figure 5: Homogenizer used to produce MFC. Pulp fibers enter the homogenizer from the left and MFC comes out from the top. 2 is valve seals, 3 is the flow of the pulp, 4 is the homogenizer valve, 5 is the impact ring (Turbak, et al., 1983).
3.2 Grinding
The term grinding usually refers to the Masuko grinder by Masuko Sangyo Co. Similarly to the way
in this thesis is intended, MFC has been produced by passing pulp through two rotating ceramic
disk grinders. A serious disadvantage with this process is that the wood pulp fibers erode the disks.
The grinding, opposed to other methods of producing MFC and the primary advantage of the
method is that no pretreatment is needed for the process.
Erik Sjöström
9
4 LC-pulp refining
LC-refining or Low consistency refining is a mechanical treatment process where mechanical forces
are applied on fibers in water (2–6 % fibers in water) using metallic bars. The term “beating” is
referring to times back before when machines were used and the mechanical treatment of the
pulp was done by beating it with a stick. The term has remained to this day generally to describe
the fiber treatment with a Hollander beater, which is merely a compression action (Paulapuro,
2008). The term “refining”, which is more used to describe the combined treatment process of
both compression and shear, which came to use after the disk and conical refiners were invented.
Chemical pulp refining is one of the most important parts of preparing high quality papers.
Chemical stock fibers are long and smooth by form, which makes that they bond poorly to each
other, resulting in weak paper. By refining and beating, the fibers are modified, which results in
stronger paper and smoother paper surface with better printing properties due to the flattened
fibers improved bonding ability (Lundin, 2008).
4.1 The refining
The refining includes both mechanical and hydraulic forces to change the fiber characteristics. The
pulp is refined between the bars on a stator and a rotor. Stress treatments such as crushing,
bending, pulling and pushing of fiber clumps are obtained between the bars of the fillings. Shear
stresses like rolling and twisting occur in the grooves. Illustration of the refining of fibers between
the bars can be found in Figure 6 and Figure 7. Fibers appear as flocks or bundles on the bars.

Erik Sjöström
10
Figure 6: Illustration of refining between two bars (Smook, 1992).
Figure 7: Optical pictures of the refining action in ProLabTM presented on Metso customer seminar in Suzou 11.12.2012 (Eloranta, 2007-2008) (Jiming & Sjöström, 2012).
Erik Sjöström
11
4.2 Refining effects
The refining forces, which are applied by the refiner filling patterns, i.e. bars and grooves, affects
fibers in many ways. Refiner process parameters are optimized to achieve specific results. The
main effects are: removal of the primary fiber wall, internal and external fibrillation, delamination
and swelling of fibers, creation of fine material and shortening of fibers (cutting).
The fiber primary wall is stiff and rigid, rich in lignin, which prevents fiber swelling (Sjöström,
1981). Cooking and bleaching of pulp removes most of the primary fiber wall, granting access to
the secondary layer (S2), which contains microfibrils that can be exposed by refining.
Fibrillation of the fiber can be both internal and external. External fibrillation leads to most the
bonding abilities of the fiber. When the S1 layer is broken, the S2 layer of the fibers is exposed.
The external fibrillation is the breakage of the fibers external structure, which is visually seen as
hairy fibers. The external fibrillation increases the paper tensile strength index and increases the
drainage resistance. Internal fibrillation is breaking the internal fiber structure, which results in the
fiber swelling and increases the surface area and flexibility.
Fiber cutting is caused by too intense refining. The cut fibers do not flock as well onto the refiner
bars, which results in lower fibrillated pulp. Fiber cutting is mainly avoided today, but was used in
earlier days of refining. In some mills, long fibers are still cut to make short fibers. The purpose of
shortening long fibers is to develop other pulp properties like absorbency, porosity and optical
properties for some paper grades (Paulapuro, 2008; Lumiainen, 1998).
Fines material is created when fibers are cut at the edges and when fibers are fibrillated. This
usually results in some loose fibrils in the pulp. High fines material content lowers paper tear
strength and decreases drainability.
Bleaching chemical pulp causes the fibers to curl. The curled fibers can be straightened again but
not completely by refining. Straightening the fibers increases the tensile strength (Paulapuro,
2008).

Erik Sjöström
12
4.3 Refining management
Modern refiners calculate and monitor the amount of energy put into the refining process. The
two most important parameters are the amount of energy put in per weight unit of pulp (Specific
energy consumption) and the rate the pulp is refined, i.e. refining intensity.
4.3.1 Specific energy consumption SEC
Specific energy consumption (SEC) is used along the specific edge load (SEL) value to describe the
net value of power used on fibers during the refining. Refiners are characterized on the SEC value,
which is described as the energy per unit mass pulp (Lundin, et al., 2008).
SEC= Ptot-P0
V̇C (
kwh
t), Eq. 1
where
�̇� = Flow (𝑙
ℎ),
c = concentration of pulp in water (t
l),
Ptot = Total motor power load,
P0 = Idle power, no load power.
4.3.2 Specific edge load theory SEL
In 1958, Ferdinand Wultsch and Wolfgang Flucher developed a theory “Spezifishe Kantbelastung”
or loading B, which used the amount and length of rotor and stator bars in the refining load
calculations according to Eq. 2 (Lundin, 2008; Baker, 2000). This is the most commonly used
refining intensity calculation method for any beater or refiner for characterization of LC-refining
(Kerekes, 2011):
Bs= Pnet
Ls=
Pnetn
60zrzsl̅
(J
m), Eq. 2
where
Erik Sjöström
13
n = rotation speed (1
𝑚𝑖𝑛) or (
𝑟𝑒𝑣
𝑚𝑖𝑛),
z = Bar amount on filling,
l ̅= Average length of bars (𝑚) 𝑜𝑟 (𝑚
𝑟𝑒𝑣),
Pnet = Ptot − P0.
In 1966, Walter Brecht and Wolfgang Siewert defined a refining intensity calculation as specific
edge load (SEL) (Lumiainen, 1998; Lundin, 2008).
SEL= Ptot-P0
nCL (
J
m), Eq. 3
where 𝑃0 stands for the refiner no load power consumption. The no load is measured with water
by running the refiner with the fillings fully parted from each other. The no load is affected by the
rotation speed of the filling, the filling pattern, the direction of rotation for the rotor filling, and
the water flow regulated by the pump (Baker, 2000).
The CL stands for cutting length and comes from the loading B formula:
𝐶𝑙 = 𝑧𝑟𝑧𝑠𝑙 ̅ (𝑚
𝑟𝑒𝑣). Eq. 4
SEL is widely used even though it does not account for different fiber behavior and assumes that
all fibers and refiner load are evenly distributed along the bars of the fillings. SEL is an easy and
fast method to use as it gives a close estimate of the intensity for choosing the correct refiner size
and filling pattern (Baker, 2000; Paulapuro, 2008; Kerekes, 2011).
4.3.3 Specific surface load SSL
The specific surface load theory (SSL) was presented by Jorma Lumiainen in 1990. He expanded
the existing SEL theory by including bar width (Lumiainen, 1998).
SRE = IN × SSL × IL, Eq. 5
where
SRE = specific refining energy (𝑘𝐽
𝑘𝑔) ,

Erik Sjöström
14
IN = the number of refining impacts (𝑘𝑚
𝑘𝑔),
SSL = the specific surface load (𝐽
𝑚2),
IL = the bar width factor (𝑚) or impact length.
The IN describes a number of generated refining impacts for a mass flow passing through the
refiner.
IN = 𝐿𝑠
𝑀, Eq. 6
where
𝐿𝑠 = cutting speed of the bars,
M = fiber flow (𝑘𝑔
𝑠).
The SSL factor is obtained by dividing the SEL value by the width factor IL.
SSL=𝑆𝐸𝐿
𝐼𝐿. Eq. 7
The visual representation and description of the impact length factor IL can be found in Figure 8
and Eq 8.

Erik Sjöström
15
Figure 8: Impact length.
IL= 𝑤𝑏,𝑟+𝑤𝑏,𝑠
2
1
cos(𝛼
2) , Eq. 8
where
𝑤𝑏 = is the bar width(𝑚),
𝛼 = average intersecting angle.
The SSL expanded the SEL theory but still left out important factors as filling grooves, wear of
fillings such as rounding of bars and the length of fibers refined (Paulapuro, 2008).
4.3.4 C-factor
Richard Kerekes made a 31-equation theory to characterize refining action in 1990. Kerekes added
to the suggested concept from 1962 by Donald Danforth and John Lewis, which described the
mechanical refining action by two variables: the number of impacts done per unit mass of pulp N,
and the intensity of each impact I. These together described the energy used on the pulp (Kerekes,
1990):
E = NI. Eq. 9

Erik Sjöström
16
Different refining results can be achieved depending on how the energy is applied. For example, a
high value of N at low intensity leads to fibrillation, while a high value in intensity results in cutting
the fibers. To be able to use this equation the N and I term have to be related to key variables in
the refining, i.e. mass flow F and net power P and finally introducing the C-factor, which leads to
the equation:
E = (𝐶
𝐹) (
𝑃
𝐶). Eq. 10
The C-factor approaches the refining process by taking into consideration the refiner variables and
fiber properties, such as, the density of water ρ, pulp consistency 𝐶𝐹, fiber length 𝑙𝐹, number of
bars 𝑧, rotational speed 𝑛, gap clearance 𝑇, width of grooves G, depth of grooves D, bar angle Ф,
inner radius 𝑅1, refining zone length L and refiner angle 𝜃. Kerekes calculation consideres both
disk and conical refiners. This leads to the definition of two different C-factors. The conical
refiner’s C-factor is shown in Eq.11.
C = 4𝜋2ρ𝐶𝐹𝑙𝐹𝑧𝑠𝑧𝑛(𝑇 + 𝑧𝑠𝐺𝑠𝐷𝑠 + 𝑧𝑟𝐺𝑟𝐷𝑟) ∙
(1 + 𝑡𝑎𝑛Ф𝑠 + 𝑡𝑎𝑛Ф𝑟) (𝑅1
2𝐿+𝐿2𝑅1𝑠𝑖𝑛𝜃+(𝐿3
3)𝑠𝑖𝑛2𝜃
𝑛(𝑙+𝐷+𝑇)). Eq. 11
4.4 Refining parameters
Many parameters affect the refining result. The choice of raw material, equipment and process
parameters impact the refining result in different ways (Smook, 1992).
4.4.1 Raw material
Different chemical treatments of pulp has a different impact on the refining process, as kraft pulp
requires more energy than sulfite pulp to refine while soda pulps require the least energy.
The ability of fibers to absorb water, which leads to the fibers swelling and growing in size,
contributes to easier refining of the fibers. A low amount of lignin, which does not absorb water
and a high amount of hemicellulose are beneficial for refining. Dried chemical pulp loses almost
30% of its ability to absorb water compared to pulp that has not been dried before, or so called
never-dried pulp.

Erik Sjöström
17
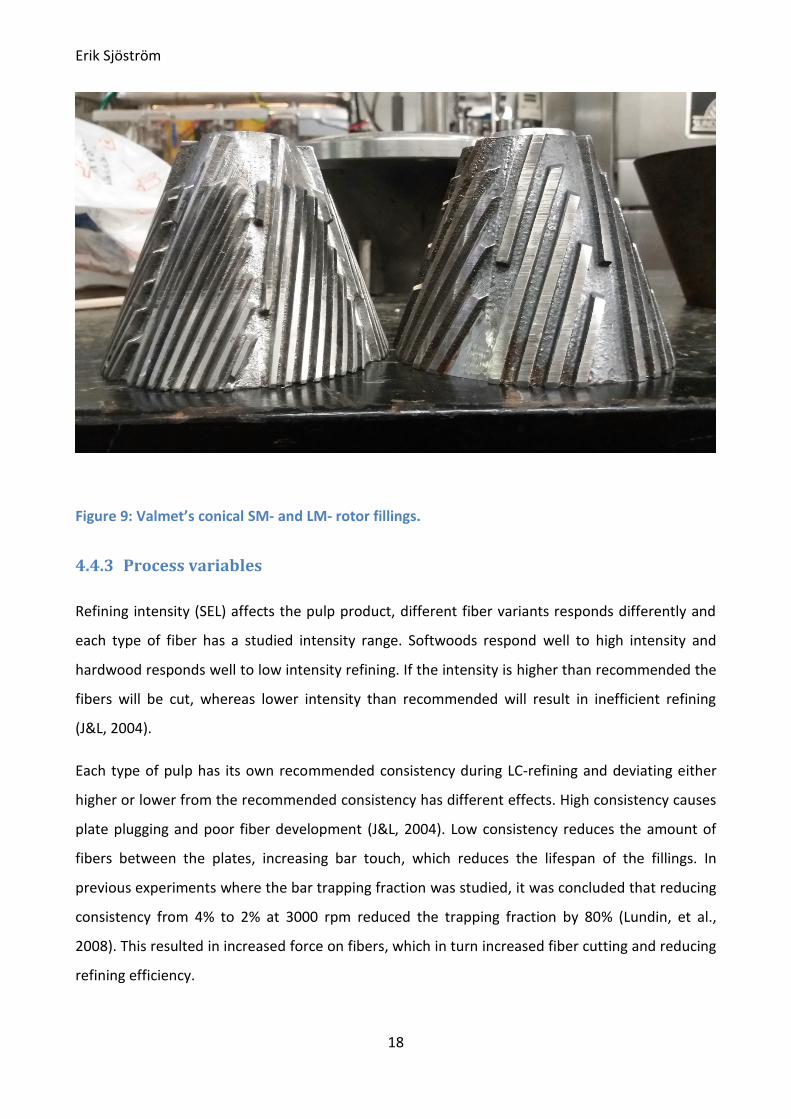
As mentioned earlier, hardwood and softwood pulps differ in fiber length and refiner fillings are
designed specifically for short and long fiber pulps respectively. Figure 9 shows a conical short
medium fiber rotor filling (SM) next to a long medium filling (LM). The SM filling has narrower bars
and grooves compared to the LM.
High pH in the refining process decreases the needed energy. High temperature and pH dissolves
hemicellulose and closes the surface on the fiber, which reduces strength properties. Optimum
water temperature used should be 40 °C, as cold water increases slushing time in the pulper.
Refining of bleached hardwood pulp is not affected by the different values of pH, but bleached
softwood pulp shows lower paper strengths. High pH creates denser fiber networks (Jansson,
2015). During industrial refining, pH is kept close to neutral because low pH prevents water
penetrating the fiber while high pH makes the fibers slippery.
4.4.2 Equipment
The refiner fillings play a major role in the refining process. Each filling is specialized for a specific
pulp and a final product in mind. Fillings are consumables that have a finite usage period and need
a replacement once the period is over. The filling material affects the lifetime of a filling, wrong
filling material may result in failures like bar breakage, filling wear and bar edge rounding, which
increase energy costs and reduce fiber quality (J&L, 2004).
The bars and grooves play a major role in designing a filling. Many different ways exist to modify
the bars on a filling with different results. For example, the height of the bars, angle of rotor to
stator bars. Bars can be slanted instead of perpendicular to the filling surface to increase filling life,
width of bars and amount of them to increase treatment. Dams are blockages in the grooves
function as a stop, forcing pulp to cross over the bar edges. Grooves are designed to transport
pulp and not be clogged. Too narrow bars reduce fiber flock rotation in the grooves, which
decreases the amount of flocks that end up on the bars, and instead pass the refiner without being
refined (Lumiainen, 1998).
Erik Sjöström
18
Figure 9: Valmet’s conical SM- and LM- rotor fillings.
4.4.3 Process variables
Refining intensity (SEL) affects the pulp product, different fiber variants responds differently and
each type of fiber has a studied intensity range. Softwoods respond well to high intensity and
hardwood responds well to low intensity refining. If the intensity is higher than recommended the
fibers will be cut, whereas lower intensity than recommended will result in inefficient refining
(J&L, 2004).
Each type of pulp has its own recommended consistency during LC-refining and deviating either
higher or lower from the recommended consistency has different effects. High consistency causes
plate plugging and poor fiber development (J&L, 2004). Low consistency reduces the amount of
fibers between the plates, increasing bar touch, which reduces the lifespan of the fillings. In
previous experiments where the bar trapping fraction was studied, it was concluded that reducing
consistency from 4% to 2% at 3000 rpm reduced the trapping fraction by 80% (Lundin, et al.,
2008). This resulted in increased force on fibers, which in turn increased fiber cutting and reducing
refining efficiency.

Erik Sjöström
19
The pulp flow through the fillings gap along the pattern design of the fillings enables a possibility
to optimize fiber development by increasing probability for fiber trapping on bars, which results in
higher fiber development and longer filling lifetime (J&L, 2004). Low flow may cause shorter filling
lifetime and higher pressure in the refiner and increased fines material production. Higher flow
may reduce filling life, but also cause pressure drop and poor fiber development due to fibers
passing through without being properly refined.
Rotation direction of the rotor filling has an effect on the no load power. The direction of rotation
is referred to as either pumping or no pumping due to the bars on the filling aiding the flow of
water and pulp. The bars on the fillings usually have an angle, which creates a pumping effect. This
causes rotation to the no pumping direction to work against the pump and increases the no load.
High pressure during refining helps water to penetrate the fibers, but the pressure is often given
by the process surroundings and high pressure increase the work done by the pump. Industrial
refiners are normally designed to operate at up to 6 bars.

Erik Sjöström
20
5 Different industrial LC-refiners
Today there are a few different types of industrial refiners, but the conical and disk refiners are
the most common ones. These refiners still have large optimizing possibilities in terms of fillings
design for optimizing pulp and paper properties. Some companies dealing with pulp refining are
Valmet, Andritz, GL&V and Voith.
5.1 Hollander Beater
The Hollander Beater, invented in the 1700s, was the first refining machine and was used to treat
pulp for improved paper quality. The Hollander Beater can be classified as a batch process LC-
refiner. The pulp slurry is circulated in a circular tank with the beater part in the middle. The
Hollander Beater became less frequent with the invention of the continuous refining process using
conical and disk refiners (Paulapuro, 2008). Today some Hollander Beaters are still in use in a few
older mills, which handles some more difficult pulps like jute, hemp, flax and cotton (Smook,
1992). Tumba bruk in Stockholm still uses a Hollander beater for making currency paper (Back,
2015). The Hollander Beater’s laboratory scale counterpart is called the Valley beater (Figure 10).
Figure 10: Valley Beater.
5.2 Conical Refiners
Conical refiners consist of a conical rotor filling fixed on the refiner’s motor axle and a stationary
stator filling. The refining effect is regulated by adjusting the gap between the rotor and stator by
pushing the rotor towards the stator. The pulp is pumped in from the small end of the stator (left
Erik Sjöström
21
side of the refiners in Figure 11 and Figure 12). The pulp outlet stream is on the wide end of the
refiner.
The conical refiners shifted the mechanical treatment from beating to refining, but disk refiners
started competing with the early conical refiners once short-fiber hardwoods entered the stock
furnish (Lankford, 2001). The Jordan type refiners could only be equipped with solid fillings (fully
casted). This limited the bar and groove configuration to coarse patterns, which were only suitable
for refining long-fibers.
The growth of the paper machines sizes and capacities increased the required refining capacity.
The early conical type refiners were too small and expensive to keep up with the capacity
requirements. The disk refiners had a clear cost advantage. The introduction of a refining surface
of plates (segments) that are bolted to a holder frame made it possible to efficiently cast dense
patters with higher cutting lengths. The disk refiners were developed for larger refining capacity
and higher energy input compared to the early conical refiners. The disk refiner required also less
power than the conical refiners, lowering the production costs. When stock refining included
short-fiber hardwood, the refining required denser patterns, which the Jordan and Claflin conical
refiners did not have (Lankford, 2001).
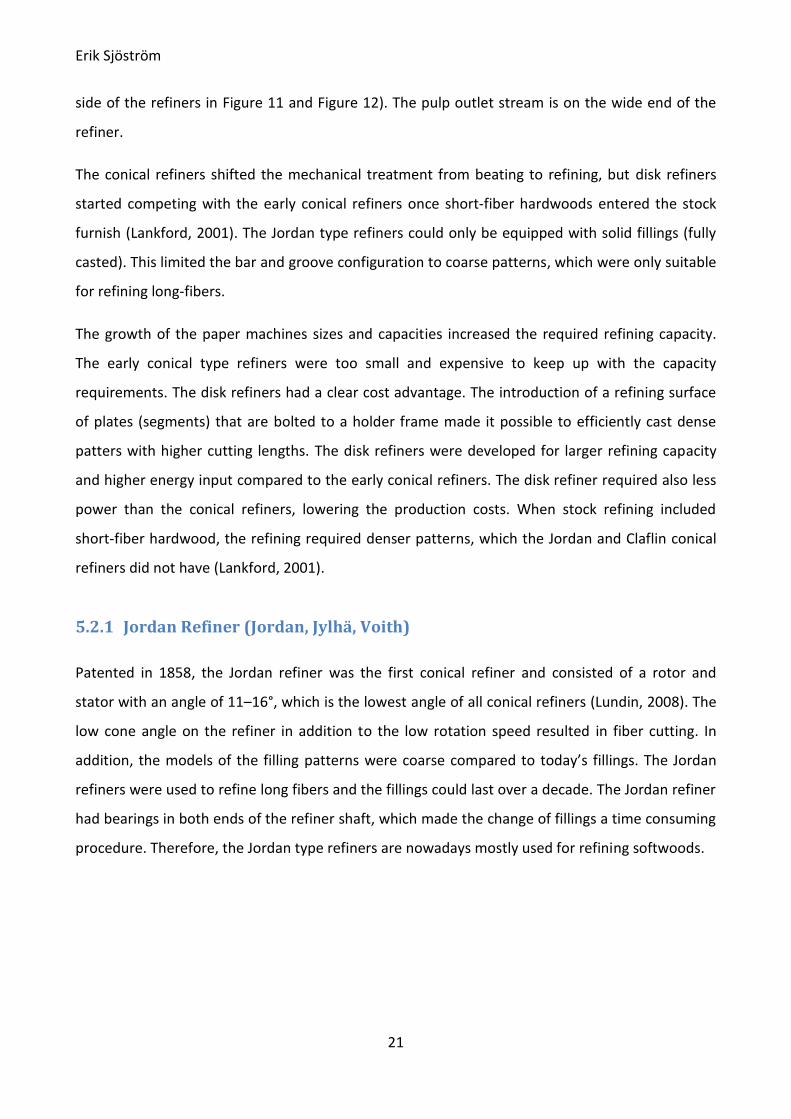
5.2.1 Jordan Refiner (Jordan, Jylhä, Voith)
Patented in 1858, the Jordan refiner was the first conical refiner and consisted of a rotor and
stator with an angle of 11–16°, which is the lowest angle of all conical refiners (Lundin, 2008). The
low cone angle on the refiner in addition to the low rotation speed resulted in fiber cutting. In
addition, the models of the filling patterns were coarse compared to today’s fillings. The Jordan
refiners were used to refine long fibers and the fillings could last over a decade. The Jordan refiner
had bearings in both ends of the refiner shaft, which made the change of fillings a time consuming
procedure. Therefore, the Jordan type refiners are nowadays mostly used for refining softwoods.

Erik Sjöström
22
Figure 11: Cross section of a Jylhä Jordan refiner (Lumiainen, 1998).
5.2.2 Claflin refiner
The Claflin Refiner, introduced in 1920 has a 30-degree refiner angle, which is the widest angle of
all conical refiners (Lundin, 2008). The Claflin refiner and the Jordan refiner have a high refining
surface in relation to main motor power.
The Claflin refiner is still used to refine cotton for currency paper and other high density paper
qualities, such as glassine paper. Like the Jordan refiner, the Claflin refiners suffered from the
drawback that filling change was a complicated procedure due to bearings in both ends of the
shaft.
5.2.3 OptiFiner ConFlo® refiner
Jylhävaara reintroduced conical refining in the 1980s with the ConFlo® concept, a conical refiner
design with 20 degree conical refiner angle for high energy input. The advantage of the ConFlo®
design is that the filling change became much easier with the cantilever design. The ConFlo®
refiner provided improved fiber development, a more homogeneous treatment of fibers and
improved energy efficiency (Lankford, 2001).
Valmet’s refining experience dates back to the 1950s with both conical and double disk refiners.
The OptiFiner ConFlo® design (Figure 12) combines the positive features and performance benefits
to suit the requirements for most typical short-fiber and long-fiber refining treatments (Valmet,
2018). Valmet OptiFiner refiner comes in six different sizes ranging from RF-0, which has a capacity
range of 5–50 tpd (ton per day) to RF-5, which has a capacity range of 300–800 tpd.

Erik Sjöström
23
The ConFlo® refiners are cantilevered and they only have bearings on one side of the rotor. The
main advantage is that fillings change became an easy procedure compared to Jordan type or
Claflin refiners.
Figure 12: Valmet’s OptiFiner ConFlo® refiner (Valmet, 2018).
5.2.4 OptiFiner Pro
The OptiFiner Pro (Figure 13) is Valmet’s latest refiner concept (Valmet, 2018).
Differently from any other refiner, the OptiFiner Pro has a completely different flow principle.
Pulp is fed into the refiner from inside of the rotor. The pulp passes through gaps in the rotor into
the refining zone and out through gaps in the stator. This reduces the residence time of the pulp
inside the refiner significantly compared to other refiners. The unique flow-through design results
in that pulp is distributed evenly along the refiner zone resulting in that all pulp is given a more
homogenous treatment (Valmet, 2013; Valmet, 2018).
Erik Sjöström
24
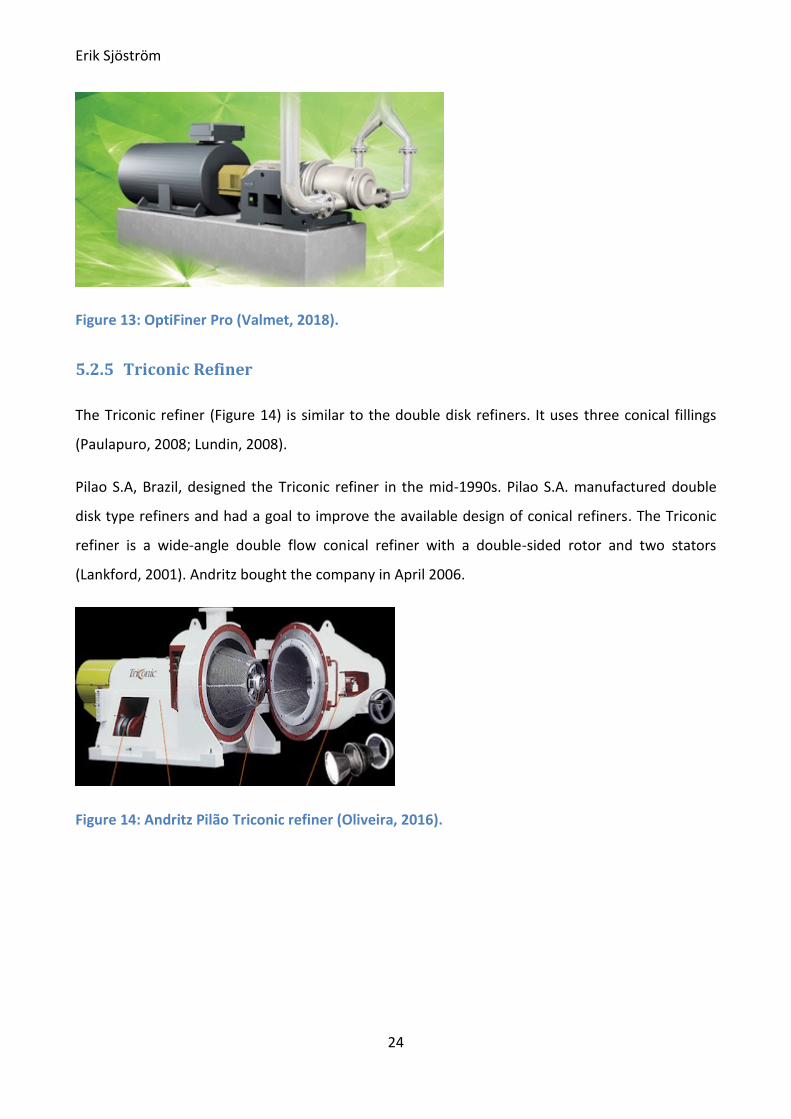
Figure 13: OptiFiner Pro (Valmet, 2018).
5.2.5 Triconic Refiner
The Triconic refiner (Figure 14) is similar to the double disk refiners. It uses three conical fillings
(Paulapuro, 2008; Lundin, 2008).
Pilao S.A, Brazil, designed the Triconic refiner in the mid-1990s. Pilao S.A. manufactured double
disk type refiners and had a goal to improve the available design of conical refiners. The Triconic
refiner is a wide-angle double flow conical refiner with a double-sided rotor and two stators
(Lankford, 2001). Andritz bought the company in April 2006.
Figure 14: Andritz Pilão Triconic refiner (Oliveira, 2016).
Erik Sjöström
25
5.3 Disk refiners
The disk refiner was invented in 1856 and worked with the same principle as the conical refiner. It
consists of a rotating rotor disk and a static stator disk. Disk refiners are separated into two groups
based on the amount of filling disks; single and double disk.
5.3.1 Single disk refiner
Single disk refiners are not used that much in LC-refining anymore, mostly in laboratory scale.
Single disk refiners are mainly used in HC-refining of mechanical pulp (Paulapuro, 2008).
5.3.2 Double disk refiner
The double disk refiner is the world’s most common refiner type. The most common double disk
refiner type is the Beloit-Jones refiner, DD3000 and DD4000 series. Beloit-Jones was acquired by
GL&V in 2000. GL&V has made some updates to the refiner technology, which are called the
DD6000 series.
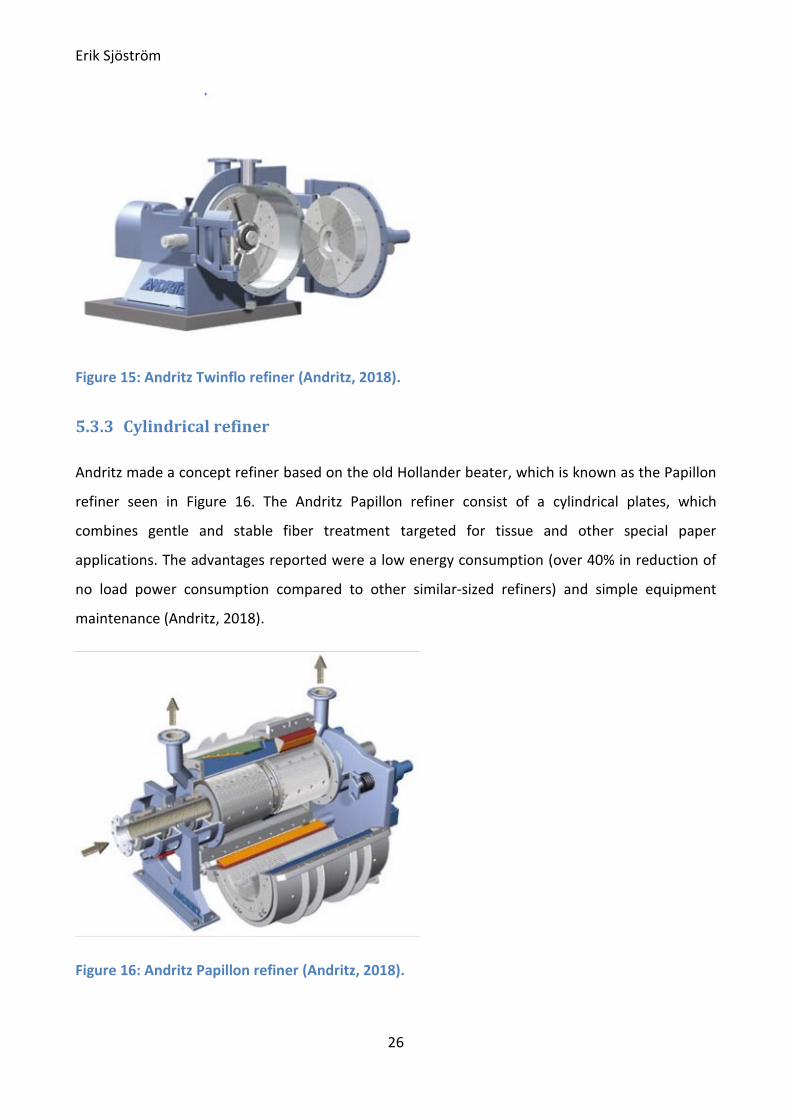
The Andritz Twinflo refiner (Figure 15) is a double-disc refiner, which is suitable for all types of
fiber processing applications e.g. for mechanical pulp, softwood and hardwood chemical pulp and
recycled fiber pulp (Andritz, 2018). The double disk refiner has two refining zones.
Double disk refiners, like the Triconic refiner have the typical problem of uneven refining zones.
The ideal working condition is when the plates have equally sized gaps giving similar refining
conditions in the two refining zones. According to an article by Oddbjørn Eriksen and Lars-Åke
Hammar in 2007, they observed that the Beloit double disk refiner with a floating rotor disk did
not generally position in the middle between the stator disks (Eriksen & Hammar, 2007).
LC double disk refiners should not be confused with the HC double disk refiners. The HC-refiners
consists of two in opposite direction rotating disks.
Erik Sjöström
26
Figure 15: Andritz Twinflo refiner (Andritz, 2018).
5.3.3 Cylindrical refiner
Andritz made a concept refiner based on the old Hollander beater, which is known as the Papillon
refiner seen in Figure 16. The Andritz Papillon refiner consist of a cylindrical plates, which
combines gentle and stable fiber treatment targeted for tissue and other special paper
applications. The advantages reported were a low energy consumption (over 40% in reduction of
no load power consumption compared to other similar-sized refiners) and simple equipment
maintenance (Andritz, 2018).
Figure 16: Andritz Papillon refiner (Andritz, 2018).

Erik Sjöström
27
6 Laboratory refiners
There are some laboratory scale refiners or grinders that have been used to simulate industrial
refining. One of these laboratory refiners is the Valmet ProLabTM, which is used in this work. The
two most common laboratory refiners or beaters are the Valley beater and the PFI mill. The Voith
laboratory refiner and the ProlabTM resembles industrial refining the most as they have the same
refining process as the industrial refiners. Neither Voith nor Valmet produce laboratory refiners
anymore because of the low demand. Some pulp producers have manufactured their own small
scale test plant by utilizing the smallest possible industrial refiner available.
6.1 PFI mill
The PFI mill (Figure 17) is used for studying the effects of the beating degree of pulp on physical
properties. The PFI mill is widely used to evaluate pulps, the low cutting tendency of the mill gives
high strength values. The PFI mill became popular due to the small pulp volumes it requires, it
operates at a medium consistency (around 10%) with a 30 g batch. The PFI mill has a beating
mechanism that consists of a constant load given by a rotating steel roll and a cylindrical mill
house. The mechanical loads on fibers were on older mills applied manually by a lever but newer
models have an automatic system (Bonfiglio, et al., 2013).
Figure 17: PFI Mill (Bonfiglio, et al., 2013).
Erik Sjöström
28
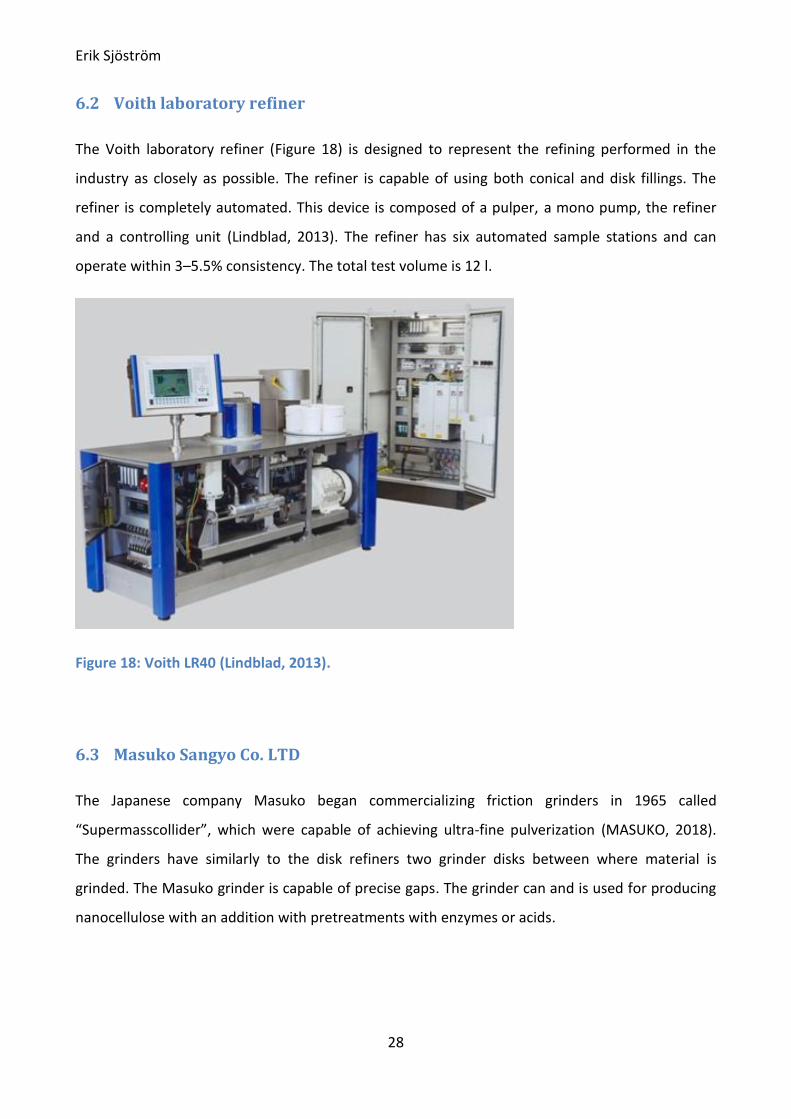
6.2 Voith laboratory refiner
The Voith laboratory refiner (Figure 18) is designed to represent the refining performed in the
industry as closely as possible. The refiner is capable of using both conical and disk fillings. The
refiner is completely automated. This device is composed of a pulper, a mono pump, the refiner
and a controlling unit (Lindblad, 2013). The refiner has six automated sample stations and can
operate within 3–5.5% consistency. The total test volume is 12 l.
Figure 18: Voith LR40 (Lindblad, 2013).
6.3 Masuko Sangyo Co. LTD
The Japanese company Masuko began commercializing friction grinders in 1965 called
“Supermasscollider”, which were capable of achieving ultra-fine pulverization (MASUKO, 2018).
The grinders have similarly to the disk refiners two grinder disks between where material is
grinded. The Masuko grinder is capable of precise gaps. The grinder can and is used for producing
nanocellulose with an addition with pretreatments with enzymes or acids.

Erik Sjöström
29
Figure 19: Masuko Supermasscollider (MASUKO, 2018).
6.4 Jokro Mill
The Jokro mill is a laboratory scale beater, using the principle of centrifugal force. Six rolls revolve
around their own axes, as planets equipped with beater housings (FRANK-PTI, 2017). The
centrifugal force causes the beater roll inside each vessel to roll along the sides, beating the pulp.
The Jokro mill runs accordingly to applicable standards and is capable of simultaneously beating
six samples, 16 g each.

Erik Sjöström
30
7 Continuous industrial refiner system design
Industrial refining setups are designed to meet a capacity demand. The key parameters are
hydraulic capacity i.e. (t/h) and refining energy need (kWh/t). Typically, refining lines are designed
to meet a maximum capacity demand with some room to grow. The capacity t/h, determines the
size of the refiner while the refining energy need kWh/t determines the number of refiners in
series.
Control and monitoring the refining line is essential for reliable operation. Basic instrumentation
such as a flow meter, inlet and outlet pressure gauges are the minimum requirement for each
refiner system.
7.1 Single refiner without recirculation
The simplest continuous refining method is where pulp flows through the refiner once (Figure 20).
This design works when the flow combined with the energy input is enough for the targeted pulp
product. Inlet pressure is typically kept at 140–280 kPa. Too low pressure can cause the inlet
pressure control switch to stop the pump and high inlet pressure causes higher energy
consumption for the pump and requires higher packaging or seal water pressure (J&L, 1994).
Figure 20: Single refiner without circulation (J&L, 1994).
Erik Sjöström
31
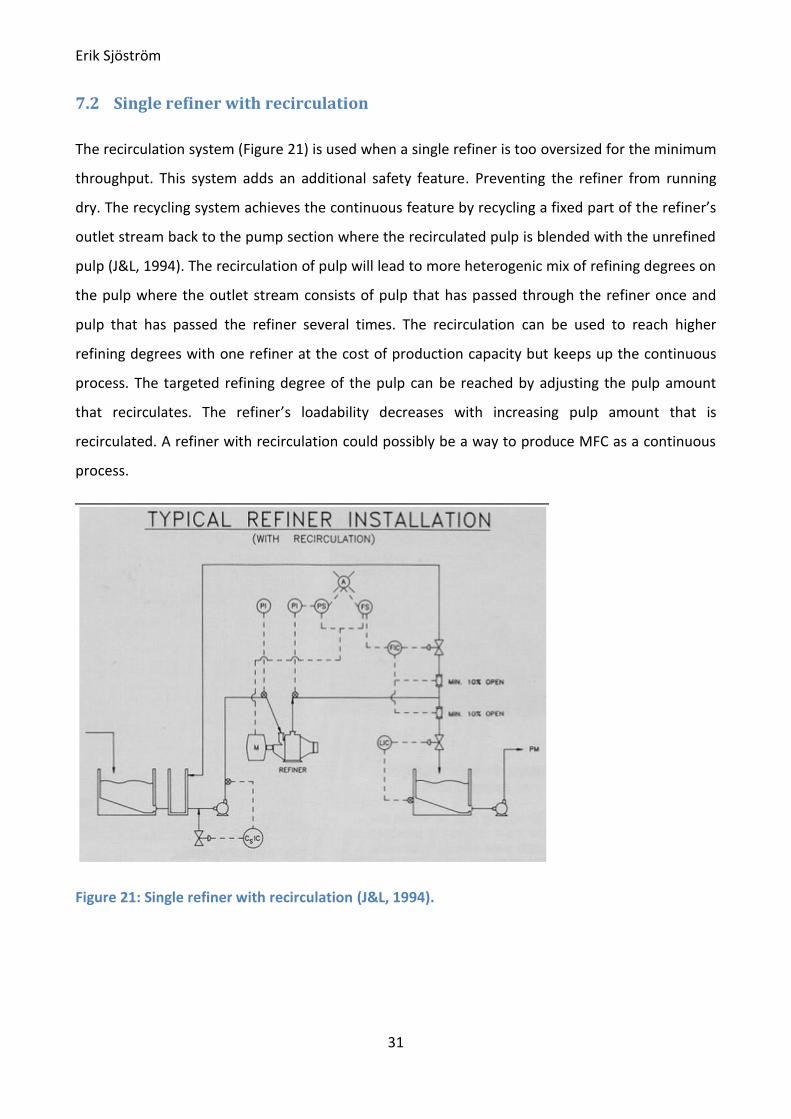
7.2 Single refiner with recirculation
The recirculation system (Figure 21) is used when a single refiner is too oversized for the minimum
throughput. This system adds an additional safety feature. Preventing the refiner from running
dry. The recycling system achieves the continuous feature by recycling a fixed part of the refiner’s
outlet stream back to the pump section where the recirculated pulp is blended with the unrefined
pulp (J&L, 1994). The recirculation of pulp will lead to more heterogenic mix of refining degrees on
the pulp where the outlet stream consists of pulp that has passed through the refiner once and
pulp that has passed the refiner several times. The recirculation can be used to reach higher
refining degrees with one refiner at the cost of production capacity but keeps up the continuous
process. The targeted refining degree of the pulp can be reached by adjusting the pulp amount
that recirculates. The refiner’s loadability decreases with increasing pulp amount that is
recirculated. A refiner with recirculation could possibly be a way to produce MFC as a continuous
process.
Figure 21: Single refiner with recirculation (J&L, 1994).
Erik Sjöström
32
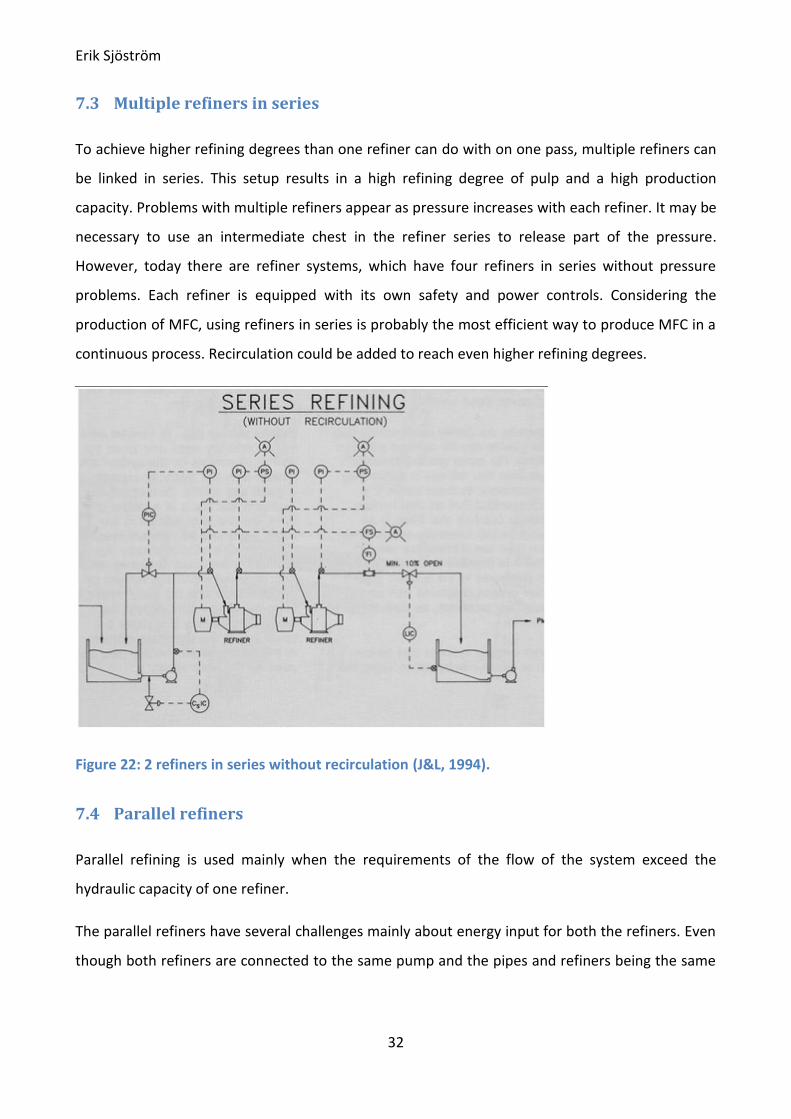
7.3 Multiple refiners in series
To achieve higher refining degrees than one refiner can do with on one pass, multiple refiners can
be linked in series. This setup results in a high refining degree of pulp and a high production
capacity. Problems with multiple refiners appear as pressure increases with each refiner. It may be
necessary to use an intermediate chest in the refiner series to release part of the pressure.
However, today there are refiner systems, which have four refiners in series without pressure
problems. Each refiner is equipped with its own safety and power controls. Considering the
production of MFC, using refiners in series is probably the most efficient way to produce MFC in a
continuous process. Recirculation could be added to reach even higher refining degrees.
Figure 22: 2 refiners in series without recirculation (J&L, 1994).
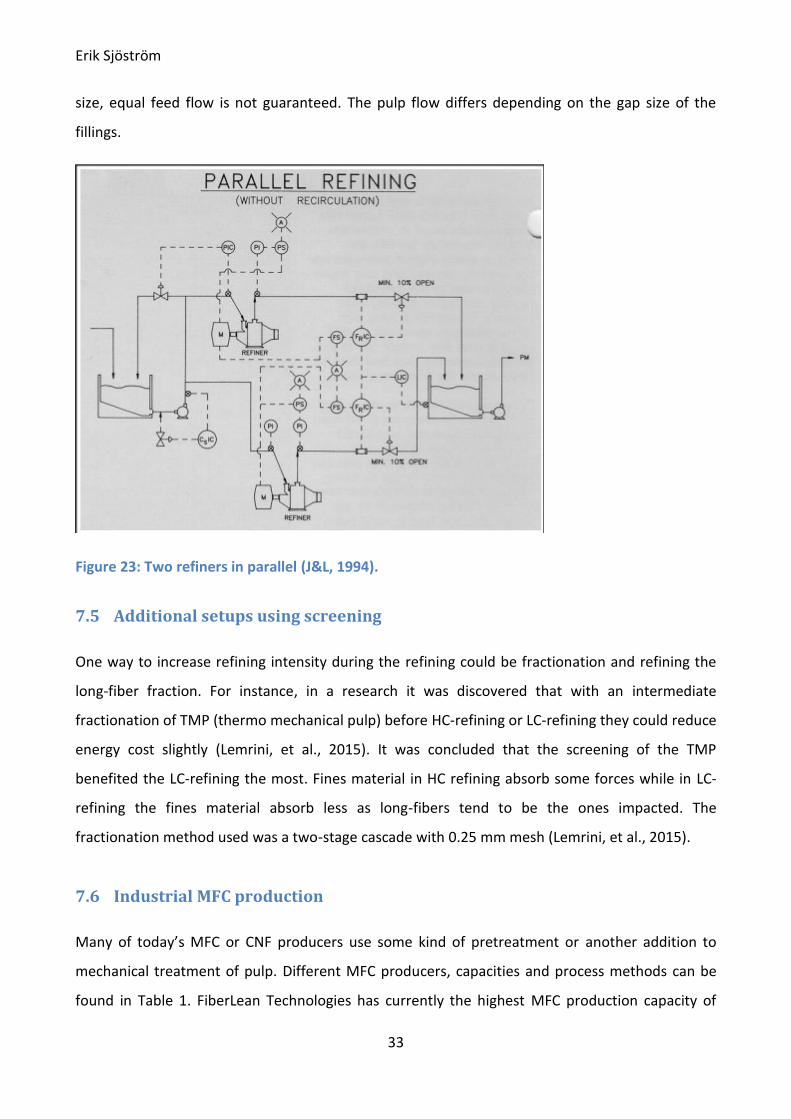
7.4 Parallel refiners
Parallel refining is used mainly when the requirements of the flow of the system exceed the
hydraulic capacity of one refiner.
The parallel refiners have several challenges mainly about energy input for both the refiners. Even
though both refiners are connected to the same pump and the pipes and refiners being the same
Erik Sjöström
33
size, equal feed flow is not guaranteed. The pulp flow differs depending on the gap size of the
fillings.
Figure 23: Two refiners in parallel (J&L, 1994).
7.5 Additional setups using screening
One way to increase refining intensity during the refining could be fractionation and refining the
long-fiber fraction. For instance, in a research it was discovered that with an intermediate
fractionation of TMP (thermo mechanical pulp) before HC-refining or LC-refining they could reduce
energy cost slightly (Lemrini, et al., 2015). It was concluded that the screening of the TMP
benefited the LC-refining the most. Fines material in HC refining absorb some forces while in LC-
refining the fines material absorb less as long-fibers tend to be the ones impacted. The
fractionation method used was a two-stage cascade with 0.25 mm mesh (Lemrini, et al., 2015).
7.6 Industrial MFC production
Many of today’s MFC or CNF producers use some kind of pretreatment or another addition to
mechanical treatment of pulp. Different MFC producers, capacities and process methods can be
found in Table 1. FiberLean Technologies has currently the highest MFC production capacity of

Erik Sjöström
34
8000 dry metric tons per year (Skuse & Ireland, 2018). FiberLean’s method of producing MFC
consist of using grinding forces with the addition of mineral particles that act as a grinding media
to reduce the energy requirement (Skuse & Ireland, 2018).
It is known that multiple passes are required to refine chemical pulp in in order to produce MFC.
Each pass through the refiner results in a loss in energy efficiency, which increases with each pass.
The refiner is then increasingly more difficult to load due to the fibers being too small to cling to
the bars (Heiskanen et al., 2017). By reducing required passes through refiners, the energy loss
and overall energy requirements in MFC production can be reduced.
A way to produce MFC in a more efficient manner as a continuous way is to make a refining line
where pulp is first refined with a high SEL value or pretreated to a set Schopper-Riegler degree.
The second refiner uses a high value CEL filling or plate to refine the pulp into MFC (Bilodeau &
Paradis, 2017; Heiskanen et al., 2017)
Table 1: MFC production capacity in tons per year (Miller, 2018).

Erik Sjöström
35
8 Experimental
In order to produce and analyze microfibrillated cellulose (MFC), a research plan was devised
based on background knowledge and existing laboratory equipment.
8.1.1 Raw material
Finnish industrial bleached birch kraft pulp was used. Finnish birch pulps was provided, one dried
bale pulp and one never-dried pulp from the same batch. The never-dried pulp was stored in
several air-sealed containers in a cold room to decrease aging speed.
The pulp used in the later pilot trials was delivered from another producer.
8.2 Methods
Production of MFC was experimented with the ProLabTM laboratory refiner in Åbo Akademi
University (Laboratory of Fibre and Cellulose Technology in Turku, Finland). Conical fillings were
used for the experiments. Laboratory sheets were prepared at both Åbo Akademi University and
Aalto University’s Department of Bioproducts and Biosystems, whereas rheology tests and MFC
films were done at Åbo Akademi University and Aalto University respectively.
Valmet Oy delivered specifically designed PRO-13 fillings for producing MFC. These fillings were 3D
printed out of aluminum.
Two industrial scale pilot runs with a JC-01 sized refiner (OptiFiner ConFlo® RF-1) were performed
at Valmet’s pilot plant in Inkeroinen, Finland at the final part of the experimental test period. The
tests were performed using two different fillings (MPF35G and PSED) with a similar refining
process as performed with the ProLabTM.
8.3 Refining
Four different refining sequences were performed during the thesis: Preliminary tests, LAB-13, SF
revisited and pilot runs. Apart from the pilot runs, all refining sequences were performed on the
ProLabTM.
Erik Sjöström
36
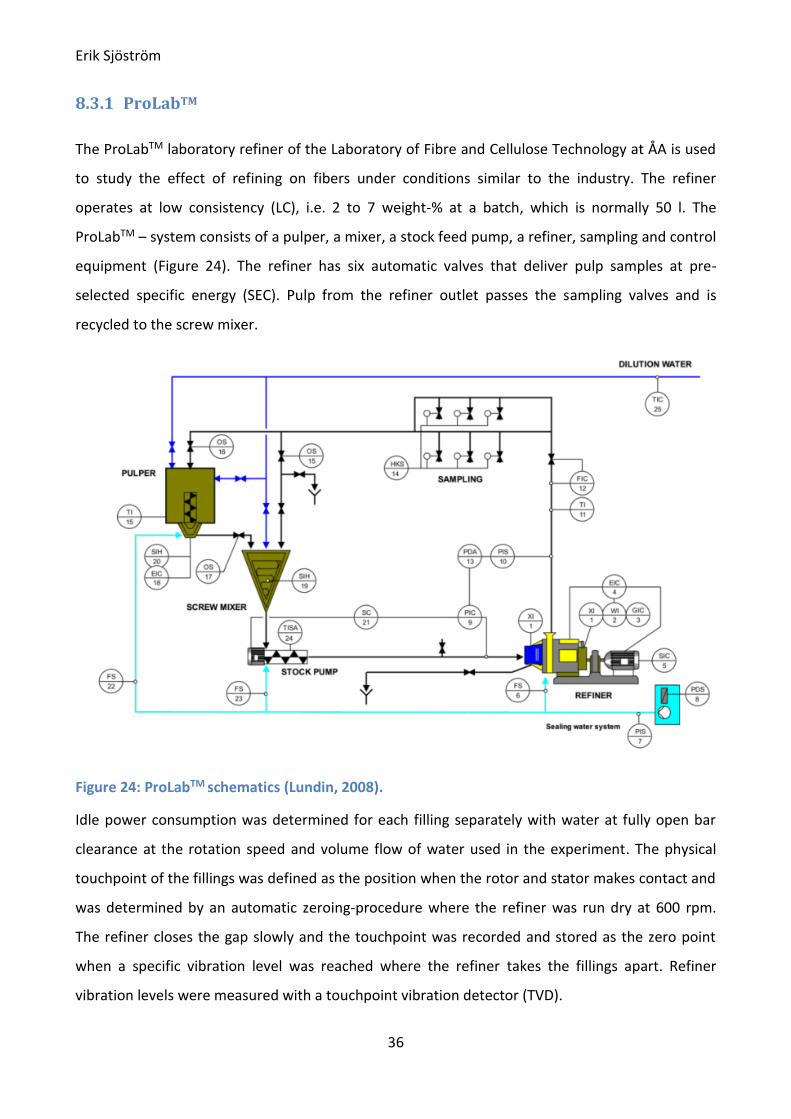
8.3.1 ProLabTM
The ProLabTM laboratory refiner of the Laboratory of Fibre and Cellulose Technology at ÅA is used
to study the effect of refining on fibers under conditions similar to the industry. The refiner
operates at low consistency (LC), i.e. 2 to 7 weight-% at a batch, which is normally 50 l. The
ProLabTM – system consists of a pulper, a mixer, a stock feed pump, a refiner, sampling and control
equipment (Figure 24). The refiner has six automatic valves that deliver pulp samples at pre-
selected specific energy (SEC). Pulp from the refiner outlet passes the sampling valves and is
recycled to the screw mixer.
Figure 24: ProLabTM schematics (Lundin, 2008).
Idle power consumption was determined for each filling separately with water at fully open bar
clearance at the rotation speed and volume flow of water used in the experiment. The physical
touchpoint of the fillings was defined as the position when the rotor and stator makes contact and
was determined by an automatic zeroing-procedure where the refiner was run dry at 600 rpm.
The refiner closes the gap slowly and the touchpoint was recorded and stored as the zero point
when a specific vibration level was reached where the refiner takes the fillings apart. Refiner
vibration levels were measured with a touchpoint vibration detector (TVD).

Erik Sjöström
37
The refiner load is controlled by adjusting the gap between the rotor and stator fillings. Automatic
or manual control can be used. Automatic power control targets a specified refiner load and
adjusts the gap accordingly. Operating parameters and dimensions for the ProLabTM are found in
Table 2.
Table 2: ProLabTM laboratory refiner operational parameters (conical fillings) (Lundin, 2008).
Parameter Value
Refiner Power (kW) 30
Rotor diameter, min-max (mm) 52–126
Pulp consistency (wt-%) 2–7*
Pulp flow (L/min) 50–120
Pulp feeding pressure (bar) 0.1–6.0
Rotational speed (1/min) 600–4500**
Peripheral speed, d1 (m/s) 1.6–12.3
Peripheral speed, d2 (m/s) 4.0–29.7
SEC/batch (kwh/t) 10–45*
SEL (J/m) 0.1–5.0*
SSL(J/m2) 19–951*
*depending on fillings and pulp.
** Motor capacity, ProLabTM interface only allows 600–3500rpm.
***d1 is the small end of the rotor and d2 is the wider end.
8.3.2 Pulp preparation
Dried pulp was easily weighed to targeted dry mass amount with around 0.1% accuracy after
accustoming to a low humidity level (around 4% humidity). The dried pulp was then disintegrated
in the ProLabTM’s pulper for 15 minutes before the tests. The never-dried pulp was more
challenging to get to correct refining consistency, since pulp in their containers had a high
difference in moisture levels depending whether the pulp was at the bottom of the container or
on the top (sedimentation and phase separation during storing). Due to the high solids content,
the pulp couldn’t be mixed right away in their containers. Water was added to decrease the pulp

Erik Sjöström
38
consistency. By using a hand mixer the pulp was stirred before a sample was taken for a reliable
consistency measurement.
8.3.3 Fillings
New fillings are given a sand treatment procedure to make the fillings fit better to each other and
to even out manufacturing flaws. This procedure also wears the bar edges so excessive fiber
cutting doesn’t happen.
The fillings used were designed by Valmet Oy and manufactured partially or completely by Valmet
or their subcontractors. Fillings for the ProLabTM are either produced by completely metal casting
or by attaching a 3D- printed bar surface to a casted frame.
Fillings used in the experiments were of types SFD, SM and LAB-13. LAB-13 is a newly designed
filling for MFC production with an extremely high cutting length. SM (short medium) had the
shortest cutting length of the fillings. SF (Short fiber), which became SFD (SF with dams) and the
LAB-13 fillings are both made by 3D printing the bar surfaces and share the same stator frame. A
new rotor frame had to be made specifically for the LAB-13 due to the practical reason that the
fastening screws on the frame were to unreliable to open. Specifics for the fillings can be found in
Table 3.
Table 3: Cutting edge length for fillings.
Name of filling Cutting length km/rev
SF & SFD 0.249
LAB-13 0.900
SM 0.173
8.3.4 Preliminary tests
Preliminary experiments were performed prior to the actual test period. These tests were done to
explore how the ProLabTM performs when refining pulp far longer time than ever previously
refined with this device. Problems such as overheating or refining load drop prior to reaching a
material that could be considered as MFC were evident. The role of hornification of fibers was
Erik Sjöström
39
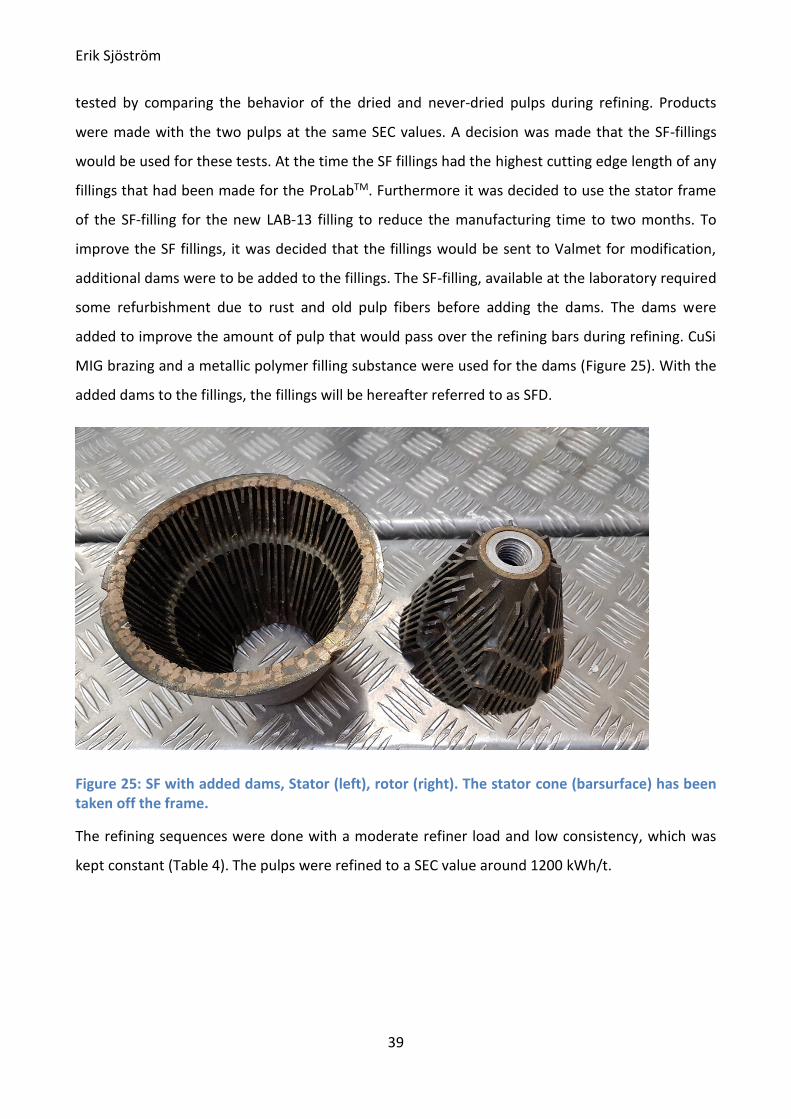
tested by comparing the behavior of the dried and never-dried pulps during refining. Products
were made with the two pulps at the same SEC values. A decision was made that the SF-fillings
would be used for these tests. At the time the SF fillings had the highest cutting edge length of any
fillings that had been made for the ProLabTM. Furthermore it was decided to use the stator frame
of the SF-filling for the new LAB-13 filling to reduce the manufacturing time to two months. To
improve the SF fillings, it was decided that the fillings would be sent to Valmet for modification,
additional dams were to be added to the fillings. The SF-filling, available at the laboratory required
some refurbishment due to rust and old pulp fibers before adding the dams. The dams were
added to improve the amount of pulp that would pass over the refining bars during refining. CuSi
MIG brazing and a metallic polymer filling substance were used for the dams (Figure 25). With the
added dams to the fillings, the fillings will be hereafter referred to as SFD.
Figure 25: SF with added dams, Stator (left), rotor (right). The stator cone (barsurface) has been taken off the frame.
The refining sequences were done with a moderate refiner load and low consistency, which was
kept constant (Table 4). The pulps were refined to a SEC value around 1200 kWh/t.
Erik Sjöström
40
Table 4: Refiner parameters.
Parameter name Value Unit
No-load 2.66 kW
Refiner load 5 kW
Pulp consistency 3 %
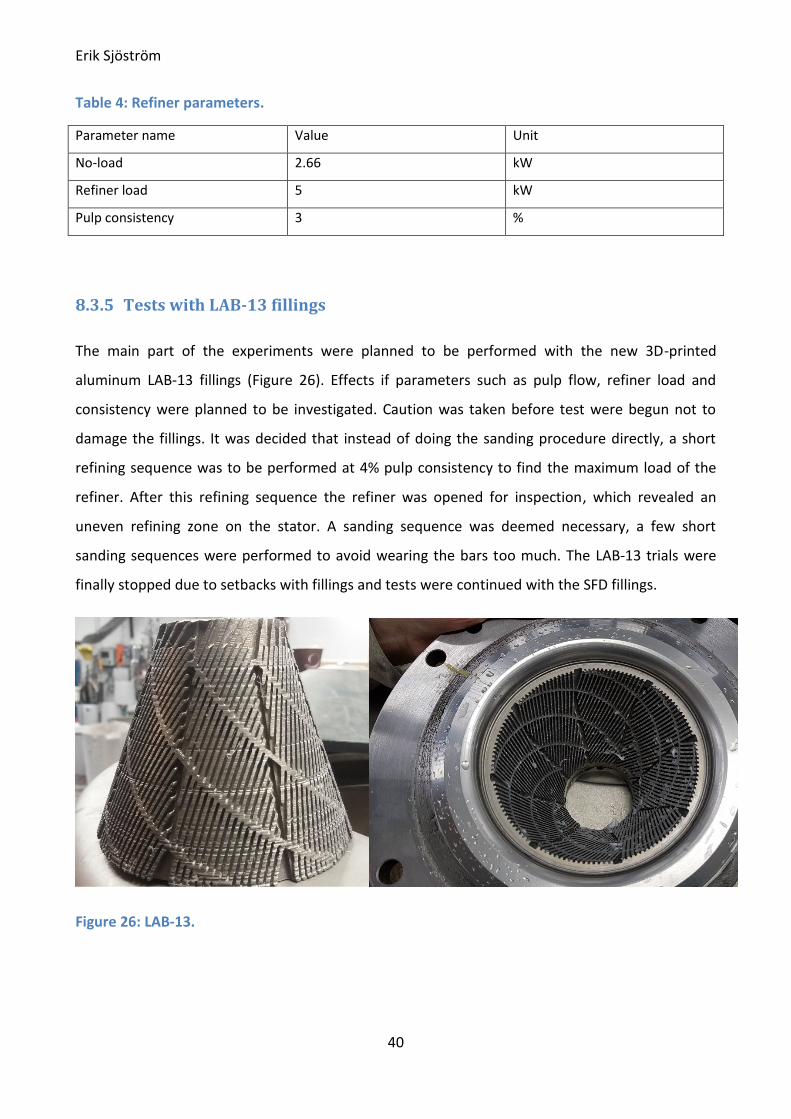
8.3.5 Tests with LAB-13 fillings
The main part of the experiments were planned to be performed with the new 3D-printed
aluminum LAB-13 fillings (Figure 26). Effects if parameters such as pulp flow, refiner load and
consistency were planned to be investigated. Caution was taken before test were begun not to
damage the fillings. It was decided that instead of doing the sanding procedure directly, a short
refining sequence was to be performed at 4% pulp consistency to find the maximum load of the
refiner. After this refining sequence the refiner was opened for inspection, which revealed an
uneven refining zone on the stator. A sanding sequence was deemed necessary, a few short
sanding sequences were performed to avoid wearing the bars too much. The LAB-13 trials were
finally stopped due to setbacks with fillings and tests were continued with the SFD fillings.
Figure 26: LAB-13.
Erik Sjöström
41
8.3.6 MFC production with SFD-fillings
Once the LAB-13 was considered not usable for the experiments, the SFD fillings were brought
back into use. The test plan was revised and a four part test plan was made (Table 5). The effects
of refiner load and pulp consistency were studied. High consistency refers in these runs to upper
consistency range 5–7%. High load refers to the maximum load the ProLabTM refiner could reach.
HCHL was planned to be run at 5% consistency but due to difficulties to measure the consistency
of the never-dried pulp it started with a 6.1% consistency. The pulp was diluted during the test to
reduce pressure in the refiner. The overpressure was due to the viscosity increase of the pulp. The
ProLabTM has a maximum pressure limit of six bar, but the control system automatically takes the
fillings apart at five bar (Table 2). During the HCHL test, the consistency had to be diluted twice to
reduce pressure. The final consistency was 4.1%. The HCHL refining sequence was paused for
approx. 1 hour due to the temperature rising to the upper limit of 75 °C. In both HL sequences the
refiner load was raised up to 10 kW. At this point, the vibration level was too high and the TVD
took the fillings apart. Therefore, the TVD’s sensitivity was lowered to the minimum to allow
increasing the load further, but with no success. As the refining went further the load had to be
decreased to avoid the fillings to touch.
Table 5: Refining classification according to refining parameters.
Sample Definition Starting
consistency
SEC cumulative (kWh/t) at
the end
HCHL High consistency, high load 6.1% 2500
LCHL Low consistency, high load 3.5% 2000
HCLL High consistency, low load 5.5% 500
LCLL Low consistency, low load 3.5% 500
8.3.7 Pilot trials
Pilot trials were carried out at the pilot plant in Inkeroinen using a JC-01 refiner, equipped with a
400 kW motor. Valmet has a smaller sized product, the JC-0, which would use less material. Due to
the high popularity of the JC-01 in the industry, the pilot plant has a JC-01.
Erik Sjöström
42
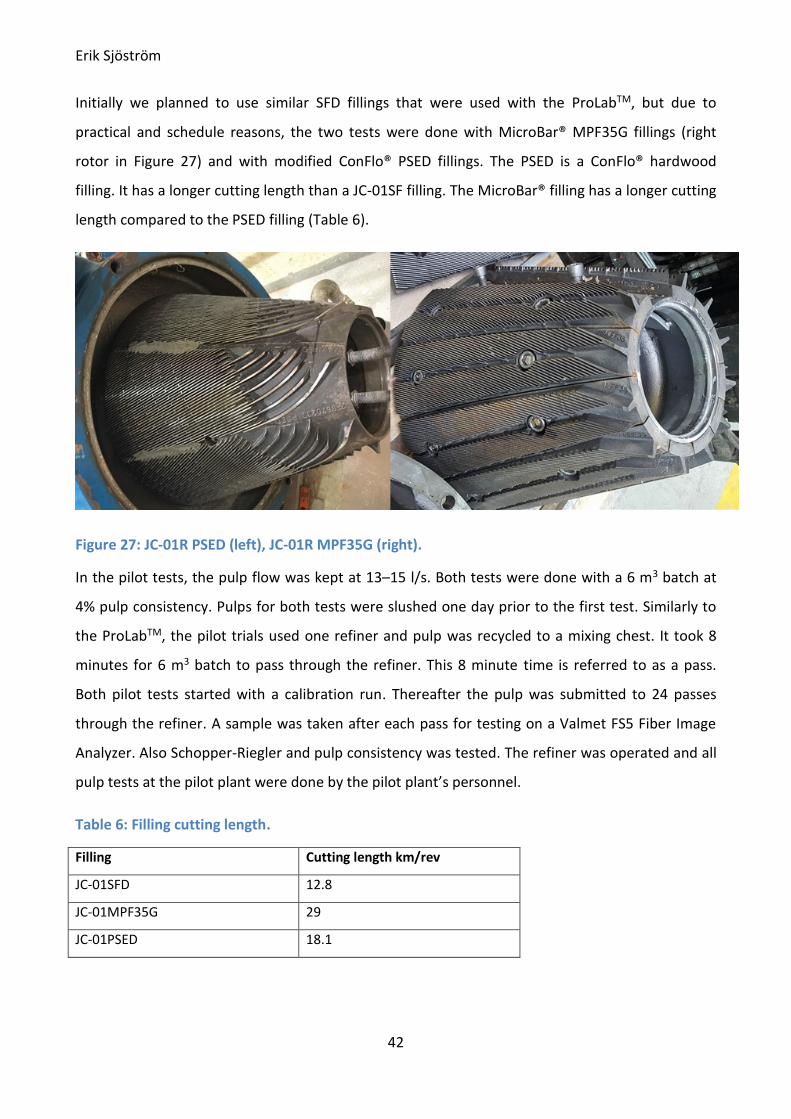
Initially we planned to use similar SFD fillings that were used with the ProLabTM, but due to
practical and schedule reasons, the two tests were done with MicroBar® MPF35G fillings (right
rotor in Figure 27) and with modified ConFlo® PSED fillings. The PSED is a ConFlo® hardwood
filling. It has a longer cutting length than a JC-01SF filling. The MicroBar® filling has a longer cutting
length compared to the PSED filling (Table 6).
Figure 27: JC-01R PSED (left), JC-01R MPF35G (right).
In the pilot tests, the pulp flow was kept at 13–15 l/s. Both tests were done with a 6 m3 batch at
4% pulp consistency. Pulps for both tests were slushed one day prior to the first test. Similarly to
the ProLabTM, the pilot trials used one refiner and pulp was recycled to a mixing chest. It took 8
minutes for 6 m3 batch to pass through the refiner. This 8 minute time is referred to as a pass.
Both pilot tests started with a calibration run. Thereafter the pulp was submitted to 24 passes
through the refiner. A sample was taken after each pass for testing on a Valmet FS5 Fiber Image
Analyzer. Also Schopper-Riegler and pulp consistency was tested. The refiner was operated and all
pulp tests at the pilot plant were done by the pilot plant’s personnel.
Table 6: Filling cutting length.
Filling Cutting length km/rev
JC-01SFD 12.8
JC-01MPF35G 29
JC-01PSED 18.1
Erik Sjöström
43
8.4 Pulp and fiber
Samples taken during the refining tests were tested for their Schopper-Riegler value (°SR), fiber
length with a Kajaani FiberLab Analyzer, hand sheet tensile strength, light microscopy, water
retention value (WRV), and mechanical and optical test for cast films. Standards used for testing
can be found in Table 7. The refined product was also tested for its capability to increase tensile
strength in paper by doing a blend of 20% of the refined pulp with non-refined pulp. Cast films
were tested for mechanical and optical properties at Aalto University. These tests were performed
and reported by Veikko Sajaniemi in his thesis.
Table 7: Standards used for testing.
Pulp characterization Standard
Schopper-Riegler ISO 5267-1:1999
Viscosity (cup and bob measuring gap adjusting) ISO 3219 & DIN 53019-1
Laboratory sheet preparation ISO 5269-1
Tensile strength test for lab sheets ISO 1924-3
8.4.1 Schopper-Riegler
Schopper-Riegler (°SR) tests were performed using tap water that was stored in a 20 l bucket with
a measured temperature ranging from 20°C to 21°C. Due to the °SR value increasing above the
standard’s limits, the °SR tests were done for some samples with half the pulp amount (1g/l) used
in the standard.
8.4.2 Microscopy
Wet samples were studied under a light microscope with 4 times and 10 times magnification using
a Nikon eclipse E200 telescope available at Åbo Akademi University. A few samples were studied
with 40 and 100 times magnification, which required that samples be dried. Pictures were also
taken with a scanning electron microscope (SEM) by Veikko Sajaniemi at Aalto University.
Erik Sjöström
44
8.4.3 Kajaani Fiberlab
Samples from the ProLabTM were analyzed with the Fiberlab to gain insight into how much fines
material was generated. Fiber length and fiber fractions were observed.
8.4.4 Rheology measurements
Viscosity and shear stress measurements were performed for pulp samples at 3% consistency.
Samples were prepared by diluting MFC samples into 100 ml batches. Samples were left to warm
up to room temperature before the tests. The tests were done on a Physica MCR 300 Modular
compact rheometer at the Laboratory of Paper Coating and Converting, at Åbo Akademi
University. The geometry used was a concentric cylinder measuring head CC 27. Tests were run at
25 °C first with an oscillation measurement frequency sweep, from 0.1 to 100 Hz at fixed
amplitude of 1%. After that a small pause of 60 seconds was applied to ensure sample
stabilization. Thereafter a shear stress test with a shear rate sweep from 0.1 to 1000 s-1 was made.
8.4.5 Paper sheet tests
MFC was tested for its capability to increase paper strength by adding a fraction of MFC to pulp.
During the preliminary tests, paper sheets were made from mixtures of 20% of the produced MFC
with 80% unrefined pulp.
For the main MFC refining test, the main stock pulp was refined to 35 °SR, which corresponds to
the refining degree in papermaking. The goal was to investigate how much tensile strength
increase would be achieved with a small amount of MFC. The amounts of MFC added to the
refined pulp were 2.5% and 5%. MFC addition was also compared to a starch additive. The tensile
strength tests exhibited a great variance. Upon retesting some of the samples, it was noticed that
the way of mixing MFC into the stock pulp had a noticeable effect on the results (Table 8). The
method for the disintegration of MFC and the mixing procedure of MFC and stock pulp were not
fully optimized. This led to some degree of uncertainty with the results. In fact, the differences in
tensile strength were near the same order of magnitude as measured standard deviation of the
samples. If MFC is disintegrated poorly, it ends up as small “dots” in the sheets. To avoid this, MFC
was diluted with 200 ml of water and the mixture was stirred properly and then added to the
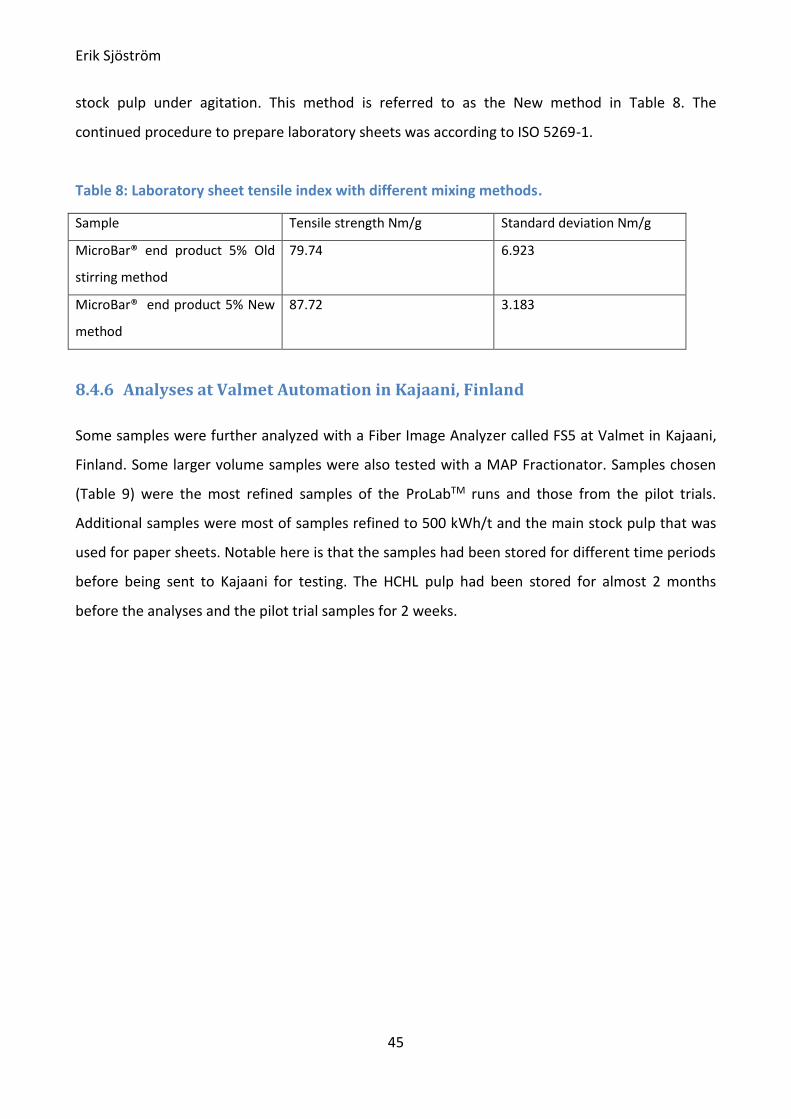
Erik Sjöström
45
stock pulp under agitation. This method is referred to as the New method in Table 8. The
continued procedure to prepare laboratory sheets was according to ISO 5269-1.
Table 8: Laboratory sheet tensile index with different mixing methods.
Sample Tensile strength Nm/g Standard deviation Nm/g
MicroBar® end product 5% Old
stirring method
79.74 6.923
MicroBar® end product 5% New
method
87.72 3.183
8.4.6 Analyses at Valmet Automation in Kajaani, Finland
Some samples were further analyzed with a Fiber Image Analyzer called FS5 at Valmet in Kajaani,
Finland. Some larger volume samples were also tested with a MAP Fractionator. Samples chosen
(Table 9) were the most refined samples of the ProLabTM runs and those from the pilot trials.
Additional samples were most of samples refined to 500 kWh/t and the main stock pulp that was
used for paper sheets. Notable here is that the samples had been stored for different time periods
before being sent to Kajaani for testing. The HCHL pulp had been stored for almost 2 months
before the analyses and the pilot trial samples for 2 weeks.

Erik Sjöström
46
Table 9: Samples analyzed by Valmet at Kajaani.
Sample SEC (kWh/t)
Paper refined 100
HCHL 500
HCHL 1000
HCHL 1500
HCHL 2000
HCHL 2500
LCHL 500
LCHL 1000
LCHL 1500
LCHL 2000
MPF35G 500
MPF35G 842
PSED 688
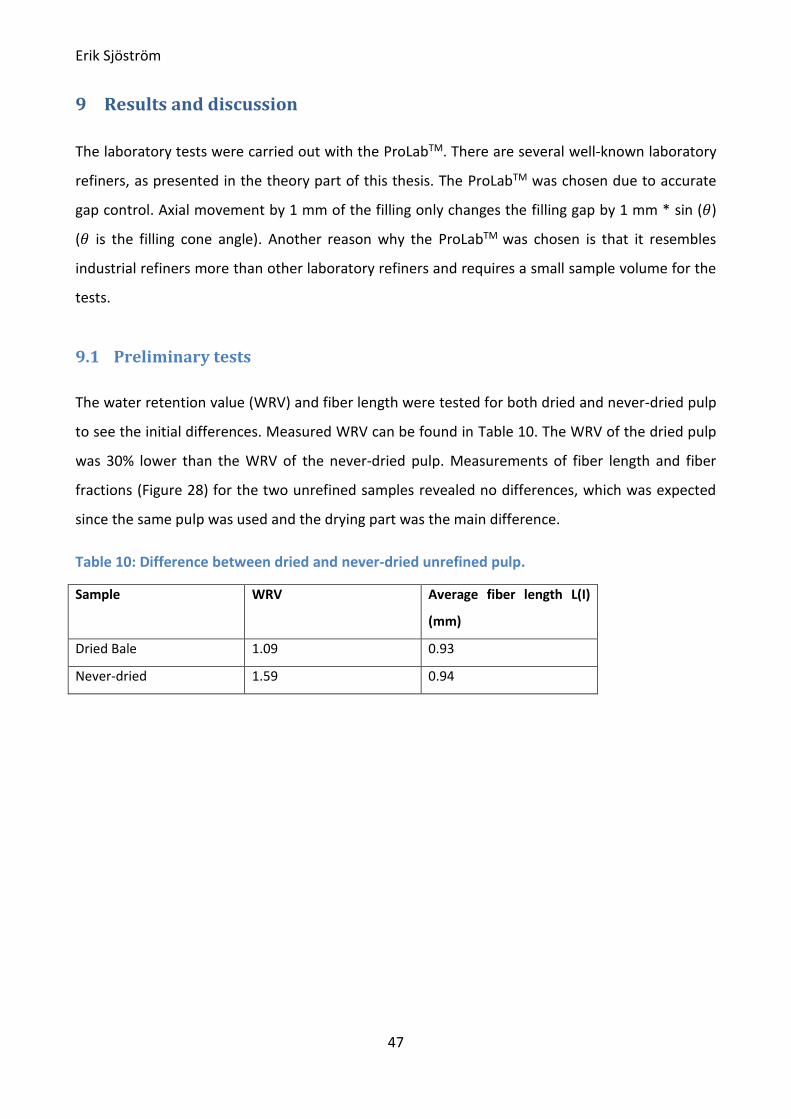
Erik Sjöström
47
9 Results and discussion
The laboratory tests were carried out with the ProLabTM. There are several well-known laboratory
refiners, as presented in the theory part of this thesis. The ProLabTM was chosen due to accurate
gap control. Axial movement by 1 mm of the filling only changes the filling gap by 1 mm * sin (𝜃)
(𝜃 is the filling cone angle). Another reason why the ProLabTM was chosen is that it resembles
industrial refiners more than other laboratory refiners and requires a small sample volume for the
tests.
9.1 Preliminary tests
The water retention value (WRV) and fiber length were tested for both dried and never-dried pulp
to see the initial differences. Measured WRV can be found in Table 10. The WRV of the dried pulp
was 30% lower than the WRV of the never-dried pulp. Measurements of fiber length and fiber
fractions (Figure 28) for the two unrefined samples revealed no differences, which was expected
since the same pulp was used and the drying part was the main difference.
Table 10: Difference between dried and never-dried unrefined pulp.
Sample WRV Average fiber length L(I)
(mm)
Dried Bale 1.09 0.93
Never-dried 1.59 0.94

Erik Sjöström
48
Figure 28: Fiber length fractions for unrefined samples.
The preliminary experiments using the SF-fillings with added dams (SFD) yielded promising
positive results for refining process. Based on previous experience on long refining sequences
performed with the ProLabTM, the reached refining degree was higher than anticipated at the start
of the experiments with the SFD fillings. The first tests were stopped at 1200 kWh/t due to filling
bar contact. The temperature and pressure increase were still in acceptable levels for the ProLabTM
refiner. The highly refined pulp was found to closely resemble a pulp that would be considered as
MFC. The Schopper-Riegler value was tested during the refining process to follow the refining
progress. At 700 kWh/t, the °SR had increased to above 90 °SR, which was above the reliable
result range of the Schopper-Riegler method. When the value rises above 90 °SR, some pulp
particles become so small that they pass through the mesh instead of being collected to the fiber
mat. This can be seen with the naked eye as cloudy water in the °SR tube. The °SR was considered
to be misleading when the value rose above the reliable limit. We tried to achieve values within
the proper range by reducing the pulp concentration by 50% to 1 g/l. This modification lowered
the °SR value by only 10 °SR units, which was not satisfactory. Fiber length measurements with
Fiberlab were found to give more useful results of the refining progress also at refining energy
higher than 700 kWh/t. Figure 29 shows the average fiber length development during the refining
process for dried and never-dried pulp and Figure 30 shows fiber length fractions. Dried pulp
seems to be refined to smaller pulp particles than never-dried.
2.2 2.29.9 11.2
68.2 69.4
16.9 13.8
2.4 2.40.5 0.9
0
20
40
60
80
100
120
Neverdried Dried bale
3.2 - 7.6mm
2.0 - 3.2mm
1.2 - 2.0mm
0.5 - 1.2mm
0.2 - 0.5mm
0.0 - 0.2mm

Erik Sjöström
49
Figure 29: Fiber length development measured with Fiberlab.
Figure 30: Fiber length fractions of refined never-dried and dried pulp.
The paper sheet tests using 20% of the highly refined pulp in unrefined pulp can be seen in Figure
31. In these tests the MFC was made of never-dried pulp. The addition of 20% MFC to unrefined
pulp increased the paper tensile strength by 27—35 Nm/g depending on the MFC refining amount.
However, 20% MFC was considered unrealistically high proportion in real production.
0
0.1
0.2
0.3
0.4
0.5
0.6
0.7
0.8
0.9
1
0 200 400 600 800 1000 1200
L(I)
mm
SEC (kwh/t)
Neverdried
Dried bale
28.9
44.0
55.8
52.4
15.33.6
0
20
40
60
80
100
120
Neverdried 1200 kWh/t Dried bale 1200 kWh/t
%
0.5 - 1.2mm
0.2 - 0.5mm
0.0 - 0.2mm
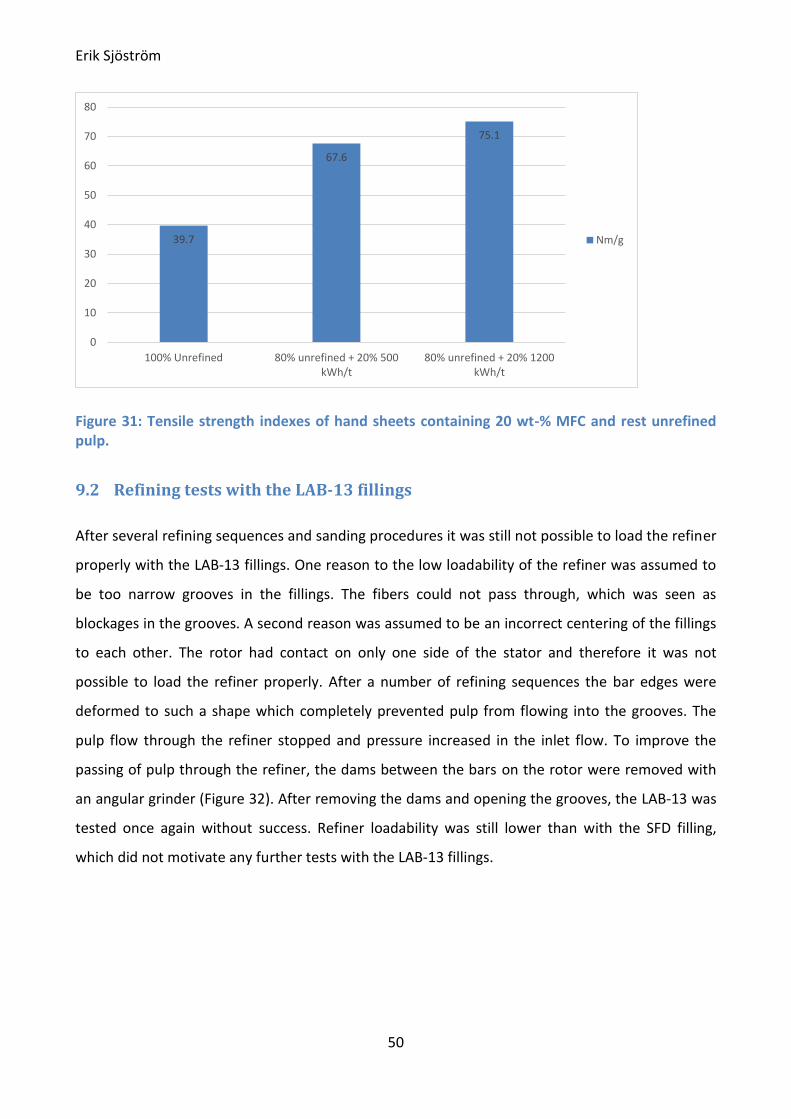
Erik Sjöström
50
Figure 31: Tensile strength indexes of hand sheets containing 20 wt-% MFC and rest unrefined pulp.
9.2 Refining tests with the LAB-13 fillings
After several refining sequences and sanding procedures it was still not possible to load the refiner
properly with the LAB-13 fillings. One reason to the low loadability of the refiner was assumed to
be too narrow grooves in the fillings. The fibers could not pass through, which was seen as
blockages in the grooves. A second reason was assumed to be an incorrect centering of the fillings
to each other. The rotor had contact on only one side of the stator and therefore it was not
possible to load the refiner properly. After a number of refining sequences the bar edges were
deformed to such a shape which completely prevented pulp from flowing into the grooves. The
pulp flow through the refiner stopped and pressure increased in the inlet flow. To improve the
passing of pulp through the refiner, the dams between the bars on the rotor were removed with
an angular grinder (Figure 32). After removing the dams and opening the grooves, the LAB-13 was
tested once again without success. Refiner loadability was still lower than with the SFD filling,
which did not motivate any further tests with the LAB-13 fillings.
39.7
67.6
75.1
0
10
20
30
40
50
60
70
80
100% Unrefined 80% unrefined + 20% 500kWh/t
80% unrefined + 20% 1200kWh/t
Nm/g

Erik Sjöström
51
Figure 32: LABR-13 with removed dams.
9.3 SFD fillings
The high load test refining sequences with the SFD filling yielded many positive results. The high
consistency and high load (HCHL) test started with higher consistency than initially planned. The
refining sequence started well as the refiner load could be increased to 10 kW. When the refiner
load was increased further the TVD monitor took the fillings apart due to too high vibration levels.
The consistency had to be lowered a few times due to the viscosity increase, which increased the
system pressure to the upper limit where the monitor would take the fillings apart. For detailed
description on pressure and temperature increase see appendix 1.
Comparison of the refiner load development for HCHL and LCHL in Figure 33 shows that LCHL has a
steeper decrease of the load. This is probably due to the high consistency in the HCHL sequence,
which reduced the fiber development rate. The higher consistency made it impossible to load the
refiner more in the beginning of the refining. Notably the HCHL curve has a lot of development
(load going up and down due to refiner fillings taken apart), which is due to inexperience in
operating the ProLabTM at those conditions. The amount of data in the curve is reduced for better
representation. The high consistency also probably made fibers less refined per pass through the
refiner. Thus it took a longer time to reach the same refining degree as for the LCHL. The high
consistency made that there were more fiber to fiber contact. Lower consistency has more metal
to fiber contact, which results in a more rough and intensive treatment for the fibers.

Erik Sjöström
52
Figure 33: Refiner load at cumulative SEC.
Optical microscope pictures taken from the refined pulp showed that the pulp had almost
completely been fibrillated by the end of the HCHL and LCHL refining sequences. The optical
microscope (Figure 34 a) could recognize fibril widths to around 1 µm with some uncertainty,
whereas the SEM could recognize fiber widths to a few hundred nm (Figure 34 b).
Figure 34: a) Optical 100 times zoom of HCHL 2000 kWh/t (left) and b) SEM-image of HCHL 2500 kWh/t taken by Veikko Sajaniemi.
Mixing a small percentage of the produced MFC into the refined reference pulp increased the
tensile strength by 5—10 Nm/g (6%—14%). Figure 35 and Figure 36 show the paper tensile
0
2
4
6
8
10
12
0 500 1000 1500 2000 2500
kW
kWh/t
LCHL
HCHL
HCLL
LCLL
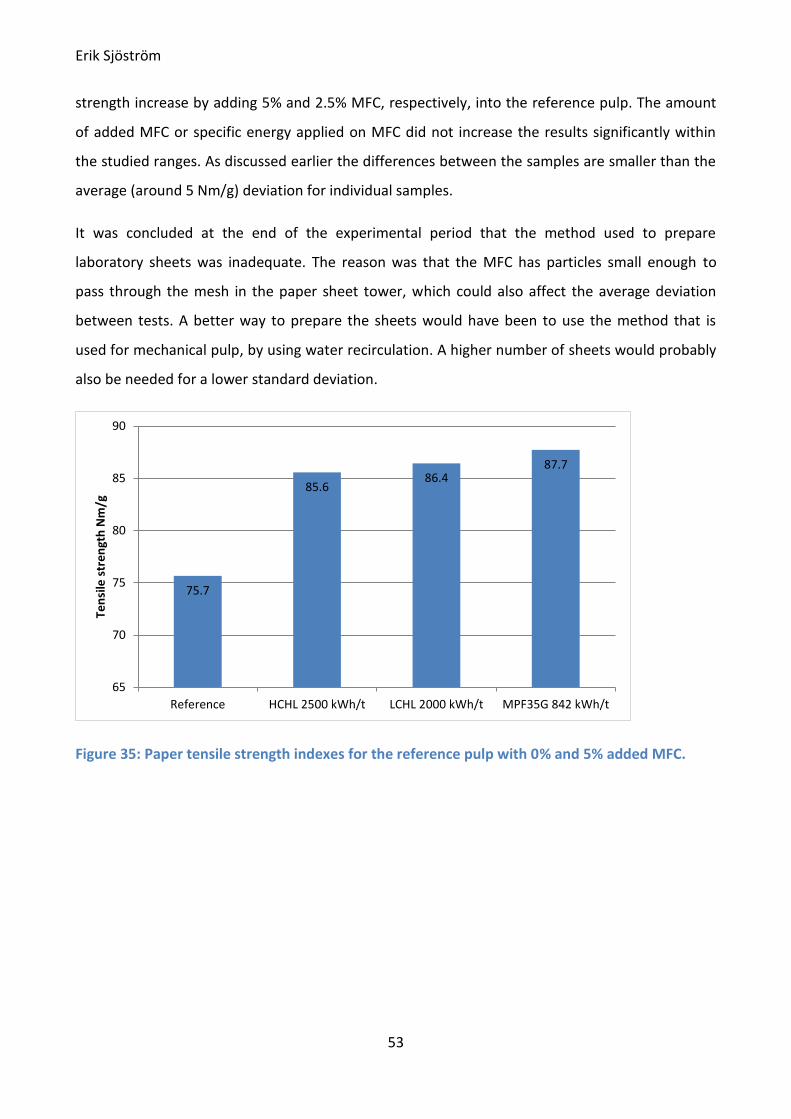
Erik Sjöström
53
strength increase by adding 5% and 2.5% MFC, respectively, into the reference pulp. The amount
of added MFC or specific energy applied on MFC did not increase the results significantly within
the studied ranges. As discussed earlier the differences between the samples are smaller than the
average (around 5 Nm/g) deviation for individual samples.
It was concluded at the end of the experimental period that the method used to prepare
laboratory sheets was inadequate. The reason was that the MFC has particles small enough to
pass through the mesh in the paper sheet tower, which could also affect the average deviation
between tests. A better way to prepare the sheets would have been to use the method that is
used for mechanical pulp, by using water recirculation. A higher number of sheets would probably
also be needed for a lower standard deviation.
Figure 35: Paper tensile strength indexes for the reference pulp with 0% and 5% added MFC.
75.7
85.686.4
87.7
65
70
75
80
85
90
Reference HCHL 2500 kWh/t LCHL 2000 kWh/t MPF35G 842 kWh/t
Ten
sile
str
en
gth
Nm
/g

Erik Sjöström
54
Figure 36: Paper tensile strength indexes for the reference pulp with 0% and 2.5% added MFC.
Fiber measurements at Kajaani, Finland shows the fiber length fraction development and Fines A%
development for the LCHL refining sequence with ProlabTM (Figure 37 and Figure 38). Fines A%
describes flake-like fines (type A) as percentage of the projection area of measured particles.
Particles shorter than 0.2 mm are included in fines A. The fines A parameter, which the FS5
measures is a good indicator of how far the refining has developed according to Valmet’s analyzing
experts in Kajaani, Finland.
Figure 37: LCHL fiber fraction development, measured with a FS5 in Kajaani.
75.7
84.2
80.6
89.6
65
70
75
80
85
90
Reference HCHL 2500 kWh/t LCHL 2000 kWh/t MPF35G 842 kWh/t
Ten
sile
str
en
gth
Nm
/g
0 %
10 %
20 %
30 %
40 %
50 %
60 %
70 %
80 %
90 %
100 %
Reference LCHL 500kWh/t
LCHL 1000kWh/t
LCHL 1500kWh/t
LCHL 2000kWh/t
1.2-7.6 mm
0.6-1.2 mm
0.2-0.6 mm
0.0-0.2 mm

Erik Sjöström
55
Figure 38: LCHL fines A% development, measured with a FS5 in Kajaani.
9.4 Pilot trials
The pilot trials with the JC-01 refiner, with parameter comparisons between the JC-01 refiner and
ProLabTM can be found in Table 10.
Two sets of fillings were used at the pilot plant. The MPF35G fillings reached higher SEC than the
PSED fillings. Consequently, the MPF35G test results were compared to the ProLabTM test results.
Table 11: Refiner specifications for ProlabTM and JC-01.
Parameter ProLabTM SFD JC-01 MicroBar®
Diameter 1 52 mm 268 mm
Diameter 2 121 mm 495 mm
Peripheral speed 1 8.2 m/s 16.8 m/s
Peripheral speed 2 19 m/s 31.1 m/s
Cone angle 18.4° 10–30°
Volume 0.05m3 6m3
Volume flow 1 l/s 15 l/s
The biggest surprise of the pilot plant tests were the fast drop of the refiner’s loadability. Due to
this fact, the pilot trials did not reach SEC values over 1000 kWh/t. The specific edge load (SEL) for
the pilot trials is compared to the high load trials with the ProLabTM in Figure 39. The figure shows
19.8
50.1
71.8
83.9
90.4
0
10
20
30
40
50
60
70
80
90
100
Reference LCHL 500 kWh/t LCHL 1000 kWh/t LCHL 1500 kWh/t LCHL 2000 kWh/t
%

Erik Sjöström
56
that the SEL value drops faster and steeper than with ProLabTM. Furthermore, the SEL drops lower
than what the lowest value of the high load trials. This may be due to extensive fiber cutting in the
pilot trials or it may be due to differences in the geometry of the fillings.
Differences were found between the pilot plant fillings (MPF35G and PSED). The MicroBar®
MPF35G filling could be loaded longer with higher load than the PSED. Notably the PSED filling had
a constant decline whereas the MPF35G has a flat line from the start before decreasing. This flat
line is due to technical restrictions, the nominal motor power of the pilot plant refiner is 400 kW,
which was too small for this experiment. The MPF35G was initially loaded to 350 kW and kept at
that level to avoid damaging the motor by operating at full power.
Figure 39: Specific edge load development for ProlabTM and JC-01.
The pilot plant had an FS5 analyzer, which was used to analyze samples taken from each pass. The
results from the pilot plant FS5 should not be compared to those of the Fiberlab or the FS5 used in
Kajaani, Finland, since the settings may be different for how small particles are measured. Passes
21 and 23 were not measured due to the small differences and to save time.
0.00
0.10
0.20
0.30
0.40
0.50
0.60
0.70
0 500 1000 1500 2000
SEL
J/m
kWh/t
HCHL
LCHL
MPF35G
PSED
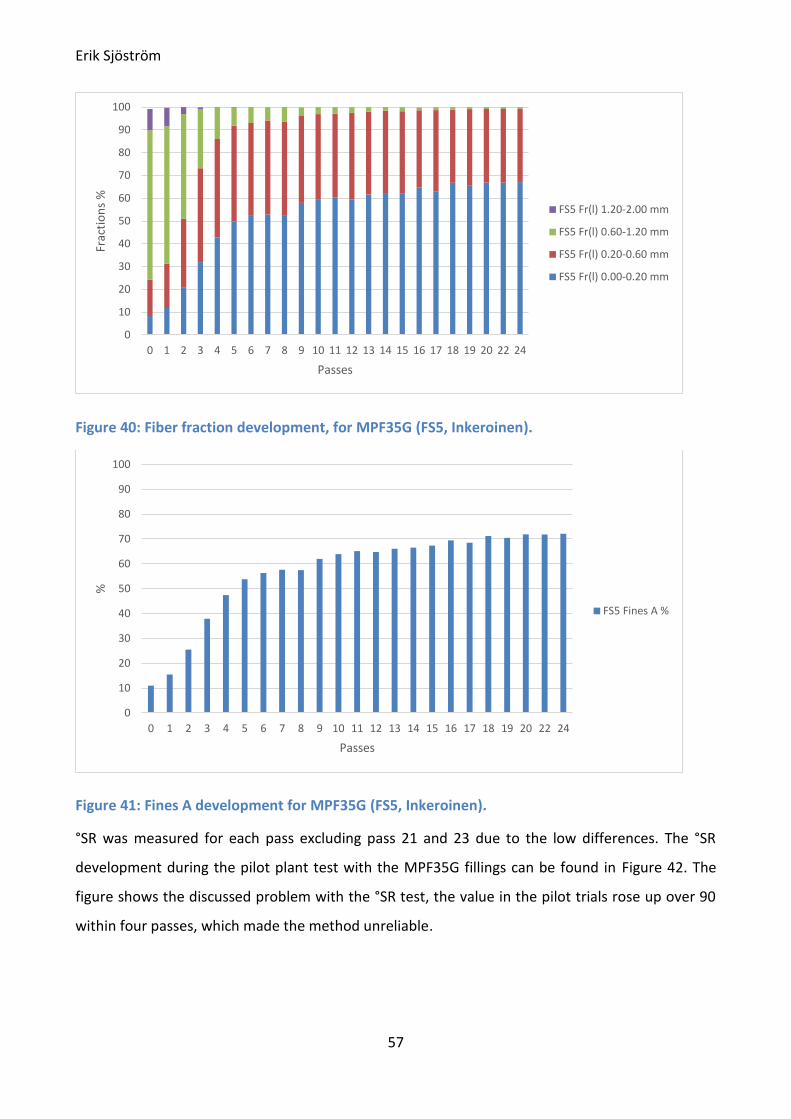
Erik Sjöström
57
Figure 40: Fiber fraction development, for MPF35G (FS5, Inkeroinen).
Figure 41: Fines A development for MPF35G (FS5, Inkeroinen).
°SR was measured for each pass excluding pass 21 and 23 due to the low differences. The °SR
development during the pilot plant test with the MPF35G fillings can be found in Figure 42. The
figure shows the discussed problem with the °SR test, the value in the pilot trials rose up over 90
within four passes, which made the method unreliable.
0
10
20
30
40
50
60
70
80
90
100
0 1 2 3 4 5 6 7 8 9 10 11 12 13 14 15 16 17 18 19 20 22 24
Frac
tio
ns
%
Passes
FS5 Fr(l) 1.20-2.00 mm
FS5 Fr(l) 0.60-1.20 mm
FS5 Fr(l) 0.20-0.60 mm
FS5 Fr(l) 0.00-0.20 mm
0
10
20
30
40
50
60
70
80
90
100
0 1 2 3 4 5 6 7 8 9 10 11 12 13 14 15 16 17 18 19 20 22 24
%
Passes
FS5 Fines A %

Erik Sjöström
58
Figure 42: Schopper-Riegler development for the MPF35G filling.
9.5 Comparing the results from the measurements in Kajaani
Optical pictures taken with the FS5 device at Kajaani, Finland showed some differences in fiber
structures between the different refining sequences, which is seen in Figure 43 and Figure 45 for
the end product (last sample taken from refining sequences) and 500 kWh/t, respectively. Figure
43 shows that the LCHL sequence seems to be furthest refined, since only small particles can be
seen. Pulp produced with the PSED had clearly parts of whole fibers left. Comparing the LCHL to
the HCHL show a small difference in average fiber length to LCHL’s favor as the LCHL seem to have
only smaller particles. This is backed by the shorter fiber length even though HCHL had a higher
cumulative SEC (Figure 43). In the optical pictures HCHL has more clear black dots than LCHL,
which would confirm that the LCHL sequence had refined the pulp more intensively. Interestingly,
the optical picture of the MPF35G sample resembles that of HCHL quite a lot and though the
cumulative SEC of the MPF35G is less than half of that the HCHL. This is also confirmed as similar
values of Fines A between MPF35G and HCHL (Figure 44).Fines A for all the end products can be
found in Figure 44 and the Fines A for the 500 kWh/t samples can be found in Figure 46.
Comparing Figure 38 to Figure 44 shows that the MPF35G sample would correspond to LCHL at
1000 kWh/t.
16
54
8590 92 93 93 94 94 94 94 94 94 94 94 93 93 93 92 92 92 92 91
0
10
20
30
40
50
60
70
80
90
100
0 1 2 3 4 5 6 7 8 9 10 11 12 13 14 15 16 17 18 19 20 22 24

Erik Sjöström
59
Figure 43: Optical pictures of end products, FS5 Kajaani.
Figure 44: Fines A% for end products, FS5 Kajaani.
500 kWh/t was initially meant as a middle point for samples for comparison of the refining results
by the different means of loading and pulp consistency. The pilot plant trial with the MPF35G
showed that the filling is capable of producing highly refined pulp with lower SEC values compared
to the ProLabTM. The optical pictures taken in Kajaani in Figure 45 and the Fines A level in Figure 46
both reveal that the MPF35G has a clearly lower average particle size to the rest of the samples.
The PSED filling trial was excluded from these due to the low final cumulative SEC of that trial.
19.84
74.07
58.97
90.37 88.45
0
10
20
30
40
50
60
70
80
90
100
Reference MPF35G 842 kWh/t PSED 688 kWh/t LCHL 2000 kWh/t HCHL 2500 kWh/t
Fin
es A
%

Erik Sjöström
60
Figure 45: Optic pictures of 500SEC samples, FS5 Kajaani.
Figure 46: Fines A% for the 500 kWh/t samples, FS5 Kajaani.
9.6 Influence of measurements standards on fiber length value
The overall difficulty in measuring the average particle length for fibers is that there is no
definitive standard for measuring it. Tappi and ISO have their own standards, TAPPI has no lower
measuring limit whereas ISO has a lower fiber length limit at 0.2 mm. Measuring the fiber length
according to the two standards gives different values (Figure 47), and it should be clarified, which
19.84
59.22
50.11
41.3738.15 37.98
0
10
20
30
40
50
60
70
80
90
100
REF MPF35G LCHL HCHL LCLL HCLL
%
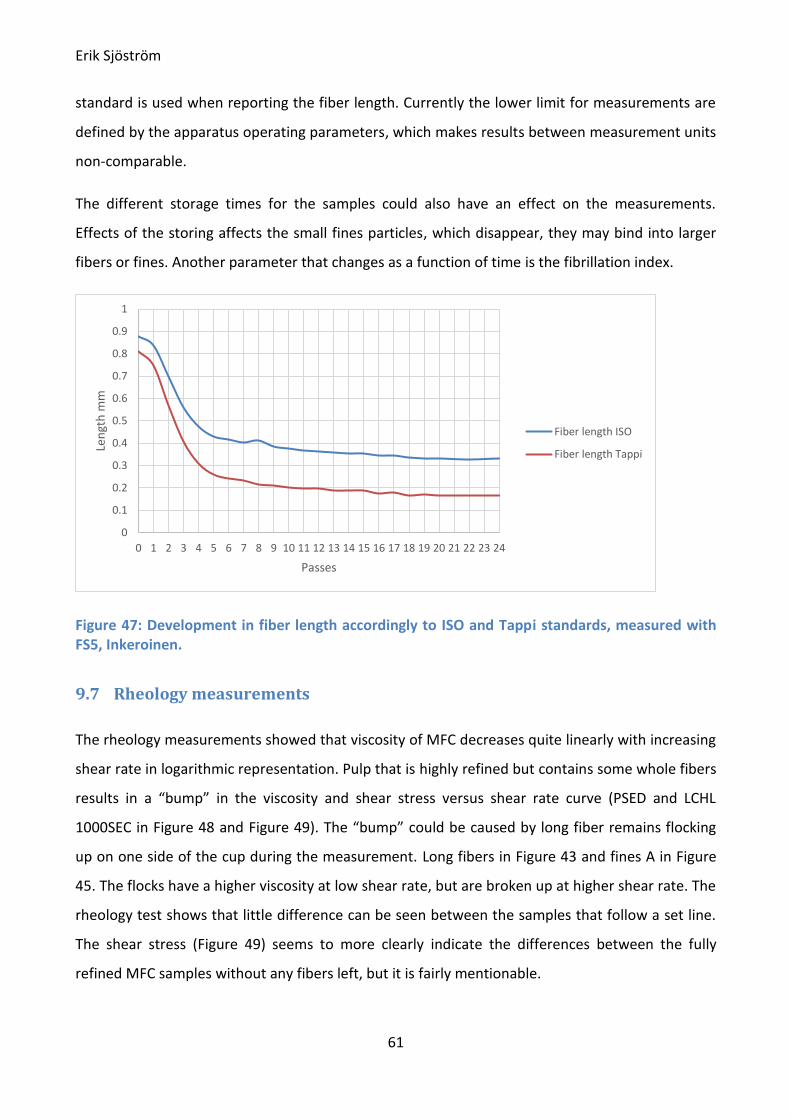
Erik Sjöström
61
standard is used when reporting the fiber length. Currently the lower limit for measurements are
defined by the apparatus operating parameters, which makes results between measurement units
non-comparable.
The different storage times for the samples could also have an effect on the measurements.
Effects of the storing affects the small fines particles, which disappear, they may bind into larger
fibers or fines. Another parameter that changes as a function of time is the fibrillation index.
Figure 47: Development in fiber length accordingly to ISO and Tappi standards, measured with FS5, Inkeroinen.
9.7 Rheology measurements
The rheology measurements showed that viscosity of MFC decreases quite linearly with increasing
shear rate in logarithmic representation. Pulp that is highly refined but contains some whole fibers
results in a “bump” in the viscosity and shear stress versus shear rate curve (PSED and LCHL
1000SEC in Figure 48 and Figure 49). The “bump” could be caused by long fiber remains flocking
up on one side of the cup during the measurement. Long fibers in Figure 43 and fines A in Figure
45. The flocks have a higher viscosity at low shear rate, but are broken up at higher shear rate. The
rheology test shows that little difference can be seen between the samples that follow a set line.
The shear stress (Figure 49) seems to more clearly indicate the differences between the fully
refined MFC samples without any fibers left, but it is fairly mentionable.
0
0.1
0.2
0.3
0.4
0.5
0.6
0.7
0.8
0.9
1
0 1 2 3 4 5 6 7 8 9 10 11 12 13 14 15 16 17 18 19 20 21 22 23 24
Len
gth
mm
Passes
Fiber length ISO
Fiber length Tappi

Erik Sjöström
62
Figure 48: viscosity in log-log scale.
Figure 49: Shear stress in log-log scale.
1.00E-01
1.00E+00
1.00E+01
1.00E+02
1.00E+03
1.00E+04
1.00E+05
1.00E-03 1.00E-02 1.00E-01 1.00E+00 1.00E+01 1.00E+02 1.00E+03
Vis
cosi
ty [
Pa*
s]
Shear Rate [s¯¹]
PSED 688 kWh/t
MPF35G 842 kWh/t
LCHL 2000 kWh/t
HCHL 2500 kWh/t
LCHL 1000 kWh/t
1.00E+00
1.00E+01
1.00E+02
1.00E+03
1.00E+04
1.00E-03 1.00E-02 1.00E-01 1.00E+00 1.00E+01 1.00E+02 1.00E+03
Shea
r St
ress
[Pa]
Shear Rate [s¯¹]
PSED 688 kWh/t
MPF35G 842 kWh/t
LCHL 2000 kWh/t
HCHL 2500 kWh/t
LCHL 1000 kWh/t

Erik Sjöström
63
9.8 Industrial MFC refining
The aim of this work was to investigate the possibility of producing microfibrillated cellulose by
refining alone without any pretreatments using enzymes or chemicals.
Data from the laboratory and pilot refining experiments clearly showed that MFC by mechanical
processing alone is possible.
The trials performed were all batch processes (full recirculation of pulp). Once pulp was refined it
was recirculated to a feed mixer or silo to cumulate refining energy to a targeted specific energy.
The pilot refining experiments showed that a 500 kWh/t refined pulp could be achieved with 5–6
passes through the pilot refiner equipped with the MPF35G fillings (Figure 50). The MPF35G fillings
could have been loaded even more during the pilot trial, if a bigger motor would have been
available. A bigger motor would mean that higher load could be applied earlier, which would lead
to a higher refining degree with fewer passes. Industrial 500 kWh/t MFC could be prepared with a
refiner setup containing 3–5 refiners in series. Alternatively, fewer refiners could be used if fillings
had high CEL and dams. The purpose of the dams is to reduce the hydraulic capacity. As
production is reduced it is easier to reach high energy input per pass.
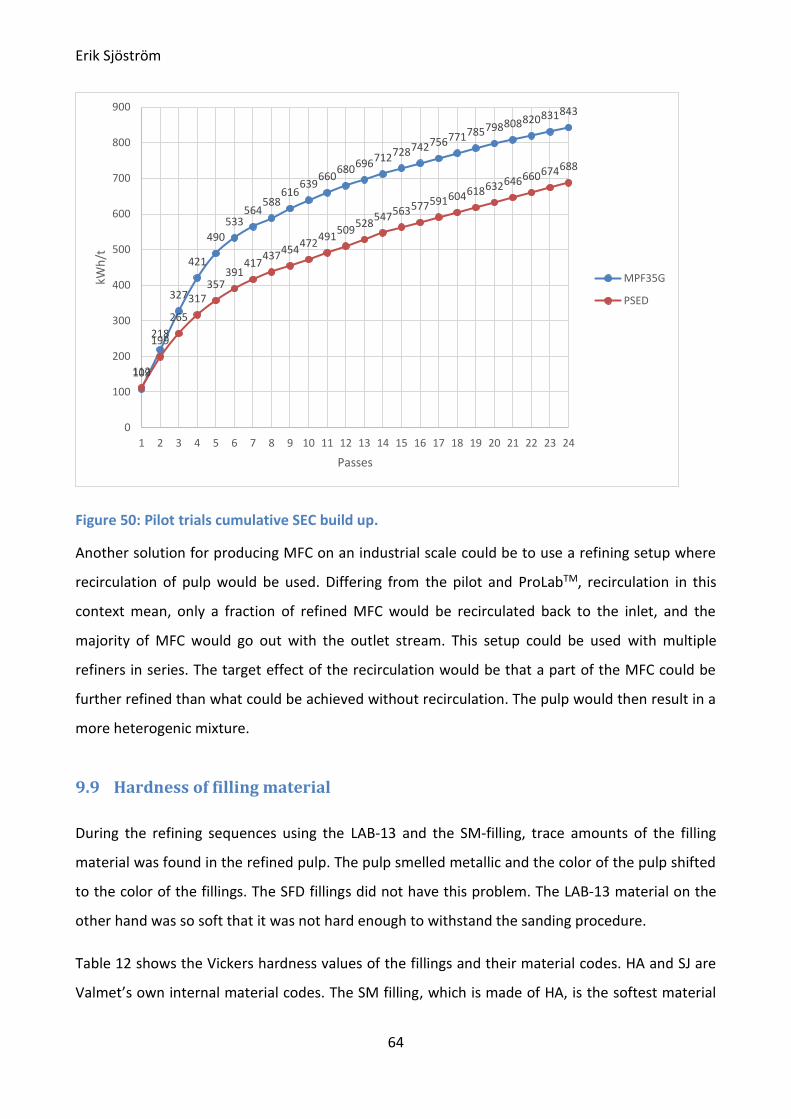
Erik Sjöström
64
Figure 50: Pilot trials cumulative SEC build up.
Another solution for producing MFC on an industrial scale could be to use a refining setup where
recirculation of pulp would be used. Differing from the pilot and ProLabTM, recirculation in this
context mean, only a fraction of refined MFC would be recirculated back to the inlet, and the
majority of MFC would go out with the outlet stream. This setup could be used with multiple
refiners in series. The target effect of the recirculation would be that a part of the MFC could be
further refined than what could be achieved without recirculation. The pulp would then result in a
more heterogenic mixture.
9.9 Hardness of filling material
During the refining sequences using the LAB-13 and the SM-filling, trace amounts of the filling
material was found in the refined pulp. The pulp smelled metallic and the color of the pulp shifted
to the color of the fillings. The SFD fillings did not have this problem. The LAB-13 material on the
other hand was so soft that it was not hard enough to withstand the sanding procedure.
Table 12 shows the Vickers hardness values of the fillings and their material codes. HA and SJ are
Valmet’s own internal material codes. The SM filling, which is made of HA, is the softest material
109
218
327
421
490
533564
588616
639660
680696712728742756771785798808820831843
112
199
265
317357
391417
437454
472491
509528
547563577591604618632646660674688
0
100
200
300
400
500
600
700
800
900
1 2 3 4 5 6 7 8 9 10 11 12 13 14 15 16 17 18 19 20 21 22 23 24
kWh
/t
Passes
MPF35G
PSED

Erik Sjöström
65
that Valmet uses. HA is used for deflakers and not for refiners. SJ is the most abundantly used
material for Valmet’s fillings. It suits for normal wear conditions and can be used in whole forged
conical fillings and segmented fillings. Both fillings at the pilot plant were made of SJ.
Table 12: Filling materials.
Filling Material Vickers Hardness HV
SF & SFD Steel alloy ~549
SM HA 200
LAB-13 AlSi10mg 120
PSED SJ 340
MPF35G SJ 340
Hardness of the fillings could play a big role for the economy of producing MFC by refining pulp. A
soft material like the HA, which colored the pulp indicates that the wear of the fillings is high.
Expenses on fillings would rise high with soft material if the wear on the fillings is high. In the
extreme conditions where MFC is produced (low bar clearance, bar touching and long refining
times) filling lifetime would be short. It could result in increased and more frequent production
downtime because fillings need to be changed to new ones. However, the pilot trials did not
notably change the smell or color of the pulp during the refining sequences so fillings made of the
SJ material may be unaffected. This may be different on industrial scale, as the refiners are not
monitored as closely as at the pilot plant where the operators were operating and monitoring the
refiner a few meters away. The refiner gap control has to be precise and reliable to refine the pulp
effectively and not allow fillings to touch each other and get damaged.
Filling material in the pulp would be regarded as contaminant and the MFC pulp would not be
unusable for example for the food industry or for food packaging paper or board.
Erik Sjöström
66
10 Conclusions and recommendations for future research
The objective of this study was to investigate if it is possible to produce microfibrillated cellulose
(MFC) by using a low consistency refiner and to do that as efficiently as possible. No
pretreatments of any kind on the pulp neither chemicals nor enzymes were used. Refining tests
were performed with ProLabTM and a RF-1 refiner. Finnish birch kraft pulp was used in all the tests.
According to the results, the refining progresses well until a refining degree of 500 kWh/t
cumulative specific energy was reached. From that point, the refining intensity is reduced and it
gets difficult and takes longer to refine the pulp further. This was most evident in the pilot trials
where the refining intensity dropped faster to a point where only little treatment energy per pass
was added to the pulp. The pilot trials with the MPF35G fillings reached to 843 kWh/t in 24 passes
but 500 kWh/t was reached already after 6 passes. The PSED reached to 688 kWh/t after 24
passes, the tests with the ProLabTM went as far as up to 2500 kWh/t.
The improvement of paper tensile strength achieved by increasing refining energy from 500 kWh/t
to 1000 kWh/t were small, which leads to the conclusion that refining pulp further than 500 kWh/t
is expensive and difficult. Once the refining intensity reduces, it becomes increasingly more
difficult to maintain the right refiner gap and metal contact is more likely to happen.
The MPF35G MicroBar® fillings used at the pilot plant performed more efficiently than the PSED
filling. According to fiber measurements, the product produced with the MPF35G was similar to
that produced in the ProLabTM trials. The MPF35G reached 500 kWh/t in 5–6 passes and could do
it in less passes with a bigger motor. Higher SEC values could be applied per pass if the hydraulic
pulp flow was lowered, which would make it possible to reach 500 kWh/t in 2–3 passes.
If 500 kWh/t is not enough then refining further than 500 kWh/t in a continuous process would
require more refiners in series. Another possibility would be to use a recirculation process with
constant inlet stream of unrefined pulp. The recirculation would affect the MFC product by adding
a higher average refining degree with the cost of a more heterogenic fiber pulp mix.
For future research, recommendations would be to test the newly made LAB-13 fillings made out
of bronze alloy, which were supposed to be tested but never were due to time limitations. The
sensitivity of the TVD sensor made operating the ProLabTM difficult. The TVD is currently too

Erik Sjöström
67
sensitive even on minimum settings. A lower sensitivity is required for fillings like the SFD. Some
coding is required for the ProLabTM to allow a wider range of flow rates in the system. Making
hand sheets with added MFC should be continued, but this time using recirculation of filtrate in
the sheet preparation as it is done during mechanical pulp testing.
Fractionating of produced pulp could be recommended as a research topic. A similar process as
the inter-stage screening in (Lemrini, et al., 2015) TMP process could be used. The refined pulp
would be screened and the screening accept (MFC) could be sent further while the reject (long
fibers) could be recirculated back to the refiner inlet.
Erik Sjöström
68
11 Sammanfattning – Swedish summary
Produktion av mikrofibrillerad cellulosa genom lågkonsistensmalning
Målsättningen med diplomarbetet var att undersöka möjligheten att tillverka mikrofibrillerad
cellulosa (MFC) med malning av fibrer i lågkonsistensmalning (LC-malning) utan förbehandlingar
med kemikalier eller enzymer. Slutmålet var att kunna visa möjligheter för tillverkning av MFC som
en industriell process. Konsistensens och motorintensitetens påverkan på malningsprocessen och
på slutproduktens egenskaper undersöktes.
Diplomarbetet utfördes i samarbete med Veikko Sajaniemi, studerande vid Aalto-universitetet.
Veikko fokuserade på olika användningar och egenskaper av MFC.
Mikrofibrillerad cellulosa (MFC) eller också cellulosananofibriller (CNF) är ett material som
uppfanns på 1980-talet. Idén var att mekaniskt behandla cellulosa så mycket att fibrerna nöts till
finmaterial. Produkten (MFC) kan användas som bindemedel i kartong eller som ett material för
ytbehandling av papper. Produktionen av och forskningen om MFC stod stilla i 20 år eftersom
produktionskostnaderna för MFC var höga på grund av stora energibehov i tillverkningen. Ny
teknik behövdes för att kunna producera MFC billigare och i större mängder. Under 2000-talet har
MFC och andra nanocellulosamaterial väckt intresse inom industrin och den akademiska världen.
Idag finns det flera olika producenter av MFC och CNF.
Malning av fibrer är en väsentlig del av papperstillverkningen. LC-malning innebär att massan som
mals innehåller 2–7 % fibrer i vatten. Det finns många olika malningsinstrument men majoriteten
av malningsinstrumenten är antingen koniska kvarnar eller skivkvarnar. Malningen sker i spalten
mellan en roterande rotor och en stationär stator. Malningen är en mekanisk behandling av fibrer
där fibrerna samlas upp på statorns bommar där de träffas och pressas av rotorns bommar. Malda
fibrer har större yta och binder sig starkare till varandra i jämförelse med omalda fibrer. Med
malda fibrer i papperstillverkning ökar man papprets styrka och papprets yta blir tätare.
Flera parametrar påverkar malningsresultatet i LC-malning. Den viktigaste parametern är motorns
effekt samt malgarnityrets utformning. Dessa bestämmer intensiteten fibrerna behandlas med.
Massans flödeshastighet, koncentration, temperatur och pH samt rotorgarnityrets
rotationsriktning påverkar malningen på olika sätt.

Erik Sjöström
69
Mönstren på garnityren har en stor påverkan på malningen och deras design är oftast planerade
för specifika malningsändamål. Beroende på om massan är av typen långfiber eller kortfiber
tillverkas garnityren med en särskild design. Kortfiber behöver smalare bommar och spår på
malningsgarnityret medan långfiber behöver bredare bommar och spår. Garnityr avsedda för
långfibrer kan inte användas för kortfibrer och vice versa. Kortfibrer kan inte belastas med breda
bommar och spår, långfibrer klipps av smala bommar och fastnar i smala spår.
Specifik energiförbrukning eller specifik malningsenergi (kWh/t) används för att styra
malningsprocessen till en viss grad. Den specifika kantbelastningen (J/m) beskriver
malningsintensiteten och fiberbehandlingen.
Försök i laboratorieskala utfördes med ProLabTM, medan försöken i pilotskala utfördes med en
Valmet RF-1-kvarn. Alla garnityr tillhandahölls av Valmet Oy. Endast koniska garnityr användes för
testerna. Specifik energiförbrukning, fiberlängd och Schopper-Riegler-maningsgrad (SR°) användes
för att övervaka malningsförsöken. Som råmaterial användes torkad och otorkad björksulfatmassa.
ProlabTM är en laboratoriekvarn tillverkad av Valmet Oy. Kvarnen motsvarar processtekniskt
kvarnar på industriell skala och används för att simulera malningar. ProlabTM är en satsvis kvarn
med en 30 kW motor. ProlabTM opereras oftast med en 50-literssats. Massan återcirkuleras till
inloppet efter malningszonen. För ProLabTM var det planerat att använda ett nyligen planerat och
producerat LAB-13-garnityr med en hög klipplängd (0,9 km/rev). Garnityret tillverkades av
aluminium med en 3D-skrivare. LAB-13-garnityret visade sig vara oanvändbart för experimenten
eftersom aluminium var ett för mjukt material. Garnityret slets så mycket i försöken att massan
färgades grå av aluminium. Garnityret sandades flera gånger och dammarna mellan bommarna på
rotorgarnityret togs bort för att förbättra garnityrets användbarhet. Ett SFD-garnityr med en
klipplängd på 0,249 km/rev togs framgångsrikt i användning efter att det beslutats att LAB-13 inte
duger till att använda för experimenten. SFD-garnityret var också tillverkat genom 3D-utskrift men
av ett hårt material som var bra för malningsförsöken. SFD-garnityret var ett gammalt SF-garnityr
med tillsatta dammar. Ursprungligen var SFD planerat att fungera som ett övningsgarnityr innan
malningarna med det nya LAB-13-garnityret.
Fyra huvudförsök planerades för att jämföra olika parametrars påverkan: HCHL (hög konsistens,
hög belastning), LCHL (låg konsistens, hög belastning), HCLL (hög konsistens, låg belastning) och
LCLL (låg konsistens, låg belastning). Med hög konsistens avses i detta fall 5–6 % fibrer i vatten och
Erik Sjöström
70
med låg konsistens 3 %. Med belastning menas huvudmotorns momentana effekt under
malningen. Temperaturökningen under försöken var hög och HCHL- och LCHL- försöken avslutades
när temperaturen steg till den övre gränsen för ProLabTM. Försöken med hög fiberkonsistens led av
ökat tryck inom systemet, särskilt HCHL-försöket. HCHL-försökets fiberkonsistens sänktes genom
utspädning med vatten. Flödeshastighet (60 l/min), motorns rotationshastighet (3000 rpm) och
rotationsriktning (pumpande) hölls konstanta under malningarna.
Under malningsförsöken med hög belastning belastades motorn på ProLabTM med upp till 10 kW i
början av malningen. Denna höga belastning var mycket mer än vad kvarnen tidigare hade
belastats med. En högre belastning kunde vara möjlig men vid 10 kW steg vibrationsnivåerna och
trycket i systemet till sina övre gränsnivåer.
Laboratorieresultaten tydde på att när mälden närmade sig en malningsgrad på 90 SR° började
malningsintensiteten minska signifikant. Det visade sig att vid början av malningen kan kvarnen
belastas högt men belastningen sjunker under malningens gång. Under malningens gång är det
viktigt att övervaka malspalten mellan rotorn och statorn. ProlabTM kördes så att kvarnens
styrsystem eftersträvade en konstant motorbelastning. När fibrerna maldes behövde kvarnen
minska på malspalten för att uppehålla motorbelastningen. Detta medförde en risk för att rotorn
och statorn att hamna i bomkontakt.
Den slutliga massan liknade en gelé eller ett mos i jämförelse med den ursprungliga fiber-vatten-
suspensionen. Massan hade inga hela fibrer kvar utan bara små fiberfragment fanns kvar.
Massaprov togs vid 500, 1000, 1500 och 2000 kWh/t. För att undersöka skillnaderna mellan
proven utfördes reologiska mätningar (viskositet och skjuvspänningar), fiberlängdmätningar,
Schopper-Riegler-malningsgradsmätningar och mikroskopering. Dessutom undersöktes hur
mycket pappersmassans styrka ökade vid en liten tillsats av den producerade MFC-mälden.
Schopper-Riegler-metoden som användes för att följa med malningens gång klarade inte av att
beskriva malningen när SR° steg över 90. Standardens gräns är 90 SR° och vid detta värde började
en del finmaterial passera igenom Schopper-Riegler-utrustningens vira. När finmaterial började
komma igenom sjönk Schopper-Riegler-värdet felaktigt.
MFC blandat i pappersark gav en ökning i arkets dragstyrka. Blandningar med 2,5 % och 5 % MFC i
pappersmassa undersöktes. Det visade sig att mellan olika prov med olika specifika malenergier
Erik Sjöström
71
var styrkeskillnaderna i arken låga. Spridningen i dragstyrkan i samma prov var hög och antagandet
var att blandningsmetoden av MFC i pappersmassan var otillräcklig. Även metoden att tillverka ark
var bristfällig då en del av den tillsatta MFC-massan passerade igenom viran på grund av den låga
partikelstorleken. Återcirkulation av filtratet borde ha använts för att få pålitligare resultat. Detta
används när ark tillverkas av mekanisk massa.
Efter testperioden med ProlabTM utfördes två malningsförsök i pilotskala i Inkeroinen: Ett försök
med ett ConFlo® PSED-garnityr och ett med ett MicroBar® MPF35G-garnityr. Kvarnen i Inkeroinen
var försedd med en 400 kW motor. Pilotförsöken kördes vid en 4 % fiberkonsistens. Pilotförsöken
visade tydligt att kvarnens lastbarhet sjunker då energiinsatsen är över 500 kWh/t. Malningen
nådde 842 kW/t med MPF35G-garnityret efter 24 pass, medan 500 kWh/t nåddes redan inom 5–6
pass. Den specifika energiförbrukningen kunde ha nått 500 kWh/t med färre passager, om man
valt att köra med en lägre produktion.
Jämfört med pilotskalemalningen, sjönk lastbarheten långsammare med ProLabTM.
Malningsintensiteten, eller den specifika kantbelastningen, förblev högre under hela malningens
gång med ProLabTM. Malningen kunde fortsätta upp till 2000 kWh/t, som nåddes efter två timmars
malning.
Malda massaprov analyserades av Valmet i Kajana, där Valmets fibermätutrustning (FS5 och MAP)
utvecklas och tillverkas. Prov från hela malningsförloppet gjorda med ProLabTM och några prov från
pilotförsöken analyserades. Alla prov analyserades med en FS5-fiberanalysator och några prov
även med en MAP-analysator. Fibrernas längdfördelningar och optiska bilder beskrev skillnaderna
mellan de olika proven. Enligt analyserna gav LCHL-malningen (låg konsistens, låg belastning) med
ProLabTM det bästa resultatet. LCHL-malningen skapade ett material där finmaterialets andel i det
längst malda provet var högst av alla försök. De optiska bilderna gav en klar skillnad mellan LCHL-
proven och de andra proven. Den låga konsistensen i provkörningen tillåter mera kontakt mellan
fibrer och garnityrbommarna, vilket leder till en mer intensiv behandling av fibrerna.
En viktig observation under arbetets gång var att garnityrbommarnas yta spelar en stor roll i MFC-
produktionen. Då MFC-malningen drivs så långt att den största delen är finmaterial är risken för
bomkontakt hög. Både under ProLabTM-försöken och pilotskalaförsöken förekom bomkontakt
mellan statorn och rotorn. När fibrerna och fiberfragmenten i mälden blir mindre blir
garnityrgapets styrning viktigare och kräver högre noggrannhet. Garnityren behöver vara av
Erik Sjöström
72
material som inte nöts snabbt vid bomkontakt och garnityren ska tåla malning vid höga
temperaturer.
Resultaten från de utförda experimenten visar att det är möjligt att producera mikrofibrillerad
cellulosa med LC-malning. Pilotförsöken visade att malningsintensiteten minskar tydligt då
energiinsatsen överstiger 500 kWh/t. De mätningarna som utfördes på pappersark och
viskositetsmätningarna visade att skillnaden mellan 500 kWh/t och högre energiinsatser inte
spelar en stor roll för massans egenskaper.
Processtekniskt kan man planera en linje för en kontinuerlig produktion av MFC ifall 500 kWh/t är
en tillräckligt hög energiinsats för MFC-produktion. Om man har flera kvarnar i serie och de är av
rätt design kan man nå upp till detta värde. Ifall ett garnityr med högre klipplängd än MPF35G-
garnityret används kan det vara möjligt att nå högre malningsgrader med färre kvarnar. En större
motor krävs i det första malningssteget, vilket bekräftades med MPF35G-garnityret.
Ifall 500 kWh/t inte är tillräckligt med malningsenergi, kan malningslinjen inkludera en
återcirkulation av mald massa. Massans malningsgrad kan ökas på bekostnad av dess homogenitet
om en del av massan återcirkuleras efter att den har malts i kvarnarna. En annan lösning kan vara
att använda en fiberfraktionering i malningslinjen för att separera större fibefragment från
finmaterialet.
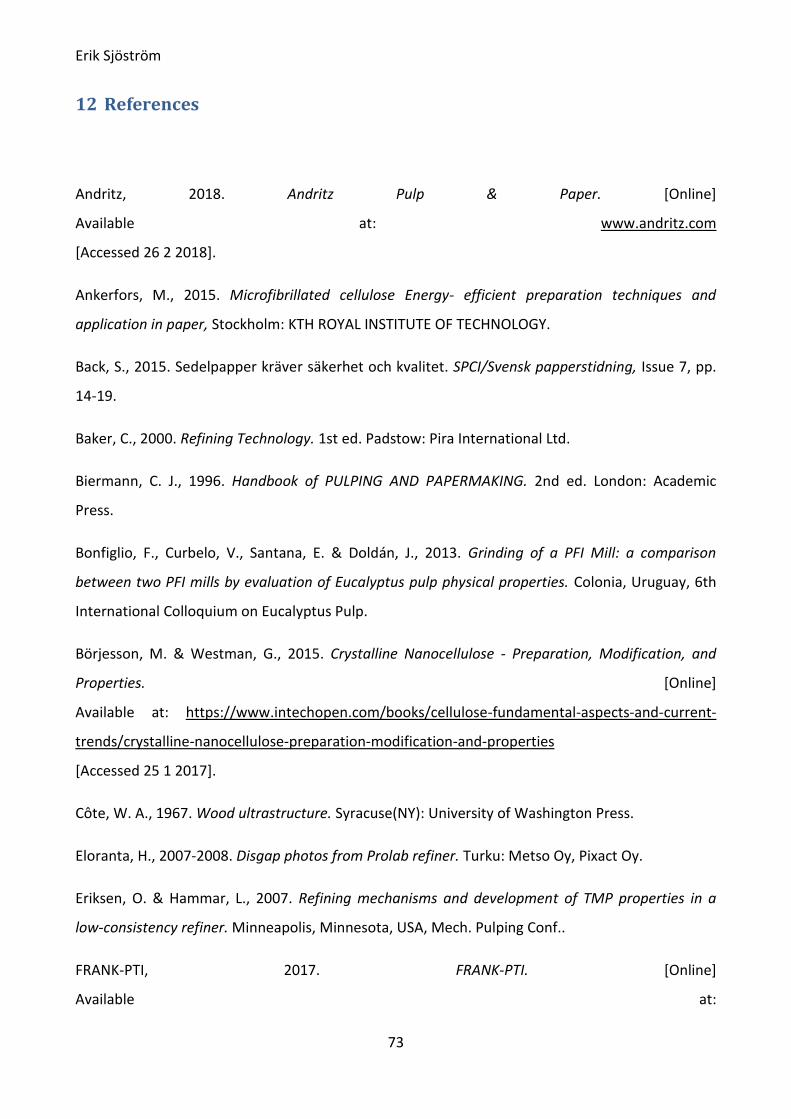
Erik Sjöström
73
12 References
Andritz, 2018. Andritz Pulp & Paper. [Online]
Available at: www.andritz.com
[Accessed 26 2 2018].
Ankerfors, M., 2015. Microfibrillated cellulose Energy- efficient preparation techniques and
application in paper, Stockholm: KTH ROYAL INSTITUTE OF TECHNOLOGY.
Back, S., 2015. Sedelpapper kräver säkerhet och kvalitet. SPCI/Svensk papperstidning, Issue 7, pp.
14-19.
Baker, C., 2000. Refining Technology. 1st ed. Padstow: Pira International Ltd.
Biermann, C. J., 1996. Handbook of PULPING AND PAPERMAKING. 2nd ed. London: Academic
Press.
Bonfiglio, F., Curbelo, V., Santana, E. & Doldán, J., 2013. Grinding of a PFI Mill: a comparison
between two PFI mills by evaluation of Eucalyptus pulp physical properties. Colonia, Uruguay, 6th
International Colloquium on Eucalyptus Pulp.
Börjesson, M. & Westman, G., 2015. Crystalline Nanocellulose - Preparation, Modification, and
Properties. [Online]
Available at: https://www.intechopen.com/books/cellulose-fundamental-aspects-and-current-
trends/crystalline-nanocellulose-preparation-modification-and-properties
[Accessed 25 1 2017].
Côte, W. A., 1967. Wood ultrastructure. Syracuse(NY): University of Washington Press.
Eloranta, H., 2007-2008. Disgap photos from Prolab refiner. Turku: Metso Oy, Pixact Oy.
Eriksen, O. & Hammar, L., 2007. Refining mechanisms and development of TMP properties in a
low-consistency refiner. Minneapolis, Minnesota, USA, Mech. Pulping Conf..
FRANK-PTI, 2017. FRANK-PTI. [Online]
Available at:

Erik Sjöström
74
https://www.frankpti.com/index.php?controller=dataset&function=show_detail&id=8
[Accessed 4 6 2018].
Hakkanen, P., 2018. Suomi elää puusta vielä pitkään. Suomi elää yhä metsästä, 29 6, p. 15.
J&L, 1994. Low consistency Refiner System Design Considerations. [Online]
Available at: http://www.jlfiberservices.com/pdf/vol6_no1.pdf
[Accessed 29 5 2018].
J&L, 2004. J&L Refining Services. [Online]
Available at: http://www.jlfiberservices.com/
[Accessed 27 2 2018].
Jansson, J., 2015. The influence of pH on fiber and paper properties. 1 ed. Karlstad: Karlstads
Universitet.
Jiming, T. & Sjöström, H., 2012. Enhancing refiner effiency, suzhou: Metso.
Johanson, A., 2011. Correlations between fibre properties and paper properties. 1 ed. Stockholm:
KTH Royal Institutte.
Kaihlanen, J., 2017. Stora Enso investoi liukoselluun ja kaupallistaa microkuitucellua. Maaseudun
Tulevaisuus, October 27(1), pp. 10-11.
Kerekes, R. J., 1990. Characterization of pulp refiners by a C-factor. Nordic Pulp&Paper Research
Journal, 5(1), pp. 3-8.
Kerekes, R. J., 2011. Force-based charcterization of refining intensity. Nordic Pulp and Paper
Research Journal, 26(1), p. 14–20.
Kumar, V., 2018. Materials and Methods. In: Roll-to-Roll Processing of Nanocellulose into Coatings.
Turku/ Åbo: Laboratory of Paper Coating and Converting, p. 29.
Lankford, A., 2001. Refining Refiners: New Conical Design. Pulp&Paper, Issue 2.
Lemrini, M.-M., Lanouette, R. & Michaud, G., 2015. Bioresources.com. [Online]
Available at: https://bioresources.cnr.ncsu.edu/resources/merging-interstage-fractionation-and-
low-consistency-advantages-during-the-tmp-refining-process-part-iii-how-fibre-morphology-

Erik Sjöström
75
impacts-paper-properties/
[Accessed 20 9 2018].
Lindblad, G., 2013. Frank-PTI Laboratory Refiner LR 40 Type Voith, s.l.: ELOF HANSSON
TECHNOLOGY DAYS.
Lumiainen, J., 1998. Papermaking Part 1, volume 8; Stock Preparation and wet end Ch. 4; Refining
of chemical pulp. [Online]
Available at: http://turbulence-initiated.sites.olt.ubc.ca/files/2013/01/1998-Lumiainen-Ch4.pdf
[Accessed 1 3 2018].
Lundin, T., 2008. Tailoring Pulp Fiber Properties In Low Consistency Refining. 1st ed. Turku:
Laboratory of Fibre and Cellulose Technology, Faculty of Technology, Åbo Akademi University.
Lundin, T., Batchelor, W. & Fardim, P., 2008. Fiber trapping in low-consistency refining: new
parameters to describe the refining process, s.l.: Tappi Jr.
MASUKO, 2018. MASUKO SANGYO CO. [Online]
Available at: www.masuko.com
[Accessed 6 6 2018].
Microfluidics, 2018. Microfluidics. [Online]
Available at: https://www.microfluidicscorp.com/about-us/our-technology/
[Accessed 22 7 2018].
Miller, J., 2017. Cellulose Nanomaterials: The Road to Commercialization. s.l.: Market-Intell LLC.
Miller, J., 2018. www.tappinano.org/. [Online]
Available at: http://www.tappinano.org/media/1229/2018-cellulose-nanomaterials-production-
update.pdf
[Accessed 4 10 2018].
Oliveira, L., 2016. Blog Polpa & Papel. [Online]
Available at: http://polpaepapel.blogspot.se/2016/02/tecnologias-em-refinadores-de-baixa.html
[Accessed 26 2 2018].

Erik Sjöström
76
Paulapuro, H., 2008. Papermaking Part 1, Stock Preparation and Wet End. 2nd ed. Jyväskylä:
Paperi ja Puu OY.
Sjöström, E., 1981. WOOD CHEMISTRY Fundamentals and Applications. London: ACADEMIC PRESS.
Skuse, D. & Ireland, S., 2018. High solids product from MFC/ mineral composite materials allow
attenuated performance of functional minerals and cellulose microfibrils in a wide range of
industrial applications. [Online]
Available at: https://www.fiberlean.com/wp-content/uploads/2018/05/TechConnect-2018-David-
Skuse.pdf
Smook, G. A., 1992. Handbook for Pulp & Paper technologists. 2nd ed. Vancouver: Angus Wilde
Puplications.
Turbak, F. A., Snyder, F. W. & Sandberg, K. R., 1983. Microfibrillated cellulose. US, Patent No.
4374702 A.
Valmet, 2018. Valmet Board and Paper. [Online]
Available at: www.Valmet.com
[Accessed 26 2 2018].
Appendix 1:
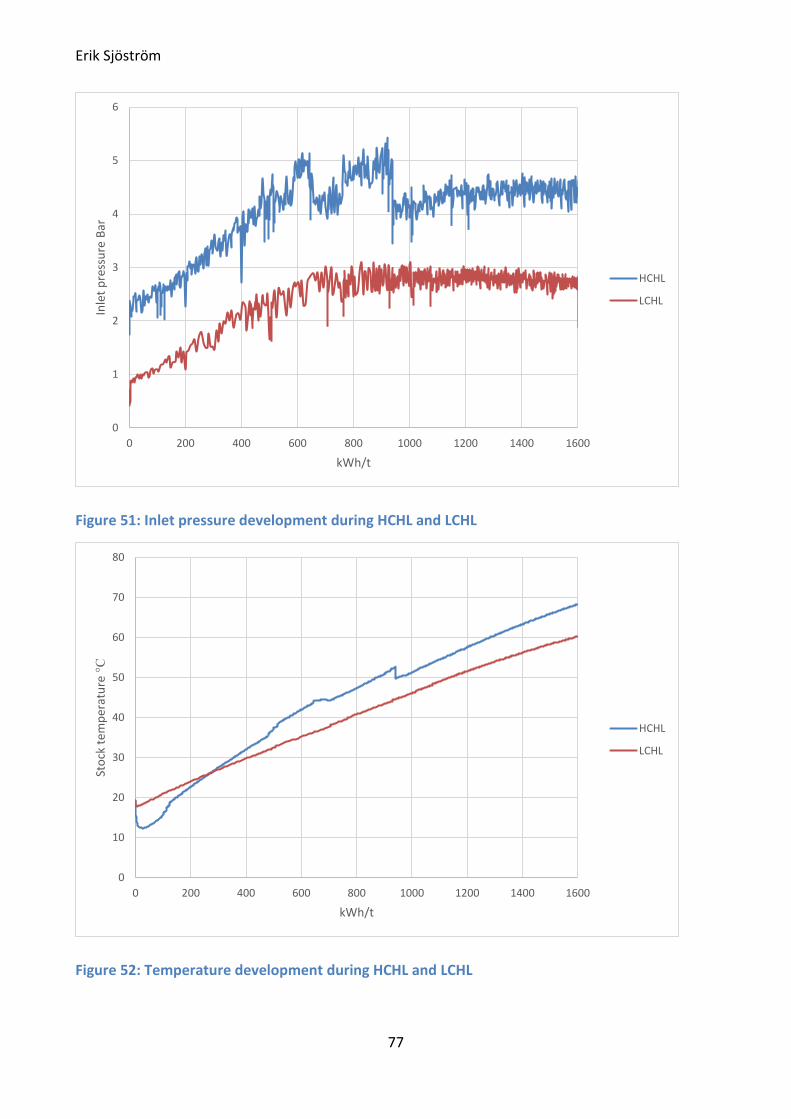
Erik Sjöström
77
Figure 51: Inlet pressure development during HCHL and LCHL
Figure 52: Temperature development during HCHL and LCHL
0
1
2
3
4
5
6
0 200 400 600 800 1000 1200 1400 1600
Inle
t p
ress
ure
Bar
kWh/t
HCHL
LCHL
0
10
20
30
40
50
60
70
80
0 200 400 600 800 1000 1200 1400 1600
Sto
ck t
emp
erat
ure
°C
kWh/t
HCHL
LCHL