Production and processing of sour crude and natural gas ... · of natural gas reserves are defined...
113
Production and processing of sour crude and natural gas - challenges due to increasing stringent regulations Darkhan Duissenov Petroleum Engineering Supervisor: Jon Steinar Gudmundsson, IPT Department of Petroleum Engineering and Applied Geophysics Submission date: June 2013 Norwegian University of Science and Technology
Transcript of Production and processing of sour crude and natural gas ... · of natural gas reserves are defined...

Production and processing of sour crude and natural gas - challenges due to increasing stringent regulations
Darkhan Duissenov
Petroleum Engineering
Supervisor: Jon Steinar Gudmundsson, IPT
Department of Petroleum Engineering and Applied Geophysics
Submission date: June 2013
Norwegian University of Science and Technology


Production and processing of sour crude and
natural gas – challenges due to increasing
stringent regulations
Darkhan Duissenov
Petroleum engineering
Submission date: June 2013
Supervisor: Jon Steinar Gudmundsson
Norwegian University of Science and Technology
Faculty of Engineering Science and Technology
Department of Petroleum Engineering and Applied Geophysics
Trondheim, Norway


i
Abstract
The worldwide demand for petroleum is growing tremendously. It is expected that the
demand will have incremental capacity of 20 mb/d for crude oil, reaching 107.3 mb/d,
and demand for natural gas will rise nearly 50% to 190 tcf in 2035, compared to 130 tcf
now. According to the International Energy Agency 70% of crude oil reserves and 40%
of natural gas reserves are defined as having high content of organosulfur compounds.
Obviously, for decades to come, to satisfy the growing global needs for fossil fuels,
reservoirs with sour contaminants will be developed intensively.
The sulfur compounds in crude oils and natural gas generally exist in the form of free
sulfur, hydrogen sulfide, thiols, sulfides, disulfides, and thiophenes. These compounds
can cause considerable technical, environmental, economic, and safety challenges in all
segments of petroleum industry, from upstream, through midstream to downstream.
Currently, the sulfur level in on-road and off-road gasoline and diesel is limited to 10 and
15 ppm respectively by weight in developed countries of EU and USA, but this trend is
now increasingly being adopted in the developing world too. Furthermore, it has to be
expected that the sulfur level requirements will become more and more strict in the
foreseeable future, approaching zero sulfur emissions from burned fuels.
The production of ultra low sulfur automotive fuels has gained enormous interest in the
scientific community worldwide. Oxidative desulphurization, biocatalytic
desulphurization, and combined technologies, which are alternatives to conventional
hydrodesulphurization technology, are much more efficient and more economical in
removing complex sulfur compounds, especially benzothiophene, dibenzothiophene and
their alkyl derivatives.
Keywords: product quality specifications, H2S corrosion, hydrodesulphurization,
biocatalytic desulphurization, oxidative desulphurization

ii
Acknowledgment
This project would not have been possible without the help and contributions of others. I
hereby seize the opportunity given to acknowledge these people for their assistance
whenever I found myself in doubt of what to do and how to do it.
First and foremost I offer my sincerest gratitude to my supervisor Professor Jon Steinar
Gudmundsson for his excellent guidance, support and encouragement during this project.
I really appreciate for his ideas, answers to all my questions and positive attitude.
I would like also to acknowledge the Government of the Republic of Kazakhstan
represented by the “Centre for International Programs” which provided funding to
complete Master of Science in Petroleum Engineering degree at NTNU. The International
Scholarship of the President of Kazakhstan “Bolashak” helped me to make my dreams
come true.
It is a great pleasure to thank my friends Gulia Shafikova, Danila Shutemov, Roman
Shpak and honorable Kazakh friends for support, unforgettable time and life lessons.
I am truly indebted and thankful to my lovely family for support and belief during my
studies abroad.

iii
Table of Contents
ABSTRACT ........................................................................................................................ I
ACKNOWLEDGMENT .................................................................................................. II
LIST OF FIGURES .......................................................................................................... V
LIST OF TABLES ....................................................................................................... VIII
1. INTRODUCTION...................................................................................................... 1
2. WORLD PETROLEUM RESERVES ..................................................................... 3
3. PETROLEUM SUPPLY AND DEMAND OUTLOOK ......................................... 5
4. CRUDE QUALITY OUTLOOK .............................................................................. 8
4.1 DENSITY AND API GRAVITY OF CRUDE OIL ............................................................... 8
4.2 SWEET AND SOUR CRUDE OIL .................................................................................... 9
4.3 BENCHMARKS OF CRUDE OIL................................................................................... 10
4.4 FUTURE TRENDS ON CRUDE QUALITY CHARACTERISTICS ........................................ 12
4.5 PRODUCT QUALITY SPECIFICATIONS ....................................................................... 12
5. CHALLENGES IN PRODUCTION AND PROCESSING ................................. 19
5.1 CORROSION ............................................................................................................. 20
5.1.1 Corrosion in petroleum production operations ............................................. 21
5.1.2 Corrosion in petroleum refining and petrochemical operations ................... 22
5.2 CORROSION CONTROL MECHANISMS IN SOUR SYSTEMS ........................................... 23
5.3 CORROSION MITIGATION TECHNIQUES IN SOUR SYSTEMS ........................................ 25
6. PETROLEUM PRODUCTS ................................................................................... 28
6.1 CLASSIFICATION OF PETROLEUM PRODUCTS ........................................................... 28
7. COMPOSITION OF CRUDE OILS AND PETROLEUM PRODUCTS .......... 29
7.1 HYDROCARBON COMPOUNDS .................................................................................. 29
7.2 NON–HYDROCARBON COMPOUNDS ........................................................................ 32
8. SULFUR CONTENT OF CRUDE OILS .............................................................. 34
8.1 ORIGIN OF SULFUR .................................................................................................. 34
8.2 NATURE OF SULFUR COMPOUNDS ............................................................................ 35

iv
9. FUNDAMENTALS OF REFINERY PROCESSING .......................................... 40
9.1 CLASSIFYING REFINERIES BY CONFIGURATION AND COMPLEXITY ........................... 41
10. CLASSIFICATION OF DESULPHURIZATION TECHNOLOGIES .............. 42
11. HYDROTREATING ............................................................................................... 43
11.1 HYDRODESULPHURIZATION ................................................................................ 44
11.2 PROCESS PARAMETERS ........................................................................................ 45
12. UNCONVENTIONAL DESULPHURIZATION TECHNOLOGIES ................ 49
12.1 OXIDATIVE DESULPHURIZATION ......................................................................... 49
12.2 BIOCATALYTIC DESULPHURIZATION ................................................................... 51
12.2.1 Process aspects .......................................................................................... 52
12.2.2 Barriers for commercialization ................................................................. 53
12.3 NOVEL COMBINED TECHNOLOGIES ...................................................................... 56
13. NATURAL GAS....................................................................................................... 60
13.1 ASSOCIATED AND NON-ASSOCIATED GAS ............................................................ 60
13.2 SWEET AND SOUR NATURAL GAS ......................................................................... 60
13.3 GAS SWEETENING PROCESSES ............................................................................. 61
13.4 PROCESS SELECTION FACTORS ............................................................................ 66
14. REFINERY OF THE FUTURE ............................................................................. 66
14.1 GLOBAL REFINERY CAPACITY REQUIREMENTS IN THE FUTURE ............................ 70
15. EFFECT OF ORGANOSULFUR COMPOUNDS ON NATURAL GAS
PROPERTIES .................................................................................................................. 73
15.1 PURE COMPONENTS BEHAVIOR............................................................................ 74
15.2 ESTIMATION OF WATER CONTENT IN SOUR GASES ............................................... 75
SUMMARY ...................................................................................................................... 79
CONCLUSION ................................................................................................................ 81
BIBLIOGRAPHY ............................................................................................................ 82
APPENDICES .................................................................................................................. 89

v
List of figures
FIGURE 1 DISTRIBUTION OF PROVED RESERVES OF CRUDE OIL IN 1991, 2001 & 2011 .......... 4
FIGURE 2 DISTRIBUTION OF PROVED RESERVES OF NATURAL GAS IN 1991, 2001 & 2011 .... 4
FIGURE 3 WORLDWIDE PETROLEUM LIQUIDS SUPPLY OUTLOOK .......................................... 5
FIGURE 4 WORLDWIDE PETROLEUM LIQUIDS DEMAND OUTLOOK 1970-2030 ...................... 7
FIGURE 5 WORLDWIDE GAS DEMAND OUTLOOK 1990-2030 ................................................ 7
FIGURE 6 CLASSIFICATION OF PETROLEUM, HEAVY OIL, AND BITUMEN BY API GRAVITY
AND VISCOSITY ............................................................................................................. 8
FIGURE 7 CRUDE QUALITY OUTLOOK IN TERMS OF SULFUR CONTENT ................................ 13
FIGURE 8 CRUDE QUALITY OUTLOOK IN TERMS OF API GRAVITY ...................................... 13
FIGURE 9 SELECTED GASOLINE SULFUR LEVELS (PPM) IN COUNTRIES AND REGIONS AROUND
THE WORLD ................................................................................................................. 15
FIGURE 10 SELECTED DIESEL FUEL SULFUR LEVELS (PPM) IN COUNTRIES AND REGIONS
AROUND THE WORLD ................................................................................................... 16
FIGURE 11 TRENDS IN SULFUR SPECIFICATION FOR NON-ROAD DIESEL .............................. 17
FIGURE 12 SULFATE REDUCING BACTERIA AND CORROSION .............................................. 21
FIGURE 13 CORROSION CONTROL BY SCRAPING AND PIGGING ........................................... 25
FIGURE 14 CORROSION MITIGATION BY INHIBITORS........................................................... 26
FIGURE 15 TYPICAL COATED STEEL PIPE ............................................................................ 27
FIGURE 16 TYPICAL PRODUCT PRODUCED FROM A BARREL OF OIL IN US ........................... 28
FIGURE 17 ISOMERS OF SELECTED PARAFFINS .................................................................... 30
FIGURE 18 AROMATICS AND NAPTHENES FOUND IN CRUDE OIL ......................................... 31
FIGURE 19 SELECTED LIGHT OLEFINS ................................................................................. 32
FIGURE 20 HETERO-ATOM COMPOUNDS FOUND IN CRUDE OIL ........................................... 33
FIGURE 21 OVERVIEW OF REFINING PROCESSES AND OPERATIONS ..................................... 40
FIGURE 22 DESULPHURIZATION TECHNOLOGIES CLASSIFIED BY NATURE OF A KEY PROCESS
TO REMOVE SULFUR .................................................................................................... 42
FIGURE 23 SCHEMATIC OF DISTILLATE HYDRODESULPHURIZATION ................................... 44
FIGURE 24 SIMPLIFIED FLOW SCHEME OF AN OIL REFINERY WITH POSSIBLE LOCATIONS OF
DESULPHURIZATION UNITS .......................................................................................... 46
FIGURE 25 REACTIVITY OF VARIOUS ORGANIC SULFUR COMPOUNDS IN HDS VERSUS THEIR
RING SIZES AND POSITIONS OF ALKYL SUBSTITUTIONS ON THE RING ........................... 49

vi
FIGURE 26 CONVERSION OF 4,6-DMDBT AFTER OXIDATION WITH H2O2 AS A FUNCTION OF
REACTION TIME AT DIFFERENT REACTION TEMPERATURES UNDER MILD CONDITIONS . 50
FIGURE 27 CONCEPTUAL FLOW DIAGRAM FOR THE BDS PROCESS ..................................... 52
FIGURE 28 CONCEPTUAL DIAGRAM OF SOME OF THE STEPS IN THE DESULPHURIZATION OF
OIL .............................................................................................................................. 53
FIGURE 29 THE "4S" PATHWAY FOR THE BIOLOGICAL DESULPHURIZATION OF
DIBENZOTHIOPHENE AND ITS DERIVATIVES ................................................................. 54
FIGURE 30 OPTIONS OF BIODESULPHURIZATION IN THE UPGRADING OF PETROLEUM MIDDLE
DISTILLATES (DIESEL) TO ULTRA LOW SULFUR LEVELS (A) BDS UNIT AFTER
CONVENTIONAL HDS UNIT, (B) BDS UNIT BEFORE CONVENTIONAL HDS UNIT .......... 57
FIGURE 31 EFFECT OF ULTRASOUND ENERGY ON OXIDATIVE DESULPHURIZATION ............. 58
FIGURE 32 SOUR NATURAL GAS RESERVES AROUND THE WORLD ....................................... 63
FIGURE 33 SELEXOL® FLOWSCHEME FOR SULFUR REMOVAL ............................................. 63
FIGURE 34 MODIFIED STERTFORD® PROCESS FLOW DIAGRAM .......................................... 65
FIGURE 35 PROCESS SELECTION CHART FOR H2S REMOVAL WITH NO CO2 PRESENT .......... 67
FIGURE 36 PROCESS SELECTION CHART FOR SIMULTANEOUS H2S AND CO2 REMOVAL ...... 67
FIGURE 37 PROCESS SELECTION CHART FOR SELECTIVE H2S REMOVAL WITH CO2 PRESENT
.................................................................................................................................... 68
FIGURE 38 GLOBAL CAPACITY REQUIREMENTS BY PROCESS TYPE, 2011-2035 .................. 71
FIGURE 39 CRUDE DISTILLATION CAPACITY ADDITIONS, 2011-2035 ................................. 71
FIGURE 40 DESULPHURIZATION CAPACITY REQUIREMENTS BY PRODUCT AND REGION,
2011-2035 .................................................................................................................. 72
FIGURE 41 WATER CONTENT OF THREE GASES AT 120ºF (50°C) ........................................ 75
FIGURE 42 WATER CONTENT VERSUS H2S CONTENT OF NATURAL GASES WITH SIMPLIFIED
COMPOSITION .............................................................................................................. 76
FIGURE 43 THE WORLD TOP 10 OIL PRODUCERS ................................................................. 90
FIGURE 44 THE WORLD TOP 10 NATURAL GAS PRODUCERS ................................................ 90
FIGURE 45 WORLDWIDE CRUDE PRODUCTION BY QUALITY ................................................ 91
FIGURE 46 HISTORICAL CRUDE OIL PRICES, 1861-2011 ..................................................... 93
FIGURE 47 HISTORICAL NATURAL GAS PRICES, 1994-2011 ................................................ 94
FIGURE 48 QUALITY AND PRODUCTION VOLUME OF MAIN CRUDES .................................... 95
FIGURE 49 MAXIMUM GASOLINE SULFUR LIMITS AS OF SEPTEMBER 2012 ......................... 96
FIGURE 50 MAXIMUM ON-ROAD DIESEL SULFUR LIMITS AS OF SEPTEMBER 2012 .............. 96
FIGURE 51 EXAMPLES OF ORGANOSULFUR COMPOUNDS PRESENT IN FOSSIL FUELS ........... 97

vii
FIGURE 52 WORLDWIDE TOTAL SO2 EMISSIONS AS OF 2005 ............................................ 101
FIGURE 53 ACID RAIN FORMATION ................................................................................... 101

viii
List of tables
TABLE 1 WORLD OIL DEMAND OUTLOOK ............................................................................. 6
TABLE 2 QUALITY LEVELS - API GRAVITY AND SULFUR CONTENT ....................................... 9
TABLE 3 EXPECTED REGIONAL GASOLINE SULFUR CONTENT ............................................. 15
TABLE 4 EXPECTED REGIONAL ON-ROAD DIESEL SULFUR CONTENT ................................... 16
TABLE 5 CORROSION CONTROL MECHANISMS IN SOUR SYSTEMS ........................................ 24
TABLE 6 SULFUR CONTENT OF SELECTED CRUDE OILS ........................................................ 35
TABLE 7 DISTRIBUTION OF TOTAL SULFUR IN THE DIFFERENT CUTS OF CRUDE ARABIAN
LIGHT .......................................................................................................................... 35
TABLE 8 DISTRIBUTION OF MERCAPTAN SULFUR AMONG THE DIFFERENT CUTS OF ARABIAN
LIGHT CRUDE OIL ........................................................................................................ 37
TABLE 9 MERCAPTANS IDENTIFIED IN CRUDE OILS ............................................................. 38
TABLE 10 SULFIDES IDENTIFIED IN THE CRUDE OILS ........................................................... 38
TABLE 11 THIOPHENE DERIVATIVES IDENTIFIED IN CRUDE OILS ......................................... 39
TABLE 12 PROCESS PARAMETERS FOR HYDRODESULPHURIZATION .................................... 45
TABLE 13 CLASSIFICATION OF GASES BY COMPOSITION ..................................................... 61
TABLE 14 COMPARISON OF CHEMICAL AND PHYSICAL SOLVENTS ...................................... 64
TABLE 15 NATURAL GAS RESERVOIRS WITH A HIGH H2S CONTENT .................................... 68
TABLE 16 GLOBAL CAPACITY REQUIREMENTS BY PROCESS ................................................ 70
TABLE 17 WATER CONTENT OF SELECTED NATURAL GASES CALCULATED WITH
AQUALIBRIUM ....................................................................................................... 77
TABLE 18 COMPOSITION OF SELECTED NATURAL GASES .................................................... 77
TABLE 19 WATER CONTENT OF GASES WITH SIMPLIFIED COMPOSITION CALCULATED BY
AQUALIBRIUM ....................................................................................................... 78
TABLE 20 ESTIMATED PROVED RESERVES HOLDERS AS OF JANUARY 2013 ........................ 89
TABLE 21 CRUDE PRODUCTION BY GRAVITY ...................................................................... 91
TABLE 22 CRUDE PRODUCTION BY SULFUR CONTENT ........................................................ 91
TABLE 23 MAIN FEATURES OF SOME QUALITIES OF CRUDE OIL .......................................... 92
TABLE 24 EFFECT OF HYDROTREATMENT ON THE CHARACTERISTICS OF GAS OIL ............... 98
TABLE 25 OVERVIEW OF PETROLEUM REFINING PROCESSES ............................................... 99

1
1. Introduction
Fossil fuel-based hydrocarbons are a primary energy source for current civilizations,
which nowadays accounts for 83% of global energy consumption, and this tendency is
forecasted to continue even after two decades (Pratap, 2013). However, to satisfy such
rapidly growing appetite for fossil fuels, the petroleum industry will have to face a lot of
challenges. Oil and gas companies, which have always preferably produced the oil and
gas from the reservoirs technically the easiest to develop, will have to develop more
complex and extremely challenging sour hydrocarbon projects. In the nearest future,
crude oil and natural gas with high sulfur content will be the energy source of choice to
meet increasing demand.
In order to understand the importance of those challenges thorough analysis of
hydrocarbon quality is needed. To start with, it should be that the value of the reservoir
fluid is commonly based on its quality characteristics. Lower quality Dubai crude is sold
at discount rate to lighter, sweeter Brent crude. Sulfur content is among the most
important characteristics of the crude oil and natural gas. Currently, there is a negative
trend of increase of sulfur content in hydrocarbons worldwide. If US sulfur content of
crude oil input to refineries was 0.88% in 1985, as of February 2013 it was 1.44% (EIA,
2013).
Another unfavorable for refineries tendency regards to environmental sulfur regulations.
If in 2012 the maximum allowable level of sulfur was 795 ppm in Africa, 605 ppm in the
Middle East, 520 ppm in Latin America, in 2030 it is expected to decrease the sulfur
content to 95 ppm, 16 ppm, and 30 ppm respectively. The other nations of the world are
moving towards environmentally friendly transportation fuels too. New transportation
fuel specifications are being put into effect worldwide. As a result, those contradirectional
factors, such as hydrocarbon quality deterioration and reducing the maximum allowable
level of sulfur, are making the situation even worse.
However, before considerable investment will be put in completely new technologies and
tools, the industry has to deal with existing problems. There are number of technical,
economical, and environmental problems. All of them are caused by the presence of
organosulfur compounds in petroleum. They are very undesirable, because of their actual

2
or potential corrosive nature, disagreeable odor, deleterious effect on color or color
stability, and unfavorable influence on antiknock and oxidation characteristics.
Furthermore, sulfur compounds poison expensive refining catalysts and pollutes into the
atmosphere in a form of sulfur oxides when burned, causing environmental problems.
Emissions of sulfur compounds formed during the combustion of petroleum products are
the subject of environmental monitoring in all developed countries.
Crude corrosivity problems have been studied since 1950’s mostly because of their
severity and economic impact on production and refining operations. To date the annual
cost of corrosion worldwide is estimated at over 3% of GDP of the planet, which is
literally 3.3$ trillion. Without taking into account the progress made in understanding the
role of different parameters on the corrosion process, modern scientific society cannot
give exact answers in understanding and prediction of petroleum corrosivity.
Hydrocarbon producing companies in order to meet the stringent environmental and
safety requirements are in search of “green” and cost-effective methods for
desulphurization of crude oil and natural gas. Desulphurization is costly technology and
petroleum refiners could spend 25 billion USD over the next decade (Monticello, 1996).
Commonly used conventional desulphurization technology - hydrodesulphurization - is
expensive and does not efficiently handle sulfur removal in a number of situations.
Hence, other efficient desulphurization technologies, as biocatalytic desulphurization,
oxidative desulphurization are being used in test scale and commercial scale projects.
The main purpose of this master thesis is to analyze the rising sulfur problem and outline
the needs for better technologies to remove the sulfur. The analysis has been done based
on annual energy reviews, from different sources, such as OPEC, BP, EIA, and others.
The origin and the types of sulfur present in hydrocarbons are studied. Also commercial,
semi-commercial, and test scale desulfurization technologies are reviewed.

3
2. World petroleum reserves
British Petroleum defines the term proved reserves of crude petroleum as those quantities
of petroleum that geological and engineering information indicates with reasonable
certainty can be recovered in the future from known reservoirs under existing economic
and operating conditions (BP, 2012).
As of January 2013, the estimated world proved reserves of crude petroleum were 1.6
billion barrels. OPEC currently accounts for 73.6% of total world oil reserves. Venezuela
with its heavy, sour crude holds the largest share of the world's petroleum reserves at 18%
of the total, as a result of recent reserves identified in this country. Other countries with
the biggest crude oil reserves are Saudi Arabia (16.2%), Canada (10.6%), Iran (9.4%) and
Iraq (9.6%) (Table 20).
On a regional basis, the Middle East accounts for nearly 48% of the world's reserves.
Central and South America is second with 20%, following recent reserves identified in
Brazil and Venezuela, and North America is third with 13% (Figure 1).
The International Energy Agency (IEA) estimates that 70% of the world’s remaining oil
reserves consist of heavy, high sulfur crude. Moreover, there is a common tendency in all
big discoveries found in the last 30 years. The crude from these new oil fields tends to be
heavy, difficult to extract, with high sulfur content. One of the reasons of crude oil quality
deterioration is depletion of production from conventional, commonly sweet reservoirs.
This trend can be seen by looking at the history of crude oil production, which is now
extending over more than 150 years (Zittel & Schindler, 2007):
Virtually all the world's largest oil fields were all discovered more than 50 years
ago;
Since the 1960s, annual oil discoveries tend to decrease;
Since 1980, annual consumption has exceeded annual new discoveries;
Till this day more than 47,500 oil fields have been found, but the 400 largest
oilfields (1%) contain more than 75% of all oil ever discovered;
When it comes to natural gas proved reserves the Middle East and Europe & Eurasia
region account for 75% of whole world’s reserves (Figure 2). In fact, 40% of the world’s
natural or associated gas reserves currently identified as remaining to be produced,

4
representing over 2600 trillion cubic feet (tcf), are sour, with both H2S and CO2 present
most of the time. Among these sour reserves, more than 350 tcf contain H2S in excess of
10%, and almost 700 tcf contain over 10% CO2 (Lallemand et al., 2012).
Figure 1 Distribution of proved reserves of crude oil in 1991, 2001 and 2011 (BP, 2012)
Figure 2 Distribution of proved reserves of natural gas in 1991, 2001 and 2011 (BP,
2012)

5
3. Petroleum supply and demand outlook
Worldwide crude oil production is forecasted to increase to meet the growing
consumption, at the same time the sources of growth will change the global balance.
Global crude oil supply is set to rise by about 16.5 Mb/d by 2030. 75% of the global
supply growth will be accounted to OPEC. Crude supply decline from Europe, Asia
Pacific, and North America is expected to offset by growth in deepwater Brazil and the
FSU (BP, 2011).
Non-OPEC output will rise by nearly 4 Mb/d. Unconventional supply growth should
more than offset declining conventional output, with biofuels adding nearly 5 Mb/d and
oil sands rising by nearly 2 Mb/d (BP, 2011).
Figure 3 Worldwide petroleum liquids supply outlook (BP, 2011)
The global crude oils demand is also predicted to increase, but growth slows to 0.8% p.a.
(from 1.4% p.a. in 1990-2010 and 1.9% p.a. in 1970-90). The OPEC is forecasted the
demand for crude oil for long-term period from 2010 to 2035. The outlook for oil demand
is shown in Table 1. In the forecasting period of 25 years demand will have an
incremental capacity of 20 mb/d, reaching 107.3 mb/d by 2035. 87% of the increase in
crude oil demand in developing Asia, whereas OECD demand shows a steady decline, as

6
it was already peaked in 2005 (OPEC, 2012). Non-OECD consumption is likely to
overtake the OECD by 2014, and reach 66 Mb/d by 2030.
Table 1 World oil demand outlook (mb/d) (OPEC, 2012)
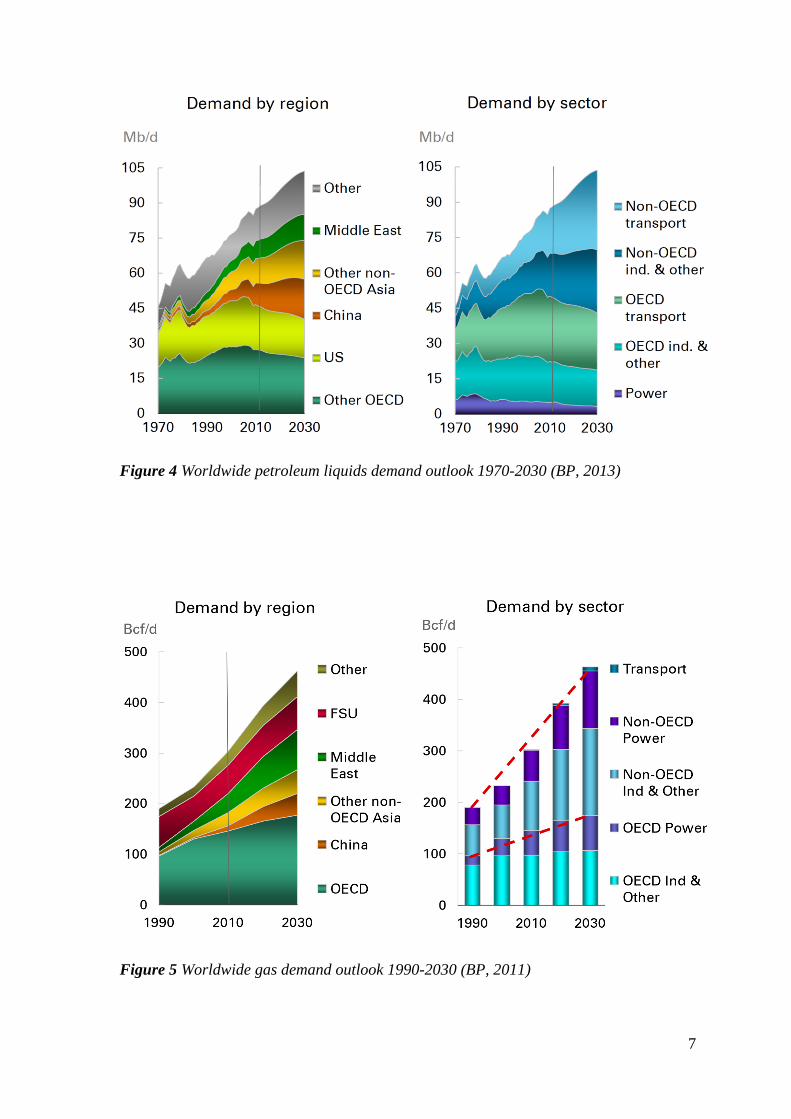
The transportation sector is a key to future oil demand growth. OECD consumption will
fall to 40.5 Mb/d. Figure 4 shows the increasing tendency in oil consumption in road
transportation. It can be easily seen that by 2020, non-OECD oil use in road
transportation (nearly 14 Mb/d) will be greater than in the OECD. Furthermore, the
majority of this increase will be dominated by developing Asian countries, especially
China and India.
Demand for natural gas will rise nearly 50% to 190 tcf in 2035, compared to 130 tcf for
now. Gas demand in the forecasting period will be mainly driven by non-OECD
countries, with growth averaging 3% p.a. to 2030 (Figure 5). On the top of the demand
growth is non-OECD Asia (4.6% p.a.) and the Middle East (3.9% p.a.). Of the major
sectors globally, growth is fastest in power (2.6% p.a.) and industry (2% p.a.) which
matches with historic patterns., Compressed natural gas use in transport is confined to 2%
of global transport fuel demand in 2030, with threefold increase from today’s level (BP,
2011).
7
Figure 4 Worldwide petroleum liquids demand outlook 1970-2030 (BP, 2013)
Figure 5 Worldwide gas demand outlook 1990-2030 (BP, 2011)

8
4. Crude quality outlook
4.1 Density and API gravity of crude oil
Crude oil quality is measured in terms of density and divided into four groups such as
light, medium, heavy and extra heavy crudes (Figure 6). Those groups are defined
depending on the value of degrees API. Density in degrees API is a unit of measurement
of oil density, developed by the American Petroleum Institute. Measurement of degrees
API allows us to determine the relative density of oil to the density of water at the same
temperature of 15.6 degrees Celsius. The API degree is found with the following formula:
The SG stands for specific gravity or relative density, which is equal to the density of the
substance divided by the density of water (density of water is 1000 kg/m3). So if the API
gravity is greater than 10, then the oil is lighter and floats on water, and if less than 10,
then drowned (Wikipedia, 2012). API gravity was designed so that most values would fall
between 10° and 70° API gravity (Schlumberger, 2012).
Figure 6 Classification of petroleum, heavy oil, and bitumen by API gravity and viscosity
(Speight, 2007)
Depending on API gravity crude oils are classified as follows (Figure 6):
Light: API>31.1
Medium: 22.3<API<31.1
Heavy: API<22.3
Extra heavy: API<10.0

9
4.2 Sweet and sour crude oil
Depending on the amount of sulfur the crude oil can be sweet or sour. When the total
sulfur level in the oil is less than 0.5 % the oil is called sweet and if it is more than that
the oil is called sour. Sweet crude oil is more preferred by refineries as it contains
valuable chemicals which is needed to produce the light distillates and high quality feed
stocks.
Historically, early prospectors tasted the crude oil to determine its quality. Crude
petroleum had a sweet taste and pleasant smell if the content of sulfur was low. For this
reason, sweet crude is a low sulfur crude oil (FSU, 2010).
Sweet crude is easier to refine and safer to extract and transport than sour crude. Because
sulfur is corrosive, light crude also causes less damage to refineries and thus results in
lower maintenance costs over time.
Major locations where sweet crude is found include the Appalachian Basin in Eastern
North America, Western Texas, the Bakken Formation of North Dakota and
Saskatchewan, the North Sea of Europe, North Africa, Australia, and the Far East
including Indonesia.
Table 2 Quality levels - API gravity and sulfur content (Eni, 2012)
Crude Oil Class Property Range
Gravity (ºAPI) Sulfur (wt. %)
Ultra Light >50 <0.1
Light & Sweet 35-50 <0.5
Light & Medium Sour 35-50 0.5-1
Light & Sour 35-50 >1
Medium & Sweet 26-35 <0.5
Medium & Medium Sour 26-35 0.5-1
Medium & Sour 26-35 >1
Heavy & Sweet 10-26 <0.5
Heavy & Medium Sour 10-26 0.5-1
Heavy & Sour 10-26 >1

10
As opposed to sweet crude sour crude is sold at a discount to lighter sweeter grades.
Because the sulfur compounds in the crude oils are generally harmful impurities, they are
toxic, have an unpleasant odor, contribute to the deposition of resin and in combination
with water causes intense corrosion (K-Oil, 2012). Even though it does not restrains the
production of inconvenient crude and the data shows that from 1995 to 2011 medium-
sour and sour crude has been the major hydrocarbon produced in the world taking about
55 to 60% of whole crude production, which is shown in Table 22.
Major regions with vast sour crude reserves: North America (Alberta (Canada), United
States' portion of the Gulf of Mexico, and Mexico), South America (Venezuela,
Colombia, and Ecuador), Middle East (Saudi Arabia, Iraq, Kuwait, Iran, Syria, and
Egypt).
4.3 Benchmarks of crude oil
The knowledge of commercial value of the reservoir fluid is of vital importance, as
petroleum companies is aimed on getting as much profit as possible. The profit is a
function of the cost of petroleum. The cost is based on quality characteristics, such as
density and sulfur content which are the most important characteristics of the crude.
Depending on the chemical composition and the presence of various chemical elements
the term benchmark or market crude should be introduced.
The general concept of benchmarking is to classify crude oil based on its quality. The
introduction of grading has become necessary due to the different composition of oil as
sulfur content, alkane content and the presence of impurities, in addition to where it is
located. For the convenience of trade market and to keep the balance between supply and
demand typical benchmarks were created. Prices for other crudes are determined by the
differentials to benchmarks (K-Oil, 2012). The major crude oil benchmarks are grouped
as follows:
(i) West Texas Intermediate (WTI)
West Texas Intermediate is reference crude, which is produced in Texas. The density is
about 40° API and sulfur content ranges from 0.4 to 0.5 %. It is mostly used to produce
gasoline and therefore that type of oil is in high demand, especially in the United States
and China (UP Trading, 2012).

11
(ii) Brent Blend
Brent is a reference grade of oil from the North Sea. The oil price of Brent is in the basis
for the pricing of about 40% of world oil prices from 1971. The word Brent stands for
Broom, Rannoch, Etieve, Ness and Tarbat.
(iii) Dubai
Dubai Crude has a gravity of 31° API and a sulfur content of 2 %. It is extracted from
Dubai. Dubai Crude is used as a price benchmark because it is one of only a few Persian
Gulf crude oils available immediately.
(iv) Tapis Crude
Tapis is the benchmark for light sweet Malaysian crude. The sulfur content is as low as
0.03% and the API gravity is around 45.5. Although this oil marker is not as widely
traded as WTI, it is used as a benchmark in Asia (EconomyWatch, 2010).
(v) Bonny Light
Bonny Light is a benchmark for high grade Nigerian crude, with an API of around 36.
Due to its very low sulfur content, it corrodes the refinery infrastructure minimally
(EconomyWatch, 2010).
(vi) OPEC Basket
OPEC Basket is the pricing data formed by collecting seven crude oils from the OPEC
nations (except Mexico). These include Saudi Arabia's Arab Light, Algeria's Saharan
Blend, Indonesia's Minas, Nigeria's Bonny Light, Venezuela's Tia Juana Light, Dubai's
Fateh and Mexico's Isthmus. This information is used by OPEC to monitor the global
conditions of the oil market (EconomyWatch, 2010).
The crude oils represented in Figure 48 are selection of some of the crude oils marketed
in various parts of the world. There are some crude oils both below and above the API
gravity range shown in the chart (EIA, 2012). Moreover, quality levels as API gravity and
sulfur content are presented on Table 23. The classification ranges from ultra-light to
heavy and sour and gives the data on daily production.

12
4.4 Future trends on crude quality characteristics
Crude oil quality, typically measured in terms of API gravity and sulfur content, does,
and will increasingly play a major role in determining future refining requirements.
Historically, the average quality of crude oil has been declining steadily. Average sulfur
content has been increasing considerably and more rapidly than API gravity. And this
trend likely to continue for the foreseeable future (MathProInc., 2011).
The detailed analysis on the expected quality changes in oil supply streams with the
projection to 2035 are presented in Figures 7 and 8. The figure is projected to improve
marginally to around 33.5° API by 2015, from 33.4° API in 2010, and then move back to
33° API by 2035, a level not very dissimilar to the present one. Figure 8 also underscores
that the global average for the entire forecast period is anticipated to remain in a fairly
narrow range of less than 1° API. Average sulfur content projections are also can be
observed (Figure 7). The expected variations in average sulfur content are wider; they are
in the range of 10-15% over the 25-year forecast period (OPEC, 2011).
4.5 Product quality specifications
Refined products specification along with quality of crude oil which is used as a
feedstock to the refineries another important aspect which significantly influences future
downstream investments. In the last 30 years, downstream industry globally has put
considerable amount of money in order to meet new petroleum product quality
specifications. The very first regulations have affected the lead content in gasoline, and in
the middle of 1990s the focus turned to sulfur content in automotive fuel, especially in the
most industrialized countries.
The main purpose of those regulations is to yield high quality automotive fuels with
sulfur content less than 10 parts per million (ppm). Moreover, regulators want to tighten
sulfur content of other refined products, such as fuel oil, marine bunkers and jet fuel.
Some worldwide efforts have already been made to minimize the content of organosulfur
compounds in finished products. This can be seen in Figure 49 and Figure 59, which
show the global maximum permitted sulfur content in gasoline and on-road diesel fuel,
respectively (as of September 2012).

13
Figure 7 Crude quality outlook in terms of sulfur content (OPEC, 2011)
Figure 8 Crude quality outlook in terms of API gravity (OPEC, 2011)

14
However, it should be noted that actual sulfur content levels for products available in
specific countries can differ from the ones permitted by regulators (OPEC, 2012).
(i) Gasoline quality specifications
Up-to-date petroleum product quality specifications lay stress upon the extensive use of
gasoline with extremely low sulfur content. This tendency is especially noticeable in
developed countries; nevertheless developing countries also expect nationwide
penetration of low sulfur fuel.
This trend is particularly evident in developed countries, but it is now increasingly being
adopted in the developing world too.
In the US the primary plan with its ultra-low sulfur gasoline program was to reduce sulfur
to 80 ppm per gallon cap and 30 ppm annual average, as of 2004. Later, in 2010 US
regulators have lowered the maximum standard to 30 ppm for all refineries, and
California had set even lower specification at 15 ppm.
Since 2005, the EU refineries have produced certain quantities of 10 ppm gasoline
together with 50 ppm fuels. As of January 2009, the situation has changed and the
maximum allowable sulfur levels were further tightened to 10 ppm.
In China the sulfur limits are regulated on a regional basis. In the cities such as Shanghai,
Guangzhou, Shenzhen, Dongguan and Nanjing the maximum sulfur level is set to 50
ppm, in Beijing it is set the strictest fuel quality requirement of 10 ppm, whereas the
nationwide sulfur level is adjusted to 150 ppm in 2009. China is expected to lower its
nationwide limits to 50 ppm by December 2013 and possibly to 10 ppm by 2016.
Similar tendency can be seen in India. Since 2010, 13 selected cities have lowered the
sulfur content to 50 ppm, plus seven more cities since March 2012, whereas the
nationwide sulfur gasoline level is 150 ppm. The Indian authorities made a list of 50 other
cities with the big number of vehicles and high pollution, where it will be required to use
the fuel with 50 ppm sulfur, and it is planned to be implemented by 2015.
Several other countries around the world are moving forward with lowering the maximum
fuel sulfur content. This is particularly true in the Middle East, Russia, South Africa and
some countries in Latin America. Saudi Arabia expects a nationwide penetration of 10

15
ppm gasoline by 2013, followed soon after by other countries in the Middle East region,
while Russia plans to switch to 10 ppm gasoline by 2016. South Africa has agreed to
enforce 10 ppm gasoline by 2017 (OPEC, 2011). Projected gasoline qualities in respect to
sulfur content for 2012–2035 are shown in Table 3 (OPEC, 2011).
Table 3 Expected regional gasoline sulfur content (OPEC, 2012)
Figure 9 Selected gasoline sulfur levels (ppm) in countries and regions around the world.
Nationwide standards are shown; Brazil, China, and India have stricter fuel quality in
some sub-national and municipal areas (ICCT, 2013)
(ii) Diesel quality specifications
European Fuel Quality Directive has required the on-road and off-road diesel fuel sulfur
content to be set at 10 ppm since 2011. Same maximum level of 10 ppm was legislated in
Japan, Hong Kong, Australia, New Zealand, South Korea and Taiwan. A switch to 15
ppm for on- and off-road diesel was fully aligned in Canada since 2010. The same
nationwide average level of 15 ppm came into effect in US in 2012, with the exceptions
for small refineries, which are required to do so by 2014.
China planned to reduce its on-road diesel sulfur to 350 ppm in July 2012. This limit,
however, is still not widely enforced. However, at the more regional level, Beijing has a
diesel sulfur limit of 10 ppm, while cities of Shanghai, Guangzhou, Shenzhen, Dongguan

16
and Nanjing have required a 50 ppm maximum since May 2012. India has also set two
different diesel fuel specifications, one for nationwide supply and the other for 20
selected cities. The sulfur content specification for 20 urban centers is established at a 50
ppm maximum, and the national specification is 350 ppm. Other countries in Asia where
improvements in on-road diesel quality have been observed include Indonesia, Malaysia,
Philippines and Thailand.
In Latin America, the maximum sulfur limit for premium diesel in Argentina was set to
10 ppm in June 2011. Chile has required 50 ppm diesel since 2006. In other countries,
such as Brazil, Ecuador and Mexico the progress has been reported, however the majority
of Latin America has sulfur limits for diesel oil above 500 ppm.
Totally different situation do exist in Africa. The average sulfur content is in the range of
2,000 to 3,000 ppm for on-road diesel, and much higher for off-road. The only exception
is South Africa, which plans a switch to 10 ppm fuels by 2017.
Table 4 Expected regional on-road diesel sulfur content (OPEC, 2012)
Figure 10 Selected diesel fuel sulfur levels (ppm) in countries and regions around the
world. Nationwide standards are shown; Brazil, China, and India have stricter fuel
quality in some sub-national and municipal areas (ICCT, 2013)
17
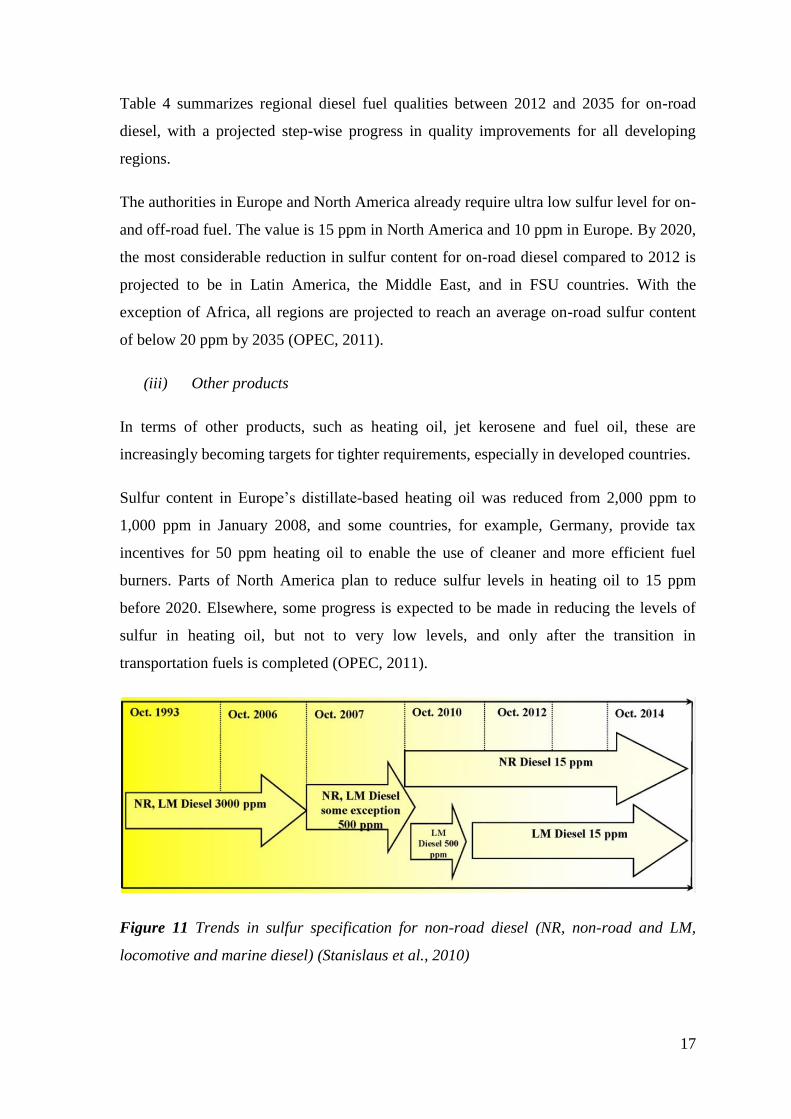
Table 4 summarizes regional diesel fuel qualities between 2012 and 2035 for on-road
diesel, with a projected step-wise progress in quality improvements for all developing
regions.
The authorities in Europe and North America already require ultra low sulfur level for on-
and off-road fuel. The value is 15 ppm in North America and 10 ppm in Europe. By 2020,
the most considerable reduction in sulfur content for on-road diesel compared to 2012 is
projected to be in Latin America, the Middle East, and in FSU countries. With the
exception of Africa, all regions are projected to reach an average on-road sulfur content
of below 20 ppm by 2035 (OPEC, 2011).
(iii) Other products
In terms of other products, such as heating oil, jet kerosene and fuel oil, these are
increasingly becoming targets for tighter requirements, especially in developed countries.
Sulfur content in Europe’s distillate-based heating oil was reduced from 2,000 ppm to
1,000 ppm in January 2008, and some countries, for example, Germany, provide tax
incentives for 50 ppm heating oil to enable the use of cleaner and more efficient fuel
burners. Parts of North America plan to reduce sulfur levels in heating oil to 15 ppm
before 2020. Elsewhere, some progress is expected to be made in reducing the levels of
sulfur in heating oil, but not to very low levels, and only after the transition in
transportation fuels is completed (OPEC, 2011).
Figure 11 Trends in sulfur specification for non-road diesel (NR, non-road and LM,
locomotive and marine diesel) (Stanislaus et al., 2010)

18
In Europe, reductions in the sulfur content of jet fuel have been discussed with initiatives
aimed at global harmonization. However, no major progress has been achieved until now
and, current jet fuel specifications still allow for sulfur content as high as 3,000 ppm,
although market products run well below this limit, at approximately 1,000 ppm. Longer
term, it is expected that jet fuel standards for sulfur content will be tightened to 350 ppm
in industrialized regions by 2020, followed by other regions in 2025. Industrialized
regions are also assumed to see a further reduction to 50 ppm by 2025 (OPEC, 2011).
Marine bunker fuels are also subject to regulation. As of January 2012, the global sulfur
cap was lowered from 4.5% wt to 3.5% wt, and will be further lowered to 0.5% wt (5,000
ppm) as of January 2020. In September 2012, the European Parliament approved final
legislation requiring all ships in the EU waters to switch to 0.5% wt sulfur fuel, or use
corresponding technology allowing ships to reach the required emissions reduction, in
2020 (OPEC, 2011).

19
5. Challenges in production and processing
The studies on crude quality issues and up-to-date statistical data demonstrate all over
again the relevance of the topic addressed. The quality of feedstock and crude slate is
considerably deteriorating, becoming heavier and sourer (Figure 7-8). Commonly, the
production and processing of high sulfur crudes and sour gases meet five major
challenges, which have an effect on the development of energy efficient, low-cost
technologies for separation units and to generally production schemes (Lepoutre, 2008).
Technical challenges
Crude oil and natural gas with high content of sulfur compounds claim complex and
capital-intensive processes at all stages of production and handling, from upstream,
through midstream to downstream segments of petroleum industry.
Technical challenges of development of high sulfur reservoirs are not defined directly. It
differs from case to case. Nevertheless, there is a common challenge for almost all sour
crude oil projects. This challenge is corrosion related problems. The corrosive
environment is typically created when there is high content of H2S and CO2 combined
with high pressure and high temperature. In such corrosive environment just a few
materials can withstand. Moreover, because of high toxicity of the H2S and the danger of
metal failure as a result of stress corrosion cracking, extreme caution must be taken in
selecting materials to drill and produce this type of energy source securely (Hamby,
1981). Causes of corrosion, corrosion control and mitigation tools will be described
thoroughly in the following chapters.
Economic challenges
The next challenge is economic. It is linked to the high technical costs related to the
production of sour crudes containing large amounts of acid gases. The size and the cost of
process units and of acid gas handling facilities, such as H2S transformation into sulfur
units, shipping/storage of sulfur, compression, pumping or re-injection facilities, strongly
dependent on the amount of feed stock.
Environmental challenges

20
The following challenge is environmental. Nowadays, the governments and
environmental protection agencies have put limits on sulfur compounds in refined fuels.
The tendency shows that one decade later the requirements will be much more stringent
putting under the pressure oil and gas companies to develop more environmentally
friendly technologies. To achieve this task significant amount of money has to be spent
on research studies and process facilities.
Safety challenges
Production of sour oil and gas reserves with high content of hydrogen sulfide, leads to
handle large quantities of this harmful gases. Hydrogen sulfide can be found in different
states, the dense phase of it is precipitated in the acid gas facilities, and acid gas removal
unit. Therefore, production and processing facilities is designed by taking account of sour
gases, and it is particularly constrained by safety, because H2S is highly toxic.
Sulfur marketing and environmental challenges
The last challenge is related to the sales of produced sulfur and its storage without
harmful effect on the environment. Due to decreasing world demand for elemental sulfur,
the economics of recovering sulfur from sour crude and natural gas has become
unfavorable. The sulfur market is globally saturated. Even though, some companies are
trying to find a solution for different utilization of sulfur, such as sulfur concrete, for
instance.
5.1 Corrosion
Production, transportation and processing of crude oil and its following use as refined
products and feedstock for chemicals claim a complex process. All of these processes are
accompanied by various problems and corrosion is a major one, especially for the crude
with high sulfur content. To date the annual cost of corrosion worldwide is estimated at
over 3% of GDP of the planet, which is literally 3.3$ trillion. For that reason the problems
related with corrosion is of extreme importance (Hays, 2013).
It is believed that corrosion should be controlled and mitigated at the early stage of
indication. If not it can cause for the additional cost of lost time and involvement of

21
employee, repair of equipment or replacement of whole construction. Without
considering corrosion the outcome can be fatal (Nenry & Scott, 1994).
A detailed discussion of corrosion problems has been given by Henry and Scott (1994).
Depending on where the corrosion occurs they divided corrosion into several groups,
such as Corrosion in the Chemical Industry, Corrosion in Petroleum Production
Operations, Corrosion in Petroleum Refining and Petrochemical Operations, and
Corrosion of Petrochemical Pipelines. The corrosion caused by sulfur compounds is the
following.
5.1.1 Corrosion in petroleum production operations
There are several environmental factors that are more or less relative to oil and gas
production operations. The most important one is the environment found in actual
reservoir formations. Corrosives encountered in those formations are carbon dioxide,
hydrogen sulfide, polysulfides, organic acids, and sulfur in elemental state.
The first corrosion related problem is the presence of sulfate-reducing bacteria (SRB).
SRB is in charge of the majority of the bacterial problems in oil production. It sours crude
oil and gas leading to corrosion problems, also making it more difficult to refine
environmentally friendly, high quality fuels. SRB produces volatile and toxic hydrogen
sulfide as a by-product of
respiration (Figure 12). The
maximum allowable level of H2S
is set as low as 3 ppm, because
sulfide concentrations even below
1 mg/l in the water phase may
lead to high corrosion rates
(Dunsmore, Evans, Jones,
Burton, & Lappin-Scott, 2006).
Hydrogen sulfide is a relatively
strong corrodent. When dissolved
in water hydrogen sulfide is
extremely corrosive as it becomes
Figure 12 Sulfate reducing bacteria and
corrosion (Muyzer & Stams, 2008)

22
a source of hydrogen ions. In the absence of buffering ions, under 1 atmospheric H2S
partial pressure and pH level of 4, water is equilibrated. However, under very high
pressure conditions, pH values as low as 3 have been calculated (Nenry & Scott, 1994).
Another corrosive property of H2S is that it acts as a catalyst to promote absorption by
steel of atomic hydrogen formed by the cathodic reduction of hydrogen ions. As a
consequence, sulfide-stress cracking (SSC) takes a place. SSC can occur when H2S is in
contact with high-strength steel generally used in drilling, completing, and producing
wells. SSC is a type of spontaneous brittle failure which occurs at stresses well below the
yield strength of the material. Three conditions must be present for SSC to be present.
The first is a surface tensile stress which can be both applied and residual. The second
requirement is that the material must be exposed. The third requirement is that embrittling
agent, hydrogen sulfide, must be present in the reservoir (Emerson, 2012).
Hydrogen sulfide also enters into a reaction with elemental sulfur. In a gas phase, sulfanes
(free acid forms of a polysulfide) under high H2S partial pressure can be formed so that
elemental sulfur becomes mobile and is produced along with gaseous mixtures.
Nevertheless, elemental sulfur starts to precipitate as a result of pressure reduction in the
upper part of production tubing, which causes sulfur plugging (Nenry & Scott, 1994).
5.1.2 Corrosion in petroleum refining and petrochemical operations
The major corrosion problems in oil and gas processing facilities are not caused by
hydrocarbons but by various inorganic compounds, such as water, hydrogen sulfide,
hydrofluoric acid, and caustic. There are two essential sources of these conglomerates:
feed-stock contaminants and process chemicals, including solvents, neutralizers, and
catalysts (Nenry & Scott, 1994).
For practical purposes, corrosion in petroleum refineries and petrochemical plants is
classified as low- and high-temperature corrosion. Low-temperature corrosion is
considered to take place at temperatures below 260˚C in the presence of water. The main
source of low-temperature corrosion is the contaminants in crude oil. Those contaminants
are water, hydrogen sulfide, hydrogen chloride, nitrogen compounds and polythionic
acids (API, 1973).

23
Crude oils and gases that contain hydrogen sulfide are processed by most refineries
(Hudjins, 1969). Hydrogen sulfide is also can be found in some feed stocks handled by
petrochemical plants. This harmful chemical compound forms the black sulfide film seen
in almost all refinery equipment (Ewing, 1955). Hydrogen sulfide is the main component
of refinery sour waters and can cause corrosion problems in overhead systems of
fractionation towers, in hydrocracker and hydrotreater effluent streams, in catalytic
cracking units, in sour water stripping units, and, of course, in sulfur recovery units
(Piehl, 1968).
Sulfur compounds include hydrogen sulfide, polysulfides, mercaptans, aliphatic sulfides,
and thiophenes. Those contaminants, excluding thiophenes, react with metal surfaces at
high temperatures forming metal sulfides, organic molecules, and hydrogen sulfide. The
corrosiveness of sulfur compounds increases with accumulating temperature. Depending
on a specific process, corrosion can be in the form of uniform thinning, localized attack,
or erosion-corrosion (Nenry & Scott, 1994).
When it comes to high-temperature processes, corrosion is of considerable importance.
Facility failures can have undesirable consequences because refinery processes at high
temperatures involve high pressures as well. With crude oil streams, there is always the
danger of fire when ruptures take place. That is why corrosion by different sulfur
compounds at temperatures between 260 and 540˚C is a general issue in petroleum
refining and petrochemical processes (Nenry & Scott, 1994).
5.2 Corrosion control mechanisms in sour systems
There are considerable numbers of corrosion detection methods. Two parameters, such as
the operating conditions and chemical nature of the reservoir fluid have to be known in
order to select corrosion control method properly. The correct observation and analytical
solutions are also important. After necessary studies and considering pros and cons of the
available control methods corrosion detection system should be chosen. The major
currently available methods are given in Table 5 below, but it should be noted that there
are other methods as well, such as iron and manganese counts, galvanic meters,
electromagnetic flux leakage, chemical and bacteria analysis, metallurgical examination
of failed equipment, simulation studies, and operating condition monitoring.

24
Table 5 Corrosion control mechanisms in sour systems (Gerus, 1974)
Weight loss coupons Advantages: Disadvantages:
Weight loss coupons are metal strips that
are located into actual flow stream and
allowed to corrode spontaneously. The
coupons are scaled before installation.
After some time of being in the fluid
stream it is cleaned and scaled again
before removal. The corrosion rate is
defined by weight loss, exposure time, the
dimensions of the coupon, and is
measured in mm/year or g/cm2.
•It is cheap and it does not
require significant engineering
maintenance.
•The relatively infrequent data
is obtained;
•Coupons placed on the upper
part will not detect severe
corrosion, as in most gathering
facilities the corrosion
phenomena is limited to the
bottom area of the pipe wall;
•Coupons in short term
observation periods cannot
indicate corrosion rate.
Radiography Advantages Disadvantages
Radiography is the extensively used
corrosion control method. The general
concept of the method is to place
radioactive source on one side of a pipe
and to put radiographic film on the other
side, and to allow the radioactive
emissions to pass through the metal. The
X-ray absorption is proportional to the
mass of metal that the rays pass through.
Hence, the exposed film indicates pits in
the pipe as dark spots.
•The actual pictorial
representation of the interior of
the pipe;
•The inspection is held without
interrupting of whole process;
•The radiography is the only
method which detects pitting
type corrosion.
•Only specific locations can
be observed;
•The earth around the pipe is
removed at a certain locations.
Ultrasonic inspections Advantages Disadvantages
Ultrasonic inspections are used to measure
wall thickness by means of sound waves.
The instrument consists of transducer
probe which is connected to digital
recording tool. The transducer transmits
sound waves through the metal and
receives the reflected signal.
•The large number of
inspections can be made in a
relatively short time;
•The instrument is portable and
can be used any place;
•The measurements can be
made without stopping the flow
line.
•The extreme localization of
inspection;
•The shape of the corroded
surface affects the sound wave
reflection.
Visual inspections Advantages Disadvantages
Visual inspections by experienced worker
are one of the most efficient methods
identifying corrosion problems. While
using this method pit depths can be
•Any pit depth can be measured
and a pitting corrosion rate can
be established;
•Excellent for close observation
•Extreme localization of
inspection;
•Expensive for the installation
of valves and bypass loops at

25
measured and the remaining life of the
components of process facilities can be
estimated.
of severely corrosive locations. every location.
Hydrogen probe Advantages Disadvantages
Hydrogen probes detect the level of
corrosion affected by hydrogen sulfide.
The concept of the method is that atomic
hydrogen diffuses through the metal probe
and combines in the cavity to form
hydrogen gas. The rate of gas formation
detected by pressure increases within the
sample and this rate is related to corrosion
rate in the system.
•Fluid stream is uninterrupted •Qualitative rather than
quantitative indications
•The high sensitivity of the
instrument
5.3 Corrosion mitigation techniques in sour systems
Mitigation of corrosion is considered to be the final step in corrosion problems in sour
systems. First of all, corrosion mechanisms should be defined and then mitigation tool is
decided upon. After detection of specific corrosion mechanism, more detailed studies can
be carried out, and after that the mitigation techniques can be chosen. There are a lot of
mitigation techniques which is used in sour systems and following are the major ones
(Gerus, 1974):
(i) Scraping and pigging
The technique of using scraping is based
on removal of scale, corrosion products
and other compounds from the surface of
pipe wall. The scraper is a cylindrical tool
with a diameter a little greater than the
internal diameter of the pipe and with wire
brushes and metal discs (Figure 13).
Pigging is performed in the same way as
scraping, but the device does not have
scraping brushes or plates. The pig is
usually placed in gathering line, and then
Figure 13 Corrosion control by scraping
and pigging (O'Meara, 2006)

26
propelled through the system, commonly by well pressure. The disadvantage of the
method is that pig launching and receiving facilities must be installed through all
gathering system.
(ii) Chemical cleaning
Chemical cleaning is the injection of specific chemicals into the system for the purpose of
dissolution of deposit or slug. Following removal of the solution results in clean pipe
surface. Often, this method is used in combination with pigging after dissolution process
is completed. The chemical cleaning is an efficient method; however, as the chemical
used can react with the iron in the pipe, precautions should be taken.
(i) Corrosion inhibitors
Corrosion inhibitors injection is the mostly
implemented technique to the mitigation sour
oil and gas corrosion. Corrosion inhibitors
are the compounds that, when introduced to
the system, reduces the metal loss due to
corrosion attack. These inhibitors can
interfere with the anodic or cathodic reaction,
moreover, can form protective barrier on the
metal surface as it is shown in Figure 14. The
dosage and frequency of treatment are
dependent on different factors, including
severity of corrosion, total amount of fluid
produced, percentage of water, nature of
corrodent, chemical selected, and fluid level
in the casing annulus (Nenry & Scott, 1994).
(ii) Dew point control
Corrosion does not occur if there is no complete electrical circuit from anode to cathode.
Brine water commonly provides an electrical environment in the produced fluid. So for, if
the system with sour content is maintained without water or condensation the occurrence
of corrosion becomes insignificant. The system which does not produce water can be
Figure 14 Corrosion mitigation by inhibitors
(ICT, 2013)

27
protected from water or condensation by controlling the dew point temperature. The dew
point temperature can be accomplished by adding thermal energy to the system.
(iii) Biocides
The introduction of biocides into a system is right when the corrosion mechanism has
been proved to be biologically induced. They are added into the system to kill the bacteria
upon contacts. This results on termination of the corrosive attack on the surface.
(iv) Internal coatings and linings
This method of corrosion mitigation is extremely effective as it helps to isolate the
corrosive fluid form the metal surface. The success is achieved by using coatings and
linings. The coatings provide a barrier to
the diffusion of reactants and the flow of
electrical current. As a result, corrosion
is avoided. By means coatings can be
permanent and temporary. The first one
is a thin sheet of corrosion resistant
metal or alloy to a thicker base metal at
elevated temperatures. Coatings can be
formed and fabricated into transportation
and process facilities. The second one is
applied by the automatic machine that
cleans the pipe or by hand sprayers.
Figure 15 Typical coated steel pipe
(Offshore Technology, 2012)

28
6. Petroleum products
6.1 Classification of petroleum products
The assortment of petroleum-refining industry consists of more than 500 types of
gaseous, liquid and solid petroleum products in terms of their purpose. Consequently,
products are difficult to place on an individual evolutionary scale. However, they can be
classified in a wide variety of different ways within the oil industry (Favennec, 2001):
Refinery operators
differentiate between light
products (gas and
gasolines), middle
distillates (kerosene,
automotive gas oil and
heating gas oil), and heavy
products (heavy fuel oil and
bitumen).
For transportation
purposes, products are
distinguished as white
products (motor gasoline,
jet fuel, and automotive and
heating gas oil) and black
products (fuel oil and
bitumen).
Product dealers ascertain between main products and specialties. Main
products are sold in a large quantities and distinction is confined so the product
assortment is not considerable. Margins for main products, such as motor fuels, jet
fuel, heating gas oil and heavy fuel oil, are fairly low. For sales of specialties,
such as LPG, aviation gasoline, lubricants and bitumen, there is an opposite
situation. They are sold in a little volume but give a high added value, both in
terms of the products itself or the service provided.
Figure 16 Typical product produced from a barrel
of oil in US (EIA, 2012)

29
7. Composition of crude oils and petroleum products
Crude oil is a unique mixture of a great number of individual chemical compounds. Each
crude oil has a compound which is not matched exactly in composition or in properties by
any other sample of crude oil. Chemical and physical composition of crude oil can vary
not only with the location and age of the oil field, but also with the depth of the individual
well. More than that, two neighboring wells may produce hydrocarbons with considerably
different characteristics.
In order to understand the nature of sulfur compounds in crude oil the basic knowledge of
general crude composition is needed. The main constituents present in crude oils are
hydrocarbons. The hydrocarbon content may be as high as 97% by weight in light
paraffinic oils or as low as 50% by weight in heavy crude and bitumen. Other non-
hydrocarbon constituents include small amount of organic compounds containing sulfur,
oxygen, and nitrogen, as well as compounds containing metallic elements, such as
vanadium, nickel, iron, and copper (Speight, 2007). Sulfur compounds are the focus in
this master thesis and will be discussed in more detail throughout subsequent chapters.
7.1 Hydrocarbon compounds
(i) Saturated Aliphatic Hydrocarbons or Alkanes or Paraffins
Alkanes are straight-chain normal alkanes and branched iso-alkanes with the general
formula CnH2n+2. Alkanes are present in all crude oils. Usually, the alkane content in the
oils ranges from 20 to 50%. In waxy crudes content of alkanes can be as high as 60% or
even more, conversely, in low-paraffinic oils the alkane content may fall to 1.2%. If the
distribution of alkanes by fractions is considered, then there is the following general
pattern for all crudes: the content of alkanes decreases with increasing boiling point of
petroleum fractions (Ryabov, 2009).
(i) Saturated Cyclic Hydrocarbons or Cycloparaffins or Napthenes or
Cycloalkanes
Saturated cyclic hydrocarbons make up the bulk of petroleum hydrocarbons. The
cycloalkane composition in crude worldwide typically varies from 40 to 70%. The
30
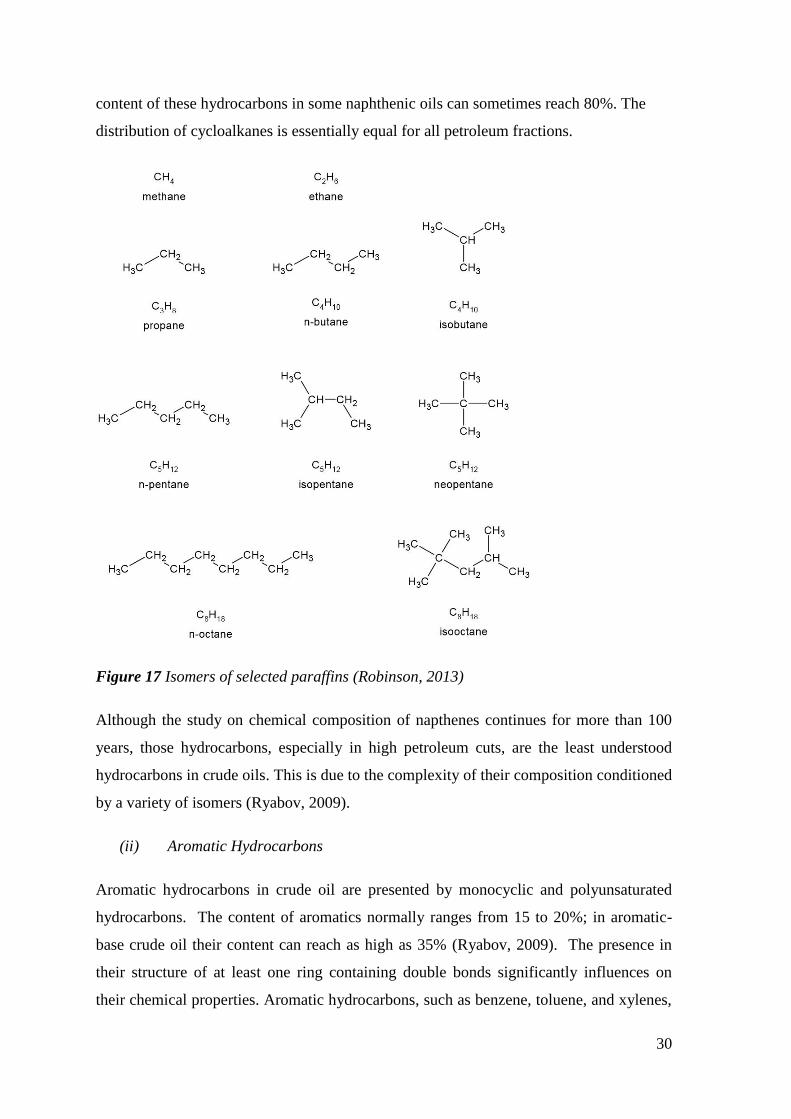
content of these hydrocarbons in some naphthenic oils can sometimes reach 80%. The
distribution of cycloalkanes is essentially equal for all petroleum fractions.
Figure 17 Isomers of selected paraffins (Robinson, 2013)
Although the study on chemical composition of napthenes continues for more than 100
years, those hydrocarbons, especially in high petroleum cuts, are the least understood
hydrocarbons in crude oils. This is due to the complexity of their composition conditioned
by a variety of isomers (Ryabov, 2009).
(ii) Aromatic Hydrocarbons
Aromatic hydrocarbons in crude oil are presented by monocyclic and polyunsaturated
hydrocarbons. The content of aromatics normally ranges from 15 to 20%; in aromatic-
base crude oil their content can reach as high as 35% (Ryabov, 2009). The presence in
their structure of at least one ring containing double bonds significantly influences on
their chemical properties. Aromatic hydrocarbons, such as benzene, toluene, and xylenes,

31
are primary raw materials for the petrochemical industry, moreover, they largely
contributes to the octane number of gasoline. However, the negative properties of higher
homologs, such as environmental and public health problems and degradation of the
catalyst activity, are also known (Wauquier, 1995).
Figure 18 Aromatics and napthenes found in crude oil (Robinson, 2013)
(iii) Unsaturated Aliphatic Hydrocarbons or Olefins or Alkenes
The presence of olefins in crude oil has been under dispute for many years. However,
evidence for the presence of significant proportions of olefins in Pennsylvanian crudes
has been obtained (Speight, 2007). Next evidence is found in East Siberian and Tatar
crude oils where the content of olefins can be in range of 15-20% (Ryabov, 2009). Even
though, those findings are assumed as a few special cases.
In spite of previous facts, olefins are found in refining products, especially in the fractions
coming from conversion of heavy fractions. The first few substances of these chemical
compounds are very important feedstock materials for petrochemical industry: ethylene,
propylene, and butenes (Wauquier, 1995). Selected light olefins are presented in Figure
19.

32
Figure 19 Selected light olefins (Robinson, 2013)
7.2 Non–Hydrocarbon compounds
(i) Heteroatomic Organic Compounds
Crude oils contain considerable amounts of organic non-hydrocarbon constituents. Those
constituents when present in organic compounds, atoms other than carbon and hydrogen
are called hetero-atoms. Sulfur-, nitrogen-, oxygen- containing compounds (Figure 20)
appear throughout the entire boiling range, but tend to concentrate mainly in the heavier
fractions (Speight, The Refinery of the Future, 2011).
Although they are minor constituents of crude oil, their influence on processing costs can
be major. Some of the sulfur and nitrogen compounds that present problems to oil
refiners. When burned in vehicles or power plants, high-sulfur fuels cause acid rain. For
many refining processes, sulfur is a catalyst poison. Nitrogen is also catalyst poison.
Therefore, refiners devote a considerable amount of time and money to remove hetero-
atoms from intermediate streams and finished products.
(i) Organometallic compounds
In the heaviest fractions such as resins and asphaltenes organometallic compounds such
as nickel and vanadium are found and their concentrations have to be reduced to convert
the oil to transportation fuel. The level of metal compounds ranges from few parts per
million to 200 ppm for nickel and up to 1200 ppm for vanadium.

33
Figure 20 Hetero-atom compounds found in crude oil (Robinson, 2013)

34
8. Sulfur content of crude oils
8.1 Origin of sulfur
Sulfur in crude oil comes generally from the decomposition of organic matter, and with
the passage of time and of gradual settling into strata, the sulfur segregates from crude oil
in the form of hydrogen sulfide that appears in the associated gas, some portion of sulfur
stays with the liquid. Another theory behind origin of sulfur compounds is the reduction
of sulfates by hydrogen by bacterial action of the type desulforibrio desulfuricans:
4H2 + SO4=(bacteria)
→H2S + 2OH- + 2H2O
Hydrogen comes from the reservoir fluid and the sulfate ions are kept in the reservoir
rock, as a result hydrogen sulfide is generated. The H2S formed can react with the sulfates
or rock to form sulfur that remains in composition of crude as in the case of oil from
Goldsmith, Texas, USA. Moreover, under the conditions of pressure, temperature and
period of formation of the reservoir H2S can react with the hydrocarbons to give sulfur
compounds (Wauquier, 1995):
3H2S + SO4 → 4S + 2OH- + 2H2O
Sulfur compounds are among the most important non-hydrocarbon heteroatomic
constituents of petroleum. There are significant amount of sulfur species found in crude
oil and sulfur compounds of one type or another are present in all crude oils. Furthermore,
only preferred type of sulfur exist in any particular crude oil, and this is dictated by the
prevailing conditions during the formation, maturation, and even in situ alteration.
In general, the higher the density of the crude oil, the lower the API gravity of the crude
and the higher the sulfur content. The total sulfur in crude oil can vary from 0.04% w/w
for light crude oil to about 5% w/w for heavy crude oil and tar sand bitumen.
Nevertheless, the sulfur content of crude oils which is produced from different locations
varies with time, depending on the chemical composition of newly discovered fields,
especially those in different geological environments (Speight, 2007).

35
8.2 Nature of sulfur compounds
Sulfur compounds are substances of different chemical nature, from the elemental sulfur
to hydrogen sulfide and mercaptan compounds, sulfides, open-chain and cyclic disulfides,
and heterocyclic derivatives of thiophene, thiophane and other more complex compounds.
To date, with the exception of low molecular weight compounds, most of the sulfur
compounds oils are not deciphered. Free elemental sulfur is rarely found in crude oils.
The emergence of free sulfur is associated with the decomposition of more complex
sulfur compounds.
The bulk of sulfur compounds found in crude oil are distributed between the heavy cuts
and residues (Table 7) in the form sulfur compounds of the napthenophenanthrene or
naphthenoanthracene type, or in the form of benzothiophenes, that is molecules having
one or several naphthenic and aromatic rings that usually contain a single sulfur atom
(Wauquier, 1995).
Table 6 Sulfur content of selected crude oils (surface conditions) (Wauquier, 1995)
Crude oil name Country of origin Weight % sulfur
Bu Attifel Libya 0.10
Arjuna Indonesia 0.12
Bonny light Nigeria 0.13
Hassi Messaoud Algeria 0.14
Ekofisk North Sea (Norway) 0.18
Arabian light Saudi Arabia 1.80
Kirkuk Iraq 1.95
Kuwait Kuwait 2.50
Cyrus Iran 3.48
Boscan Venezuela 5.40
Table 7 Distribution of total sulfur in the different cuts of crude Arabian light (Wauquier,
1995)
Cut Light
gasoline
Heavy
gasoline
Kerosene Gas oil Residue Crude
Temperature interval, ˚C 20-70 70-180 180-260 260-370 370+ -

36
Specific gravity, 0.648 0.741 0.801 0.856 0.957 -
Average molecular weight 75 117 175 255 400 -
Total sulfur, weight % 0.024 0.032 0.202 1.436 3.167 1.80
Number of moles of
sulfides/Total number of
moles
1/1800 1/855 1/90 1/9 1/2.5 -
The sulfur compounds determined in crude oil are classified into six chemical groups.
(i) Free elemental sulfur S
Free elemental sulfur is rarely found in crude oil; however it can be present in a
suspension or dissolved in the liquid. Sulfur, while crude oil is heated, partially reacts
with hydrocarbons:
2RH+2S → R – S – R + H2S (X)
It is believed that determination of the presence of elemental sulfur in oil is a complex
process and that any declaration of its presence has met with lack of confidence
(Eccleston et al., 1992). The crude oil from Goldsmith, which is in Texas, is richest in
elemental sulfur (1% by weight for a total sulfur content of 2.17%) (Wauquier, 1995).
(ii) Hydrogen sulfide H2S
Hydrogen sulfide is a colorless, flammable, harmful gas that smells like rotten eggs (NPI,
2013). H2S is found in reservoir gas and dissolved in the reservoir liquid (<50 ppm by
weight). Often the appearance of H2S in petroleum fractions is a consequence of thermal
decomposition of organosulfur compounds (Ryabov, 2009). It is itself and the sulfur
dioxide (SO2), the product of H2S combustion cause poisoning of humans, animals and
plants.
The presence of H2S in the reservoir crude determines the number of serious
complications for production of oil, due to its high corrosiveness and toxicity. It causes
corrosion of steel pipes and tanks, compressors, fittings and other surface equipment,
particularly in the presence of carbon dioxide and water vapor in the feed, and under
elevated temperatures. Therefore, the gas used as a fuel in industrial furnaces must not

37
contain hydrogen sulfide above the limit determined in each individual case. Furthermore,
the presence of H2S accelerates the formation of gas hydrates.
H2S is mostly formed during processing operations such as catalytic cracking,
hydrodesulphurization, thermal cracking and by thermal decomposition during distillation
(Wauquier, 1995).
(iii) Thiols
Thiols or mercaptans are organosulfur compounds that contain a sulfhydryl group (SH),
also known as a thiol group, that is composed of a sulfur atom and a hydrogen atom
attached to a carbon atom. This molecular structure is what distinguishes thiols from other
organic chemical compounds with an oxygen-to-carbon bond configuration. It is also
what gives many high velocity thiols a persistent and highly unpleasant odor that is
reminiscent of rotten eggs (Mayer, 2013).
The general formula of thiols is R – S – H, where R stands for an aliphatic or cyclic
radical. S – H group is responsible for their acidic behavior. The level of thiols in crude
oil is very low, if not zero. However, they may appear from other organosulfur
compounds during refining operations, which is illustrated in Table 9. It should be noted
that the content of mercaptans in crude varies from 0.1 to 15 % mass from total content of
sulfur compounds (Ryabov, 2009).
Table 8 Distribution of mercaptan sulfur among the different cuts of Arabian light crude
oil (Wauquier, 1995)
Nature of cut (temperature
interval, ˚C)
Mercaptan sulfur, % Total sulfur, % % mercaptan sulfur
total sulfur
Crude petroleum 0,0110 1,8 0,6
Butane 0,0228 0,0228 100
Light gasoline (20-70˚C) 0,0196 0,0240 82
Heavy gasoline (70-150˚C) 0,0162 0,026 62
Naphtha (150-190˚C) 0,0084 0,059 14
Kerosene (190-250˚C) 0,0015 0,17 0,9
Gas oil (250-370˚C) 0,0010 1,40 <0,1
Residue (370 +˚C) 0 3,17 0

38
Table 9 Mercaptans identified in crude oils (Wauquier, 1995)
Name Chemical formula Boiling point, Cut
Methanethiol CH4S 6 Butane
Gasoline
Ethanethiol C2H6S 34 Gasoline
2 methylpropanethiol C4H10S 85 Gasoline
2 methylheptanethiol C8H18S 186 Kerosene
Cyclohexanethiol C6H12S 159 Gasoline
(iv) Sulfides
The sulfides are organosulfur compounds which can have a linear or ring structure. They
are chemically neutral. The boiling points of sulfides are higher than of mercaptans for
molecules of equal carbon number. Examples of sulfides identified in selected crude oils
are shown in Table 10. They create the bulk of sulfur containing hydrocarbons in the
middle distillates (kerosene and gas oil), where their content is equal to 50-80% of total
sulfur compounds (Ryabov, 2009).
Table 10 Sulfides identified in the crude oils (Wauquier, 1995)
Name Chemical formula Boiling point, Cut
3 Thiapentane C4H10S 92 Gasoline
2 Methyl –
3 thiapentane
C5H12S 108 Gasoline
Thiacyclohexane C5H10S 141,8 Gasoline
2 Methylthiacyclo-
pentane
C5H10S 133 Gasoline
Thiaindane C7H12S 235,6 Kerosene
Thiabicyclooctane C7H12S 194,5 Kerosene
and gas oil
(v) Disulfides
The disulfides (general formula: R – S – S – R’) are found in small quantities in
petroleum fractions with a boiling point up to 300˚C. They account for 7-15% of the total
sulfur (Ryabov, 2009).

39
The disulfides are complex chemical compounds which are difficult to separate; as a
result, few have been identified:
Dimethyl disulfide (2,3 dithiobutane)
CH3 – S – S – CH3
Diethyl disulfide (2,3 dithiohexane)
CH3 – CH3 – S – S – CH2 – CH3
(vi) Thiophene and derivatives
Thiophene and its derivatives are neutral cyclic and temperature resistant compounds
with five-membered ring. They do not dissolve in water, and their chemical properties are
similar to aromatic hydrocarbons.
The first determination of thiophene and its derivatives was in 1899, and it was believed
that they came from the degradation of sulfides during refining operations. That was until
1953, the year when the methyl-thiophenes were identified in kerosene from Agha Jari
crude oil, Iran. The existence of those sulfur compounds was no longer doubted after the
identification of benzothiophenes and their derivatives (Table 11).
Table 11 Thiophene derivatives identified in crude oils (Wauquier, 1995)
Name Chemical formula Boiling point, Cut
Thiophene C4H4S 84 Gasoline
Dimethylthiophene C6H8S 141.6 Gasoline and
Kerosene
Benzothiophene C8H6S 219.9 Kerosene
Dibenzothiophene C12H8S 300 Gas oil
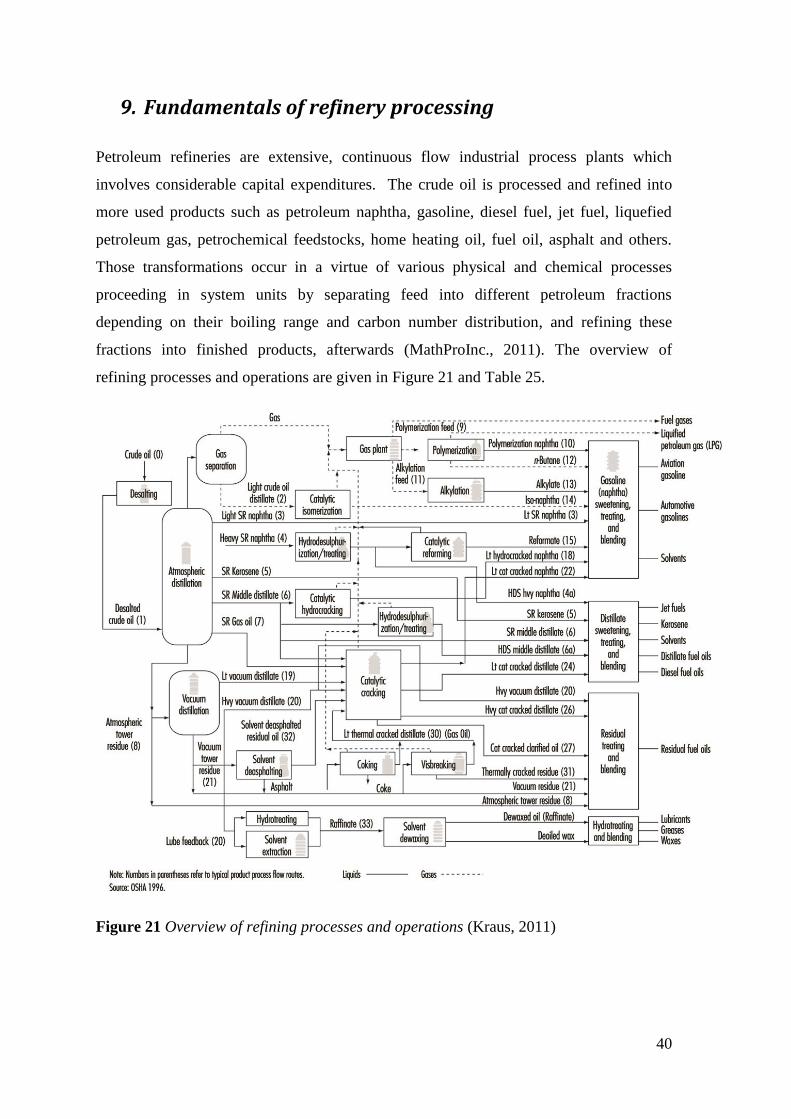
40
9. Fundamentals of refinery processing
Petroleum refineries are extensive, continuous flow industrial process plants which
involves considerable capital expenditures. The crude oil is processed and refined into
more used products such as petroleum naphtha, gasoline, diesel fuel, jet fuel, liquefied
petroleum gas, petrochemical feedstocks, home heating oil, fuel oil, asphalt and others.
Those transformations occur in a virtue of various physical and chemical processes
proceeding in system units by separating feed into different petroleum fractions
depending on their boiling range and carbon number distribution, and refining these
fractions into finished products, afterwards (MathProInc., 2011). The overview of
refining processes and operations are given in Figure 21 and Table 25.
Figure 21 Overview of refining processes and operations (Kraus, 2011)

41
9.1 Classifying refineries by configuration and complexity
All refineries are unique. Their configuration and complexity differ from one refinery to
another one. They have different histories, locations, preferred crude oil slate, quality
specifications for refined products and market drivers. For that reason, there is no distinct
classification which can group all of the possible combinations and permutations of the
processes that fit together. Although no two refineries have identical configurations, they
can be classified into groups of comparable refineries, defined by refinery complexity
(Fahim et al., 2010):
Simple refinery. It has atmospheric crude distillation, a catalytic reformer to
produce high octane gasoline, and middle distillate hydrotreating units.
Complex refinery. It has in addition to the units of a simple refinery, conversion
units such as hydrocrackers and fluid catalytic cracking units.
Ultra-complex refinery. The refinery has all of the units above in addition to deep
conversion units which convert atmospheric or vacuum residue into light
products.
The complexity of a refinery can be assessed by calculating the complexity factor. Each
unit has a coefficient of complexity (CCi) defined as the ratio of the capital cost of this
unit per ton of feedstock to the capital cost of the crude distillation unit (CDU) per ton of
feedstock. The complexity factor (CFi) of the whole refinery is then calculated from the
coefficients of complexity for the units in the refinery as follows:
∑
where, Fi and FCDU are the feed rate to unit i and CDU, respectively.

42
10. Classification of desulphurization technologies
There is no unique way of classifying the desulphurization processes. They can be
categorized by the type of sulfur compound being removed, the role of hydrogen, or the
nature of process used.
Crude oil desulphurization technologies can be grouped based on the nature of a key
process to remove sulfur (Figure 22). First type of classification refers to the most studied
and commercialized catalytic technologies, which include conventional HDS, HDS by
advanced catalysts and/or by advanced reactor design, and HDS with additional chemical
processes to meet the fuel specifications.
Second class of desulphurization is based on the physico-chemical processes which vary
in nature from catalytic processes, including distillation, alkylation, oxidation, extraction,
adsorption or combined version of these processes (Babich & Moulijn, 2003).
Figure 22 Desulphurization technologies classified by nature of a key process to remove
sulfur (Babich & Moulijn, 2003)

43
11. Hydrotreating
Hydrotreating is a refining process in which the feedstock is treated at temperature and
under pressure where thermal decomposition in the presence of hydrogen is minimized.
The main purpose is to remove about 90% of undesirable contaminants including
nitrogen, sulfur, oxygen, metals, and unsaturated hydrocarbons (olefins) from liquid
petroleum fractions. Hydrotreating processes have been developed in connection with the
increase of high sulfur heavy crude refining and more stringent quality requirements for
fuels and feedstocks for catalytic processes.
Generally, hydrotreating is applied prior to processes, such as catalytic reforming and
catalytic cracking so that the catalyst is not contaminated by unrefined feedstock and that
organosulfur compounds are removed and middle-distillate fractions are converted into
finished products such as kerosene, diesel and heating fuel oils. Furthermore,
hydrogenation processes converts olefins and aromatics into aromatic compounds.
There are several important reasons for removing heteroatoms from petroleum fractions
and some of them are listed below (Speight, 2007):
1. Corrosion control and mitigation while refining, handling, or use of
different petroleum products
2. Compliance with the environmental regulations and laws regarding
detrimental pollutants
3. Production of products with an acceptable odor and specification
4. Increasing the performance and stability of motor gasoline
5. Decreasing smoke formation in kerosene
6. Reduction of heteroatom content in fuel oil to a level that improves
burning characteristics and is environmentally acceptable
Hydrogenation processes may be classified as destructive and non-destructive.
Destructive hydrogenation is a single-stage or multi-stage catalytic process accompanied
by the split of carbon-carbon linkages to produce low molecular weight hydrocarbons
from high molecular weight fractions. Hydrogenation treatment requires severe process
conditions and the use of high hydrogen pressures in order to minimize polymerization
and condensation.

44
Non-destructive hydrogenation is commonly used for the purpose of improving product
quality without considerable conversion of the boiling range. Moderate process
conditions are applied so that only the more unstable materials are invaded. As a result,
nitrogen, sulfur, and oxygen contaminants are exposed to hydrogenolysis to recover
ammonia, hydrogen sulfide, and water, respectively.
11.1 Hydrodesulphurization
Growing dependence on heavy oils and residua has arisen, hence of sustainable decrease
of conventional crude oil, due to the depletion of reserves all over the world. As a result,
current trend to convert as much as possible feedstock to liquid products is causing an
increase in the total sulfur in petroleum products. Hydrodesulphurization (HDS), one type
of hydrotreating, is currently playing a major role in product improvement when it comes
to sulfur problem, moreover it is the most widely used desulphurization technology.
Figure 23 Schematic of distillate hydrodesulphurization (SET Labs, 2008)
HDS is a catalytic chemical process commonly used to remove sulfur from natural gas
and from refined petroleum products such as gasoline or petrol, jet fuel, kerosene, diesel
fuel, and fuel oils. The mechanism is based on reactive adsorption in which metal based
adsorbents, such as CoMo/Al2O3 and NiMo/Al2O3, capture sulfur to form metal sulfides.
The exhausted metal sulfide is sent to regeneration reactor and after reduction with
hydrogen is again introduced into the system to remove sulfur from crude. The principal
process scheme can be seen in Figure 23, and simplified flow scheme of an oil refinery
with possible locations of desulphurization units is shown in Figure 24.

45
In an industrial hydrodesulphurization unit the hydrodesulphurization reaction takes place
in a reactor unit at elevated temperatures ranging from 290 to 445 °C and elevated
pressures ranging from 35 to 170 atmospheres of absolute pressure, typically in the
presence of a catalyst consisting of an alumina base impregnated with cobalt and
molybdenum (usually called a CoMo catalyst) (Speight, 2011). The other important
process parameters, such as hydrogen recycle rate, catalyst life, the percentage of sulfur
and nitrogen removal for different feedstocks are shown in Table 12.
Table 12 Process parameters for hydrodesulphurization (Speight, 2011)
Parameter Naphtha Residuum
Temperature (˚C) 300 to 400 340 to 425
Pressure (atm.) 35 to 70 55 to 170
LSHV 4.0 to 10.0 0.2 to 1.0
H2 recycle rate (scf/bbl) 400 to 1000 3000 to 5000
Catalyst life (years) 3.0 to 10.0 0.5 to 1.0
Sulfur removal (%) 99.9 85.0
Nitrogen removal (%) 99.5 40.0
There are different recently developed technologies. For instance, ConocoPhillips created
the first commercial process based on reactive adsorption utilizing nickel on zinc oxide as
an adsorbent. This technology is called S-zorb and used for producing ultra-low sulfur
fuel. Another research is done by Research Triangle Institute. The development is based
on reactive adsorption of sulfur over Fe or Cu promoted alumina-zinc oxide. The main
difference of this technology which is called TreND from S-zorb is that it does not
require hydrogen nor needs just a little hydrogen (Tuli & Kumar, 2008).
11.2 Process parameters
(i) Hydrogen partial pressure
The high extent of desulphurization can be achieved with the increase of the total pressure
in the system. Hence, cocking reactions will be minimized and premature aging of the
remaining portion of the catalyst will not be encountered. Hydrotreating processes are
carried out at a relatively high pressure of 2 – 5 MPa. Near the upper limit of the set

46
pressure the extent of desulphurization in connection with increasing pressure is
negligible.
It was determined that the depth of desulphurization depends on hydrogen partial
pressure, because the increase of total system pressure does not substantially contribute to
hydrogenation processes. If the hydrogen partial pressure is too low for the selected
system, the effectiveness and the service life of catalysts will be decreased. With
increasing hydrogen partial pressure up to 3 MPa degree of hydrogenation of sulfur
compounds increases very rapidly, and above 30 MPa very slightly (TehnoInfa, 2009).
Figure 24 Simplified flow scheme of an oil refinery with possible locations of
desulphurization units (Babich & Moulijn, 2003)
(ii) Space velocity
As the space velocity is increased, the residence time of feedstock in reactor is decreased,
and vice-versa, with the decreasing space velocity the feed contact time with catalyst is
increased, hence, the degree of treatment is maximized. However, the low space velocity
reduces the amount of feed through the reactor causing reduced plant capacity.
Therefore, there is a maximum allowable space velocity for each feedstock, and a
hydrotreatment process is precisely set to this rate.

47
When selecting the space velocity not only fractional and chemical content of the feed has
to be taken into account, but also the state of the catalyst, as well as other process
parameters (temperature, pressure) affect the rate of desulphurization (TehnoInfa, 2009).
(iii) Reaction temperature
The optimum reaction temperature depends on the feedstock quality, process conditions
and the catalyst activity, and it is in the range of 340 – 400 ˚C. The rate of
hydrodesulphurization increases with increasing temperature, reaching a maximum at
about 420˚C.
At higher temperatures the rate of hydrogenation is reduced: for sulfur compounds -
slightly, and for unsaturated and aromatic hydrocarbons - quite sharply. Consequently,
this results in excessive coking reactions and premature catalyst aging rates. For that
reason, units are designed to avoid the use of such temperatures (Speight, The Chemistry
and Technology of Petroleum, 2007).
(iv) Catalyst life
The loss of catalytic activity is caused by several factors. In normal process conditions,
the catalyst deactivation occurs gradually and continuously throughout the cycle due to
coke formation, but there are a few points that explain the high rate of deactivation.
Coking occurs due to the presence in the feedstock of high-molecular compounds or by
condensation of polynuclear aromatic compounds. In normal operation conditions, a high
hydrogen partial pressure and a hydrogenation rate of the catalyst impede the process of
coking caused by condensation reactions.
Organometallic compounds decompose and are held on the catalyst surface. Alkali metals
can accumulate on the catalyst due to insufficient demineralization of feedstock or
because of its contact with the salty water and additives. These metals are unregulated
poisons to the catalyst.
Organic nitrogen compounds present in feedstock are converted into ammonia in
hydrogenation processes. Since ammonia is a compound with basic properties, it
competes with the reactants at the acid sites of the catalyst and inhibits its activity. Most

48
of the ammonia is removed from the reactor unit with water and, therefore, its effect on
catalyst deactivation is low.
Over time, the catalyst activity decreases due to the deposition of catalyst poisons and
coke on its surface. Reducing the hydrogen partial pressure in the circulating gas and the
exaggeration of the process conditions contribute to coking of the catalyst.
Gradually the catalyst "ages" through recrystallization and change of the surface structure
and also due to adsorption on the surface of metals and other substances that blocks the
active sites. In this case, the catalytic activity significantly decreases and the catalyst is
changed to the new one.

49
12. Unconventional desulphurization technologies
HDS operates in considerably high temperatures and pressures with hydrogen to
regenerate organosulfur compounds into lighter hydrocarbons and hydrosulfides. HDS
removes light organosulfur compounds, as mercaptans and thiophenes; however, when it
comes to heavier sulfur mixtures like dibenzothiophene and its derivatives it is not as
effective. HDS is also an expensive process, for instance, the cost of desulphurization of
20,000 barrel of oil per day is as much as $40 million. Moreover, additional hydrogen and
sulfur plant capacities would double the investment into refinery plant (Johnson S. W.,
1995).
Figure 25 Reactivity of various organic sulfur compounds in HDS versus their ring sizes
and positions of alkyl substitutions on the ring (Fahim et al., 2010)
12.1 Oxidative desulphurization
Oxidative desulphurization (ODS) is an innovative technology that can be used to reduce
the cost of producing ultra-low sulfur diesel (Gatan et al., 2004). It has been in focus since
1960’s. Different companies like BP, Texaco, Shell were developing suitable ODS
technologies to obtain gas oil fractions with low sulfur content. Nevertheless, with more

50
than 80 patents granted and implied several pilot scales, no commercial plant has yet been
built (Tuli & Kumar, 2008).
The basic mechanism of ODS is, first the organosulfur compounds present in middle
distillate fractions are oxidized to the corresponding sulfoxides and sulfones by an
oxidant (such as H2O2, ozone, t-butyl hydroperoxide, t-butyl hypochlorite, etc.) and then
these sulfoxides and sulfones are removed from diesel by extraction, adsorption,
distillation or decomposition .
ODS has more advantages comparing with hydrodesulphurization. The capital
expenditure for ODS is less than for HDS as different fractions can be oxidized under low
temperature and pressure conditions and expensive hydrogen is not required. It is
relevant for small and medium scale refineries for the locations which are far from water
pipelines as the use of hydrogen is avoided (Zongxuan et al., 2011).
Figure 26 Conversion of 4,6-DMDBT after oxidation with H2O2 as a function of reaction
time at different reaction temperatures under mild conditions (Zongxuan et al., 2011)
51
12.2 Biocatalytic desulphurization
The increasing global levels of sulfur content in crude oil have motivated the
development of alternate desulphurization technologies. Microbial desulphurization or
biodesulphurization (BDS) has gained interest due to the ability of certain biocatalysts to
desulfurize compounds (benzothiophene, dibenzothiophene and its derivatives) that are
recalcitrant to the currently employed hydrodesulphurization technology.
BDS is a relatively new technological process used to remove sulfur compounds from the
crude oil. Special protein-based biocatalysts are needed for BDS. The general idea of
BDS is to bring air, whole cell, oil and water into intimate contact, and to produce
desulfurized oil stream free of water and biocatalyst cell in a continuously fed, well
stirred reactor (Johnson, 1995).
Complex organosulfur compounds, such as dibenzothiophene (DBT) and alkyl DBT, go
through different pathway in order to be transformed into more reactive compounds. This
pathway is called a sulfur specific desulphurization pathway or simply 4S route. The
microorganisms involved in this process are rhodococcus, bacillus, corynobacterium and
anthrobacter. The reaction scheme of 4S route is shown in Figure 29 and involves four
continuous reaction steps: (i) DBT is oxidized to DBTO (DBT sulfoxides), (ii) DBTO is
transformed to DBT sulfones (DBTO2) and (iii) to sulfonate (HPBS), (iv) hydrolytic
cleavage to 2-hydroxybiphenyl (2-HBP) and following releases of sulfite or sulfate.
The strong side of BDS is that technology requires less energy and hydrogen. The process
is held under ambient temperature and pressure with high selectivity, resulting in
decreased energy costs, low emission, and no generation of undesirable side products
(Mohebali, 2008).
A conceptual process flow diagram of the BDS process is illustrated in Figure 27. Critical
aspects of the process include reactor design, product recovery and oil–water separations.
Important new concepts include the use of multiple-staged airlift reactors to overcome
poor reaction kinetics at low sulfur concentrations and reduce mixing costs, and the
concept of continuous growth and regeneration of the biocatalyst in the reaction system,
rather than in separate, external tanks (Monticello, 2000).

52
12.2.1 Process aspects
Several parameters are substantial in development of BDS process, and the biocatalyst
activity is the main one. Other parameters include oil/water ratio, composition of aqueous
phase used for biocatalyst suspension during sulfur removal, biocatalyst loading, oil water
separation, biocatalyst recycle, recycle of aqueous phase to reduce fresh water usage, and
secondary oil separation and purification operations.
Figure 27 Conceptual flow diagram for the BDS process (Monticello, 2000)
A common BDS technology is held in the following steps (Ramirez-Corredores &
Borole, 2007):
Vegetation of the biocatalyst in a fermentative process using appropriate
carbon and sulfur sources and other nutrients
Separation of the biomass from the culture medium
Use of the biomass as a catalyst for the desulphurization reaction, usually
carried out in a completely stirred reactor and in the presence of large quantities of
water (at least 1/3 water/oil (W/O) volumetric ratio)
Separation of the aqueous, oil, and biocatalyst (solid/biomass paste) phases
Recycling of the biomass paste, to the desulphurization reactor after
regeneration /addition of fresh biocatalyst

53
Secondary recovery of biocatalyst from the aqueous phase (via filtration,
etc.)
Removal of sulfate via precipitation by lime addition or using other salts
Removal of the residual water from the desulfurized oil phase (e.g., using
high-efficiency separators such as electrostatic separators)
Figure 28 Conceptual diagram of some of the steps in the desulphurization of oil
(Monticello, 2000)
12.2.2 Barriers for commercialization
Biodesulphurization capital costs are approximately 40-50$ million, which is about half
that for hydrodesulphurization. Also operating costs are 15% less. Even though, BDS has
certain barriers to use this technology in an industrial scale (Tuli & Kumar, 2008).

54
Figure 29 The "4S" pathway for the biological desulphurization of dibenzothiophene and
its derivatives (Monticello, 2000)

55
(i) Biocatalyst longevity improvement
First barrier for commercialization of BDS is the biocatalyst longevity. This problem is
related to the logistics of sanitary handling, shipment, storage and use of living bacterial
strains within the production site and refinery units. The original BDS technology had the
acceptable catalyst longevity around 1-2 days. Contemporary design includes production
and regeneration units within the BDS process, with the longevity in the range of 200-400
hours (McFarland, 1999). However, highly active and stable biocatalysts adapted to the
extreme conditions encountered in petroleum refining have not yet found.
(ii) Poor catalyst selectivity
Poor catalyst selectivity is another problem. Despite the significant progress in improving
the technology, organisms that would remove organic sulfur from crude are not selective
enough for sulfur compounds and they can remove or destroy the certain amount of
hydrocarbons in process. Over the last two decades several research groups have
attempted to isolate bacteria capable of efficient desulphurization of oil fractions
(Mohebali & Ball, 2008).
(iii) Reactor design
Lack of good reactor design is the next barrier. Several reactor design researches led to
advanced process conditions that reduced the influence of mass transport limitations,
making the higher volumetric reaction rates possible. Up to date BDS reactors utilize
staging, air sparging, and media optimization, hence this reduces the reactor size.
However, this also requires downstream processing modifications for emulsion breaking.
Moreover, the difficulty of separations increased with increased biocatalyst
concentrations due to particle stabilized emulsions (McFarland, 1999).
(iv) Phase contact and separation
Generally bacterial species are responsive to organic solvents. The progress in research of
stable and active microorganisms in the presence of non-aqueous solvents is desirable in
crude oil fractions upgrading by BDS. In the BDS bioreactor, a limiting factor is the
transport rate of the sulfur compounds from the oil phase to the bacterial cell membrane.

56
Efficiency of sulfur removal is likely to be related to oil droplet size. Therefore, access to
organic sulfur by resting cells requires the costly dispersal of the oil fraction in the
aqueous phase. The effects of surfactants on bacterial desulphurization of DBT have been
investigated in biphasic (oil–water) systems; biodesulphurization has been enhanced by
addition of surfactants. It has been suggested that these conditions favored more effective
contact between the biocatalyst and the hydrophobic substrate. One problem, which has
yet to be resolved, is whether the chemical surfactants would be toxic to the process
organisms or act against the characteristic adhesion mechanisms of the bacteria to oil
droplet surfaces (Mohebali & Ball, 2008).
(v) Integration to a refinery operations
Integrating a BDS into a refinery is the only way to treat petroleum fractions. Some of the
options to integrate BDS units to refinery are given in Figure 30. It is very challenging to
make considerable modification of current operations in a refinery. Moreover, BDS
processes have to operate at the same speed and reliability as other refinery processes. As
a consequence of that employing BDS as a component of refinery operations met with
opposition in the petroleum industry (Kilbane & Le Borgne, 2004).
12.3 Novel combined technologies
Convenient desulphurization technologies are not perfect, and considerable work has to
be done to improve process parameters and to reduce the energy consumption. Presently
available technologies for sulfur removal cannot satisfy the industry requirements and
cannot be complied with the market needs. New combined technologies could be one of
the solutions to the existing problems.
Nowadays, a lot of novel combined technologies for desulphurization of crude are being
reviewed, including the hydrogenation-bacterial catalysis method, the microwave-
catalytic hydrogenation method, the three step Biodesulphurization-Oxidative
desulphurization-Reactive adsorption (BDS-OD-RA) integrated process,
conversion/extraction desulphurization, and the ultrasonic-catalytic oxidation method
(Lin et al., 2010).

57
(i) Microwave-catalytic hydrogenation process for desulphurization
Microwave, catalysis and hydrogenation as an integrated process technology could
improve the desulphurization rate and this technology is more efficient as opposed to
traditional technology. In this integrated technology HDS catalyst can be regenerated with
the help of microwave energy. Moreover, microwave inducement could result in higher
sulfur removal effect of chemical desulphurization.
Figure 30 Options of biodesulphurization in the upgrading of petroleum middle
distillates (diesel) to ultra low sulfur levels (a) BDS unit after conventional HDS unit, (b)
BDS unit before conventional HDS unit (Stanislaus et al.,2010)
(ii) BDS-OD-RA three step integrated process
Next promising technology is the integrated BDS-OD-RA process. Generally, the process
consists of three step treatment. BDS is the first step where the majority of sulfur
compounds are removed, and feed is sent to the second-step treatment where it is
oxidized, and finally the remaining sulfur compounds are adsorbed. However, there is a
different process conditions for high-sulfur and low-sulfur crude oil in BDS step,
anaerobic and aerobic conditions are used respectively.

58
(iii) Conversion/extraction desulphurization
Conversion/extraction desulphurization (CED) technology was originally introduced by
Petro Star Inc. in 1996. It is a combined technology which includes conversion and
extraction to remove sulfur compounds from middle distillate products.
The feed is mixed with a stoichiometric amount of oxidant (peroxoacetic acid) at
temperatures below 100˚C and at atmospheric pressure. After the oxidation process, the
fuel is sent to liquid/liquid extraction unit. It has been reviewed that in laboratory-scale
experiments diesel fuel with 4200 ppm sulfur was treated to below 10 ppm sulfur (Babich
& Moulijn, 2003).
(iv) Ultrasonic-catalytic oxidation method
SonocrackingTM
technology was developed by SulphCo and applies ultrasound energy to
efficiently oxidize sulfur compounds in a water-fuel emulsion containing a hydrogen
peroxide catalyst (Babich & Moulijn, 2003). Several successful large-scale ultrasound
tests have been carried out in the EU countries and it has been reported to be
economically feasible (Lin et al., 2010).
Figure 31 Effect of ultrasound energy on oxidative desulphurization (SulphCo, 2009)

59
The technology operates at 70-80˚C under atmospheric pressure and the residence time
for the ultrasound reactor is reported to be only 1 minute (Babich & Moulijn, 2003).
SonocrackingTM
technology has many advantages, such as simple operation, low cost,
low operating conditions, reduced operating cost, and high efficiency.
Graphical illustration of ultrasonic-catalytic oxidation method is given in Figure 31. Feed
oil, water, oxidizing agent, and catalyst are mixed in a container and the ultrasonic wave
energy is used to convert sulfides into sulfates, sulfoxides, and sulfones, which are then,
can be easily removed by separation.

60
13. Natural gas
13.1 Associated and non-associated gas
Associated gas is a form of natural gas that is associated with the oil in the reservoir. It is
also known as associated petroleum gas (APG). The term APG is usually refers to the gas
dissolved in the oil; however, theoretically the gas cap is also can be included. When the
oil is extracted to the surface, associated gas comes out of solution and usually separated
before oil is transmitted via pipeline (PFC Energy, 2007).
Depending on the type of the reservoir, type of lift, how mature is the field, and other
factors, volume and chemical content of APG varies from one case to another. When
processed and separated from crude oil APG generally exists in combination with other
hydrocarbons, such as ethane, propane, butane and pentanes.
Furthermore, raw natural gas contains water vapor, hydrogen sulfide and carbon dioxide,
nitrogen and other compounds. Therefore, the natural gas before it is entered into gas
pipeline system must be treated. After processing, APG can be utilized in a number of
ways, for instance, on-site or regional electricity generation, reinjection for enhanced oil
recovery, compression for sale as dry gas, or feedstock for the petrochemical industry
(Røland, 2010).
As opposed to associated gas, non-associated gas is in fact never linked to another
product. Commonly, industrial projects for the production and refining of this type of
gases are absolutely circumscribed by the launch of regional or international markets. In a
worst-case scenario, if those export routes are lacking, or because of high transportation
expenses, the natural gas reservoirs can remain abandoned for a long time (Rojey et
al.,1997).
13.2 Sweet and sour natural gas
Depending on the amount of sulfur compounds present natural gases are classified as
sweet dry gas, sour dry gas, sweet wet gas, and sour wet gas. It is presented in Table 13.
Figure 32 shows the sour natural gas reserves around the world.
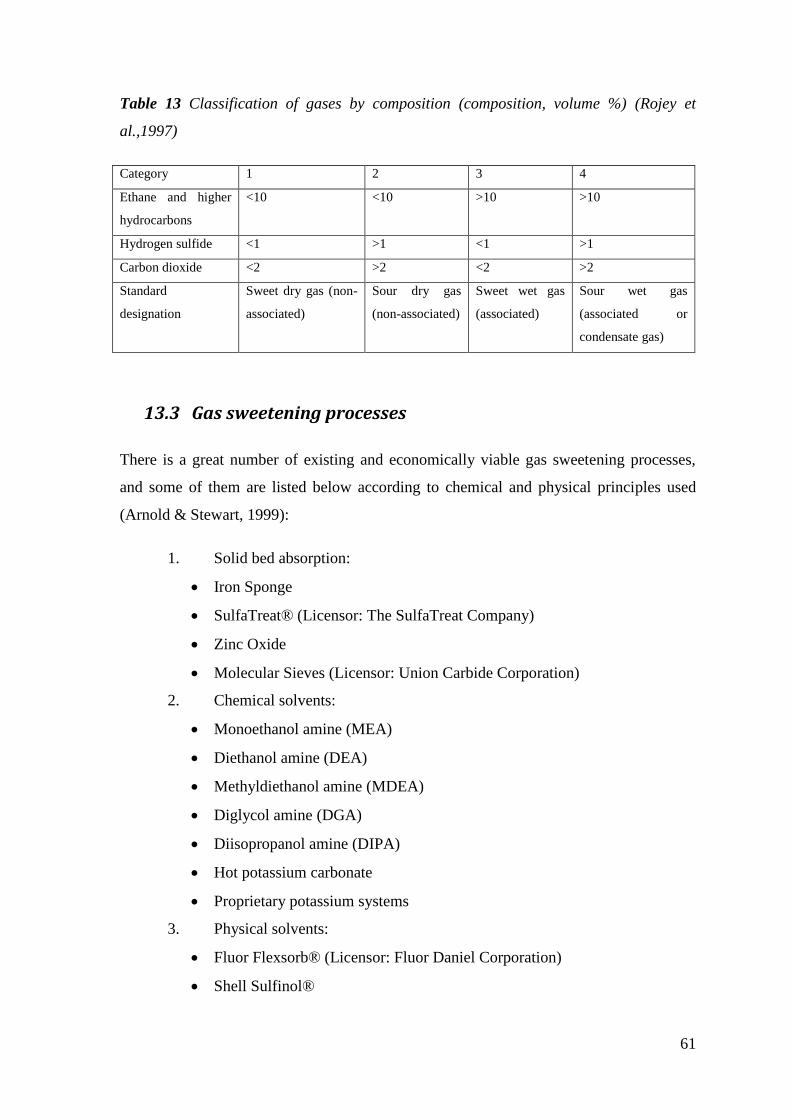
61
Table 13 Classification of gases by composition (composition, volume %) (Rojey et
al.,1997)
Category 1 2 3 4
Ethane and higher
hydrocarbons
<10 <10 >10 >10
Hydrogen sulfide <1 >1 <1 >1
Carbon dioxide <2 >2 <2 >2
Standard
designation
Sweet dry gas (non-
associated)
Sour dry gas
(non-associated)
Sweet wet gas
(associated)
Sour wet gas
(associated or
condensate gas)
13.3 Gas sweetening processes
There is a great number of existing and economically viable gas sweetening processes,
and some of them are listed below according to chemical and physical principles used
(Arnold & Stewart, 1999):
1. Solid bed absorption:
Iron Sponge
SulfaTreat® (Licensor: The SulfaTreat Company)
Zinc Oxide
Molecular Sieves (Licensor: Union Carbide Corporation)
2. Chemical solvents:
Monoethanol amine (MEA)
Diethanol amine (DEA)
Methyldiethanol amine (MDEA)
Diglycol amine (DGA)
Diisopropanol amine (DIPA)
Hot potassium carbonate
Proprietary potassium systems
3. Physical solvents:
Fluor Flexsorb® (Licensor: Fluor Daniel Corporation)
Shell Sulfinol®
62
Selexol® (Licensor: Norton Co., Chemical Process Products)
Rectisol® (Licensor: Lurg, Kohle & Mineraloltechnik GmbH & Linde
A.G.)
4. Direct conversion of H2S to sulfur
Claus
LOCAT® (Licensor: ARI Technologies)
Strertford® (Licensor: Ralph M. Parsons Co.)
IFP (Licensor: Institute Francais du Petrole)
Sulfa-check® (Licensor: Exxon Chemical Co.)
5. Hydrogen sulfide scavengers
6. Distillation
Amine-aldehyde condensates
7. Gas permeation
(i) Solid bed absorption
Solid bed absorption processes are based on the ability of solid particles to remove acid
gases through chemical reactions or ionic bonding. The general idea is that the gas stream
must flow through a fixed bed of solid particles that separates the acid gases and hold
them in the bed. When the solid bed reaches the end of its useful life, the vessel must be
removed and replaced (Branan, 2005). Commonly, there are three main processes
implemented under this type of sweetening: the iron oxide process, the zinc oxide
process, and the molecular sieve process (Arnold & Stewart, 1999).
(i) Chemical solvents
In chemical solvent processes, gas streams containing the acid gases are chemically
reacted with a lean solvent in an absorber. The reaction occurs due to the driving force of
the partial pressure from the gas to the liquid (Arnold & Stewart, 1999). The solvent
absorbs the acid gases and exits the column as a rich solution, which is then sent to a
regenerator column where the acid gases are stripped from the solvent (Koch-Glitsch,
2013).

63
Figure 32 Sour natural gas reserves around the world (Carrol & Foster, 2008)
Figure 33 Selexol® flowscheme for sulfur removal (UOP, 2009)

64
(i) Physical solvents
The general idea of physical solvents processes is to use organic solvents to absorb the
acid gases. There are no chemical reactions between the acid gas and the solvent, but H2S
and CO2 is highly soluble within the solvent. Solubility reactions are firstly influenced by
partial pressure, and secondarily on temperature. The physical solvent processes are
highly effective under higher acid gas partial pressure and lower temperatures (Arnold &
Stewart, 1999). There are a number of commercially available technologies within the
petroleum industry. The flowscheme of Selexol® process is shown in Figure 33.
Table 14 exhibits the main characteristics of chemical and physical solvents, including
advantages and disadvantages of these acid gas removal processes.
Table 14 Comparison of chemical and physical solvents
Chemical solvents
Advantages Disadvantages
Relatively insensitive to H2S and CO2
partial pressure
High energy requirements for regeneration of
solvent
Can reduce H2S and CO2 to ppm levels Generally not selective between
H2S and CO2
Amines are in a water solution, and thus the
treated gas leaves saturated with water
Physical solvents
Advantages Disadvantages
Low energy requirements for regeneration May be difficult to meet H2S specifications
Can be selective to H2S and CO2 Very sensitive to acid gas partial pressure
(ii) Direct conversion of H2S to sulfur
Direct conversion technology is based on chemical reactions to oxidize hydrogen sulfide
and to produce elemental sulfur. This technology uses the reactions of H2S and O2 or H2S
and SO2. All reactions involve special catalysts and/or solvents and yield water and
elemental sulfur. Several commercially available processes, such as Claus® process,
LOCAT® process, Stretford® process (Figure 34), and others have been successfully
used to remove H2S from the gas stream.

65
Figure 34 Modified Stertford® process flow diagram (Joule Processing, 2012)
It should be noted that direct conversion processes do not release harmful gases like H2S
and CO2 to the atmosphere, as in the case of previously discussed technologies. The acid
gases from chemical and solvent processes can be flared, which would cause of SO2
release. It is known that allowable level of SO2 is strictly regulated by environmental
authorities, and these limitations are revised periodically (Arnold & Stewart, 1999).
(iii) Hydrogen sulfide scavengers
Sulfide scavengers are based on chemical reactions of commercial additives with one or
more sulfide species by converting them into a more inert form. Sulfide scavengers
technology is commonly carried out in a continuous sour gas stream. Different
scavengers, such as amine-aldehyde condensates, are constantly injected into the system.
The most critical parameter is contact time between the scavenger and the sour gas
(Arnold & Stewart, 1999).
Effective hydrogen sulfide removal is achieved if there is an irreversible and complete
chemical reaction between the scavenger and one or more sulfide species. Upon reaction
equilibrium between the three species in solution is achieved, for that reason complete
removal of one species serves to remove all three. Insufficient chemical reaction between
a species and the scavenger cannot remove all soluble sulfides present (Amosa et al.,
2010).

66
13.4 Process selection factors
Gas sweetening processes were described in the previous chapter. Each of these processes
has favored position comparing with others for various cases; hence the following process
selection factors should be considered (Kidney & Parrish, 2006):
The type of acid contaminants present in sour gas stream;
The concentration of impurities and amount of heavy hydrocarbons and aromatics
in the sour gas. For example, COS, CS2, and mercaptans can affect the design of
both gas and liquid treating facilities. Physical solvents tend to dissolve heavier
hydrocarbons, and the presence of these heavier compounds in significant
quantities tends to favor the selection of a chemical solvent;
The volume of gas to be treated the temperature and pressure at which the sour
gas is available. High partial pressures (3.4 bar or higher) of the acid gases in the
feed favor physical solvents, whereas low partial pressures favor the amines;
The final specifications of the outlet gas;
The desirability or selectivity required for removing one or more of the
contaminants without removing the others;
The capital, operating, and royalty costs for the process;
The environmental constraints, including air pollution regulations and disposal of
byproducts considered hazardous chemicals.
Moreover, there are different process selection charts (Figures 35-37) which could help to
choose the appropriate sweetening processes. In order to do so partial pressure of acid gas
in product and in feed has to be known.
14. Refinery of the future
Refinery industry has been developing significantly over the last century. This
development is forced by increasing demand for automotive fuels, as well as for gas oils
and fuels for domestic central heating, for fuel oil power generation, and for inputs to the
petrochemical industries. The following factors have accelerated the development of new
processes (Speight, 2011):

67
Figure 35 Process selection chart for H2S removal with no CO2 present (Kidney &
Parrish, 2006)
Figure 36 Process selection chart for simultaneous H2S and CO2 removal (Kidney &
Parrish, 2006)

68
Figure 37 Process selection chart for selective H2S removal with CO2 present (Kidney &
Parrish, 2006)
Table 15 Natural gas reservoirs with a high H2S content (Rojey et al., 1997)
Reservoir Lithology Depth (m) H2S content
(wt %)
Lacq (FRA) Dolomite and limestone 3100 to 4500 15
Pont d’As-Meillon (FRA) Dolomite 4300 to 5000 6
Weser-Ems (GER) Dolomite 3500 10
Asman-Bandar Shipur (IRN) Limestone 3600 to 4800 26
Urals-Volga (CIS) Limestone 1500 to 2000 6
Irkutsk (CIS) Dolomite 2540 42
Alberta (CAN) Limestone 3506 13
Alberta (CAN) Limestone 3800 87
South Texas (USA) Limestone 3354 8
South Texas (USA) Limestone 5793 to 6098 98
East Texas (USA) Limestone 3683 to 3757 14
Mississippi (USA) Limestone 5793 to 6098 78
Wyoming (USA) Limestone 3049 42

69
The high demand for products such as gasoline, diesel, fuel oil, and jet fuel
Uncertain feedstock supply, caused especially by the changing quality of
crude oil, by geopolitical relationships among different nations, and by the
emergence of alternate feed supplies such as bitumen from tar sand, natural gas,
and coal
Recent environmental regulations that include more stringent regulations
in relation to sulfur in automotive fuels
Sustainable technological development such as new catalyst and processes
Nowadays, the average quality of crude oil has deteriorated.
To date, according to the statistical information there is a general trend towards reduction
of sulfur content of fuels, and this fact will convince that the role of desulphurization
increases in importance in the processing operations.
The main developments in desulphurization will follow major paths, such as:
Advanced hydrotreating (new catalyst, catalytic distillation, processing at
mild conditions)
Reactive adsorption (type of adsorbent implemented, process design)
Oxidative desulphurization
Biocatalytic desulphurization
Combined technologies
Several decades later, the need for hydrogen will be reduced, as new desulphurization
technologies and evolution of the older ones are expected to be developed.
In the year 2030 the standard American refinery will be placed at an existing refinery site.
That will be mainly due to economic and environmental considerations, as it will be
difficult to construct the new refineries at another site. Numerous existing refineries may
still be in use, but a lot of processing technologies will be more efficient and more high-
tech. Moreover, the main concern for refiners will be the energy efficiency of processing
units in order to reduce the cost operating expenses (Speight, 2011).

70
14.1 Global refinery capacity requirements in the future
Table 16 and Figures 38-40, which are taken from OPEC’s annual World Oil Outlook,
exhibit information on global crude distillation capacity and desulphurization capacity
additions. Improvements in product quality specifications which are previously discussed
will influence in considerable desulphurization capacity additions in order to reduce the
sulfur level in refined products. It is known that OECD countries are already legislated
ultra low sulfur regulations for automotive fuels, further development will be expected in
non-OECD countries, because they are also reducing the average sulfur content to low
and ultra low levels. It is forecasted that 22 mb/d of additional desulphurization capacity
will be required globally by 2035. This number is the largest volume of capacity additions
in the period to 2035 (OPEC, 2012).
Table 16 Global capacity requirements by process (millions of barrels/day) 2011-2035
(OPEC, 2012)
The most part of desulphurization capacity additions is planned in Asia (10.4 mb/d), the
Middle East (3.4 mb/d), Latin America (3.3 mb/d), and the FSU (2.9 mb/d). This is
mainly due to expansion of refining base and demand for petroleum products, also
tightened nationwide and exported average quality specifications. Figure 40 the data
regarding desulphurization capacity additions to the main distillate groups of petroleum
products. It can be seen that in the forecasting period from 2011 to 2035, more than 60%

71
of global desulphurization capacity additions (14 mb/d) are for the desulphurization of
middle distillates, whereas 27% for gasoline (6 mb/d), and the rest for vacuum
gasoil/residual fuel (2 mb/d).
Figure 38 Global capacity requirements by process type, 2011-2035 (OPEC, 2012)
Figure 39 Crude distillation capacity additions, 2011-2035 (OPEC, 2012)

72
Figure 40 Desulphurization capacity requirements by product and region, 2011-2035
(OPEC, 2012)

73
15. Effect of organosulfur compounds on natural gas
properties
Natural gases always have water associated with them, as they are saturated with water in
the reservoir. When the hydrocarbons are extracted from underground water is also
produced straight from the reservoir. Generally, the water contents of sour gases are
defined as a molar average of the solubility of water in the hydrocarbons, hydrogen
sulfide, and carbon dioxide (Robinson et al.,1977). The accurate prediction of equilibrium
water contents of natural gases is extremely important, especially for sour gases.
Distinct knowledge of phase behavior in water – sour gas systems is essential when it
comes to design and operation of production and refining facilities, as well as natural gas
pipelines, as considerable amount of gases contain acid gases and water. By preventing
the formation of condensed water the risk of related problems can be reduced
(Mohammadi et al., 2005).
The first problem related with water content of sour gases is corrosion. The lifetime of
natural gas pipelines is affected by the rate at which corrosion occurs. The second
problem is the formation of hydrates due to the presence of water in natural gas. Hydrates
formation leads to safety hazards to production/transportation/injection systems and to
considerable economic risks. The last, but not the least problem is two-phase flow in
pipelines (Bahadori, 2011).
The risk of the occurrence of the problems mentioned above can be increased if the gas
contains even small amount of hydrogen sulfide or carbon dioxide. That is mainly
because the solubility of water in H2S and in CO2 differs significantly from the solubility
of water in hydrocarbon systems as shown on Figure 41 (Carroll, 2002). This fact can
possibly be explained by the discrepancy of molecular structures of these compounds. For
instance, hydrogen sulfide has higher polarity than hydrocarbon components found in
natural gas because of the asymmetric arrangement of its atoms. Water is strongly polar
material itself, as a hence, water will have higher solubility in materials with higher
polarity (Lukacs & Robinson, 1963).
The mutual solubility of hydrogen sulfide and carbon dioxide differs substantially with
system temperature and pressure. Thus, the presence of sour gas, such as H2S, and the

74
presence of acid gas, such as CO2, in a natural gas mixture would result in a raise in the
water content at any given temperature and pressure (Mohammadi, Samieyan, & Tohidi,
2005).
15.1 Pure components behavior
From the previous chapters it is known that the natural gas is a complex mixture. Each
component of the natural gas represents unique characteristics which essentially
influences on gas behavior. The graphical presentation of this theory is shown in Figure
41, which demonstrates how the water content of pure components of methane, carbon
dioxide, and hydrogen sulfide changes with increasing pressure at 120ºF. It is
undoubtedly that all three substances show the diversity of behavior that occurs.
It can be seen that at low pressures the water content does not differ considerably for all
three components. Generally, at this low pressure the water content is a function of
temperature and pressure. However, with increasing pressure the phase behavior for the
three components starts to be different.
The water content of methane, which can be considered as sweet gas, steadily decreases
as the pressure increases. When it comes to carbon dioxide, the water content declines
until the pressure reaches 1000 psia, after that there is an opposite tendency and the water
content increases again. Lastly, hydrogen sulfide liquefies. Because of this unique
behavior the water content exhibits discontinuity. It should be noted that at lower
temperatures CO2 behaves similarly and liquefies too.
It is reasonable to assume that the characteristics of three pure components would be
matched with the behavior of gas mixtures (Carroll, 2002). Sour gases which contain a
little volume of CO2 and H2S will have the phase behavior in a similar manner to pure
methane. The water content of these gas mixtures will be continually declining as a
function of pressure. Acid gas mixtures will behave like pure CO2, but they will not form
a second liquid. Sour mixtures with high content of H2S will behave almost like pure H2S.
These gases under certain value of pressure and temperature will be in a liquid phase
(Carroll, 2002).

75
Figure 41 Water content of three gases at 120ºF (50°C) (Carroll, 2002)
15.2 Estimation of water content in sour gases
It is believed that sour/acid gases deteriorate the quality of natural gas by affecting the
water content of those natural gases. In this subsection the water content of several gases
with simplified content and existing gas fields is calculated using the AQUALIBRIUM
software, version 3.01. There is a description of this software on the official website of
FlowPhase®. There it says that AQUALIBRIUM is a software package for systems
containing water, hydrogen sulfide, carbon dioxide, and light hydrocarbons. It has a well-
deserved reputation for being amongst the most accurate software for equilibrium
calculations in these systems, especially for acid gas + water systems.
First, the water content of natural gases with simplified composition was calculated. Only
methane and hydrogen sulfide were taken into consideration to study the general behavior
of those gases under three different conditions, reservoir, wellhead, and end-pipe
conditions. The values of those parameters are generally accepted in natural gas
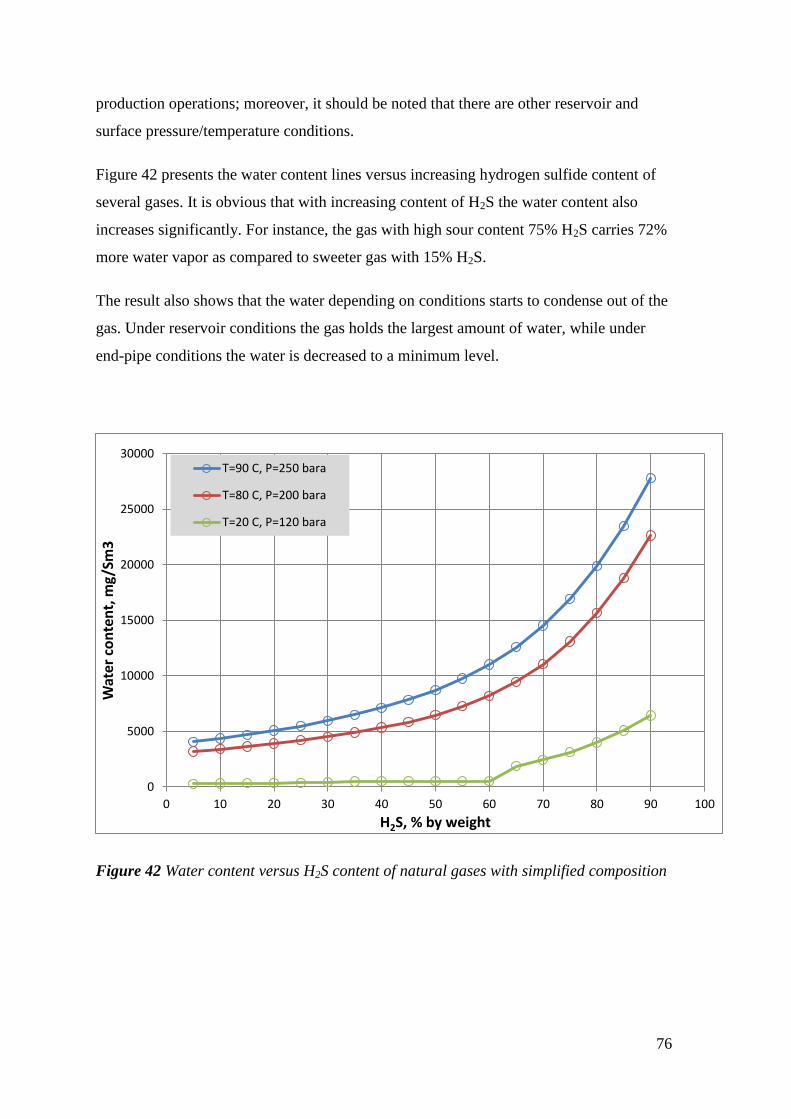
76
production operations; moreover, it should be noted that there are other reservoir and
surface pressure/temperature conditions.
Figure 42 presents the water content lines versus increasing hydrogen sulfide content of
several gases. It is obvious that with increasing content of H2S the water content also
increases significantly. For instance, the gas with high sour content 75% H2S carries 72%
more water vapor as compared to sweeter gas with 15% H2S.
The result also shows that the water depending on conditions starts to condense out of the
gas. Under reservoir conditions the gas holds the largest amount of water, while under
end-pipe conditions the water is decreased to a minimum level.
Figure 42 Water content versus H2S content of natural gases with simplified composition
0
5000
10000
15000
20000
25000
30000
0 10 20 30 40 50 60 70 80 90 100
Wat
er c
on
ten
t, m
g/Sm
3
H2S, % by weight
T=90 C, P=250 bara
T=80 C, P=200 bara
T=20 C, P=120 bara

77
Table 17 Water content of selected natural gases calculated with AQUALIBRIUM
Conditions Pressure,
bara
Temperature,
ºC
Water content, mg/Sm3
Lacq Kirkuk Parentis Kashagan
Reservoir 250 90 5196 4099 3612 5104
Wellhead 200 80 4004 3224 2867 3954
End pipe 120 20 359 282 240 372
Table 18 Composition of selected natural gases
Component Lacq
(France)
Kirkuk
(Iraq)
Parentis
(France)
Kashagan
(Kazakhstan)
Methane 69.0 56.9 73.6 58.77
Ethane 3.0 21.2 10.2 9.01
Propane 0.9 6.0 7.6 4.54
Butanes 0.5 3.7 5.0 2.29
C5+ 0.1 1.6 3.6 1.49
Nitrogen 1.5 - - 1.01
H2S 15.3 3.5 - 17.81
CO2 9.3 7.1 - 5.08
Table 17 gives the results on water content calculation for the gases from different parts
of the world. The composition of the natural gases under studies is given in Table 18. It
can be seen that sour gases from Lacq and Kashagan field exhibits undesirable behavior.
The high sourness of these gases explains the higher values of water content in comparing
with other sweeter gases from Kirkuk and Parentis fields. When it comes to pressure and
temperature conditions, there is a common tendency for all four gases. The water vapor
starts to condense out of the gas solution, and the water vapor values condensed at the
wellhead equal to 1192 mg/Sm3 and 1150 mg/Sm
3 for Lacq and Kashagan fields
respectively, and at the end-pipe the values are 3645 mg/Sm3 and 3582 mg/Sm
3 which is
more or less the same.

78
It is of vital importance to know the amount of difference between the water content at
reservoir conditions and the water condensed at the receiving terminal, as by knowing it
the dehydration facilities can be designed and the formation of hydrates can be removed.
Table 19 Water content of gases with simplified composition calculated by
AQUALIBRIUM
H2S,
weight %
CH1,
weight %
Water content,
mg/Sm3
Water content,
mg/Sm3
Water content,
mg/Sm3
90 10 27796 22638 6421
85 15 23446 18802 5073
80 20 19860 15652 3990
75 25 16923 13096 3123
70 30 14533 11057 2431
65 35 12597 9456 1881
60 40 11030 8211 505
55 45 9757 7239 505
50 50 8712 6468 505
45 55 7844 5844 505
40 60 7113 5328 505
35 65 6489 4892 471
30 70 5950 4517 417
25 75 5478 4190 375
20 80 5061 3900 342
15 85 4690 3640 315
10 90 4355 3406 291
5 95 4052 3193 271

79
Summary
New petroleum product specifications have had profound impact on refineries’ business
philosophy worldwide. Petroleum companies are investing vast amount of money to
introduce breakthrough technologies and to upgrade existing ones.
After in-depth analysis of existing commercial and semi-commercial desulphurization
technologies it can be concluded that those technologies cannot satisfy the industry
requirements and cannot be complied with the market needs. Conventional
hydrodesulphurization is very expensive (desulphurization of 20,000 barrel of oil is as
much as $40 million) and energy intensive sulfur removal technique. HDS operates at
elevated temperatures (290 to 445˚C) and pressures (35 to 170 atm.), uses very costly
hydrogen, removes only easy sulfur (hydrogen sulfide, thiols, etc.), and reduces the
quality of refined products. As a hence, decreased energy is returned on energy invested
and the impact on the environment is increased. Time and money being spent on research
and development for the hydrodesulphurization could be better invested into developing
alternative technologies.
It is known that organosulfur removal operations are implemented at surface conditions.
But is it the only way to desulfurize hydrocarbon feeds? One of the revolutionary ideas is
to develop in-situ or downhole sulfur capture technologies (DoSCap technology
{Darkhan Duissenov}). Crude oil and natural gas with high sulfur content could be
upgraded in the source rock and desulfurized before hydrocarbons are transported to
surface. By implementing the DoSCap technology additional CAPEX and OPEX would
be reduced considerably. The costs of lost time, the replacement of materials of
construction, and the constant personnel involvement caused by corrosion, would be
avoided. Finally, the commercial value of crude oil would be increased by about 10-15%.
However, the scientists involved in research of the problem under consideration are
focused on more immediate challenges and working with currently available techniques
and tools. One of the alternatives could be the integration of biodesulphurization process
units into existing refineries. There are two options, first option is to put BDS before
conventional HDS, and second option is to implement BDS after conventional HDS. In
order to do so significant modification of current operations is needed. Biocatalytic
desulphurization involves certain type of bacterial strain in order to selectively remove

80
sulfur compounds with high-boiling temperature (thiophenes, dibenzothiophenes, and
their alkyl derivatives).
Another alternative is the implementation of combined technologies. In combined
technologies the processes could be based on existing sulfur removal techniques, such as
oxidative desulphurization, biocatalytic desulphurization, and hydrogenation processes.
Furthermore, base technologies could be complemented by various physical forces and
chemical reactions. Microwave energy, catalysis and hydrotreatment together can
improve the effect of desulphurization and some results were already gained. Also the
combination of ultrasonic/microwave and electrostatic fields with oxidative
desulphurization will lead to improved process parameters and higher desulphurization
rates (Lin et al., 2010).
What is clear for now is that the alternative technologies mentioned above certainly have
barriers for commercialization, and most of them have been met with certain opposition
within the petroleum industry. The situation threatens to become more challenging with
increasing sulfur content trend. While novel technologies are being developed to remove
the organosulfur compounds, there is little doubt that utilization of the sour resources will
have a negative impact.

81
Conclusion
The authorities and environmental agencies are trending down the level of sulfur
in petroleum products worldwide. The main purpose of those regulations is to
yield high quality fuels with sulfur content less than 10 ppm. It is expected that by
2025 the maximum allowable level of sulfur for gasoline(10 ppm in US & EU, 20
ppm in FSU, 25 ppm in the Middle East) and for diesel (10 ppm in US & EU, 15
ppm in FSU, 40 ppm in Latin America) will be reduced tremendously.
Conventional HDS is a very, very expensive process which uses elevated
pressures and elevated temperatures; moreover HDS is not highly efficient and
consumes outrageous amount of energy, resulting in decreased energy returned on
energy invested and the increased impact on the environment;
Biocatalytic biodesulphurization is an effective tool in removal of heavy sulfur
compounds as dibenzothiophenes and their alkyl derivatives. Biocatalyst converts
dibenzothiophene into 2-hydroxybiphenyl and sulfate via 4S pathway without any
change of fuel heating value.
New integrated technologies such as BDS-OD-RA (desulphurization rate 85-95%
for crude oil in anaerobic conditions, 94-95% in aerobic conditions), combined
hydrogenation-biodesulphurization technologies (bacterial strains Rhodococcus
erythropolis, Arthrobacter paraffineus, Bacillus sphaericus, Rhodococcus
rhodochrous), desulphurization processes involving ultrasonic-catalytic oxidation
(simple operation, low cost, low temperature, high efficiency) could be an
excellent alternatives to conventional desulphurization technologies.
Distinct knowledge of phase behavior in water – sour gas systems is essential
when it comes to design and operation of production and refining facilities, as
well as natural gas pipelines, as considerable amount of gases contain sour gases
and water. By preventing the formation of condensed water the risk of related
problems can be reduced.

82
Bibliography
Amosa, M. K., Mohammed, I. A., & Yaro, S. A. (2010). Sulphide scavengers in oil and
gas industry - a review. Zaria: NAFTA.
AniRaptor2001. (2013, April 22). Petroleum product. Retrieved April 23, 2013, from
Wikipedia: http://en.wikipedia.org/wiki/Petroleum_product#cite_note-2
API. (1973). Conditions Causing Deterioration or Failure. American Petroleum Institute.
Arnold, K., & Stewart, M. (1999). Surface production operations. Design of gas-handling
systems and facilities. . Houston: Gulf Publishing Company.
B. Eccleston, M. M. (1992). Elemental sulfur in crude oil. Bartlessville: Bureau of Mines.
Babich, I. V., & Moulijn, J. A. (2003). Science and technology of novel processes for
deep desulfurization of oil refinery streams: a review. Delft: Elsevier.
Bahadori, A. (2011). Prediction of moisture content of natural gases using simple
Arrhenius-type function. Perth: Versita.
Beuthner, H., & Schmid, B. H. (1993). Reaction Mechanisms and Rates in Residue
Hydrodesulfurization. 6th World Petroleum Congress (pp. 297-310). Frankfurt am
Main: World Petroleum Congress.
BP. (2011). BP Energy Outlook. London: BP.
BP. (2012). Natural gas reserves. Retrieved 2013, from British Petroleum:
http://www.bp.com/sectiongenericarticle800.do?categoryId=9037178&contentId=
7068624
BP. (2012). Oil reserves. Retrieved 2013, from Britis Petroelum:
http://www.bp.com/sectiongenericarticle800.do?categoryId=9037157&contentId=
7068604
BP. (2013). World energy outlook. London: BP.
Branan, C. (2005). Rules of thumb for chemical engineers. Burlington: Elsevier Inc.
Carrol, J., & Foster, J. (2008). New Challenges & Solutions in Designing Large Sour Gas
Projects. Calgary: Foster Wheeler.
Carroll, J. J. (2002). The water content of acid gas and sour gas from 100 to 220 F and
pressures to 10000 psia. Part 2 - Mixtures. Dallas: GPA.
Dunsmore, B., Evans, P., Jones, M., Burton, S., & Lappin-Scott, H. (2006). When is
reservoir souring a problem for deepwater projects? Offshore Technology
Conference (pp. 1-2). Houston: Offshore Technology Conference.
EconomyWatch. (2010, June 10). Crude Oil Benchmarks, Oil Markers. Retrieved 2013,
from EconomyWatch: http://www.economywatch.com/world-industries/oil/crude-
oil/benchmarks.html

83
EIA. (2011, February 14). The geology of natural gas resources. Retrieved 2013, from
U.S Energy Information Administration:
http://www.eia.gov/todayinenergy/detail.cfm?id=110
EIA. (2012, July 12). Crude oils have different quality characteristics. Retrieved
November 4, 2012, from The U.S. Energy Information Administration:
http://www.eia.gov/todayinenergy/detail.cfm?id=7110
EIA. (2013). Annual Energy Outlook 2013. Washington: U.S. Energy Information
Administration .
EIA. (2013). Petroleum & Other Liquids. Retrieved 2013, from US Energy Information
Administration:
http://www.eia.gov/dnav/pet/hist/LeafHandler.ashx?n=pet&s=mcrs1us2&f=m
Emerson. (2012). Sulfide stress cracking. Retrieved from Emerson Process:
http://www.documentation.emersonprocess.com/groups/public/documents/referen
ce/d351798x012_09.pdf
Eni. (2011). World Oil and Gas Review. Retrieved November 2, 2012, from Eni:
http://www.eni.com/world-oil-gas-review/pages/pdf.shtml
Eni. (2012). World oil and gas review. Retrieved 2013, from Eni:
http://www.eni.com/en_IT/company/culture-energy/world-oil-gas-review/world-
oil-gas-review-2012.shtml
Enos, B. (2003, October 27). New charts provide accurate estimations for water content
of sour natural gas. Retrieved 2013, from Oil and Gas Journal:
http://www.ogj.com/articles/print/volume-101/issue-41/processing/new-charts-
provide-accurate-estimations-for-water-content-of-sour-natural-gas.html
Ewing, S. P. (1955). Electrochemical studies of the hydrogen sulfide corrosion
mechanism. Corrosion, 497-501.
Fahim, M. A., Alsahhaf, T. A., & Elkilani, A. (2010). Fundamentals of petroleum
refining. Safat: Elsevier B.V.
Favennec, J. P. (2001). Refinery operation and management. Paris: Editions Technip.
FSU. (2010). Description of the MC 252 Crude Oil. Retrieved November 4, 2012, from
Oil Spill Academic Task Force: http://oilspill.fsu.edu/images/pdfs/mc-252crude-
oil-desc.pdf
Gatan, R., Barger, P., & Gembicki, V. (2004). Oxidative desulfurization: a new
technology for ULSD. Illinois: Eni.
Gerus, B. R. (1974). Detection and mitigation of weight loss corrosion in sour gas
gathering systems. Tyler: SPE.
Hamby, T. W. (1981). Development of High-Pressure Sour Gas Technology. Journal of
Petroleum Technology, 792-798.

84
Hays, G. F. (2013). Now is the time. New York: World Corrosion Organization.
Hensen, E. M. (2000). Hydrodesulfurization catalysis and mechanism of supported
transition metal sulfides. Eindhoven: Universiteitsdrukkerij.
Houlton, G. (2011). Global crude oil supply and quality trends. San Antonio:
Purvin&Gertz Inc.
Hudjins, C. (1969). A review of sulfide corrosion problems in the petroleum industry.
Materials protection, pp. 41-47.
I. Wiryolukito, M. A. (2008). Corrosion short course. Mottmac: Petroenergy Magazine.
ICCT. (2013). China announces breakthrough timeline for implementation of ultra-low
sulfur fuel standards. Beijing: International Council on Clean Transportation.
ICE. (2009). Trading and Clearing the Argus Sour Crude Index (ASCI) with ICE.
Retrieved November 3, 2012, from Intercontinental Exchange:
https://www.theice.com/publicdocs/ICE_ASCI_Product_Guide.pdf
ICT. (2013). How does ICT work? Retrieved March, from Zerust technology:
http://www.shopzerust.com/technology/ict
Johnson, S. (1995). Achievements of biocatalytic desulfurization. Dallas: SPE.
Johnson, S. W. (1995). Achievements of Biocatalytic Desulfurization. Dallas: SPE.
Joule Processing. (2012). Sulfur Recovery Units. Retrieved 2013, from Joule Processing:
http://www.jouleprocessing.com/products/sulfur-recovery/sru
Kidney, A., & Parrish, W. R. (2006). Fundamentals of natural gas processing. Boca
Raton: Taylor and Francis group.
Kilbane, J. J., & Le Borgne, S. (2004). Petroleum biorefining: the selective removal of
sulfur, nitrogen and metals. Des PLaines: Elsevier B.V.
Koch-Glitsch. (2013). Acid gas removal and gas sweetening. Retrieved 2013, from Koch-
Glitsch: http://www.koch-glitsch.com/masstransfer/pages/acid-gas-removal-
sweetening.aspx
K-Oil. (2012). Classification of crude oil. Retrieved November 3, 2012, from K-Oil:
http://www.mnpu.ru/?menu=docs&sub=svojstva
Kraus, R. S. (2011). Petroleum Refining Process. Retrieved February 3, 2013, from
Encyclopedia of Occupational Health and Safety: http://www.ilo.org/oshenc/part-
xii/oil-and-natural-gas/item/384-petroleum-refining-process
Lallemand, F., Perdu, G., Maretto, C., Weiss, C., Magne-Drisch, J., & Lucquin, A.-C.
(2012, April). Solutions for the treatment of highly sour gases. Retrieved 2013,
from Digital Refining:
http://www.digitalrefining.com/article/1000356,Solutions_for_the_treatment_of_h
ighly____sour_gases.html#.Ua3v-2fiJnU

85
Lepoutre, M. (2008). Technical challenges for tight and sour gas. Spain: Energy Institute.
Lin, L., Hong, L., Jianhua, Q., & Jinjuan, X. (2010). Progress in the technology for
desulfurization of crude oil. Jinzhou: China Petroleum Processing and
Petrochemical Technology.
Lukacs, J., & Robinson, D. B. (1963). Water content of sour hydrocarbon systems.
Alberta: SPE.
MathProInc. (2011). An introduction to petroleum refining and the production of ultra
low sulfur gasoline and diesel fuel. Bethesda: The International Council on Clean
Transportation .
Maugeri, L. (2006). The Age of Oil. Westport: Prager Publishers.
Mayer, K. (2013, March 4). What are Thiols? Retrieved April 16, 2013, from Wisegeek:
http://www.wisegeek.com/what-are-thiols.htm
McDonald, N. (2009, November 20). EPA Launches New Interactive Tool To Measure
SO2. Retrieved 2013, from Center for Environment, Commerce & Energy:
http://cenvironment.blogspot.no/2009_11_01_archive.html
McFarland, B. (1999). Biodesulfurizaton. Davis: Elsevier Science.
Mohammadi, A. H., Samieyan, V., & Tohidi, B. (2005). Estimation of water content in
sour gases. Madrid: SPE.
Mohebali, G. (2008). Biodesulfurization of petrodiesel fuels. Tehran: PubMed.
Mohebali, G., & Ball, A. S. (2008, August). Biocatalytic desulfurization (BDS) of
petrodiesel fuels. Retrieved 2013, from International Journal of Systematic and
Evolutionary Microbiology: http://mic.sgmjournals.org/content/154/8/2169.full
Monticello, D. J. (2000). Biodesulfurization and the upgrading of petroleum distillates.
The Woodlands: Elesvier Science.
Muyzer, G., & Stams, A. (2008, June). The ecology and biotechnology of sulfate-
reducing bacteria. Retrieved March 2013, from Readcube:
http://www.readcube.com/articles/10.1038/nrmicro1892
NASA. (2005). Historical Anthropogenic Sulfur Dioxide Emissions. Retrieved 2013,
from NASA Socioeconomic Data and Applications Center:
http://sedac.ciesin.columbia.edu/data/collection/haso2/maps/gallery/search/2
Nenry, S., & Scott, W. (1994). Corrosion in petrochemical industry. USA: ASM
International.
Neste Oil. (2012). Types of crude oil. Retrieved October 13, 2012, from Neste Oil:
http://www.nesteoil.com/default.asp?path=1,41,537,5196,5199

86
NPI. (2013). Hydrogen sulfide: Overview. Retrieved April 16, 2013, from National
Pollutant Inventory: http://www.npi.gov.au/substances/hydrogen-
sulfide/index.html
Offshore Technology. (2012). Corrosion Protection Products for Oil and Gas Pipelines.
Retrieved 2013, from Offshore technology: http://www.offshore-
technology.com/contractors/corrosion/3m/3m3.html
O'Meara, D. (2006, March 13). Pipelines in Canada: Sophisticated arteries. Retrieved
March 2013, from Financial Post:
http://business.financialpost.com/2013/03/02/pipelines-in-canada-sophisticated-
arteries/?__lsa=ef8e-1837
OPEC. (2011). World Oil Outlook. Vienna: Organization of Oil Exporting Countries.
OPEC. (2012). World Oil Outlook. Vienna: Oraganization of Petroleum Exporting
Countries.
OSHA. (1999, January 1). Petroleum refining processes. Retrieved 2013, from
Occupational safety and health administration:
http://www.osha.gov/dts/osta/otm/otm_iv/otm_iv_2.html#3
PFC Energy. (2007). Using Russia’s Associated Gas. Washington: PFC.
Piehl, R. L. (1968). How to cope with corrosion in hydrocracker effluent coolers. Oil and
Gas Journal, 60-63.
Pratap, J. (2013, March 4). Global demand for natural gas will rise nearly 50% by 2035.
Retrieved 2013, from Gulf Times: http://www.gulf-
times.com/business/191/details/344245/global-demand-for-natural-gas-
%E2%80%98will-rise-nearly-50%25-by-2035%E2%80%99
Rachovich, D. (2012, December 12). World's Top 23 Proven Oil Reserves Holders.
Retrieved 2013, from Petroleum Insights:
http://petroleuminsights.blogspot.no/2012/12/worlds-top-23-proven-oil-
reserves.html#.UayR6GfiJnU
Ramirez-Corredores, M. M., & Borole, A. P. (2007). Biocatalysis in oil refining.
Amsterdam: Elsevier.
Robinson, J., Moore, R., Heideman, R., & Wichert, E. (1977). Estimation of the water
content of sour natural gases. Calgary: SPE.
Robinson, P. R. (2013). Petroleum processing overview. Kate: Louisiana State
University.
Rojey, A., Jaffret, C., Cornot-Gandolphe, S., Durand, B., Jullian, S., & Valais, M. (1997).
Natural gas. Production. Processing. Transport. Paris: Editions Technip.
Røland, T. H. (2010). Associated Petroleum Gas in Russia: Reasons for non-utilization.
Lysaker: Fridtjof Nansen Institute.

87
Ryabov, V. D. (2009). Oil and gas chemistry. Moscow: Forum.
Schlumberger. (2012). API gravity. Retrieved November 4, 2012, from Schlumberger Oil
Field Glossary:
http://www.glossary.oilfield.slb.com/Display.cfm?Term=API%20gravity
SET Labs. (2008). Catalytic Hydrotreating. Retrieved March 4, 2013, from SET Labs:
http://www.setlaboratories.com/cat2/tabid/104/Default.aspx#Hydrodesulfurization
%20Process
Speight, J. (2007). The Chemistry and Technology of Petroleum. Boca Raton: Taylor &
Francis Group.
Speight, J. (2011). The Refinery of the Future. Oxford: Elsevier Inc.
Stanislaus, A., Marafi, A., & Rana, M. S. (2010). Recent advances in the science and
technology of ultra low sulfur diesel (ULSD) production. Safat: Elsevier.
SulphCo. (2009). Oxidative desulfurization. Houston: SulphCo.
TehnoInfa. (2009). Hydrogen partial pressure. Retrieved April 12, 2013, from
TehnoInfa: http://www.tehnoinfa.ru/pererabotkaneftiigaza/38.html
Tuli, D., & Kumar, A. (2008). Non-conventional technologies for fuel desulfurization.
Madrid: World Petroleum Council.
UOP. (2009). UOP Selexol technology for acid gas removal. Retrieved 2013, from UOP
Honeywell Company: http://www.uop.com/wp-content/uploads/2011/02/UOP-
Selexol-Technology-for-Acid-Gas-Removal-tech-presentation.pdf
UP Trading. (2012). Top benchmarks of oil. Retrieved November 4, 2012, from UP
Trading:
http://www.uptrading.ru/main/internet_trejding_na_finansovyh_rynkah/informaci
onnyj_blok_trejderainvestora/rynok_syrya_neft_i_gaz/veduwie_marki_nefti/
Wauquier, J.-P. (1995). Crude oil. Petroleum products. Process flowsheets. Paris:
Editions Technip.
Wikipedia. (2012, November 11 ). API gravity. Retrieved November 14, 2012, from
Wikipedia The Free Encyclopedia: http://en.wikipedia.org/wiki/API_gravity
Wikipedia. (2012, November 7). Benchmark. Retrieved November 4, 2012, from
Wikipedia The Free Encyclopedia:
http://en.wikipedia.org/wiki/Benchmark_(crude_oil)
Wikipedia. (2012, November 4). Desulfurization. Retrieved November 4, 2012, from
Wikipedia The Free Encyclopedia:
http://en.wikipedia.org/wiki/Hydrodesulfurization
Wikipedia. (2012, September 24). Hydrodesulfurization. Retrieved November 16, 2012,
from Wikipedia The Free Encyclopedia:
http://en.wikipedia.org/wiki/Hydrodesulfurization

88
Zittel, W., & Schindler, J. (2007). Crude oil. The supply outlook. Ottobrunn: Energy
Watch Group.
Zongxuan, J., Hongying, L., Yongna, Z., & Can, L. (2011). Oxidative desulfurization of
fuel oils. Liaoning: Chinese Journal of catalysis.

89
Appendices
Table 20 Estimated proved reserves holders as of January 2013 (Rachovich, 2012)
Rank Country Proved reserves
(billion barrels)
Share of total
1. Venezuela 297.6 18.2%
2. Saudi Arabia 265.4 16.2%
3. Canada 173.1 10.6%
4. Iran 154.6 9.4%
5. Iraq 141.4 8.6%
6. Kuwait 101.5 6.2%
7. UAE 97.8 6.0%
8. Russia 80.0 5.0%
9. Libya 48.0 2.9%
10. Nigeria 37.2 2.3%
11. Kazakhstan 30.0 1.8%
12. China 25.6 1.6%
13. Qatar 25.4 1.6%
14. United States 20.7 1.3%
15. Brazil 13.2 0.8%
16. Algeria 12.2 0.7%
17. Angola 10.5 0.6%
18. Mexico 10.3 0.6%
19. Ecuador 8.2 0.5%
20. Azerbaijan 7.0 0.4%
21. Oman 5.5 0.3%
22. India 5.48 0.3%
23. Norway 5.37 0.3%
World total 1,637.9 100
Total OPEC 1,204.7 73.6

90
Figure 43 The world top 10 oil producers (Eni, 2012)
Figure 44 The world top 10 natural gas producers (Eni, 2012)

91
Table 21 Crude production by gravity (thousand barrels/day) (Eni, 2012)
Table 22 Crude production by sulfur content (thousand barrels/day) (Eni, 2012)
Figure 45 Worldwide crude production by quality (thousand barrels/day) (Eni, 2012)

92
Table 23 Main features of some qualities of crude oil (benchmarks in bold) (Maugeri,
2006)
Name Origin Daily production
(thousand barrels)
API degree Sulfur content (%)
Brent blend United Kingdom 300 38.7 0.31
Forties United Kingdom 650 37.3 0.40
Ekofisk Norway 500 37.8 0.22
Statfjord Norway 480 37.7 0.29
WTI Blend United States 300 38.7 0.45
Alaskan United States 950 31 1
North Slope
Light Louisiana United States 400 38.7 0.13
West Texas Sour United States 775 34.2 1.30
BCF-17 Venezuela 800 16.5 2.5
Maya Mexico 2,450 21.6 3.6
Isthmus Mexico 500 32.8 1.4
Olmeca Mexico 400 39.3 0.8
Urals Russia 3,200 32 1.30
Siberian Light Russia 100 35.6 0.46
Arabian Light Saudi Arabia 5,000 33.4 1.80
Arabian Saudi Arabia 1,200 37 1.33
Extra Light
Arabian Medium Saudi Arabia 1,500 30.3 2.45
Arabian Heavy Saudi Arabia 800 28.7 2.8
Basrah Light Iraq 1,600 30.2 2.6
Kirkuk Iraq 350 33.3 2.3
Iran Heavy Iran 1,700 30 2
Iran Light Iran 1,300 33.4 1.6
Kuwait Kuwait 2,000 31 2.63
Dubai Dubai 100 31.4 2
Bonny Light Nigeria 450 34.3 0.15
Forcados Nigeria 400 30.4 0.18
Escavros Nigeria 300 34.4 0.15
Cabina Angola 300 32 0.12
Palanca Angola 200 37 0.17
Brega Libya 120 42 0.20
Bu Attifel Libya 100 43 0.03
Es Sider Libya 300 36.6 0.42
Saharan Blend Algeria 350 47 0.11
Tapis Malaysia 300 45.2 0.03
Daquing China 1,000 32.2 0.09
Shengli China 550 26 0.76

93
Figure 46 Historical crude oil prices, 1861-2011 (BP, 2012)

94
Figure 47 Historical natural gas prices, 1994-2011 (BP, 2012)

95
Figure 48 Quality and production volume of main crudes (thousand barrels/day) (Eni, 2011)

96
Figure 49 Maximum gasoline sulfur limits as of September 2012 (OPEC, 2012)
Figure 50 Maximum on-road diesel sulfur limits as of September 2012 (OPEC, 2012)

97
Figure 51 Examples of organosulfur compounds present in fossil fuels (McFarland,
1999)
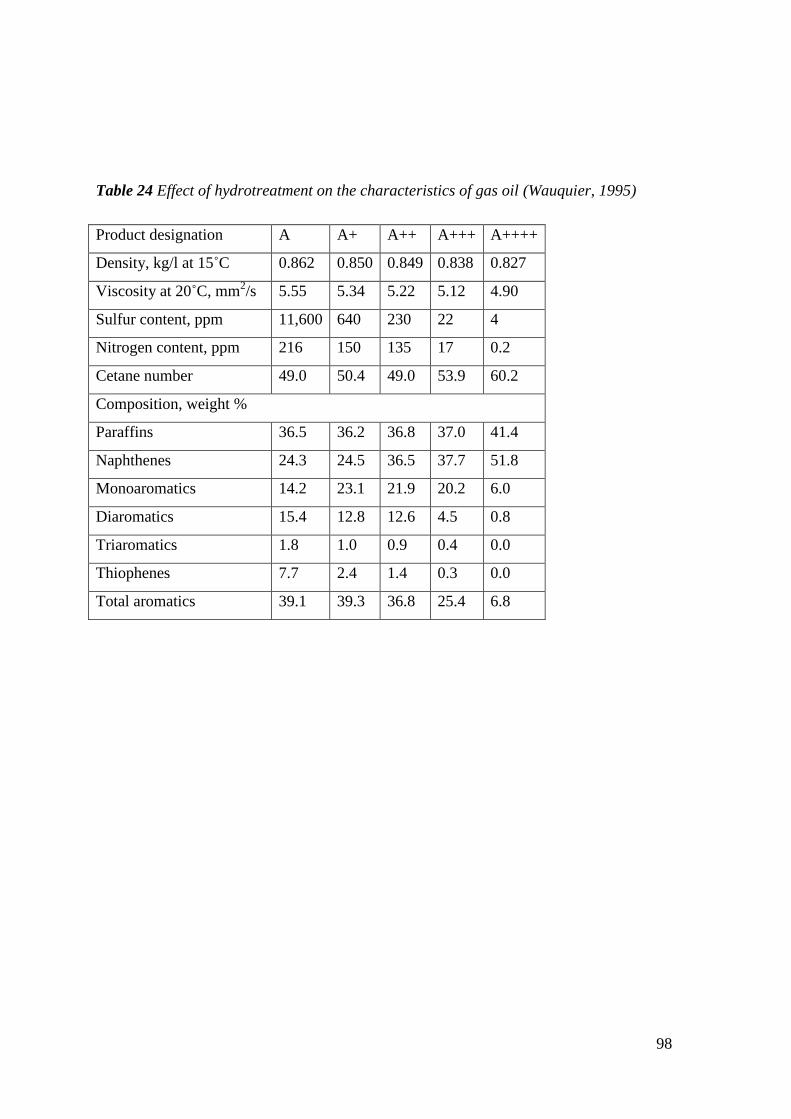
98
Table 24 Effect of hydrotreatment on the characteristics of gas oil (Wauquier, 1995)
Product designation A A+ A++ A+++ A++++
Density, kg/l at 15˚C 0.862 0.850 0.849 0.838 0.827
Viscosity at 20˚C, mm2/s 5.55 5.34 5.22 5.12 4.90
Sulfur content, ppm 11,600 640 230 22 4
Nitrogen content, ppm 216 150 135 17 0.2
Cetane number 49.0 50.4 49.0 53.9 60.2
Composition, weight %
Paraffins 36.5 36.2 36.8 37.0 41.4
Naphthenes 24.3 24.5 36.5 37.7 51.8
Monoaromatics 14.2 23.1 21.9 20.2 6.0
Diaromatics 15.4 12.8 12.6 4.5 0.8
Triaromatics 1.8 1.0 0.9 0.4 0.0
Thiophenes 7.7 2.4 1.4 0.3 0.0
Total aromatics 39.1 39.3 36.8 25.4 6.8

99
Table 25 Overview of petroleum refining processes (OSHA, 1999)
Process name Action Method Purpose Feedstock Product
Fractional processes
Atmospheric distillation Separation Thermal Separate fractions Desalted crude oil Gas, gas oil, distillate,
residual
Vacuum distillation Separation Thermal Separate w/o
cracking
Atmospheric tower
residua
Gas oil, lube stock,
residual
Conversion processed-decomposition
Catalytic cracking Alteration Catalytic Upgrade gasoline Gas oil, coke distillate Gasoline, petrochemical
feedstock
Coking Polymerize Thermal Convert vacuum
residuals
Gas oil, coke distillate Gasoline, petrochemical
feedstock
Hydro-cracking Hydrogenate Catalytic Convert to lighter
HC's
Gas oil, cracked oil,
residual
Lighter, higher-quality
products
Visbreaking Decompose Thermal Reduce viscosity Atmospheric tower
residual
Distillate, tar
Conversion processes-unification
Alkylation Combining Catalytic Unite olefins &
isoparaffins
Tower isobutane/ cracker
olefin
Iso-octane (alkylate)
Grease compounding Combining Thermal Combine soaps &
oils
Lube oil, fatty acid, alky
metal
Lubricating grease
Polymerizing Polymerize Catalytic Unite 2 or more
olefins
Cracker olefins High-octane naphtha,
petrochemical stocks
Conversion processes-alteration or rearrangement
Catalytic reforming Alteration/
dehydration
Catalytic Upgrade low-
octane naphtha
Coker/ hydro-cracker
naphtha
High octane reformate/
aromatic

100
Isomerization Rearrange Catalytic Convert straight
chain to branch
Butane, pentane, hexane Isobutane/ pentane/
hexane
Treatment processes
Amine treating Treatment Absorption Remove acidic
contaminants
Sour gas, HCs w/CO2 &
H2S
Acid free gases & liquid
HCs
Desalting Dehydration Absorption Remove
contaminants
Crude oil Desalted crude oil
Drying & sweetening Treatment Absorption /thermal Remove H2O &
sulfur compounds
Liquid HCs, LPG, alkyl
feedstock
Sweet & dry
hydrocarbons
Furfural extraction Solvent extraction Absorption Upgrade mid
distillate & lubes
Cycle oils & lube feed-
stocks
High quality diesel &
lube oil
Hydrodesulphurization Treatment Catalytic Remove sulfur,
contaminants
High-sulfur residual/ gas
oil
Desulfurized olefins
Hydrotreating Hydrogenation Catalytic
Remove
impurities, saturate
HC's
Residuals, cracked HC's Cracker feed, distillate,
lube
Phenol extraction Solvent extraction Absorption /thermal Improve viscosity
index, color
Lube oil base stocks High quality lube oils
Solvent deasphalting Treatment Absorption Remove asphalt Vacuum tower residual,
propane
Heavy lube oil, asphalt
Solvent dewaxing Treatment Cool/ filter Remove wax from
lube stocks
Vacuum tower lube oils Dewaxed lube basestock
Solvent extraction Solvent extraction Absorption/ precipitation Separate unsat. oils Gas oil, reformate,
distillate
High-octane gasoline
Sweetening Treatment Catalytic Remove H2S,
convert mercaptan
Untreated
distillate/gasoline
High-quality
distillate/gasoline
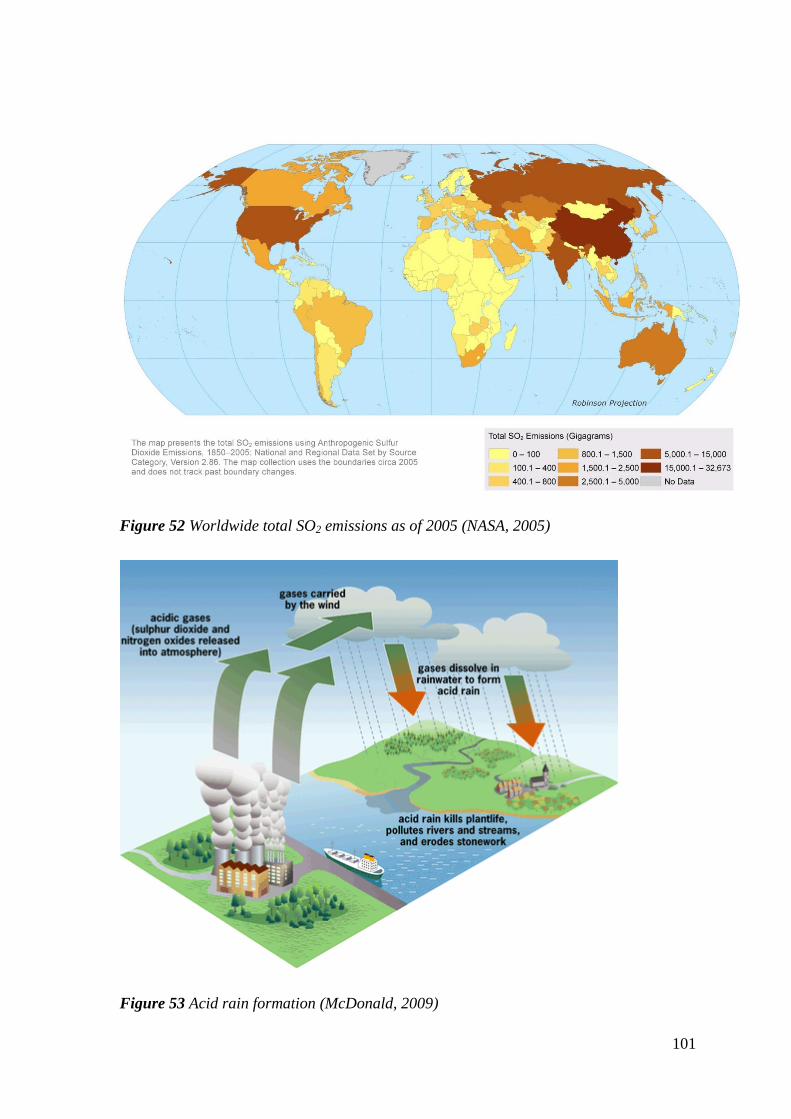
101
Figure 52 Worldwide total SO2 emissions as of 2005 (NASA, 2005)
Figure 53 Acid rain formation (McDonald, 2009)