Product Sound Quality and Sensory...
83
Product Sound Quality and Sensory Evaluation An Approach to Assessor Selection and a Comparative Study of Panels Master’s Thesis in the Master’s programme in Sound and Vibration JONAS WALLGREN Department of Civil and Environmental Engineering Division of Applied Acoustics Room Acoustics Group CHALMERS UNIVERSITY OF TECHNOLOGY Göteborg, Sweden 2011 Master’s Thesis 2011:15
Transcript of Product Sound Quality and Sensory...

Product Sound Quality and Sensory
Evaluation An Approach to Assessor Selection and a Comparative Study of Panels
Master’s Thesis in the Master’s programme in Sound and Vibration
JONAS WALLGREN
Department of Civil and Environmental Engineering
Division of Applied Acoustics
Room Acoustics Group
CHALMERS UNIVERSITY OF TECHNOLOGY
Göteborg, Sweden 2011
Master’s Thesis 2011:15


MASTER’S THESIS 2011:15
Product Sound Quality and Sensory Evaluation An Approach to Assessor Selection and a Comparative Study of Panels
Master’s Thesis in the Master’s programme in Sound and Vibration
JONAS WALLGREN
Department of Civil and Environmental Engineering
Division of Applied Acoustics
Room Acoustics Group
CHALMERS UNIVERSITY OF TECHNOLOGY
Göteborg, Sweden 2011

Product Sound Quality and Sensory Evaluation
An Approach to Assessor Selection and a Comparative Study of Panels
Master’s Thesis in the Master’s programme in Sound and Vibration
JONAS WALLGREN
© JONAS WALLGREN, 2011
Master’s Thesis 2011:15
Department of Civil and Environmental Engineering
Division of Applied Acoustics
Room Acoustics Group
Chalmers University of Technology
SE-412 96 Göteborg
Sweden
Telephone: + 46 (0)31-772 1000
Reproservice / Department of Civil and Environmental Engineering
Göteborg, Sweden 2011

Product Sound Quality and Sensory Evaluation
An Approach to Assessor Selection and a Comparative Study of Panels
Master’s Thesis in the Master’s programme in Sound and Vibration
JONAS WALLGREN
Department of Civil and Environmental Engineering
Division of Applied Acoustics
Room Acoustics Group
Chalmers University of Technology


ABSTRACT
It is an increasing interest in product sound quality (PSQ) within the industry. A new
product should not only have low noise in order to fulfil laws and regulations, it should
also have the “right” sound in order to be more appealing to the costumer.
Research has been conducted in the area of PSQ at Chalmers University of Technology
(CTH) for a number of years. In this work a panel of selected listeners have been
established, which is used to evaluate various subjective aspects of the experience of
sound. The group consists mainly of students in the field of technology.
At SIK – the Swedish Institute for Food and Biotechnology (SIK) analytical sensory
panels have been used since the middle of the 20th
century in both research and
commercial projects for the evaluation of sensory properties such as taste, aroma and
texture. The current panel consists of selected and trained persons specialized in this
area. However, it has not previously been used for listening tests.
In this study a selection method for assessor candidates to PSQ sensory panels have
been created. The method focuses on the discrimination of sounds due to different
psychoacoustic variables, e.g. loudness, roughness, sharpness. The method has then
been applied to the analytical sensory panel at SIK and the CTH panel in order to
validate it as well as to see if any differences between the two panels could be detected.
The results obtained by the selection method show only small differences between the
two panels. However, there were quite large variations among the assessors’ individual
discrimination skills.
Keywords: Sound Quality, Sound Character, Psychoacoustics, Sensory Evaluation,
Perceptual Evaluation, Jury Testing, Assessor Selection

Contents
ABSTRACT I
CONTENTS II
ACKNOWLEDGEMENTS IV
1 INTRODUCTION 1
1.1 Background 1
1.2 Objective 2
2 THEORY 3
2.1 Product Sounds 3
2.1.1 Product Sound Quality and Product Sound Character 4
2.1.2 Psychoacoustics 5
2.2 Sensory Evaluation 8
2.2.1 Sensory Evaluation Techniques 8
2.2.2 Sensory Panels 8
3 METHOD 10
3.1 Assessor Selection Procedure 10
3.1.1 Questionnaire 10
3.1.2 Audiometric Test 11
3.1.3 Listening Test 11
4 RESULTS AND ANALYSIS 16
4.1 Questionnaire 16
4.2 Audiometric Test 17
4.3 Listening Test 17
4.3.1 Block I – Loudness 19
4.3.2 Block II - Fluctuation Strength 23
4.3.3 Block III - Roughness, Tonality and Sharpness 28
5 DISCUSSION 33
6 CONCLUSION 35
7 FUTURE WORK 36
REFERENCES 37

APPENDIX A - TEST ENVIRONMENT AND EQUIPMENT 39
APPENDIX B – QUESTIONNAIRE SIK 40
APPENDIX C- QUESTIONNAIRE CTH 44
APPENDIX D – QUESTIONNAIRE ANSWERS 48
APPENDIX E – AUDIOMETRIC TEST RESULTS 52
APPENDIX F – LISTENING TEST 53
APPENDIX G – PRESENTATION ORDER 65
APPENDIX H – RESULTS SCREENING TEST 66
APPENDIX I – TABLE FOR TRIANGLE TESTS 73

Acknowledgements
I would like to thank my examiner Prof. Mendel Kleiner and my supervisors Penny
Bergman (CTH), Krister Larsson (SP), Annika Åström (SIK).
I also would like to thank Berit Albinsson, Claes-Göran Andersson, Agneta Broberg,
Gunnar Hall, Karin Hägerström, Petra Johannesson, Torbjörn Lilliebjelke, Hans
Lingnert, Mia Prim, Anna Sverkén, Karin Wendin and Helene Widén for your support
and for making my (long) stay at SIK such a nice and pleasant time.
Nick V. Zacharov and Søren Vase Legarth for their hospitality during the visit at Delta,
Denmark. All assessors who took part in this study and all the people who took part
during the development of the listening test.
Finally I would like to thank Susanne Ekman (SIK) and Cecilia Granéli for their
tremendous help and support.

CHALMERS, Civil and Environmental Engineering, Master’s Thesis 2011:15 1
1 Introduction
1.1 Background
A specific product sound is a fundamental and desirable feature of a new product and
customer surveys has shown that the acoustic properties of a product are an important
factor. It determines the image of a product, profiles a product against competitors,
influences the costumer’s satisfaction with a product, and the costumer’s decision on
selecting and buying a product. As a consequence the industry shows an increasing
interest in product sound quality (PSQ) since it can be an efficient way to strengthen
their market position and to achieve an advantage over competitors [1].
A new product should not only have low noise in order to fulfil the legal regulations,
it should also have the “right” sound for the product in question. Sound that is
unwanted is normally classified as noise and when designing products the noise
should be as low as possible in order to reduce the negative effects of sound.
However, sound can also be an important carrier of information. The sound from a
machine for example can inform the user if there is something wrong with it, or give
information on when it is time for maintenance.
To provide for the increased interest in PSQ many organizations have started research
programs in order to understand how sound and its perceived qualities affect humans
in their daily life. The ultimate aim for researchers in this field is to eliminate the
listening tests used today and replace them with predictive models that can accurately
estimate the human perception of sound. However, no such model has been
successfully established and therefore listening tests are still an essential part of PSQ
evaluation [2].
For instance, research has been conducted in the sound quality area for a number of
years at the Chalmers University of Technology (CTH) where a research group is
focusing on various aspects on PSQ. In this work a listening panel has been
established, which is used to evaluate various subjective aspects of the experience of
sound. The listening panel at CTH consists mainly of students in the field of
technology, which means that the panel might not be representative for the population
as a whole.
At SIK the Swedish Institute for Food and Biotechnology (SIK), a subsidiary to SP
Technical Research Institute of Sweden, sensory panels for the evaluation of e.g. taste,
aroma and texture have been used since the middle of the 20th
century in both research
and commercial projects. These panels consist of either trained persons specialized in
the area (i.e. analytical sensory panel), or representative consumers statistically
selected with respect to the product of interest (i.e. consumer sensory panel).
However, none of these panels have been used for listening tests before.

CHALMERS, Civil and Environmental Engineering, Master’s Thesis 2011:15 2
1.2 Objective
The main objective of this master thesis work was to investigate whether the existing
analytical sensory panel at SIK, which today mainly is used for the evaluation of taste,
aroma and texture also could be used in the evaluation of product sounds.

CHALMERS, Civil and Environmental Engineering, Master’s Thesis 2011:15 3
2 Theory
2.1 Product Sounds
Most products emit sounds in one way or another and this is not merely a negative
attribute to be reduced or eliminated. Often those sounds can either be intended to
give the user information or just a consequence of the product operating/running.
Either way, it is an attribute that can be used for positive product presentation [3].
Some parts of the sounds produced may be expected and is likely to be accepted as
characteristics of the product unless they are too loud. They let us know what is
happening in the product and may reinforce our sense of product quality. Sound may
also be a product identifier. If a new product comes along that sounds very different
from similar existing products there may be a problem with the acceptance since the
consumers expect that products of a certain type will sound in a certain way.
Furthermore, some sounds are uncharacteristic of the product and the user will not
regard such a sound in the same light as the characteristic sounds. Such a sound might
be the result of a problem that will lead to the failure of the product and the user will
have concerns about using such a product. Even if somehow the user becomes
convinced that breakdown or danger is not imminent, the sound will be attention
grabbing and make the user unsatisfied with the product. This means it is not the
loudness of uncharacteristic sounds that is the problem, it is their presence that is the
problem and they should be eliminated or made undetectable.
The acceptability and desirability of a product are affected by attributes that generally
fall into three different categories, Resource Commitment, Functionality and
Aesthetics, as seen in Figure 2.1. Within each category there is a set of attributes or
features that may or may not be of importance for the product in question. The sound
generated by a product is part both of Functionality and Aesthetics [3, 4].
Figure 2.1 The connections between different product attributes [3].

CHALMERS, Civil and Environmental Engineering, Master’s Thesis 2011:15 4
Depending on their nature the emitted sounds can roughly be categorized into three
different groups, passive, running/operating or signal sounds.
Passive sounds are produced when the product is touched but not operating (e.g. doors
open/close, etc.). These sounds are very important because they affect the costumers
purchase decision and the immediate image of the product.
Running/operating sounds are produced when the product is running or operating and
are not aimed at providing the user with any specific information. However,
sometimes the running/operation sounds will provide information (e.g. when a motor
needs maintenance etc.). The running/operating sounds affect the comfort and the
reliability of the product.
Signal sounds are produced when the product is running or operating and are aimed at
providing the user with information. It can for example be the beep from the
microwave oven when done etc [4].
2.1.1 Product Sound Quality and Product Sound Character
The quality of a product’s emitted sounds is often defined in line with the following
definition proposed by J. Blauert and U. Jekosch:
“Product-sound quality is a descriptor of the adequacy of the sound attached to a
product. It results from judgements upon the totality of auditory characteristics of the
said sound – the judgements being performed with reference to the set of those
desired features of the product which are apparent to the users in their actual
cognitive, actional and emotional situation.”[5]
This definition states that sound quality is a percept, and as a consequence has both
subjective and objective parts. The percept is product specific and relates to the
appropriateness and acceptance of a sound in a certain situation for a certain product,
this in turn implies a scale for sound quality in which listeners can make consistent
judgements, which may then be incorporated into a physical scale for the component
sounds for that product [3, 6, 7].
However the general term sound quality is often insufficiently defined and used
ambiguously. Because of this it is not always understood properly [7]. Therefore a
major distinction is done in this work between the quality and character of product
sounds, hence product sound quality (PSQ) and product sound character (PSC) [6].
PSQ refers to the subjective opinions, i.e. preference or good/bad judgements. Such
judgements are highly dependent on individual factors such as taste differences,
situational factors such as expectations, and non-auditory input such as visual
influences and vibration [6].
PSC refers to the sensory properties of a sound, i.e. how loud, rough, sharp etc. it is.
Those properties are invariant across individuals, cultures and situations and therefore
a fairly reliable perceptual estimate [6]. Many of the psychoacoustic metrics described
in Chapter 2.1.2 are measures of PSC.
The relationship between PSQ and PSC is shown in Figure 2.2 together with their
individual constituents.

CHALMERS, Civil and Environmental Engineering, Master’s Thesis 2011:15 5
Figure 2.2 The relationship between PSQ, PSC and their constituents [6].
2.1.2 Psychoacoustics
Psychoacoustics is the science where parameters of acoustic waves are related to
attributes of auditory events. It thus investigates the relation between people’s
reactions to sounds to the physical stimulus that causes the sound (i.e. pressure
fluctuations in the air). The perceptual reaction to a sound is internal to the subject
and psychoacoustics relates the perception to an objective internal scale and then to
external objective physical metrics of sound [1, 3, 5].
A basic problem concerning the psychoacoustic indices is their validity. The relation
between the indices and the physical sound has been derived from listening tests using
specific sounds, and in general the resulting index can only be applied to the same
type of sounds. Another issue present is that they are defined as monaural indices,
which mean that they are calculated for each ear independently. In contrast the human
auditory system combines signals from both ears, and therefore the binaural indices
might differ from the monaural. As consequence psychoacoustic applications can be
helpful, but only if the user has the right psychoacoustic experience and expertise [1].
In most cases the psychoacoustic metrics are poor indicators of PSQ but fairly good
measures of PSC and therefore they play an important role in sound quality
engineering [6, 8].
Loudness
Loudness is categorized as an intensity sensation and strongly affects the perceived
PSQ [8, 9].
It is the only psychoacoustic metric that has been standardized so far and there are two
major definitions commonly in use, established by Stevens and Zwicker respectively.
Both definitions share the explanation of loudness as the attribute of a sound that can

CHALMERS, Civil and Environmental Engineering, Master’s Thesis 2011:15 6
be ordered on a scale extending from quiet to loud. The standardized definitions can
be found in ISO 532 A and ISO 532 B [2, 3, 10].
The basic unit of perceived loudness is sone, which is defined as the loudness of a 40
dB 1 kHz tone. In order to compensate for the effect of frequency on the perceived
loudness it is also expressed in loudness level measured in phons. Loudness level is
given by the sound pressure level of a tone at 1 kHz, which is equally loud to the tone
being presented. The relation between loudness level and loudness is determined at 1
kHz [3].
Loudness cannot be measured directly since it is a perceptual quantity, although it can
be estimated through listening tests or through the use of models developed to predict
its subjective impression. The loudness level is frequency dependent and can be
estimated for any sound, but best known are the loudness levels for different
frequencies of pure tones. Lines which connect points of equal loudness in the hearing
area are often called equal-loudness contours, see Figure 2.3 [2, 9].
Figure 2.3 Equal-loudness contours [9].
Fluctuation Strength and Roughness
When listening to a 100% amplitude-modulated tone the listener will experience three
different sensations as the modulation frequency increases, see Figure 2.4. At low
modulation frequencies, from 1 to around 20 Hz, the loudness intensity changes up
and down and the listener experiences a loudness fluctuation. This sensation is known
as fluctuation strength. The maximum perceived fluctuation strength arises at
approximately 4 Hz [8, 9, 11].
The unit for fluctuation strength is vacil. One vacil is defined as a 60 dB, 1 kHz tone
that is 100% amplitude-modulated at 4 Hz [9].
When the modulation frequency reaches about 15 Hz the perceived loudness
fluctuations start to disappear and instead the sound is perceived as rough, this is the

CHALMERS, Civil and Environmental Engineering, Master’s Thesis 2011:15 7
sensation of roughness. It reaches its perceived maximum at around 70 Hz and the
upper limit is located at about 300 Hz. As the modulation frequency is increased even
higher the listener starts to hear separate pure tones without any effects due to the
amplitude modulation [9-11].
Figure 2.4 The relationship between fluctuation strength and roughness with respect
to the modulation frequency.
The unit of roughness is asper. One asper is defined as the roughness produced by a 1
kHz tone of 60dB which is 100% amplitude modulated at 70Hz [9].
Sharpness
Sharpness describes the high frequency components of a sound and plays a prominent
role for the perceived sound quality. A sound that contains mainly low frequencies
will feel dull and if it contain mainly high frequencies it will feel sharp. If the right
amount of sharpness is given it will give the product a character of powerfulness.
However, if the sound is to sharp it will be perceived as aggressive [8, 10, 12, 13].
The unit for sharpness is acum. One acum is defined as a narrow-band noise one
critical-band wide at a centre frequency of 1 kHz having a level of 60 dB [9].
Tonality
Tonality describes the tonal character, i.e. the “tone-to-noise” ratio, of a signal. There
exist several models for tonality. However, the perceived tonality varies among
individuals. Therefore it is suggested that tonality should be subjectively assessed
[10].
Additional and Composite Metrics
In addition to the psychoacoustic metrics discussed, a number of additional quantities
have been suggested in the literature. Specific sound quality indices for specific
applications seem to be more reasonable than the basic metrics. Those indices might
consist of a weighted combination of standard signal analysis indices, psychoacoustic
indices, or even newly developed specific indices. It can be expected that some of
these types of indices have been developed, but are not published and kept
confidential due to have an advantage on the competitive market [1, 10].
Examples of additional and composite metrics are: Sensory pleasantness,
impulsiveness, rumble noise, subjective duration and rhythm [10].

CHALMERS, Civil and Environmental Engineering, Master’s Thesis 2011:15 8
2.2 Sensory Evaluation
In the field of sensory evaluation humans are used as “measuring instruments” in
order to evaluate consumer products with respect to the human senses (sight, touch,
aroma, taste and hearing) [14].
There are mainly two purposes of implementing sensory evaluation. First there is
product preference, i.e. which product will be more favourable or less favourable to
the consumer in accordance to production quality, power, sound etc. Secondly it is to
determine certain design features or degree of modification of a manufacturing
process [3].
Sensory evaluation has been implemented in the food industry for quite some time,
e.g. at SIK since the mid 20th
century. Among others it also has been used by the
automotive industry which has put a lot of emphasis into the development of product
sounds and overall sound quality in cars. However, other industrial sectors still have a
great potential to develop their use of sensory evaluation [1].
2.2.1 Sensory Evaluation Techniques
The purpose of the study will affect just about every aspect of the experimental design
and the interpretation of the achieved response data. The testing should be carried out
under a careful experimental design so that the evaluation of the results can be done in
a proper and objective way.
Depending on the area of interest in the study there are a number of key standards that
define certain aspects of sensory evaluation. These are quite well defined in terms of
their domain and application as well as their usage. When such a standard exist, it
should be consider whether the method is suitable for the task in question instead of
developing a new method [2, 3].
There are a lot of variables to consider when designing/performing a sensory
evaluation, the type of test to be used, the number of assessors and the duration of the
test etc. Depending on the aim of the study the number of assessors and the time
required can vary substantially. Hence, the test will in most cases be broken up into
more than one session [3].
There is no limitation to what stimulus that can be used in a study as long as it can be
well motivated and stimulates the selected response attribute. However, there is a
practical limit to the number of variations that can be allowed in the stimulus set. For
an experiment to be carried out in a reasonable amount of time no more than four or
five components should be used [2, 3].
2.2.2 Sensory Panels
In sensory evaluation mainly two types of panels are used, the consumer panel and the
expert/analytical panel. The consumer panel consist of assessors whom in most cases
meet no particular criterion, i.e. naïve assessors, and it is often used if the aim of the
study is product preference etc. If the aim of the study instead is towards design
features etc. a panel of selected and trained assessors, i.e. expert or specialized expert
assessors, are often used.

CHALMERS, Civil and Environmental Engineering, Master’s Thesis 2011:15 9
Depending on the aim of the study a consumer panel can consists of just a few
assessors up to several hundred in order to get statistically valid results. This is due to
the fact that assessors differ in sensory abilities, interests, ability to work as test
subjects, and so on. The results obtained also tend to be highly subjective due to the
assessors’ lack of training in the relevant field of interest. If a trained expert panel is
used the number of assessors can be substantially reduced. For listening studies the
number of assessors can be reduced up to a factor 7 according to Bech. The results
generated by an expert panel are also more objective in their nature since the assessors
are trained to ignore their personal preferences. In the remainder of this report the
main focus is on the expert panel and its assessors [2].
The ability of the individual assessor relates to his/her capability to rate the presented
stimuli in a reliable and repeatable manner. This can be assessed through an
evaluation of the subject’s performance during some sort of selection procedure or by
analysis of the subject’s performance following an experiment. Also some practical
topics like logistics etc. are indirectly very important since it is essential that an
assessor is available, prompt and reliable for the purpose of completing an
experiment. Guidance on the selection, training and monitoring of assessors can be
found from several standards and in literature outside the field of this report, e.g. a
well formulated structure for assessor categorisation widely employed in the sensory
analysis of food products can be found in ISO 8586-1 and ISO 8586-2, see Table 2.1
for a summary. The standardised approach presented here is well structured and
rigorous and is almost directly applicable when it comes to the evaluation of sound
[2].
Table 2.1 Summary of assessor categories as defined in ISO standard 8586-2 [2, 15].
Assessor
Category Definition
Assessor Any person taking part in a sensory test
Naïve assessor A person who does not meet any particular criterion
Initiated
assessor A person who has already participated in a sensory test
Selected
assessor Assessor chosen for his/her ability to carry out a sensory test
Expert
In the general sense, a person who trough knowledge or experience has competence
to give an opinion in the fields about which he/she is consulted (Please note that the
term expert does not provide any indication regarding the qualification or suitability
of the individual to perform sensory tests)
Expert assessor
Selected assessor with a high degree of sensory sensitivity and experience in sensory
methodology, who is able to make consistent and repeatable sensory assessments of
various products
Specialized
expert assessor
Expert assessor who has additional experience as a specialist in the product and/or
process and/or marketing, and who is able to perform sensory analysis of the product
and evaluate or predict effects of variations relating to raw materials, recipes,
processing, storage, ageing, and so on.

CHALMERS, Civil and Environmental Engineering, Master’s Thesis 2011:15 10
3 Method
3.1 Assessor Selection Procedure
The recruitment process of assessors for sensory evaluation can be divided into two
parts. The first part is to obtain general information about the subject. This can for
instance be done by an interview or a questionnaire. Subsequently a screening
procedure is performed in order to assess the subjects suitability [16].
As there is yet no standardized selection procedure for assessors with respect to
listening skills a new approach to assessor selection was created. The selection
procedure was mainly designed with the intent to be performed at the SIK premises in
Gothenburg with the equipment available.
The selection procedure was partially based on the Generalised Listener Selection
procedure by Mattila, Zacharov and Isherwood et al. [2], ISO 8586-1 [16], ISO 8586-
2 [15] and NT ACOU 111 [17].
The assessor selection procedure was divided into three separate blocks aiming at
selecting the best suited assessors due to certain criteria in each block. A
questionnaire was used in the first block in order to do a background check and the
screening procedure was divided into an audiometric test and a listening test, see
Table 3.1 for a schematic overview of the three blocks.
Table 3.1 Schematic overview of the Assessor Selection Procedure
Assessor Selection Procedure
1) Questionnaire 2) Audiometric Test 3) Listening Test
Known hearing loss
Interest
Availability
Normal hearing Discrimination
Repeatability
Quantification
The selection of the SIK and CTH panels was performed using the same procedure.
In the case of any deviations from this method it will be indicated in the text.
3.1.1 Questionnaire
A questionnaire was created based on previous work by Bech, Zacharov [2, 18], Trost
and Hultåker [19]. The aim of the questionnaire was to exclude assessors with a
known hearing loss, lack of interest and/or motivation. The subjects were also asked
about their availability to attend the practical parts of the study.
In some questions the questionnaires sent out to the two panels differed slightly due to
the nature and experience of the panels, see Appendix B and Appendix C for a
complete exposition.
The questionnaires were sent out via email to all assessors in both the SIK and CTH
panels.

CHALMERS, Civil and Environmental Engineering, Master’s Thesis 2011:15 11
3.1.2 Audiometric Test
An audiometric test was conducted in order to find out about the assessors hearing
level. Due to the audiometric equipment and facilities used the assessors were only
tested for a deviation of 20dB hearing level, i.e. normal hearing in the interval 125 to
8000 Hz [20].
Prior to the test a short oral introduction about the test was given to each assessor.
All audiometric tests were carried out in an office at SIK during 2009-2010 with the
PC-based screener audiometer Oscilla USB-300 and AudioConsole software from
Inmedico (www.inmedico.com), see Figure 3.1.
Figure 3.1 PC-based screener audiometer Oscilla USB-3001.
3.1.3 Listening Test
A listening test aims at testing the assessors’ ability to discriminate between a number
of sound stimuli as well as to and quantify them in accordance to a given scale. Also,
by doing a number of replicates for each judgement the assessors’ ability to repeat
their judgements are tested.
The listening test was divided into three separate blocks with a short break in between
each subsequent block. Each block was further divided into two or three sub tests each
testing for one dependent variable at a time. A schematic overview of the listening test
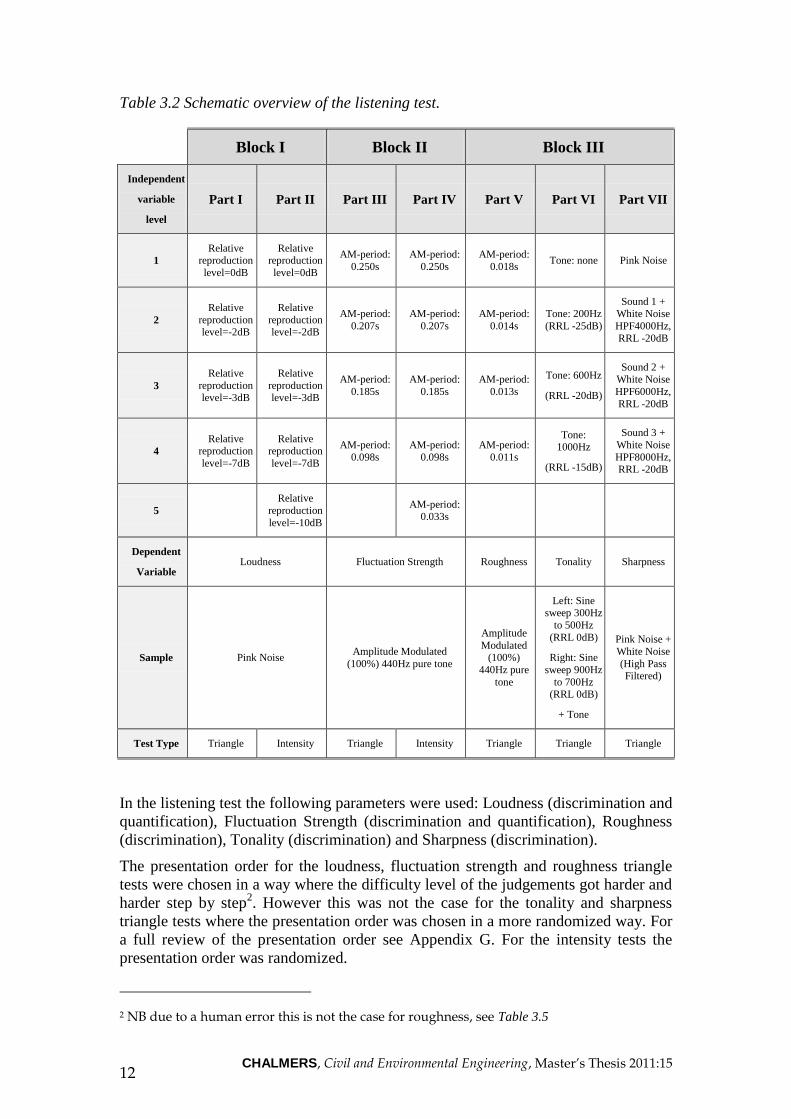
can be found in Table 3.2.
The listening test was made up of two test types, triangle and intensity tests. Triangle
tests were chosen due to their simplicity and aimed to test the assessors’
discrimination skills. Intensity tests were chosen in order to test the assessors’
quantification skills.
1 Courtesy of Inmedico A/S
CHALMERS, Civil and Environmental Engineering, Master’s Thesis 2011:15 12
Table 3.2 Schematic overview of the listening test.
Block I Block II Block III
Independent
variable
level
Part I Part II Part III Part IV Part V Part VI Part VII
1
Relative reproduction
level=0dB
Relative reproduction
level=0dB
AM-period:
0.250s
AM-period:
0.250s
AM-period:
0.018s Tone: none Pink Noise
2
Relative
reproduction level=-2dB
Relative
reproduction level=-2dB
AM-period:
0.207s
AM-period:
0.207s
AM-period:
0.014s
Tone: 200Hz
(RRL -25dB)
Sound 1 + White Noise
HPF4000Hz,
RRL -20dB
3
Relative
reproduction level=-3dB
Relative
reproduction level=-3dB
AM-period:
0.185s
AM-period:
0.185s
AM-period:
0.013s
Tone: 600Hz
(RRL -20dB)
Sound 2 + White Noise
HPF6000Hz,
RRL -20dB
4
Relative reproduction
level=-7dB
Relative reproduction
level=-7dB
AM-period:
0.098s
AM-period:
0.098s
AM-period:
0.011s
Tone: 1000Hz
(RRL -15dB)
Sound 3 +
White Noise
HPF8000Hz, RRL -20dB
5
Relative
reproduction
level=-10dB
AM-period:
0.033s
Dependent
Variable Loudness Fluctuation Strength Roughness Tonality Sharpness
Sample Pink Noise Amplitude Modulated
(100%) 440Hz pure tone
Amplitude
Modulated (100%)
440Hz pure
tone
Left: Sine sweep 300Hz
to 500Hz
(RRL 0dB)
Right: Sine
sweep 900Hz
to 700Hz (RRL 0dB)
+ Tone
Pink Noise +
White Noise
(High Pass Filtered)
Test Type Triangle Intensity Triangle Intensity Triangle Triangle Triangle
In the listening test the following parameters were used: Loudness (discrimination and
quantification), Fluctuation Strength (discrimination and quantification), Roughness
(discrimination), Tonality (discrimination) and Sharpness (discrimination).
The presentation order for the loudness, fluctuation strength and roughness triangle
tests were chosen in a way where the difficulty level of the judgements got harder and
harder step by step2. However this was not the case for the tonality and sharpness
triangle tests where the presentation order was chosen in a more randomized way. For
a full review of the presentation order see Appendix G. For the intensity tests the
presentation order was randomized.
2 NB due to a human error this is not the case for roughness, see Table 3.5

CHALMERS, Civil and Environmental Engineering, Master’s Thesis 2011:15 13
All listening tests were performed in the SIK sensory lab during spring 2010. The
equipment used can be found in Appendix A and a picture of one of the test booths
can be found in Figure 3.2.
Figure 3.2 One of the booths in the sensory lab at SIK.
Designing the Sounds
All sounds used in the listening test were primarily generated in Test Tone Generator
by Esser Audio (www.esseraudio.com), see Figure 3.3. Additional components and
mixing were done using the software presented in Table 3.3. The duration of all sound
samples were two seconds.
Table 3.3 Software used for sound design.
Test Tone Generator v.4.32 by Esser Audio
Multi Tone Generator v.1.81 by Esser Audio
Filtered Noise Generator v.1.0 by Esser Audio
Audacity 1.2.6

CHALMERS, Civil and Environmental Engineering, Master’s Thesis 2011:15 14
Figure 3.3 Screenshot of Test Tone Generator.
During the development process of the listening test a number of test runs were
conducted with a number of individuals in order to get the sound levels right as well
as the formulation of the questions.
Loudness
Pink noise was used for the loudness sound samples. The loudness levels for the four
sound samples were chosen in a way so the relative differences were achieved in
accordance with Table 3.4 for Part I. As can be seen the relative differences for each
pair goes from a fairly large difference of 7 dB down to a quite small difference of 1
dB.
Table 3.4 Relative differences in loudness level between sound samples.
Sounds Relative difference in loudness level
2 - 3 1 dB
1 - 2 2 dB
1 - 3 3 dB
3 - 4 4 dB
2 - 4 5 dB
1 - 4 7 dB
In Part II an additional fifth sound was added with a relative loudness level found in
Table 3.2.

CHALMERS, Civil and Environmental Engineering, Master’s Thesis 2011:15 15
Fluctuation Strength and Roughness
For fluctuation strength and roughness a similar approach as for loudness was used. A
pure sine tone with a frequency of 440 Hz was chosen as a base for the sound
samples. The tone was then 100% amplitude modulated with the modulation periods
found in Table 3.2 and the relative differences in modulation period between the
samples can be found in Table 3.5.
Table 3.5 Relative differences in modulation period between sound samples for
fluctuation strength and roughness.
Sounds Fluctuation Strength Roughness
2 - 3 0.022 s 0.001 s
1 - 2 0.043 s 0.004 s
1 - 3 0.065 s 0.005 s
3 - 4 0.087 s 0.002 s
2 - 4 0.109 s 0.003 s
1 - 4 0.152 s 0.007 s
Tonality
For the tonality test a sound composed of two sine sweeps was used, 300 to 500 Hz
for the left ear and 900 to 700 for the right ear. Then additional tones were added in
accordance with Table 3.2.
Sharpness
Pink noise was used as a base for the sharpness sound samples. Then high pass
filtered white noise was added to the sound samples in order to get a increased level
of sound energy in the higher frequencies, see Table 3.2.

CHALMERS, Civil and Environmental Engineering, Master’s Thesis 2011:15 16
4 Results and Analysis From here on the assessors from the SIK panel are labelled SIK_XX and the assessors
from the CTH panel are labelled CTH_XX (XX denote the number each assessor are
allotted to be identified and followed during the selection procedure).
The results of the two panels are treated individually in order to observe if there are
any differences between the two. Further the assessors are also examined individually
in order to verify the selection procedure. A summary of the number of assessors
during the different steps of the selection procedure can be found in Table 4.1.
All tests were carried out during 2009-2010 at the SIK premises in Gothenburg,
Sweden. No consideration has been taken in accordance concerning the gender of the
assessors. The assessors from the SIK panel were compensated with salary (approx.
180Skr/hour). The CTH assessors were compensated with 2-3 cinema tickets
depending on the number of tests each assessor participated in.
Table 4.1 Summary of the number of assessors during the Selection Procedure.
Panel Assessors contacted Questionnaires Audiometric tests Screening tests
SIK 27 22 19 3 9
4
CTH Approx. 125 5 15 10
6 10
4.1 Questionnaire
The questionnaires were sent out to the SIK panel during late fall 2009 and to the
CTH panel during early spring 2010.
Out of 27 questionnaires sent out to the SIK panel 22 were returned with answers.
None of the assessors from the SIK panel were excluded due to their answers
concerning health, interest etc. Although some assessors did not have the possibility
to take part in further testing. See Table 4.1.
Approximately 125 questionnaires were sent out to the CTH panel. The exact number
was hard to obtain due to several non valid e-mail addresses. Due to few responses
within time additional recruitment were conducted among the student population in
Gothenburg. The final number of answered questionnaires including the additional
recruitment was 15. None of the assessors were excluded due to their answers.
Although some assessors did not have the possibility to take part in further testing.
From here on the new recruits will be treated as members in the CTH panel.
With respect to the answers in the questionnaires the categorization of assessors,
according to ISO 8586-2, found in Table 4.2 could be done.
3 One of the assessors tested has not answered the questionnaire 4 One assessor did not take part in Block III 5 Additional recruitment due to few answers from the CTH assessors 6 Three of the assessors have performed the test earlier with satisfactory results

CHALMERS, Civil and Environmental Engineering, Master’s Thesis 2011:15 17
Table 4.2 Categorization of assessors according to ISO standard 8586-2.
Panel, Sensation Naïve
Assessor
Initiated
Assessor
Selected
Assessor
Expert
Assessor
SIK, Taste/Aroma 0 0 0 22
SIK, Sound 20 2 0 0
CTH,
Taste/Aroma 10 5 0 0
CTH, Sound 4 0 11 0
A more thorough review of the questionnaires can be found in Appendix D.
4.2 Audiometric Test
Assessors available for further testing conducted an audiometric test. The audiometric
test only tested the assessors for a deviation of 20 dB hearing level, i.e. normal
hearing in the interval 125-8000 Hz.
The audiometric test was conducted in an office at the SIK premises during the period
2009-2010. The test location and the simplicity of the test were assumed to influence
the test results. Hence a mean deviation of <21.40 in the frequency range 125-8000
Hz were allowed in order to take part in further testing.
Due to a deprived hearing level a few of the SIK assessors but none of the CTH
assessors were excluded from further testing. A more comprehensive review of the
audiometric test results can be found in Appendix E.
4.3 Listening Test
During a number of sessions in the spring of 2010 nine assessors from the SIK panel
and ten assessors from the CTH panel took part in the listening test. One assessor
from the SIK panel only performed Block I and II and due to technical problems one
SIK assessors was forced to undergo the listening test a second time.
Before the listening test was started the assessors were given a short oral introduction.
They were told about the 30 second time limit for each question and how to go about
when answering the questions in the test etc.
The average time7 used to perform the listening test for each assessor was
approximately 40 minutes for the SIK panel8 and 28 minutes for the CTH panel, see
7 Excluding breaks 8 SIK_19 not included

CHALMERS, Civil and Environmental Engineering, Master’s Thesis 2011:15 18
Table 4.3 for individual test times.
A summary of the results obtained in the listening test can be found in Chapters 4.3.1-
4.3.3, a more thorough review of the results can be found in Appendix H.
All significances for the triangle tests are calculated using the table in Appendix I.
Note that the maximum significances differ between the three first columns and the
three last columns in the loudness, fluctuation strength and roughness triangle tests
due to the number of judgements for each pair. For additional calculations
PanelCheck and FIZZ Calculation have been used.

CHALMERS, Civil and Environmental Engineering, Master’s Thesis 2011:15 19
Table 4.3 Time in seconds used for the different tests.
Code Part I Part II Part III Part IV Part V Part VI Part VII Total time
SIK_03 838 318 469 237 396 570 450 3278
SIK_04 479 194 414 168 411 340 368 2374
SIK_06 378 202 334 176 307 385 334 2116
SIK_07 424 216 322 120 346 402 367 2197
SIK_10 421 147 338 162 324 378 365 2135
SIK_11 516 167 456 122 493 516 475 2745
SIK_15 412 154 434 90 514 605 543 2752
SIK_18 590 176 344 114 287 375 386 2272
SIK_19 753 291 469 269 - - - 17829
CTH_01 239 109 158 58 143 223 161 1091
CTH_03 327 138 283 109 271 260 274 1662
CTH_04 290 97 230 90 195 278 278 1458
CTH_06 371 158 294 131 253 315 272 1794
CTH_07 286 95 218 85 221 254 249 1408
CTH_10 539 175 286 126 484 276 492 2378
CTH_12 468 160 331 125 372 312 318 2086
CTH_13 404 152 338 135 292 283 294 1898
CTH_14 275 111 225 109 245 226 259 1450
CTH_15 456 212 255 143 228 260 252 1806
4.3.1 Block I – Loudness
Loudness - Triangle Test
With respect to loudness both panels show the same significance, see Table 4.4. If you
look at each assessor at a time some differences can be found, see
Table 4.5.
As expected the majority of errors came toward the relative difference of 1dB. Errors
in the first three triangles are probably due to poor concentration or negligence.
9 Only Part I-IV

CHALMERS, Civil and Environmental Engineering, Master’s Thesis 2011:15 20
Table 4.4 Loudness significance for the both panels.
Panel 1 & 4 2 & 4 3 & 4 1 & 3 1 & 2 2 & 3
SIK 0.001 0.001 0.001 0.001 0.001 0.001
CTH 0.001 0.001 0.001 0.001 0.001 0.001
Table 4.5 Loudness significance for each assessor.
Code 1 & 4 2 & 4 3 & 4 1 & 3 1 & 2 2 & 3
SIK_03 0.05 0.05 0.05 0.005 0.05 0.05
SIK_04 0.05 0.05 0.05 0.05 0.005 ns
SIK_06 0.05 0.05 0.05 0.005 0.005 0.005
SIK_07 0.05 0.05 0.05 0.005 0.30 0.05
SIK_10 0.05 0.05 0.05 0.005 0.005 0.005
SIK_11 0.05 0.05 0.05 0.005 0.005 ns
SIK_15 0.05 0.05 0.05 0.005 0.005 ns
SIK_18 0.05 0.05 0.05 0.005 0.005 0.005
SIK_19 0.05 0.05 0.05 0.005 0.005 0.005
CTH_01 0.05 0.05 0.05 0.05 0.005 ns
CTH_03 0.05 0.05 0.05 0.005 0.05 ns
CTH_04 0.30 0.05 0.05 0.05 0.05 ns
CTH_06 0.05 0.05 0.05 0.005 0.005 0.005
CTH_07 0.05 0.05 0.05 0.005 0.005 0.30
CTH_10 0.05 0.05 0.05 0.05 0.30 0.30
CTH_12 0.05 0.05 0.05 0.005 0.05 0.05
CTH_13 0.05 0.30 0.05 0.005 0.005 0.005
CTH_14 0.05 0.05 0.05 0.005 0.005 0.005
CTH_15 0.05 0.30 0.05 0.005 0.005 0.05

CHALMERS, Civil and Environmental Engineering, Master’s Thesis 2011:15 21
Loudness – Intensity Test
The results from the loudness intensity test are shown in Table 4.6. One can clearly
see a big spread of the sounds in the middle while the two outer (reference) sounds
got a smaller spread for the SIK panel. For the CTH panel this is not as legible.
Table 4.6 Results from loudness intensity test.
Code Sound 1 Sound 2 Sound 3 Sound 4 Sound 5
SIK_03 90 74 90 86 68 79 87 70 89 24 19 34 9 10 19
SIK_04 77 72 76 49 49 60 73 69 53 45 52 26 17 19 16
SIK_06 77 72 71 75 56 51 23 18 45 14 17 15 10 10 11
SIK_07 82 85 86 66 80 52 36 29 68 14 13 11 3 8 6
SIK_10 90 90 86 23 51 37 38 32 21 11 10 10 10 9 10
SIK_11 90 90 90 54 44 44 16 44 62 10 16 10 10 10 10
SIK_15 88 88 88 86 87 87 88 87 87 25 15 14 14 14 12
SIK_18 97 95 99 90 97 84 80 66 81 25 49 35 10 17 10
SIK_19 75 72 90 71 72 74 59 48 49 25 30 37 11 10 12
CTH_01 62 55 75 66 78 82 78 62 86 50 47 28 11 28 10
CTH_03 89 89 89 83 87 85 63 67 69 33 27 16 11 11 11
CTH_04 90 90 85 68 52 57 49 29 47 15 15 13 12 10 10
CTH_06 88 74 90 68 72 80 65 59 46 37 21 20 10 20 9
CTH_07 83 80 85 76 79 72 72 68 63 28 31 12 18 29 11
CTH_10 80 72 87 61 60 72 79 86 84 80 51 70 52 57 52
CTH_12 84 87 75 54 51 69 52 60 38 17 20 28 15 15 12
CTH_13 90 90 82 46 61 48 85 77 83 25 30 18 11 20 11
CTH_14 88 90 90 79 82 85 82 76 61 37 54 10 11 14 10
CTH_15 84 82 86 71 66 83 65 68 78 50 50 31 14 27 15
When the results in Table 4.6 undergo a Tukey test the results in Table 4.7 are
obtained. The difference between levels with same letter is not significant (5%). As
can be seen the assessors have problems discriminating between Sound 2, Sound 3
and Sound 4. When the Tukey test is done for the whole panels the SIK panel can
discriminate between all sounds while the CTH panel have problems discriminating
between Sound 2 and Sound 3.

CHALMERS, Civil and Environmental Engineering, Master’s Thesis 2011:15 22
Table 4.7 Tukey Test at 5% for Loudness.
Code Sound 1 Sound 2 Sound 3 Sound 4 Sound 5
SIK_03 A A A B B
SIK_04 A AB BC C D
SIK_06 A A B B B
SIK_07 A AB B C C
SIK_10 A B B C C
SIK_11 A B BC CD D
SIK_15 A A A B B
SIK_18 A AB B C D
SIK_19 A A B C D
SIK Panel A B C D E
CTH_01 A A AB BC C
CTH_03 A A B C D
CTH_04 A B C D D
CTH_06 A AB B C C
CTH_07 A A A B B
CTH_10 A A AB AB B
CTH_12 A B B C C
CTH_13 A A B C C
CTH_14 A A A B B
CTH_15 A A A B C
CTH Panel A B B C D
SIK&CTH Panel A B B C D

CHALMERS, Civil and Environmental Engineering, Master’s Thesis 2011:15 23
Table 4.8 Loudness statistics for the SIK Panel.
Sound 1 Sound 2 Sound 3 Sound 4 Sound 5
Mean 84,44 65,63 56,22 22,44 11,37
Range (max-Min) 28 74 73 42 16
Std. Dev. (n-1) 8,33 18,89 23,95 12,50 3,71
Var. Coeff. (%) 9,86 28,78 42,60 55,68 32,65
Conf. Int. 5%± 3,29 7,47 9,48 4,94 1,47
Table 4.9 Loudness statistics for the CTH Panel.
Sound 1 Sound 2 Sound 3 Sound 4 Sound 5
Mean 83,03 69,77 66,57 32,13 18,23
Range (max-Min) 35 41 57 70 48
Std. Dev. (n-1) 8,56 12,05 14,74 17,50 13,22
Var. Coeff. (%) 10,31 17,27 22,14 54,45 72,48
Conf. Int. 5%± 3,20 4,50 5,50 6,53 4,93
4.3.2 Block II - Fluctuation Strength
Fluctuation Strength - Triangle Test
With respect to Fluctuation Strength both panels show the same significance, see
Table 4.10. If you look at each assessor differences can be found, see

CHALMERS, Civil and Environmental Engineering, Master’s Thesis 2011:15 24
Table 4.11.
Table 4.10 Fluctuation Strength significance for the both panels.
Panel 1 & 4 2 & 4 3 & 4 1 & 3 1 & 2 2 & 3
SIK 0.001 0.001 0.001 0.001 0.001 0.001
CTH 0.001 0.001 0.001 0.001 0.001 0.001

CHALMERS, Civil and Environmental Engineering, Master’s Thesis 2011:15 25
Table 4.11 Fluctuation Strength significance for each assessor.
Code 1 & 4 2 & 4 3 & 4 1 & 3 1 & 2 2 & 3
SIK_03 0.05 0.05 0.05 0.005 0.005 0.05
SIK_04 0.05 0.05 0.05 0.005 0.005 0.30
SIK_06 0.05 0.05 0.05 0.005 0.005 0.005
SIK_07 0.05 0.05 0.05 0.005 0.005 0.05
SIK_10 0.05 0.05 0.05 0.005 0.05 0.30
SIK_11 0.05 0.05 0.05 0.005 0.005 0.05
SIK_15 0.05 0.05 0.05 0.005 0.05 0.05
SIK_18 0.05 0.05 0.05 0.005 0.005 0.05
SIK_19 0.05 0.05 0.05 0.005 0.005 0.005
CTH_01 0.05 0.05 0.05 0.005 0.05 0.30
CTH_03 0.05 0.05 0.05 0.005 0.005 0.005
CTH_04 0.05 0.05 0.05 0.005 0.005 0.05
CTH_06 0.05 0.05 0.05 0.005 0.005 0.005
CTH_07 0.05 0.05 0.05 0.005 0.005 0.005
CTH_10 0.05 0.05 0.05 0.005 0.005 0.005
CTH_12 0.05 0.05 0.05 0.005 0.005 ns
CTH_13 0.05 0.05 0.05 0.005 0.005 0.005
CTH_14 0.05 0.05 0.05 0.005 0.005 0.005
CTH_15 0.05 0.05 0.05 0.005 0.005 0.005

CHALMERS, Civil and Environmental Engineering, Master’s Thesis 2011:15 26
Fluctuation Strength – Intensity Test
The results from the fluctuation strength intensity test are shown in Table 4.12.
Table 4.12 Results from loudness intensity test.
Code Sound 1 Sound 2 Sound 3 Sound 4 Sound 5
SIK_03 10 10 23 17 25 29 33 26 56 77 82 90 90 90 90
SIK_04 21 25 21 28 35 39 57 66 34 69 67 63 75 82 84
SIK_06 11 13 12 40 48 48 47 35 47 50 44 60 90 88 90
SIK_07 10 8 6 22 11 17 26 46 46 71 69 73 95 81 98
SIK_10 13 13 15 12 11 15 18 10 11 72 86 86 91 90 93
SIK_11 34 10 19 47 12 16 44 19 14 90 77 87 90 90 85
SIK_15 14 15 15 14 15 14 13 15 14 21 15 12 85 83 81
SIK_18 10 5 2 20 21 10 49 35 31 21 66 74 90 90 90
SIK_19 25 26 11 22 26 20 34 26 51 90 85 80 90 91 90
CTH_01 10 23 59 52 17 22 40 18 23 30 42 34 90 87 91
CTH_03 11 11 10 22 31 39 36 20 28 59 54 47 88 89 88
CTH_04 49 35 38 36 45 25 43 38 32 38 77 40 83 84 86
CTH_06 10 10 13 42 13 25 31 35 29 60 57 80 90 90 89
CTH_07 11 20 20 29 36 36 40 48 46 58 54 54 79 82 69
CTH_10 19 25 24 74 79 65 73 74 66 76 88 83 80 82 89
CTH_12 12 13 14 16 16 12 17 13 30 49 63 57 76 82 87
CTH_13 17 11 12 21 24 16 23 37 49 79 74 57 90 89 89
CTH_14 23 16 16 33 29 17 30 48 48 74 71 68 90 89 86
CTH_15 13 15 24 41 33 31 37 24 28 69 64 71 90 90 89
When the results in Table 4.12 undergo a Tukey test the results in
Table 4.13 are obtained. The difference between levels with same letter is not
significant (5%). As can be seen the assessors have problems discriminating between
Sound 2, Sound 3 and Sound 4. When the test is done for the whole panels the SIK
panel can discriminate between all sounds while the CTH panel have problems with
Sound 3 and Sound 4.

CHALMERS, Civil and Environmental Engineering, Master’s Thesis 2011:15 27
Table 4.13 Tukey Test at 5% for Fluctuation Strength.
Code Sound 1 Sound 2 Sound 3 Sound 4 Sound 5
SIK_03 A A B BC C
SIK_04 A AB BC CD D
SIK_06 A B B B C
SIK_07 A B C D D
SIK_10 A A B B B
SIK_11 A A B B B
SIK_15 A B B B B
SIK_18 A AB BC BC C
SIK_19 A A B B B
SIK Panel A B C D E
CTH_01 A B B B B
CTH_03 A B C C D
CTH_04 A B B B B
CTH_06 A B C C C
CTH_07 A B BC C D
CTH_10 A A A A B
CTH_12 A B C C C
CTH_13 A A B BC C
CTH_14 A B C CD D
CTH_15 A B C CD D
CTH Panel A B C C D
SIK&CTH Panel A B C C D

CHALMERS, Civil and Environmental Engineering, Master’s Thesis 2011:15 28
Table 4.14 Statistics Fluctuation Strength SIK Panel.
Sound 1 Sound 2 Sound 3 Sound 4 Sound 5
Mean 14,70 23,48 33,44 65,81 88,22
Range (max-Min) 31 38 56 78 23
Std. Dev. (n-1) 7,36 11,96 16,01 23,67 4,82
Var. Coeff. (%) 50,08 50,92 47,86 35,97 5,47
Conf. Int. 5%± 2,91 4,73 6,33 9,37 1,91
Table 4.15 Statistics Fluctuation Strength CTH Panel.
Sound 1 Sound 2 Sound 3 Sound 4 Sound 5
Mean 19,47 32,57 36,80 60,90 86,10
Range (max-Min) 49 67 61 58 22
Std. Dev. (n-1) 11,86 17,00 15,23 15,10 5,07
Var. Coeff. (%) 60,93 52,21 41,38 24,80 5,89
Conf. Int. 5%± 4,43 6,35 5,69 5,64 1,89
4.3.3 Block III - Roughness, Tonality and Sharpness
Roughness - Triangle Test
With respect to Roughness both panels show the same significance, see Table 4.16. If
you look at each assessor differences can be found, see

CHALMERS, Civil and Environmental Engineering, Master’s Thesis 2011:15 29
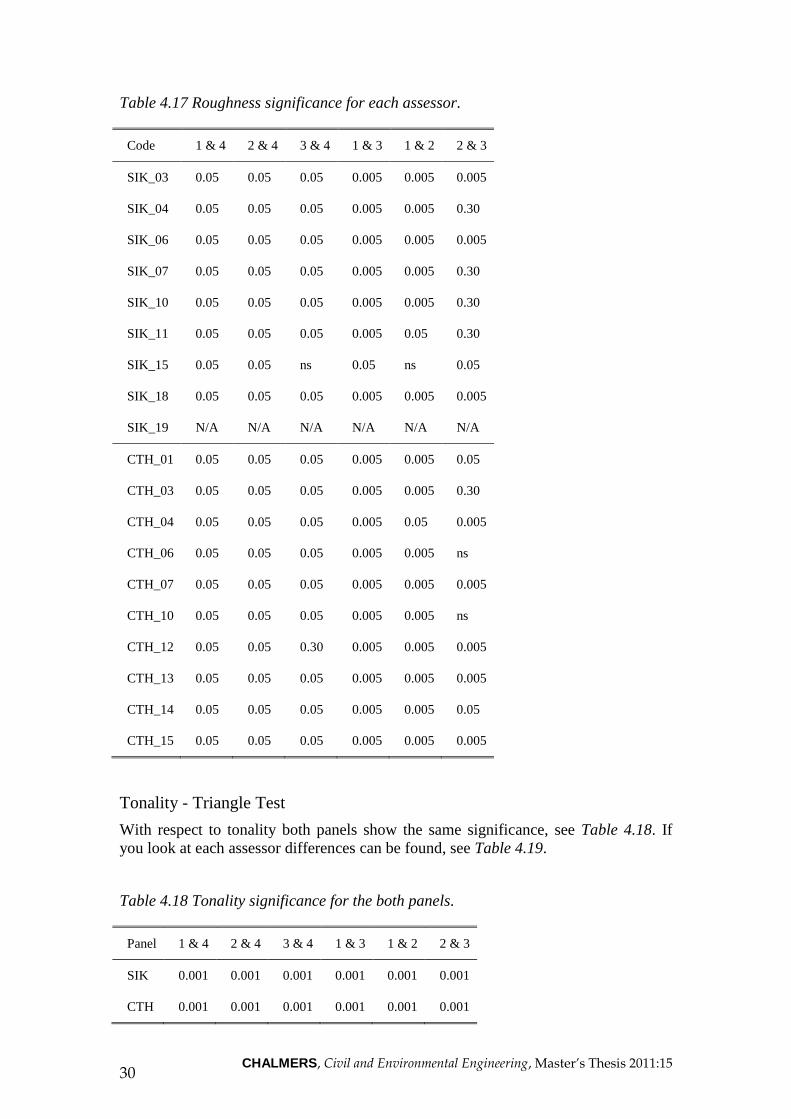
Table 4.17.
Table 4.16 Roughness significance for the both panels.
Panel 1 & 4 2 & 4 3 & 4 1 & 3 1 & 2 2 & 3
SIK 0.001 0.001 0.001 0.001 0.001 0.001
CTH 0.001 0.001 0.001 0.001 0.001 0.001
CHALMERS, Civil and Environmental Engineering, Master’s Thesis 2011:15 30
Table 4.17 Roughness significance for each assessor.
Code 1 & 4 2 & 4 3 & 4 1 & 3 1 & 2 2 & 3
SIK_03 0.05 0.05 0.05 0.005 0.005 0.005
SIK_04 0.05 0.05 0.05 0.005 0.005 0.30
SIK_06 0.05 0.05 0.05 0.005 0.005 0.005
SIK_07 0.05 0.05 0.05 0.005 0.005 0.30
SIK_10 0.05 0.05 0.05 0.005 0.005 0.30
SIK_11 0.05 0.05 0.05 0.005 0.05 0.30
SIK_15 0.05 0.05 ns 0.05 ns 0.05
SIK_18 0.05 0.05 0.05 0.005 0.005 0.005
SIK_19 N/A N/A N/A N/A N/A N/A
CTH_01 0.05 0.05 0.05 0.005 0.005 0.05
CTH_03 0.05 0.05 0.05 0.005 0.005 0.30
CTH_04 0.05 0.05 0.05 0.005 0.05 0.005
CTH_06 0.05 0.05 0.05 0.005 0.005 ns
CTH_07 0.05 0.05 0.05 0.005 0.005 0.005
CTH_10 0.05 0.05 0.05 0.005 0.005 ns
CTH_12 0.05 0.05 0.30 0.005 0.005 0.005
CTH_13 0.05 0.05 0.05 0.005 0.005 0.005
CTH_14 0.05 0.05 0.05 0.005 0.005 0.05
CTH_15 0.05 0.05 0.05 0.005 0.005 0.005
Tonality - Triangle Test
With respect to tonality both panels show the same significance, see Table 4.18. If
you look at each assessor differences can be found, see Table 4.19.
Table 4.18 Tonality significance for the both panels.
Panel 1 & 4 2 & 4 3 & 4 1 & 3 1 & 2 2 & 3
SIK 0.001 0.001 0.001 0.001 0.001 0.001
CTH 0.001 0.001 0.001 0.001 0.001 0.001

CHALMERS, Civil and Environmental Engineering, Master’s Thesis 2011:15 31
Table 4.19 Tonality significance for each assessor.
Code 1 & 4 2 & 4 3 & 4 1 & 3 1 & 2 2 & 3
SIK_03 0.05 0.05 0.05 0.05 0.05 0.20
SIK_04 0.20 0.05 0.05 0.20 0.05 0.05
SIK_06 0.05 0.05 0.05 0.05 0.05 ns
SIK_07 0.20 0.20 0.05 0.20 0.05 ns
SIK_10 0.05 0.05 0.20 0.20 0.05 0.05
SIK_11 0.20 0.05 0.20 0.20 0.05 0.05
SIK_15 0.05 0.05 0.20 0.20 0.20 0.05
SIK_18 0.05 0.05 0.05 0.05 0.05 0.05
SIK_19 N/A N/A N/A N/A N/A N/A
CTH_01 0.05 0.05 0.05 0.20 ns ns
CTH_03 0.05 0.05 0.05 0.05 0.05 0.05
CTH_04 0.05 0.05 0.05 ns ns 0.05
CTH_06 0.05 0.05 0.05 ns ns 0.05
CTH_07 0.05 0.05 0.05 0.05 0.05 0.05
CTH_10 0.05 0.05 0.05 0.05 0.05 0.05
CTH_12 0.05 0.05 0.05 0.20 ns ns
CTH_13 0.05 0.05 0.05 0.05 0.05 0.05
CTH_14 0.05 0.05 0.05 0.05 0.05 0.05
CTH_15 0.05 0.05 0.05 0.05 0.05 0.05
Sharpness - Triangle Test
With respect to sharpness both panels show the same significance, see Table 4.20. If
you look at each assessor differences can be found, see Table 4.21.
Table 4.20 Sharpness significance for the both panels.
Panel 1 & 4 2 & 4 3 & 4 1 & 3 1 & 2 2 & 3
SIK 0.001 0.001 0.001 0.001 0.001 0.001
CTH 0.001 0.001 0.001 0.001 0.001 0.001

CHALMERS, Civil and Environmental Engineering, Master’s Thesis 2011:15 32
Table 4.21 Sharpness significance for each assessor.
Code 1 & 4 2 & 4 3 & 4 1 & 3 1 & 2 2 & 3
SIK_03 0.05 0.05 0.20 0.05 0.20 0.05
SIK_04 0.05 0.05 0.20 0.05 ns 0.05
SIK_06 0.05 0.05 ns 0.05 0.05 0.05
SIK_07 0.05 0.05 ns 0.20 ns 0.05
SIK_10 0.05 0.05 0.05 0.05 0.05 0.05
SIK_11 0.05 0.05 0.20 0.05 0.05 0.05
SIK_15 0.05 0.05 ns 0.05 0.20 0.20
SIK_18 0.05 0.05 ns 0.05 0.20 0.05
SIK_19 N/A N/A N/A N/A N/A N/A
CTH_01 0.20 0.05 0.20 0.05 ns 0.05
CTH_03 0.05 0.05 ns 0.05 0.20 0.05
CTH_04 0.05 0.05 ns 0.05 0.05 0.05
CTH_06 0.05 0.05 0.05 0.05 0.05 0.05
CTH_07 0.05 0.05 ns 0.20 0.05 0.05
CTH_10 0.05 0.05 ns 0.05 0.05 0.05
CTH_12 0.20 0.05 ns ns ns ns
CTH_13 0.05 0.05 0.20 0.05 0.05 0.05
CTH_14 0.20 0.05 0.05 0.05 0.20 0.05
CTH_15 0.05 0.05 ns 0.05 0.05 0.05

CHALMERS, Civil and Environmental Engineering, Master’s Thesis 2011:15 33
5 Discussion In order to examine if the existing analytical sensory panel for taste/aroma at SIK also
could be used for listening tests with respect to PSQ a selection procedure was created
and implemented. The selection procedure uses a similar structure to other existing
selection processes in sensory analysis. What differ between this procedure and other
existing procedures are the exact contents in each part of the selection procedure.
Both the selection procedure and the assessors, both individually and as groups, will
be discussed in order to evaluate the selection procedure as well as the both panels.
In this work the questionnaire was mainly used in order to find out if the assessors had
a known hearing loss and if they had the possibility to take part in further testing. In
doing this it worked very well. As can be seen in Chapter 4 none of the assessors were
discarded due to a known hearing loss, although some assessors were discarded since
they had no possibility to take part in further testing.
Out of the 27 questionnaires sent out to the SIK assessors 22 were returned with
answers while only 15 out of approximately 125 questionnaires sent out were
answered by the CTH assessors. This makes an answer rate of over 80% for the SIK
panel and around 12%10
for the CTH panel. The big difference in the rate of answered
questionnaires is probably due to interest and motivation as well as some non working
e-mail addresses for assessors in the CTH panel. The SIK assessors show great
interest and motivation in their work as panellists while this is not really the case with
most of the CTH assessors. This might derive from the fact that the SIK assessors are
employed part-time working with sensory evaluation and the CTH assessors do this
more on a voluntary basis. However, the main conclusion drawn from the
questionnaires is that the SIK assessors have much more experience in the field of
sensory testing; all of them can be categorized as expert assessors with regard to at
least one sensory sensation. This is not the case for any of the CTH assessors, see
Table 4.2.
Due to economic matters and lack of extended expertise in the field of audiometry a
simpler audiometric test was used instead of letting the assessors undergo a
professional audiometric evaluation. However, the audiometric test used in general
showed a worse result for the SIK assessors as regards to the CTH assessors. This can
probably be originated from the average age difference between the two panels.
Among the assessors who carried out the audiometric test only a few of the SIK
assessors were rejected from further testing due to poor hearing. One might argue
about letting people with a deviation larger than 20 dB from normal hearing continue
in the selection procedure but since the test conditions was not ideal a slightly larger
deviation was accepted.
When it comes to the listening test the triangle test probably was a bit easier to
understand and perform if one has little or no previous experience from sensory
evaluation or similar activities. The triangle test also worked better with the software
used.
10 Including additional recruitment

CHALMERS, Civil and Environmental Engineering, Master’s Thesis 2011:15 34
The results in the listening test only show small differences between the two panels
and the most legible difference between the two panels is the time used for the
listening test; the average time used is roughly 40 minutes for the SIK panellists and
28 minutes for the CTH panellists. This means that the SIK panel will need
approximately 45% longer time into account to complete the test. This might be the
effect of the greater interest shown by the SIK assessors. When it comes to the
judgements there are no immense differences between the results obtained by the two
panels other than slightly better results in the two intensity tests (loudness and
fluctuation strength) by the SIK panel.

CHALMERS, Civil and Environmental Engineering, Master’s Thesis 2011:15 35
6 Conclusion The aim of this thesis was to investigate whether the existing analytical sensory panel
at SIK, which today mainly is used for the evaluation of taste, aroma and texture also
could be used in the evaluation of product sounds.
Since the number of assessors is limited it is hard to make a distinct conclusion about
one group being better than the other. However, the results obtained show that the
SIK panel can be used in a similar way as the CTH panel, i.e. as consumer panel.
The big differences are instead between the individual assessors. This indicates that
the ability in sensory evaluation with regard to hearing is individual and not connected
to the abilities with regard to the other senses. And as a consequence this would imply
that one should test assessors in the field of interest and not assume that great skills in
one sensory area means great skills in another. This implies that additional
recruitment needs be done if SIK would constitute an expert/analytical panel with
regard to hearing.
When it comes to the selection procedure the triangle tests were much easier to
understand and perform. Therefore triangle tests suits a screening test better. In order
to draw any further conclusions and to validate the selection procedure additional
testing needs to be done.

CHALMERS, Civil and Environmental Engineering, Master’s Thesis 2011:15 36
7 Future Work This thesis only discusses an approach to an assessor selection procedure and
additional work should be done in order to develop and validate the selection
procedure even further.
Additional recruitment need to be done if SIK would constitute an expert/analytical
panel with regard to hearing. Further the listening environment in the sensory lab also
needs to be improved in order to suit the task better.

CHALMERS, Civil and Environmental Engineering, Master’s Thesis 2011:15 37
References
[1] M. Bodden, "Psychoacoustics and Industry: Instrumentation versus
Experience?," Acta Acustica united with Acustica, vol. 85, pp. 604-607, 1999.
[2] S. Bech and N. Zacharov, Perceptual audio evaluation : theory, method and
application. Chichester, England: Wiley, 2006.
[3] R. H. Lyon, Designing for product sound quality. New York: Marcel Dekker,
2000.
[4] G. C. Jay, "Sound/Vibration Quality Engineering. Part 1 - Introduction and the
SVQ Engineering Process," in Sound and Vibration, 2007.
[5] J. Blauert and U. Jekosch, "Sound-Quality Evaluation A Multi-Layered
Problem," Acta Acustica united with Acustica, vol. 83, pp. 747-753, 1997.
[6] A. Sköld, Perceived character and quality of vehicle sound. Gothenburg:
Chalmers University of Technology, 2005.
[7] J. Blauert and U. Jekosch, "Concepts behind sound quality: Some basic
considerations," presented at the 32nd International Congress and Exposition
on Noise Control Engineering, Seogwipo, Korea, 2003.
[8] J. Blauert, Communication acoustics. Berlin: Springer, 2005.
[9] H. Fastl and E. Zwicker, Psychoacoustics : facts and models, 3rd. ed. Berlin:
Springer, 2007.
[10] D. Västfjäll, Affect as a Component of Perceived Sound and Vibration Quality
in Aircraft. Gothenburg: Chalmers University of Technology, 2003.
[11] D. I. Havelock, et al., Handbook of signal processing in acoustics. New York:
Springer, 2009.
[12] T. Cox. (2009, 13 oct.). Acoustics, Audio and Video - Sharpness. Available:
http://www.acoustics.salford.ac.uk/res/cox/sound_quality/index.php?content=s
harpness
[13] J. Yuan, et al., "An Application of Psychoacoustic Metrics to Improve Sound
Quality of Fission Air-Conditioning Unit," in Intelligent Robotics and
Applications. vol. 5315, C. Xiong, et al., Eds., ed: Springer Berlin /
Heidelberg, 2008, pp. 1183-1191.
[14] B. Lundgren, Handbok i sensorisk analys. Lindome: SIK, 1981.
[15] ISO 8586-2 Sensory analysis - general guidance for the selection, training and
monitoring of assessors - Part 2: experts, 1994.
[16] ISO 8586-1 Sensory analysis - General guidance for the selection, training
and monitoring of assessors - Part 1: Selected assessors, 1993.
[17] NT acou 111 - Acoustics: Human sound perception - guidelines for listening
tests, 2002.

CHALMERS, Civil and Environmental Engineering, Master’s Thesis 2011:15 38
[18] S. Bech, "Selection and training of subjects for listening tests on sound-
reproducing equipment," Journal of the Audio Engineering Society, vol. 40,
pp. pp. 590-610, 1992.
[19] J. Trost and O. Hultåker, Enkätboken. Lund: Studentlitteratur, 2007.
[20] B. Almqvist and SAME, Handbok i hörselmätning. Solna: Lic Förlag, 1990.
[21] M. Meilgaard, et al., Sensory Evaluation Techniques, 3rd ed. Boca Raton:
CRC Press, 1999.

CHALMERS, Civil and Environmental Engineering, Master’s Thesis 2011:15 39
Appendix A - Test Environment and Equipment
Location: Sensory lab in accordance to ISO 8589-1998
1: PC with Fizz sensory software version 2.45A
2: Sennheiser HD 202 headphones
12 9 6 3
11 8 5 2
10 7 4 1
Figure. Schematic overwiev of the sensory lab at SIK.

CHALMERS, Civil and Environmental Engineering, Master’s Thesis 2011:15 40
Appendix B – Questionnaire SIK

CHALMERS, Civil and Environmental Engineering, Master’s Thesis 2011:15 41

CHALMERS, Civil and Environmental Engineering, Master’s Thesis 2011:15 42

CHALMERS, Civil and Environmental Engineering, Master’s Thesis 2011:15 43

CHALMERS, Civil and Environmental Engineering, Master’s Thesis 2011:15 44
Appendix C- Questionnaire CTH

CHALMERS, Civil and Environmental Engineering, Master’s Thesis 2011:15 45
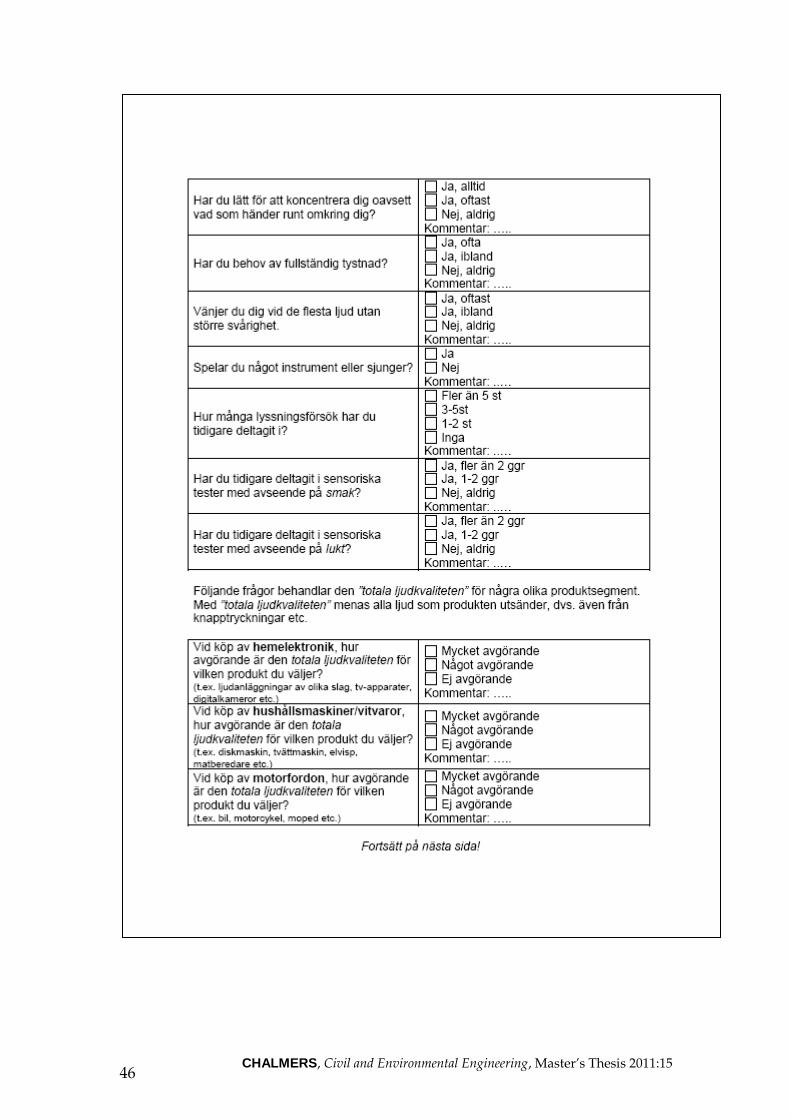
CHALMERS, Civil and Environmental Engineering, Master’s Thesis 2011:15 46

CHALMERS, Civil and Environmental Engineering, Master’s Thesis 2011:15 47

CHALMERS, Civil and Environmental Engineering, Master’s Thesis 2011:15 48
Appendix D – Questionnaire Answers
Kod Kön Födelseår
Har du
svenska
som
modersmål?
Vad är din
huvudsakliga
sysselsättning?
Vilken hörselnivå anser
du att du har?
Har du tidigare
haft problem med
hörseln?
Har du nu eller tidigare
haft problem med
synen?
SIK_01 Kvinna 1979 Ja Arbete/Studier Normal Nej Nej*
SIK_02 Kvinna 1960 Ja Arbete Normal Nej N/A
SIK_03 Kvinna 1951 Ja Annat Normal Nej Nej
SIK_04 Kvinna 1962 Ja Annat Normal Nej Nej
SIK_05 Man 1952 Ja Annat Över normal Nej Nej
SIK_06 Man 1960 Ja Arbete Normal Nej Ja, nu*
SIK_07 Kvinna 1968 Ja Arbete Normal Ja* Nej
SIK_08 Kvinna 1957 Ja Arbete Normal Nej Nej
SIK_09 Man 1960 Ja Arbete Normal Nej Nej
SIK_10 Kvinna 1961 Ja Arbete Normal Nej* Nej
SIK_11 Kvinna 1968 Ja Annat Över normal Nej Nej
SIK_12 Kvinna 1938 Ja Annat Under normal* Nej Nej
SIK_13 Man 1956 Ja Arbete Under normal Ja* Nej
SIK_14 Kvinna 1964 Ja Arbete Normal Nej Nej
SIK_15 Kvinna 1965 Nej* Arbete Normal Nej Nej
SIK_16 N/A N/A N/A N/A N/A N/A N/A
SIK_17 Kvinna 1948 Ja Arbete Normal/Under normal* Nej* Nej
SIK_18 Kvinna 1962 Ja Arbete Normal Nej Nej
SIK_19 Kvinna 1947 Ja Arbete/Annat Normal Nej Nej
SIK_20 Kvinna 1969 Ja Arbete Normal* Nej Nej
SIK_21 Kvinna 1952 Nej* Arbete Över normal Nej Nej
SIK_22 Man 1972 Ja Arbete Över normal Nej N/A
SIK_23 Kvinna 1977 Ja Annat Över normal* Nej Nej
CTH_01 Man 1985 Ja Studier Normal Nej Nej
CTH_02 Kvinna 1983 Ja Annat Normal Nej Nej
CTH_03 Kvinna 1983 Ja Arbete/Studier Normal Nej Nej
CTH_04 Man 1964 Ja Annat Normal Nej Nej
CTH_05 Man 1981 Ja Studier Normal Nej Nej
CTH_06 Man 1981 Ja/Nej* Annat Under normal Nej Nej
CTH_07 Kvinna 1973 Ja Arbete Normal Nej Nej
CTH_08 Kvinna 1968 Ja Studier Normal Nej Nej
CTH_09 Kvinna 1982 Nej Arbete Normal Ja* Nej
CTH_10 Kvinna 1984 Ja Studier Normal Nej Nej*
CTH_11 Kvinna 1988 Ja Studier Normal Nej Ja, nu*
CTH_12 Kvinna 1984 Ja Studier Normal Nej Nej
CTH_13 Man 1984 Ja Studier Normal Nej Nej
CTH_14 Kvinna 1983 Ja Arbete Normal Nej Ja, nu*
CTH_15 Kvinna 1984 Ja Studier Normal Nej Nej
* Answer had additional comments to it.

CHALMERS, Civil and Environmental Engineering, Master’s Thesis 2011:15 49
Kod
Är du särskilt
uppmärksam
på ljud i din
omgivning?
Störs du
av ljud
inomhus i
din
vardag?
Störs du
av ljud
utomhus i
din
vardag?
Störs du av
ljudet från
produkter som
någon i din
närhet
använder?
Har du lätt för
att koncentrera
dig oavsett vad
som händer runt
omkring dig?
Har du
behov av
fullständig
tystnad?
Vänjer du dig
vid de flesta
ljud utan
större
svårigheter?
Spelar du
något
instrument
eller
sjunger?
SIK_01 Ja* Ja, ibland Ja, ibland Ja, ibland Ja, oftast Ja, ofta Ja, ibland Nej
SIK_02 Nej Ja, ibland* Ja, ibland* Nej, aldrig Ja, alltid Nej, aldrig Ja, oftast Nej
SIK_03 Nej Nej, aldrig Nej, aldrig Nej, aldrig Ja, oftast Nej, aldrig Ja, oftast Nej
SIK_04 Ja Nej, aldrig Nej, aldrig Ja, ibland Ja, oftast Ja, ibland Ja, oftast Nej
SIK_05 Ja* Ja, ibland* Ja, ibland* Ja, ibland* Ja, oftast Nej, aldrig Ja, oftast Ja
SIK_06 Nej Ja, ibland* Ja, ibland* Ja, ibland Ja, oftast Nej, aldrig* Ja, ibland Nej*
SIK_07 Ja* Ja, ibland* Ja, ibland* Nej, aldrig Ja, oftast Ja, ibland Ja, ibland* Nej
SIK_08 Ja Ja, ibland* Ja, ibland* Ja, ibland Ja, alltid Nej, aldrig Ja, oftast Nej
SIK_09 Ja* Ja, ofta* Ja, ibland* Ja, ibland* Nej, aldrig Ja, ofta Ja, ibland Ja*
SIK_10 Ja Ja, ofta* Nej, aldrig Ja, ibland* Nej, aldrig* Ja, ibland* Ja, ibland Nej
SIK_11 Ja Ja, ibland* Ja, ibland* Ja, ibland* Ja, oftast* Nej, aldrig* Ja, ibland Ja
SIK_12 Ja Ja, ibland* Ja, ibland* Ja, ibland Ja, oftast Ja, ibland Ja, ibland Nej*
SIK_13 Nej Nej, aldrig Ja, ibland* Nej, aldrig Ja, alltid Nej, aldrig Ja, oftast Ja*
SIK_14 Nej Ja, ibland* Ja, ibland* Nej, aldrig Ja, alltid Nej, aldrig Ja, oftast Nej
SIK_15 Ja Ja, ibland* Ja, ibland* Ja, ibland Ja, alltid Ja, ibland Ja, oftast Nej
SIK_16 N/A N/A N/A N/A N/A N/A N/A N/A
SIK_17 Nej* Nej, aldrig N/A Ja, ibland ja, oftast Ja, ofta Ja, ibland Nej
SIK_18 Nej* Ja, ibland* Ja, ibland* Ja, ibland* Ja, oftast Ja, ibland Ja, oftast Nej
SIK_19 Nej Nej, aldrig Nej, aldrig Nej, aldrig Ja, alltid/Ja, oftast Ja, ibland Ja, oftast Ja*
SIK_20 Ja* Ja, ofta* Ja, ibland* Ja, ibland* Nej, aldrig* Ja, ofta Nej, aldrig* Nej
SIK_21 Ja Nej, aldrig Nej, aldrig Nej, aldrig Nej, aldrig Nej, aldrig Ja, oftast Nej
SIK_22 Ja Ja, ofta* Nej, aldrig Ja, ibland* Ja, oftast Nej, aldrig Ja, oftast Ja
SIK_23 Ja* Ja, ibland* Ja, ibland* Ja, ibland Nej, aldrig* Ja, ibland* Ja, ibland* Nej
CTH_01 Nej Ja, ibland Ja, ibland Ja, ibland Ja, oftast Nej, aldrig Ja, ibland Nej*
CTH_02 Ja Ja, ofta Ja, ibland Ja, ofta Ja, oftast Ja, ibland Ja, ibland Nej
CTH_03 Ja* Ja, ibland* Nej, aldrig Ja, ibland Ja, oftast Nej, aldrig* Ja, oftast Ja
CTH_04 Ja Ja, ibland Ja, ibland Nej, aldrig Nej, aldrig Ja, ibland Ja, oftast Nej
CTH_05 Ja Nej, aldrig Nej, aldrig Ja, ibland Ja, oftast Nej, aldrig Ja, oftast/Ja,
ibland* Nej
CTH_06 Ja Ja, ibland Ja, ibland Nej, aldrig Nej, aldrig Nej, aldrig Ja, oftast Nej
CTH_07 Ja N/A Nej, aldrig Nej, aldrig Ja, oftast Nej, aldrig Ja, oftast Ja
CTH_08 Ja Ja, ibland Ja, ibland Ja, ibland Ja, oftast Nej, aldrig Ja, ibland Ja
CTH_09 Nej Ja, ibland Ja, ibland Ja, ibland Nej, aldrig Ja, ofta Ja, ibland Ja*
CTH_10 Ja* Nej,
aldrig*
Nej,
aldrig* Nej, aldrig* Ja, oftast* Nej, aldrig Ja, oftast Nej*
CTH_11 Nej Nej, aldrig Nej, aldrig Nej, aldrig Ja, oftast Nej, aldrig Ja, oftast Nej
CTH_12 Nej Ja, ibland* Ja, ibland* Ja, ibland* Ja, oftast* Ja, ibland* Ja, ibland* Ja*
CTH_13 Ja Ja, ibland* Ja, ibland* Ja, ibland* Ja, oftast Ja, ibland Ja, ibland Nej
CTH_14 Ja Ja, ibland Ja, ibland Ja, ibland Ja, oftast Ja, ibland Ja, oftast Ja
CTH_15 Nej Nej, aldrig Ja, ibland Ja, ibland Ja, oftast Ja, ibland Ja, oftast Ja*
* Answer had additional comments to it.

CHALMERS, Civil and Environmental Engineering, Master’s Thesis 2011:15 50
Kod
Har du tidigare deltagit i
sensoriska tester med
avseende på hörsel?
Hur många
lyssningsförsök har du
tidigare deltagit i?
Har du tidigare deltagit i
sensoriska tester med
avseende på smak?
Har du tidigare deltagit i
sensoriska tester med
avseende på lukt?
SIK_01 Nej, aldrig
SIK_02 Nej, aldrig
SIK_03 Nej, aldrig
SIK_04 Nej, aldrig
SIK_05 Ja, 1-2 ggr*
SIK_06 Nej, aldrig
SIK_07 Nej, aldrig
SIK_08 Nej, aldrig
SIK_09 Nej, aldrig
SIK_10 Nej, aldrig
SIK_11 Nej, aldrig
SIK_12 Nej, aldrig
SIK_13 Nej, aldrig
SIK_14 Nej, aldrig
SIK_15 Nej, aldrig
SIK_16 N/A
SIK_17 Nej, aldrig
SIK_18 Nej, aldrig
SIK_19 Nej, aldrig
SIK_20 Nej, aldrig
SIK_21 Nej, aldrig
SIK_22 Ja, 1-2 ggr
SIK_23 Nej, aldrig
CTH_01 Fler än 5 st Nej, aldrig Nej, aldrig
CTH_02 3-5st Nej, aldrig Nej, aldrig
CTH_03 Fler än 5 st Nej, aldrig Nej, aldrig
CTH_04 3-5st Ja, 1-2 ggr Ja, 1-2 ggr
CTH_05 3-5st Ja, 1-2 ggr Nej, aldrig
CTH_06 3-5st Nej, aldrig Nej, aldrig
CTH_07 Fler än 5 st Nej, aldrig Ja, 1-2 ggr
CTH_08 Fler än 5 st Nej, aldrig Nej, aldrig
CTH_09 Fler än 5 st Nej, aldrig Nej, aldrig
CTH_10 3-5st Nej, aldrig* Nej, aldrig*
CTH_11 Inga Nej, aldrig Nej, aldrig
CTH_12 Inga Nej, aldrig Nej, aldrig
CTH_13 Inga Ja, fler än 2 ggr Nej, aldrig
CTH_14 Fler än 5 st Nej, aldrig Nej, aldrig
CTH_15 Inga Ja, fler än 2 ggr* Nej, aldrig
* Answer had additional comments to it.

CHALMERS, Civil and Environmental Engineering, Master’s Thesis 2011:15 51
Kod
Vid köp av hemelektronik, hur
avgörande är den totala
ljudkvaliteten för vilken
produkt du väljer?
Vid köp av
hushållsmaskiner/vitvaror, hur
avgörande är den totala
ljudkvaliteten för vilken produkt
du väljer?
Vid köp av motorfordon, hur
avgörande är den totala
ljudkvaliteten för vilken
produkt du väljer?
SIK_01 Något avgörande Något avgörande Något avgörande
SIK_02 Mycket avgörande Mycket avgörande Något avgörande
SIK_03 Mycket avgörande Mycket avgörande Mycket avgörande
SIK_04 Något avgörande Mycket avgörande Ej avgörande
SIK_05 Något avgörande Mycket avgörande Mycket avgörande
SIK_06 Ej avgörande Mycket avgörande Ej avgörande
SIK_07 Något avgörande Något avgörande Något avgörande
SIK_08 Mycket avgörande Mycket avgörande Något avgörande
SIK_09 Något avgörande* Något avgörande Ej avgörande
SIK_10 Ej avgörande* Ej avgörande Ej avgörande
SIK_11 Mycket avgörande Mycket avgörande Mycket avgörande
SIK_12 Något avgörande Mycket avgörande Mycket avgörande
SIK_13 Ej avgörande Något avgörande Ej avgörande*
SIK_14 Ej avgörande Något avgörande Ej avgörande*
SIK_15 Något avgörande Något avgörande Något avgörande
SIK_16 N/A N/A N/A
SIK_17 Ej avgörande Ej avgörande Ej avgörande
SIK_18 Ej avgörande Ej avgörande Ej avgörande
SIK_19 Något avgörande Mycket avgörande N/A
SIK_20 Något avgörande Något avgörande* Något avgörande*
SIK_21 Mycket avgörande Mycket avgörande Något avgörande
SIK_22 Mycket avgörande Ej avgörande Mycket avgörande
SIK_23 Ej avgörande* Något avgörande* Ej avgörande*
CTH_01 Något avgörande Något avgörande Något avgörande
CTH_02 Något avgörande Något avgörande Mycket avgörande
CTH_03 Mycket avgörande Något avgörande Något avgörande
CTH_04 Mycket avgörande Något avgörande Ej avgörande
CTH_05 Något avgörande Ej avgörande Ej avgörande
CTH_06 Något avgörande Något avgörande Något avgörande/Ej avgörande
CTH_07 Mycket avgörande Något avgörande Något avgörande
CTH_08 Något avgörande Ej avgörande Ej avgörande
CTH_09 Ej avgörande Något avgörande Ej avgörande
CTH_10 Mycket avgörande* Mycket avgörande* Något avgörande*
CTH_11 Något avgörande Något avgörande Något avgörande
CTH_12 Ej avgörande* Ej avgörande* Ej avgörande*
CTH_13 Mycket avgörande Mycket avgörande Mycket avgörande
CTH_14 Något avgörande Något avgörande Något avgörande
CTH_15 Något avgörande Något avgörande Något avgörande
* Answer had additional comments to it.

CHALMERS, Civil and Environmental Engineering, Master’s Thesis 2011:15 52
Appendix E – Audiometric Test Results
Assessor
125Hz 250Hz 500Hz 750Hz 1000Hz 1500Hz 2000Hz 3000Hz 4000Hz 6000Hz 8000Hz Mean:
V H V H V H V H V H V H V H V H V H V H V H 125-8000Hz
SIK_01 20 25 20 20 20 20 20 20 20 20 20 20 20 20 20 20 20 20 20 20 20 20 20,23
SIK_02 20 20 20 20 20 20 20 20 25 20 20 20 20 20 25 25 25 20 30 20 20 20 21,36
SIK_03 20 20 20 20 20 20 20 20 20 20 20 20 20 20 20 20 20 20 20 25 20 20 20,23
SIK_04 20 20 20 20 20 20 20 20 20 20 20 20 20 20 20 20 20 20 20 20 20 20 20,00
SIK_05 20 20 20 20 20 20 20 20 30 20 25 25 35 20 30 25 25 20 25 20 60 35 25,23
SIK_06 20 20 20 20 20 20 20 20 20 20 20 20 20 20 20 25 20 40 20 20 20 20 21,14
SIK_07 20 20 20 20 20 20 20 20 20 20 20 20 20 20 20 20 20 20 25 25 25 20 20,68
SIK_08 25 20 20 20 20 20 20 20 20 20 20 25 20 20 20 20 40 20 60 60 70 30 27,73
SIK_09 20 20 20 20 20 20 20 20 20 20 20 20 20 20 25 20 30 20 25 20 35 20 21,59
SIK_10 20 20 20 20 20 20 20 20 20 20 20 20 20 20 20 20 20 20 25 20 20 20 20,23
SIK_11 20 20 20 20 20 25 20 20 20 20 20 20 20 20 20 20 20 20 20 25 20 35 21,14
SIK_12 35 40 25 35 25 30 20 30 25 45 25 40 20 40 35 30 25 35 20 50 25 45 31,82
SIK_13 20 20 20 20 20 20 20 25 30 20 35 20 20 20 30 25 40 25 20 25 20 30 23,86
SIK_14 20 20 20 20 20 20 20 20 20 20 20 20 20 20 20 20 20 30 20 30 20 20 20,91
SIK_15 20 20 20 25 20 20 20 20 20 20 20 20 20 20 20 20 20 20 20 20 20 20 20,23
SIK_16 25 20 40 20 30 20 20 20 20 20 20 20 20 20 20 20 35 30 25 25 20 35 23,86
SIK_17 30 25 25 30 25 25 25 30 35 30 20 30 30 25 25 25 30 20 30 20 25 20 26,36
SIK_18 20 20 20 20 20 20 20 20 20 20 20 30 20 20 25 20 20 20 20 30 20 20 21,14
SIK_19 20 20 20 20 20 20 20 20 20 20 25 20 25 20 20 20 20 20 20 25 20 30 21,14
CTH_01 20* 20* 20* 20* 20* 20* 20* 20* 20* 20* 20* 20* 20* 20* 20* 20* 20* 20* 20* 20* 20* 20* 20,00*
CTH_03 20 20 20 20 20 20 20 20 20 20 20 20 20 20 20 20 20 20 20 25 20 20 20,23
CTH_04 20* 20* 20* 20* 20* 20* 20* 20* 20* 20* 20* 20* 20* 20* 20* 20* 20* 20* 20* 20* 20* 20* 20,00*
CTH_06 20 20 20 20 20 20 20 20 20 20 20 20 20 20 20 20 20 20 20 20 20 20 20,00
CTH_07 20* 20* 20* 20* 20* 20* 20* 20* 20* 20* 20* 20* 20* 20* 20* 20* 20* 20* 20* 20* 20* 20* 20,00*
CTH_10 20 20 20 20 20 20 20 20 20 20 20 20 20 20 20 20 20 20 25 20 20 20 20,23
CTH_12 20 20 20 20 20 25 20 20 20 20 20 20 20 20 20 20 20 20 30 20 20 20 20,68
CTH_13 20 20 20 20 25 20 20 20 20 20 20 20 20 20 20 20 20 20 20 20 20 20 20,23
CTH_14 20 20 20 20 20 20 20 20 20 20 20 20 20 20 20 20 20 20 20 20 20 20 20,00
CTH_15 20 20 25 25 25 20 20 20 20 20 20 20 25 20 25 20 25 20 20 20 20 20 21,36

CHALMERS, Civil and Environmental Engineering, Master’s Thesis 2011:15 53
Appendix F – Listening Test
i : Welcome page
ii : Instructions

CHALMERS, Civil and Environmental Engineering, Master’s Thesis 2011:15 54
iii : Instructions Part I
iv : Judgement Part I, repeated 24 times

CHALMERS, Civil and Environmental Engineering, Master’s Thesis 2011:15 55
v : End of Part I
vi : Instructions Part II

CHALMERS, Civil and Environmental Engineering, Master’s Thesis 2011:15 56
vii : Judgement Part II, repeated 15 times
viii : End of Part II and Block I

CHALMERS, Civil and Environmental Engineering, Master’s Thesis 2011:15 57
ix : Instructions Part III
x : Judgement Part III, repeated 24 times

CHALMERS, Civil and Environmental Engineering, Master’s Thesis 2011:15 58
xi : End of Part III
xii : Instructions Part IV

CHALMERS, Civil and Environmental Engineering, Master’s Thesis 2011:15 59
xiii : Judgement Part IV, repeated 15 times
xiv : End of Part IV and Block II

CHALMERS, Civil and Environmental Engineering, Master’s Thesis 2011:15 60
xv : Instructions Part V
xvi : Judgement Part V, repeated 24 times

CHALMERS, Civil and Environmental Engineering, Master’s Thesis 2011:15 61
xvii : End Part V
xviii : Instructions Part VI

CHALMERS, Civil and Environmental Engineering, Master’s Thesis 2011:15 62
xix : Judgement Part VI, repeated 24 times
xx : End Part VI

CHALMERS, Civil and Environmental Engineering, Master’s Thesis 2011:15 63
xxi : Instructions Part VII
xxii : Judgement Part VII, repeated 24 times

CHALMERS, Civil and Environmental Engineering, Master’s Thesis 2011:15 64
xxiii : End of Part VII, Block III and listening test

CHALMERS, Civil and Environmental Engineering, Master’s Thesis 2011:15 65
Appendix G – Presentation Order
Triangle Sound Pair Part I, III and V Sound Pair Part VI and VII
1 1 & 4 2 & 4
2 1 & 4 1 & 4
3 2 & 4 2 & 4
4 1 & 4 3 & 4
5 2 & 4 1 & 4
6 3 & 4 2 & 4
7 2 & 4 3 & 4
8 3 & 4 1 & 3
9 1 & 3 2 & 4
10 3 & 4 3 & 4
11 1 & 3 1 & 3
12 1 & 3 1 & 2
13 1 & 2 3 & 4
14 1 & 3 1 & 3
15 1 & 2 1 & 2
16 1 & 3 2 & 3
17 1 & 2 1 & 3
18 2 & 3 1 & 2
19 1 & 2 2 & 3
20 2 & 3 1 & 4
21 1 & 2 1 & 2
22 2 & 3 2 & 3
23 2 & 3 1 & 4
24 2 & 3 2 & 3

CHALMERS, Civil and Environmental Engineering, Master’s Thesis 2011:15 66
Appendix H – Results Screening Test
Table 7.1 Results Block I Part I - Loudness
Code T:1 T:2 T:4 T:3 T:5 T:7 T:6 T:8 T:10 T:9 T:11 T:12 T:14 T:16 T:13 T:15 T:17 T:19 T:21 T:18 T:20 T:22 T:23 T:24
SIK_03 1 1 1 1 1 1 1 1 1 1 1 1 1 1 1 1 0 1 1 1 1 1 1 0
SIK_04 1 1 1 1 1 1 1 1 1 1 1 0 1 1 1 1 1 1 1 0 0 1 0 0
SIK_06 1 1 1 1 1 1 1 1 1 1 1 1 1 1 1 1 1 1 1 1 1 1 1 1
SIK_07 1 1 1 1 1 1 1 1 1 1 1 1 1 1 0 0 1 1 1 1 1 1 0 1
SIK_10 1 1 1 1 1 1 1 1 1 1 1 1 1 1 1 1 1 1 1 1 1 1 1 1
SIK_11 1 1 1 1 1 1 1 1 1 1 1 1 1 1 1 1 1 1 1 0 0 0 1 1
SIK_15 1 1 1 1 1 1 1 1 1 1 1 1 1 1 1 1 1 1 1 0 0 1 1 0
SIK_18 1 1 1 1 1 1 1 1 1 1 1 1 1 1 1 1 1 1 1 1 1 1 1 1
SIK_19 1 1 1 1 1 1 1 1 1 1 1 1 1 1 1 1 1 1 1 1 1 1 1 1
CTH_01 1 1 1 1 1 1 1 1 1 1 1 1 0 1 1 1 1 1 1 1 1 0 0 0
CTH_03 1 1 1 1 1 1 1 1 1 1 1 1 1 1 1 1 1 1 0 1 0 0 0 0
CTH_04 1 0 1 1 1 1 1 1 1 1 0 1 1 1 1 1 1 0 1 1 0 0 1 0
CTH_06 1 1 1 1 1 1 1 1 1 1 1 1 1 1 1 1 1 1 1 1 1 1 1 1
CTH_07 1 1 1 1 1 1 1 1 1 1 1 1 1 1 1 1 1 1 1 0 1 1 0 1
CTH_10 1 1 1 1 1 1 1 1 1 1 1 0 1 1 1 0 0 1 1 0 1 1 1 0
CTH_12 1 1 1 1 1 1 1 1 1 1 1 1 1 1 1 1 1 0 1 1 0 1 1 1
CTH_13 1 1 1 1 0 1 1 1 1 1 1 1 1 1 1 1 1 1 1 1 1 1 1 1
CTH_14 1 1 1 1 1 1 1 1 1 1 1 1 1 1 1 1 1 1 1 1 1 1 1 1
CTH_15 1 1 1 1 0 1 1 1 1 1 1 1 1 1 1 1 1 1 1 1 1 1 1 0

CHALMERS, Civil and Environmental Engineering, Master’s Thesis 2011:15 67
Table 7.2 Results Block I Part II - Loudness
Code Sound 1 Sound 2 Sound 3 Sound 4 Sound 5
SIK_03 90 74 90 86 68 79 87 70 89 24 19 34 9 10 19
SIK_04 77 72 76 49 49 60 73 69 53 45 52 26 17 19 16
SIK_06 77 72 71 75 56 51 23 18 45 14 17 15 10 10 11
SIK_07 82 85 86 66 80 52 36 29 68 14 13 11 3 8 6
SIK_10 90 90 86 23 51 37 38 32 21 11 10 10 10 9 10
SIK_11 90 90 90 54 44 44 16 44 62 10 16 10 10 10 10
SIK_15 88 88 88 86 87 87 88 87 87 25 15 14 14 14 12
SIK_18 97 95 99 90 97 84 80 66 81 25 49 35 10 17 10
SIK_19 75 72 90 71 72 74 59 48 49 25 30 37 11 10 12
CTH_01 62 55 75 66 78 82 78 62 86 50 47 28 11 28 10
CTH_03 89 89 89 83 87 85 63 67 69 33 27 16 11 11 11
CTH_04 90 90 85 68 52 57 49 29 47 15 15 13 12 10 10
CTH_06 88 74 90 68 72 80 65 59 46 37 21 20 10 20 9
CTH_07 83 80 85 76 79 72 72 68 63 28 31 12 18 29 11
CTH_10 80 72 87 61 60 72 79 86 84 80 51 70 52 57 52
CTH_12 84 87 75 54 51 69 52 60 38 17 20 28 15 15 12
CTH_13 90 90 82 46 61 48 85 77 83 25 30 18 11 20 11
CTH_14 88 90 90 79 82 85 82 76 61 37 54 10 11 14 10
CTH_15 84 82 86 71 66 83 65 68 78 50 50 31 14 27 15

CHALMERS, Civil and Environmental Engineering, Master’s Thesis 2011:15 68
Table 7.3 Block II Part III – Fluctuation Strength
Code T:1 T:2 T:4 T:3 T:5 T:7 T:6 T:8 T:10 T:9 T:11 T:12 T:14 T:16 T:13 T:15 T:17 T:19 T:21 T:18 T:20 T:22 T:23 T:24
SIK_03 1 1 1 1 1 1 1 1 1 1 1 1 1 1 1 1 1 1 1 1 0 1 1 1
SIK_04 1 1 1 1 1 1 1 1 1 1 1 1 1 1 1 1 1 1 1 0 0 1 1 1
SIK_06 1 1 1 1 1 1 1 1 1 1 1 1 1 1 1 1 1 1 1 1 1 1 1 1
SIK_07 1 1 1 1 1 1 1 1 1 1 1 1 1 1 1 1 1 1 1 1 1 1 1 0
SIK_10 1 1 1 1 1 1 1 1 1 1 1 1 1 1 1 0 1 1 1 1 1 0 0 1
SIK_11 1 1 1 1 1 1 1 1 1 1 1 1 1 1 1 1 1 1 1 0 1 1 1 1
SIK_15 1 1 1 1 1 1 1 1 1 1 1 1 1 1 1 1 0 1 1 1 1 1 0 1
SIK_18 1 1 1 1 1 1 1 1 1 1 1 1 1 1 1 1 1 1 1 1 1 1 0 1
SIK_19 1 1 1 1 1 1 1 1 1 1 1 1 1 1 1 1 1 1 1 1 1 1 1 1
CTH_01 1 1 1 1 1 1 1 1 1 1 1 1 1 1 0 1 1 1 1 1 1 0 1 0
CTH_03 1 1 1 1 1 1 1 1 1 1 1 1 1 1 1 1 1 1 1 1 1 1 1 1
CTH_04 1 1 1 1 1 1 1 1 1 1 1 1 1 1 1 1 1 1 1 1 1 1 1 0
CTH_06 1 1 1 1 1 1 1 1 1 1 1 1 1 1 1 1 1 1 1 1 1 1 1 1
CTH_07 1 1 1 1 1 1 1 1 1 1 1 1 1 1 1 1 1 1 1 1 1 1 1 1
CTH_10 1 1 1 1 1 1 1 1 1 1 1 1 1 1 1 1 1 1 1 1 1 1 1 1
CTH_12 1 1 1 1 1 1 1 1 1 1 1 1 1 1 1 1 1 1 1 1 0 0 1 0
CTH_13 1 1 1 1 1 1 1 1 1 1 1 1 1 1 1 1 1 1 1 1 1 1 1 1
CTH_14 1 1 1 1 1 1 1 1 1 1 1 1 1 1 1 1 1 1 1 1 1 1 1 1
CTH_15 1 1 1 1 1 1 1 1 1 1 1 1 1 1 1 1 1 1 1 1 1 1 1 1

CHALMERS, Civil and Environmental Engineering, Master’s Thesis 2011:15 69
Table 7.4 Block II Part IV – Fluctuation Strength
Code Sound 1 Sound 2 Sound 3 Sound 4 Sound 5
SIK_03 10 10 23 17 25 29 33 26 56 77 82 90 90 90 90
SIK_04 21 25 21 28 35 39 57 66 34 69 67 63 75 82 84
SIK_06 11 13 12 40 48 48 47 35 47 50 44 60 90 88 90
SIK_07 10 8 6 22 11 17 26 46 46 71 69 73 95 81 98
SIK_10 13 13 15 12 11 15 18 10 11 72 86 86 91 90 93
SIK_11 34 10 19 47 12 16 44 19 14 90 77 87 90 90 85
SIK_15 14 15 15 14 15 14 13 15 14 21 15 12 85 83 81
SIK_18 10 5 2 20 21 10 49 35 31 21 66 74 90 90 90
SIK_19 25 26 11 22 26 20 34 26 51 90 85 80 90 91 90
CTH_01 10 23 59 52 17 22 40 18 23 30 42 34 90 87 91
CTH_03 11 11 10 22 31 39 36 20 28 59 54 47 88 89 88
CTH_04 49 35 38 36 45 25 43 38 32 38 77 40 83 84 86
CTH_06 10 10 13 42 13 25 31 35 29 60 57 80 90 90 89
CTH_07 11 20 20 29 36 36 40 48 46 58 54 54 79 82 69
CTH_10 19 25 24 74 79 65 73 74 66 76 88 83 80 82 89
CTH_12 12 13 14 16 16 12 17 13 30 49 63 57 76 82 87
CTH_13 17 11 12 21 24 16 23 37 49 79 74 57 90 89 89
CTH_14 23 16 16 33 29 17 30 48 48 74 71 68 90 89 86
CTH_15 13 15 24 41 33 31 37 24 28 69 64 71 90 90 89

CHALMERS, Civil and Environmental Engineering, Master’s Thesis 2011:15 70
Table 7.5 Block III Part V – Roughness
Code T:1 T:2 T:4 T:3 T:5 T:7 T:6 T:8 T:10 T:9 T:11 T:12 T:14 T:16 T:13 T:15 T:17 T:19 T:21 T:18 T:20 T:22 T:23 T:24
SIK_03 1 1 1 1 1 1 1 1 1 1 1 1 1 1 1 1 1 1 1 1 1 1 1 1
SIK_04 1 1 1 1 1 1 1 1 1 1 1 1 1 1 1 1 1 1 1 0 0 1 1 1
SIK_06 1 1 1 1 1 1 1 1 1 1 1 1 1 1 1 1 1 1 1 1 1 1 1 1
SIK_07 1 1 1 1 1 1 1 1 1 1 1 1 1 1 1 1 1 1 1 0 1 1 0 1
SIK_10 1 1 1 1 1 1 1 1 1 1 1 1 1 1 1 1 1 1 1 1 0 0 1 1
SIK_11 1 1 1 1 1 1 1 1 1 1 1 1 1 1 1 1 1 0 1 0 1 1 0 1
SIK_15 1 1 1 1 1 1 0 1 0 0 1 1 1 1 1 0 0 0 1 1 0 1 1 1
SIK_18 1 1 1 1 1 1 1 1 1 1 1 1 1 1 1 1 1 1 1 1 1 1 1 1
SIK_19 - - - - - - - - - - - - - - - - - - - - - - - -
CTH_01 1 1 1 1 1 1 1 1 1 1 1 1 1 1 1 1 1 1 1 1 1 0 1 1
CTH_03 1 1 1 1 1 1 1 1 1 1 1 1 1 1 1 1 1 1 1 0 0 1 1 1
CTH_04 1 1 1 1 1 1 1 1 1 1 1 1 1 1 1 1 0 1 1 1 1 1 1 1
CTH_06 1 1 1 1 1 1 1 1 1 1 1 1 1 1 1 1 1 1 1 0 0 0 0 1
CTH_07 1 1 1 1 1 1 1 1 1 1 1 1 1 1 1 1 1 1 1 1 1 1 1 1
CTH_10 1 1 1 1 1 1 1 1 1 1 1 1 1 1 1 1 1 1 1 1 0 0 1 0
CTH_12 1 1 1 1 1 1 1 0 1 1 1 1 1 1 1 1 1 1 1 1 1 1 1 1
CTH_13 1 1 1 1 1 1 1 1 1 1 1 1 1 1 1 1 1 1 1 1 1 1 1 1
CTH_14 1 1 1 1 1 1 1 1 1 1 1 1 1 1 1 1 1 1 1 1 1 0 1 1
CTH_15 1 1 1 1 1 1 1 1 1 1 1 1 1 1 1 1 1 1 1 1 1 1 1 1

CHALMERS, Civil and Environmental Engineering, Master’s Thesis 2011:15 71
Table 7.6 Block III Part VI – Tonality
Code T:1 T:3 T:6 T:9 T:2 T:5 T:20 T:23 T:4 T:7 T:10 T:13 T:8 T:11 T:14 T:17 T:12 T:15 T:18 T:21 T:16 T:19 T:22 T:24
SIK_03 1 1 1 1 1 1 1 1 1 1 1 1 1 1 1 1 1 1 1 1 1 1 1 0
SIK_04 1 1 0 1 1 1 1 1 1 1 1 1 0 1 1 1 1 1 1 1 1 1 1 1
SIK_06 1 1 1 1 1 1 1 1 1 1 1 1 1 1 1 1 1 1 1 1 0 1 0 1
SIK_07 1 1 0 1 1 1 1 0 1 1 1 1 1 0 1 1 1 1 1 1 0 1 0 0
SIK_10 1 1 1 1 1 1 1 1 1 1 0 1 0 1 1 1 1 1 1 1 1 1 1 1
SIK_11 1 1 0 1 1 1 1 1 1 0 1 1 1 0 1 1 1 1 1 1 1 1 1 1
SIK_15 1 1 1 1 1 1 1 1 1 1 0 1 1 1 1 0 1 1 0 1 1 1 1 1
SIK_18 1 1 1 1 1 1 1 1 1 1 1 1 1 1 1 1 1 1 1 1 1 1 1 1
SIK_19 - - - - - - - - - - - - - - - - - - - - - - - -
CTH_01 1 1 1 1 1 1 1 1 1 1 1 1 1 1 0 1 0 1 0 0 0 0 1 1
CTH_03 1 1 1 1 1 1 1 1 1 1 1 1 1 1 1 1 1 1 1 1 1 1 1 1
CTH_04 1 1 1 1 1 1 1 1 1 1 1 1 0 1 0 1 1 0 0 0 1 1 1 1
CTH_06 1 1 1 1 1 1 1 1 1 1 1 1 1 0 1 0 0 0 1 1 1 1 1 1
CTH_07 1 1 1 1 1 1 1 1 1 1 1 1 1 1 1 1 1 1 1 1 1 1 1 1
CTH_10 1 1 1 1 1 1 1 1 1 1 1 1 1 1 1 1 1 1 1 1 1 1 1 1
CTH_12 1 1 1 1 1 1 1 1 1 1 1 1 0 1 1 1 0 0 1 1 1 0 0 1
CTH_13 1 1 1 1 1 1 1 1 1 1 1 1 1 1 1 1 1 1 1 1 1 1 1 1
CTH_14 1 1 1 1 1 1 1 1 1 1 1 1 1 1 1 1 1 1 1 1 1 1 1 1
CTH_15 1 1 1 1 1 1 1 1 1 1 1 1 1 1 1 1 1 1 1 1 1 1 1 1

CHALMERS, Civil and Environmental Engineering, Master’s Thesis 2011:15 72
Table 7.7 Block III Part VII – Sharpness
Code T:1 T:3 T:6 T:9 T:2 T:5 T:20 T:23 T:4 T:7 T:10 T:13 T:8 T:11 T:14 T:17 T:12 T:15 T:18 T:21 T:16 T:19 T:22 T:24
SIK_03 1 1 1 1 1 1 1 1 1 1 1 0 1 1 1 1 0 1 1 1 1 1 1 1
SIK_04 1 1 1 1 1 1 1 1 1 1 1 0 1 1 1 1 1 1 0 0 1 1 1 1
SIK_06 1 1 1 1 1 1 1 1 0 1 0 1 1 1 1 1 1 1 1 1 1 1 1 1
SIK_07 1 1 1 1 1 1 1 1 0 1 0 1 1 0 1 1 0 0 1 1 1 1 1 1
SIK_10 1 1 1 1 1 1 1 1 1 1 1 1 1 1 1 1 1 1 1 1 1 1 1 1
SIK_11 1 1 1 1 1 1 1 1 1 1 1 0 1 1 1 1 1 1 1 1 1 1 1 1
SIK_15 1 1 1 1 1 1 1 1 0 1 0 1 1 1 1 1 0 1 1 1 1 0 1 1
SIK_18 1 1 1 1 1 1 1 1 1 0 0 0 1 1 1 1 1 1 0 1 1 1 1 1
SIK_19 - - - - - - - - - - - - - - - - - - - - - - - -
CTH_01 0 1 1 1 1 1 1 1 1 1 0 1 1 1 1 1 0 0 1 0 1 1 1 1
CTH_03 1 1 1 1 1 1 1 1 0 0 1 0 1 1 1 1 1 0 1 1 1 1 1 1
CTH_04 1 1 1 1 1 1 1 1 0 1 0 1 1 1 1 1 1 1 1 1 1 1 1 1
CTH_06 1 1 1 1 1 1 1 1 1 1 1 1 1 1 1 1 1 1 1 1 1 1 1 1
CTH_07 1 1 1 1 1 1 1 1 0 1 0 1 1 1 0 1 1 1 1 1 1 1 1 1
CTH_10 1 1 1 1 1 1 1 1 1 0 1 0 1 1 1 1 1 1 1 1 1 1 1 1
CTH_12 0 1 1 1 1 1 1 1 0 1 0 0 0 0 1 1 0 1 1 0 0 0 1 1
CTH_13 1 1 1 1 1 1 1 1 1 1 1 0 1 1 1 1 1 1 1 1 1 1 1 1
CTH_14 0 1 1 1 1 1 1 1 1 1 1 1 1 1 1 1 0 1 1 1 1 1 1 1
CTH_15 1 1 1 1 1 1 1 1 0 0 1 1 1 1 1 1 1 1 1 1 1 1 1 1

CHALMERS, Civil and Environmental Engineering, Master’s Thesis 2011:15 73
Appendix I – Table for Triangle Tests
Critical number of correct responses in a triangle test. Entries are the minimum
number of correct responses required for significance at the stated α-level for the
corresponding number of respondents, n. [14, 21]
Number of
Tests Significance Level (α) n 0.40 0.30 0.20 0.10 0.05 0.04 0.03 0.02 0.01 0.005 0.001
3 2 2 3 3 3 - - - - - -
4 3 3 3 4 4 - - - - - -
5 3 3 4 4 4 5 5 5 5 5 -
6 3 4 4 5 5 5 5 5 6 6 -
7 4 4 4 5 5 6 6 6 6 7 7
8 4 4 5 5 6 6 6 6 7 7 8
9 4 5 5 6 6 7 7 7 7 8 8
10 5 5 6 6 7 7 7 7 8 8 9
11 5 5 6 7 7 7 8 8 8 9 10
12 5 6 6 7 8 8 8 8 9 9 10
13 6 6 7 8 8 8 9 9 9 10 11
14 6 7 7 8 9 9 9 9 10 10 11
15 6 7 8 8 9 9 10 10 10 11 12
16 7 7 8 9 9 10 10 10 11 11 12
17 7 8 8 9 10 10 10 11 11 12 13
18 7 8 9 10 10 11 11 11 12 12 13
19 8 8 9 10 11 11 11 12 12 13 14
20 8 9 9 10 11 11 12 12 13 13 14
21 8 9 10 11 12 12 12 13 13 14 15
22 9 9 10 11 12 12 13 13 14 14 15
23 9 10 11 12 12 13 13 13 14 15 16
24 10 10 11 12 13 13 13 14 15 15 16
25 10 11 11 12 13 14 14 14 15 16 17
26 10 11 12 13 14 14 14 15 15 16 17
27 11 11 12 13 14 14 15 15 16 17 18
28 11 12 12 14 15 15 15 16 16 17 18
29 11 12 13 14 15 15 16 16 17 17 19
30 12 12 13 14 15 16 16 16 17 18 19
31 12 13 14 15 16 16 16 17 18 18 20
32 12 13 14 15 16 16 17 17 18 19 20
33 13 13 14 15 17 17 17 18 18 19 21
34 13 14 15 16 17 17 18 18 19 20 21
35 13 14 15 16 17 18 18 19 19 20 22
36 14 14 15 17 18 18 18 19 20 20 22
37 18 18 19 19 20 21 22
38 19 19 19 20 21 21 23
39 19 19 20 20 21 22 23
40 19 20 20 21 21 22 24
41 20 20 20 21 22 23 24
42 20 20 21 21 22 23 25
43 20 21 21 22 23 24 25
44 21 21 22 22 23 24 26
45 21 22 22 23 24 24 26
46 22 22 22 23 24 25 27
47 22 22 23 23 24 25 27
48 22 23 23 24 25 26 27
49 23 23 24 24 25 26 28
50 23 24 24 25 26 26 28
60 27 27 28 29 30 31 33
70 31 31 32 33 34 35 37
80 35 35 36 36 38 39 41
90 38 39 40 40 42 43 45
100 42 43 43 44 45 47 49