Product Platform notes
33
To appear in Sloan Management Review. PLATFORM PRODUCT DEVELOPMENT David Robertson Baan Company 242 Park Lane Concord, MA 01742 [email protected] Karl Ulrich The Wharton School 1317 Steinberg Hall - Dietrich Hall The University of Pennsylvania Philadelphia, PA 19104 [email protected] First version: July 1995 This version: March 1998 Abstract The standard for minimum acceptable product development performance is high and rising in many industries. It is no longer possible to dominate large markets by developing and mass producing one product at a time. Increasingly, good product development means developing a family, or platform of products, and producing them in a flexible process tailored to the needs of individual customers. We define a platform as the collection of assets that are shared by a set of products. These assets may include components, knowledge, and production processes. Effective platform planning balances the market value of product differentiation against the economies achieved through commonality. Platform planning is difficult: firms may achieve high commonality but fail to differentiate the products; firms may differentiate the products, but create products with excessive costs; or firms may create viable platform plans that are subsequently never realized. This article presents three tools for supporting platform planning: (1) the product plan, (2) the differentiation plan, and (3) the commonality plan. These tools are intended to facilitate the planning process by providing a common language for the marketing, design, and manufacturing functions of the firm.
-
Upload
er-sukhjeet-s-sabharwal -
Category
Documents
-
view
226 -
download
2
Transcript of Product Platform notes

To appear in Sloan Management Review.
PLATFORM PRODUCT DEVELOPMENT
David Robertson
Baan Company242 Park Lane
Concord, MA [email protected]
Karl Ulrich
The Wharton School1317 Steinberg Hall - Dietrich Hall
The University of PennsylvaniaPhiladelphia, PA 19104
First version: July 1995This version: March 1998
Abstract
The standard for minimum acceptable product development performance is high and rising in
many industries. It is no longer possible to dominate large markets by developing and mass
producing one product at a time. Increasingly, good product development means developing a
family, or platform of products, and producing them in a flexible process tailored to the needs of
individual customers. We define a platform as the collection of assets that are shared by a set of
products. These assets may include components, knowledge, and production processes.
Effective platform planning balances the market value of product differentiation against the
economies achieved through commonality. Platform planning is difficult: firms may achieve
high commonality but fail to differentiate the products; firms may differentiate the products, but
create products with excessive costs; or firms may create viable platform plans that are
subsequently never realized. This article presents three tools for supporting platform planning:
(1) the product plan, (2) the differentiation plan, and (3) the commonality plan. These tools are
intended to facilitate the planning process by providing a common language for the marketing,
design, and manufacturing functions of the firm.
2
I. INTRODUCTION
In 1987, Fuji introduced the QuickSnap 35mm single-use camera in the U.S. market. Kodak,
which did not have a product of its own, was caught with its guard down in a market that was
destined to grow by over 50% per year for the next 8 years, from 3 million units in 1988 to 43
million in 1994. By the time Kodak introduced its first model, almost a year later, Fuji had
already developed a second model, the QuickSnap Flash. Yet, Kodak would take market share
back from Fuji- by 1994, Kodak had captured over 70% of the U.S. market. The success of this
response may be attributed in part to Kodak’s strategy of developing many distinctively different
models from a common platform. Between April of 1989 and July of 1990, Kodak redesigned
its base model and introduced three additional models, all sharing common components and
common production process steps (Clark and Wheelwright, 1996). Because Kodak designed its
four products to share components and process steps, it was able to develop its products much
faster and more cheaply. These different models appealed to different customer segments and
gave Kodak twice as many products as Fuji, allowing it to capture precious retail space and
garner substantial market share.
This platform approach to product development is a key success factor in many markets. The
platform approach allows a company to quickly and efficiently develop a set of differentiated
products. By sharing components and production processes across a platform of products,
companies can develop products faster and more cheaply, increase the flexibility and
responsiveness of their manufacturing processes, and take market share away from competitors
that develop only one product at a time. For example, in the auto industry, Nobeoka and
Cusumano (1994, 1995) showed that a platform approach was associated with market share gains
of 5.1 percent per year, while firms pursuing a single model approach lost 2.2 percent per year.
The platform approach is also one key approach to successful mass customization— the ability to
produce products in high volumes that are tailored to meet the needs of individual customers
(Pine, 1993; Pine, Boynton, and Victor, 1993; Feitzinger and Lee, 1997). The platform approach
allows highly differentiated products to be delivered to the market without consuming excessive
resources.
In this article we define what we mean by a platform, articulate three key ideas underlying the
platform approach to product development, and present a method for planning a new platform of
products. We illustrate the method using as an example the design of an automotive instrument

3
panel or “dashboard.” The final section contains recommendations for managing the platform
planning process.
What is a platform?
A platform is the collection of assets that are shared by a set of products. These assets can be
divided into four categories:
• Components: the part designs of a product, the fixtures and tools needed to make them,
the circuit designs, and the programs burned into programmable chips or stored on disks.
• Processes: the equipment used to make components or to assemble components into
products, and the design of the associated production process and supply chain.
• Knowledge: design know-how, technology applications and limitations, production
techniques, mathematical models, and testing methods. (See [Kim and Kogut, 1996] for
an interesting discussion of the strategic role of knowledge platforms.)
• People and relationships: teams, relationships among team members, relationships
between the team and the larger organization, and relations with a network of suppliers.
Taken together, these shared assets constitute the product platform. Generally platform products
share a significant if not majority portion of development and production assets. In contrast,
parts standardization efforts across a set of products may lead to the sharing of a modest set of
components (Fisher, Ramdas, and Ulrich, 1996), but such a collection of shared components is
generally not considered a product platform.
Successful platform planning offers the following potential benefits:
• Greater ability to tailor products to the needs of different market segments or customers.
The incremental cost of addressing the specific needs of a market segment or of an
individual customer may be reduced through the platform approach, enabling market
needs to be more closely met.

4
• Reduced development cost and time. Parts and assembly processes developed for one
model do not have to be developed and tested for the others. This benefit applies to new
products developed from the platform as well as to subsequent updates.
• Reduced manufacturing cost. Economies of scale may be achieved when producing larger
volumes of common parts.
• Reduced production investment. Machinery, equipment, and tooling, and the engineering
time to create them, can be shared across higher production volumes.
• Reduced systemic complexity. Cutting the number of parts and processes can cut costs in
materials management, logistics, distribution, inventory management, sales and service,
and purchasing. (See [Ulrich et al. 1993] for an example of the magnitude of these costs.)
• Lower risk. The lower investment required for each different product developed from a
platform results in decreased risk for each new product.
• Improved service. Sharing components across products allows companies to stock fewer
parts in their production and service parts inventories. This translates into better service
levels and/or lower service costs.
The challenge of platform planning
The central challenge of developing platform products is simultaneously meeting the needs of
diverse market segments while conserving development and production resources. Developing
platform products involves two sets of difficult tasks. First, a product planning and marketing
activity addresses the problem of which market segments to enter, what the customers in each
segment want, and what product attributes will appeal to those customers. Second, a system-level
design activity addresses the problem of what product architecture should be used to
simultaneously deliver the different products while also sharing many parts and production steps
across the products. These two sets of tasks are challenging both because the tasks themselves
are inherently complex and because their completion requires coordination among at least the
marketing, design, and manufacturing functions of the firm. These functional groups may not be
accustomed to working with each other, and can find such cooperation difficult due to
differences in time frames, jargon, goals, and basic beliefs.

5
Platform planning is also difficult because of the many ways it can fail. We have observed two
common dysfunctions in organizations attempting to create product platforms. First,
organizational forces frequently hinder the ability to balance commonality and distinctiveness.
One perspective can dominate the debate. Design or manufacturing engineers often prepare hard
cost data showing how expensive it would be to create distinctive products, leading to products
that are too similar from the customer’s perspective. This dysfunction was illustrated graphically
(if perhaps inaccurately) by a Fortune magazine cover photograph in 1983 showing “look-alike”
Chevrolet, Oldsmobile, Buick, and Pontiac automobiles (Fortune, 1983). Alternatively, the
marketing function may mount a convincing argument that only completely different products
will appeal to the different market segments, and that commonality is penny wise and pound
foolish.
Second, even when platform planning is attempted with a balanced team committed to working
together, the process can get bogged down in details, resulting in either the organization giving
up, or in products by committee with no character and no integrity (Clark and Fujimoto, 1990).
Platform planning in the auto industry
While we believe that the platform planning method we describe below is broadly applicable
across many types of products, we illustrate the method using an example from the auto industry.
Throughout the paper, we use the example of the design of an instrument panel (i.e., the
“dashboard”) to illustrate the key ideas. An instrument panel is a critical part of new car’s design
and plays several important functional roles. It provides structural support for heating,
ventilation, and air conditioning (HVAC) ducts, components, switches, gauges, audio
components, storage areas (such as the glove box), airbags, and a great deal of tubing and wiring.
The instrument panel also must help absorb the shock of a front or side collision, and help
prevent the car body from twisting during normal driving (which improves handling). The
instrument panel has a strong role in the aesthetics of a new car: the look, feel, and even smell of
an instrument panel can effect the appeal of the car. The look and feel of the instrument panel
can also do a great deal to distinguish one car from another.
The instrument panel example is drawn from our experience with a major automobile
manufacturer, however many of the details have been stylized for clarity of exposition.
6
II. BALANCING COMMONALITY AND DISTINCTIVENESS
At a fundamental level, product variety is valuable in the marketplace, yet variety is generally
also costly to deliver (Lancaster, 1990). The platform approach is one way to skirt this basic
tradeoff through the sharing of substantial assets across products. Platform planning balances the
need for distinctiveness with the need for commonality. Three key ideas underlie the platform
planning process.
1. Customers care about distinctiveness; costs are driven by commonality.
Customers care whether the firm offers a product that closely meets their needs; they do not care
directly about the level of parts commonality among a collection of products. Closely meeting
the needs of different market segments requires distinctive products. Conversely, the costliness
of the internal operations of a firm is substantially driven by the level of parts commonality
among a collection of products, and is not directly related to how distinctive those products are in
the marketplace.
We use the term differentiating attribute or DA to denote an attribute that customers view as
important in a product. Products are distinctive if the values of the DAs that characterize the
product are distinctive. For example, interior noise level is a DA that contributes to the
distinctiveness of a vehicle. Customers generally expect audible cues from the engine in sporty
vehicles, while they expect near silence in luxury vehicles.
We use the term chunk to refer to the major physical elements of a product, its key components
and subassemblies. (This usage is increasingly common in industrial practice and is consistent
with that in [Ulrich and Eppinger, 1995] ). A set of products exhibits high levels of commonality
if many of its chunks are shared. For example, at many car companies the engine compartment
is treated as a chunk which may potentially be shared across several vehicles.
Note that while DAs and chunks are related (interior noise is influenced by insulation) they are
two very different ways of describing a product. DAs reflect the level of distinctiveness as
perceived by the external customer, while chunks reflect the level of commonality as experienced
by the internal operations of the firm.
7
2. Given a particular product architecture, there is a trade-off between distinctiveness andcommonality.
Consider a pair of products. If these products shared 100 percent of their parts they would be
completely common, but would have no distinctiveness. If these products shared no parts, they
would have no commonality, but could have an arbitrarily high level of distinctiveness. As the
number of common parts is increased from zero percent to 100 percent, the distinctiveness of the
two products will decline to zero. For example, the instrument panels for two different
automobile models could be arbitrarily distinctive if they shared no parts. A firm might share
several parts of the instrument panel, say mounting screws and small brackets with very little
loss of distinctiveness. As more and more parts are shared, say gauges, environmental controls,
and audio system, the two instrument panels lose more and more distinctiveness. Of course if
every part were common, the two panels would be indistinguishable. This trade-off between
distinctiveness and commonality can be represented schematically by Exhibit 1. Two products
that are very distinctive, yet share few parts correspond to Scenario A, while two products that
are less distinctive, yet share many parts correspond to Scenario B. For a given product
architecture, product designers face a trade-off between distinctiveness and commonality.
Conceptually, this trade-off can be thought of as constraining the distinctiveness and
commonality of a pair of products to fall along the curve labeled Architecture 1 in Exhibit 1.
3. Product architecture dictates the nature of the trade-off between distinctiveness andcommonality.
While there is a trade-off between distinctiveness and commonality, the nature of the trade-off
can be influenced by changing the product architecture. Architecture 2 in Exhibit 1 results in a
trade-off in which slight efforts at commonization will result in drastic reductions in
distinctiveness (Scenario C). It is also possible, as illustrated by Architecture 2, that even with
no parts in common, two products may not be viewed as completely distinct. In the ideal case,
the product architecture presents the firm with a trade-off in which a relatively high level of
commonality can be achieved without much sacrifice in distinctiveness, and distinctiveness
declines slowly as commonality is increased. This situation is represented by Architecture 3 and
Scenario D.
For example, consider the two different instrument panel architectures shown schematically in
Exhibit 2. One architecture consists of a tubular metal structure over which a contoured plastic

8
skin is assembled; the other consists of a curved plastic panel with metal reinforcements
integrally molded as part of the structure. In the first case, the underlying metal structure could
be common across Instrument Panels A and B, while the plastic skin could be different. This
commonization would result in relatively little loss of distinctiveness. In the second case, an
attempt at commonizing one of the integral metal-plastic panels will leave the two vehicles with
similar exterior appearances for the dashboard, a large decrease in distinctiveness. Architectures
like the first example are called modular, while architectures like the second are called integral.
(Ulrich, 1995).
Although not the focus of this article, another type of architecture that may be important to
consider in platform planning is the production architecture. The production architecture defines
the range of products that can be produced. For example, if the different models of a new
platform of cars are to be assembled and painted on the same production line, then the structure
of the production line will determine the range of possible heights and widths, the allowable
sizes of the different systems in the car (e.g., how big or small the dashboard, seats, and other
systems can be), and the assembly sequence of the car. This production architecture is not a
fixed constraint, but the cost of revising it may be significant.
III. THE PLATFORM PLANNING PROCESS
Platform planning is a cross-functional activity involving at least the product planning,
marketing, design, and manufacturing functions of the firm. In most cases platform planning is
best carried out by a core team made up of representatives from each of these functions. For
large development projects, each of these representatives is in turn supported by an experienced
staff.
We advocate a loosely structured process for platform planning focused around three information
management tools:
• The product plan.
• The differentiation plan.
• The commonization plan.

9
These three plans are shown schematically in Exhibit 3. The three plans are top-level summaries
of deeper analyses by members of the extended platform planning team, but they explicitly
display the degree to which coherence has been achieved between product strategy, market
positioning, and product design. The goal of the platform planning process is to achieve
coherence across these three plans.
The process of platform planning is likely to be iterative. The team begins by constructing the
three plans and then works iteratively to achieve coherence among them. We devote a section to
each of the three planning tools and to the process of iterative refinement.
Establish a product plan
The product plan for the collection of products encompassed by the platform specifies what the
distinct market offerings will be over time, and is usually taken from the company’s overall
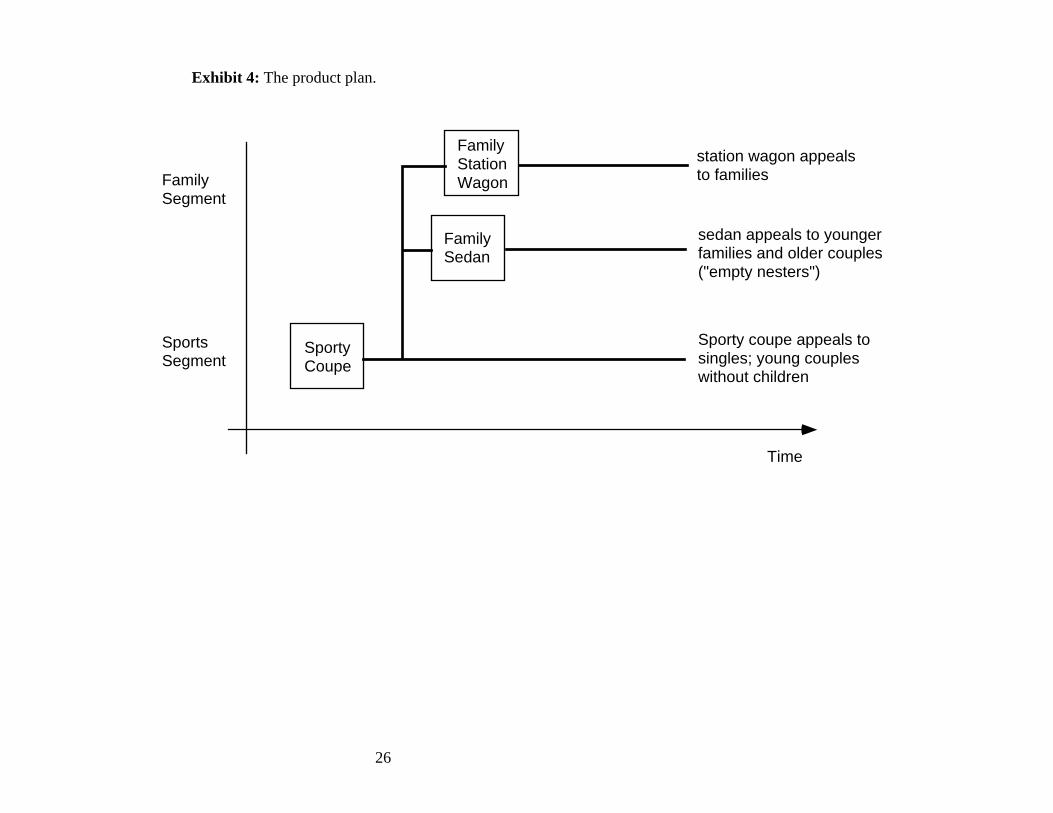
product plan. Exhibit 4 contains a product plan for a new platform showing a sporty coupe, a
family sedan, and a family station wagon. The two axes of the chart correspond to the segments
of the marketplace and to time. The timing and segment of each planned product are indicated
by location on the chart. The genealogy of the products is indicated by the links on the chart.
The product plan is supported by a top-level description of each product. This description
contains the customer profile (key needs, psychographics, and demographics), and a basic
business plan (expected sales volumes and selling price range). The product plan indicates major
models, but does not show every variant and option of the product.
The product plan is linked to several other key issues and pieces of information, including:
• Availability of development resources.
• Life cycles of current products.
• Expected life cycles of competitive offerings.
• Timing of major production system changes.
• Availability of key product technologies.
The product plan is reflective of the firm’s product strategy. Some firms will choose to
simultaneously issue several products, while others will choose to launch products in succession.

10
Specify the differentiating attributes of each product
DAs are the dimensions along which the differentiation of the product is meaningful to
customers. The differentiation plan indicates what the target values of the DAs are for each of
the products in the product plan. Exhibit 5 is an example of a differentiation plan. The rows of
the matrix correspond to the critical DAs. The columns correspond to each product in the
product plan, with the final column containing an approximate assessment of the relative
importance of each DA. A common pitfall in platform planning is to become bogged down in
detail. We generally find that the best level of abstraction for platform planning results in no
more than 10 to 20 DAs. In the beginning of the process, these DAs will focus on the overall
properties of the product. As the planning process evolves, the work will shift to the system
level, and the DAs will become more and more detailed.
The DAs that differentiate one car from another and that affect the instrument panel are:
• Curvature of the window glass. A sporty model with more highly curved glass requires
wider doors (as the glass will take up more room inside the door when the window is rolled
down).
• Styling of the instrument panel. The look and feel of the instrument panel are important
differentiating characteristics. Sports car drivers will not accept any instrument panel that
looks like it belongs in a family sedan.
• Relationship between the instrument panel and the driver. Drivers of sports cars like to sit
lower to the road, which increases the sensation of speed. Sports car drivers also like to sit
further away from the steering wheel, with their arms straighter, and with the seat back more
reclined.
• Front end styling. A shorter front end on the coupe changes the stance of the vehicle, making
the car seem more ready to “attack” the road. A shorter front end, however, will change the
specifications for the instrument panel, as more of a front impact would have to be absorbed
by the instrument panel.
• Colors and textures. Cars can be differentiated by the materials used to cover the surfaces the
owner sees and touches. This company has chosen to use a mixture of leather and textiles on
the instrument panel to evoke the feel of an English roadster.

11
• Suspension stiffness. A stiffer suspension can improve vehicle handling, but may also cause
a higher level of squeaks and rattles in the instrument panel.
• Interior noise. Sports car drivers do not want wind or road noise, but like hearing the sound
of the engine.
On the first pass, the differentiation plan represents the ideal case of how each product would be
differentiated for maximum appeal to customers in the target segment. On subsequent iterations,
this ideal case will be adjusted to respond to the need for commonality.
The values of the DAs for the competitive products serve as a useful benchmark for the
differentiation activity, and can be entered in additional columns of the matrix. However, care
must be taken to avoid focusing on existing competitive products at the expense of anticipating
where the market is going in the future.
Objective metrics are particularly useful for representing the target values of the DAs when such
metrics are widely accepted as meaningful in the marketplace (e.g., miles per gallon for
automobiles). When such metrics are not available, direct comparisons may be useful (e.g. like
Lexus ES300).
Quantify the commonality across products
The commonality plan describes the extent to which the products in the product plan share
physical elements. The plan is an explicit accounting of the costs associated with developing and
producing each product in the product plan.
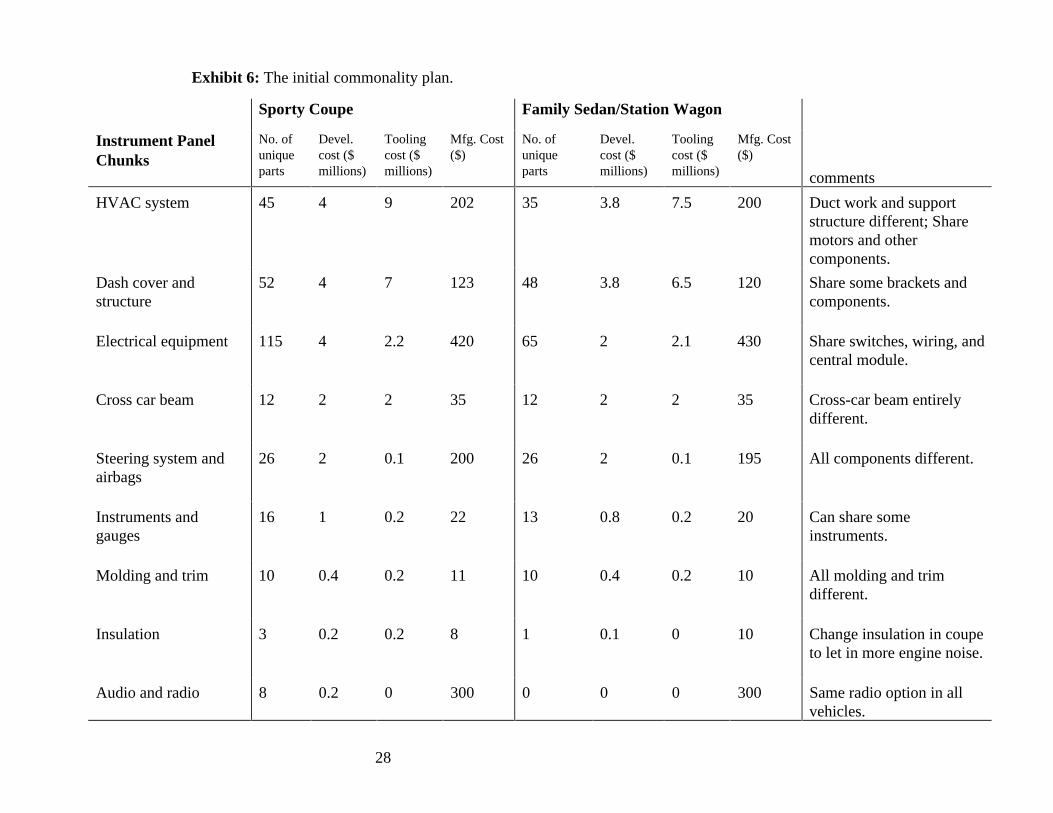
Exhibit 6 is an example of a commonality plan. The rows of the matrix are the critical chunks in
the product. To manage complexity, the team should limit the number of chunks to roughly the
number of DAs, and to no more than 10 or 20. The columns are the products in the product plan,
in order of the temporal sequence of their development. We use four metrics in the commonality
plan:
• Incremental number of unique parts.
• Incremental development cost.
• Incremental tooling cost.

12
• Unit manufacturing cost.
For example, consider the first row of the commonality plan shown in Exhibit 6 and
corresponding to the HVAC system. The Sporty Coupe will require 45 unique parts, $4 million
in development cost, $9 million in tooling cost and will have a unit manufacturing cost of $202.
To then produce the HVAC system for the sedan and wagon will require an additional 35 unique
parts, $3.8 million in development cost, and $7.5 million in tooling cost. The unit manufacturing
cost of the HVAC system for the sedan and wagon will be $200.
For different product contexts, the relative importance of these metrics may vary. For example,
in some settings, tooling cost may not be significant and may be dropped from the plan. In other
settings, other metrics may be important. For example, development time may be the most
important metric for a product due to the potential loss of market share from being late to market.
In this case, a time metric could be added to the commonality plan.
The values of these metrics are estimated, because actual values can not be determined until the
products have been designed and produced. Note that, with the exception of unit manufacturing
cost, the values in the commonality plan are the incremental values assuming the preceding
products will be developed and produced. If the sequence of products in the product plan
changes, the incremental values may also change. The commonality plan in the example
considers the incremental parts and costs associated with producing the sedan and station wagon
after the sporty coupe.
Underlying the commonality plan are the basic engineering design concepts for the product. In
most cases, engineering layouts of each product would be created to support the estimation
process. Once the values of the metrics are estimated, the total values for each product and for
each chunk can be summed.
Iteratively refine the plans to achieve coherence
Given the objective of maximizing market presence, the firm would most likely wish to enter
many segments with many products, and replace them all regularly. Given the objective of
capturing a large fraction of each segment, the firm would attempt to ideally position the product
with respect to the values of the DAs. Given the objective of minimizing development cost,
tooling investment, and complexity, a substantial fraction of all the products in the product plan
would be identical. Typically, these three objectives are in conflict. For most product contexts

13
an unconstrained product plan and an unconstrained differentiation plan will lead to high costs.
For this reason, iterative problem solving is required to balance the need for differentiation with
the need for commonization. After completing the commonization plan, the team may return to
the differentiation plan and modify the target level of differentiation on DAs that are particularly
critical drivers of product costs. After reviewing the costs of effectively differentiating a product
for a particular segment, the team may decide that it is simply infeasible to consider that product
part of the platform.
Conceptually, this iterative activity involves both moving along the distinctiveness-commonality
curve and exploring alternative product architectures with different associated trade-off
characteristics (Exhibit 1).
We offer several guidelines for achieving coherence across the three plans:
1. Focus on the critical few DAs and chunks.
The relationship between the DAs and the chunks can be represented by the matrix in Exhibit 7.
The rows of the matrix are the DAs and the columns of the matrix are the chunks. A cell of the
matrix is filled when the DA and the chunk associated with that cell are interrelated (i.e., when
variation in the DA is likely to require variation in the chunk). We denote a strong
interdependency with a solid circle and a weaker interdependency with an outlined circle.
Because the exact relationships between chunks and DAs depends on the final product
architecture, the matrix should be viewed as approximate and representative of the team’s best
estimates.
The matrix is most useful when the DAs are arranged in order of decreasing value to the
customer of variation, and when the chunks are arranged in order of the decreasing costliness of
variation. When organized this way, the DAs and chunks in the upper left portion of the matrix
whose corresponding cells are filled have special significance. These are the important DAs and
costly chunks that are interrelated. These elements are the critical few on which platform
planning is focused.
Note that chunks that are not related to important DAs should be rigorously standardized and
incorporated into the platform. Variation in these chunks does not offer value in the
marketplace. Also note that valuable DAs that are not related to costly chunks can be varied

14
arbitrarily without incurring high cost, and so should be varied directly in accordance with
market demands.

15
2. Search for architectural solutions to apparent conflicts
In this example, the initial architecture of the instrument panel involved reusing only a few
HVAC components, gauges, switches, wiring, brackets, fasteners, and other components. The
initial commonality plan (Exhibit 6) shows that the development and tooling costs for the
sedan/wagon would be $5.2 million less than for the couple, reflecting some savings from
commonality in the initial design approach. However, the engineering team set out to develop an
alternative architecture that would allow greater re-use of components
The first area the team examined was the most expensive: the HVAC system. Team members
realized that, by designing the duct system using a modular architecture, they could re-use many
HVAC components. They designed a system where the ends of the ducts varied across models,
while the main ducts and the mixing box that connects them could be re-used (Exhibit 8). They
also realized that with some careful packaging they could re-use the support structure for the
entire instrument panel. This resulted in $10.4 million of additional savings in development and
tooling cost compared to the initial plan (Exhibit 9).
The second area they examined was the cross-car beam. They found that, even though the
coupe’s instrument panel was narrower than the others on the platform, they could standardize
the attachment points of the dashboard cover and structure and re-use most of the cross-car beam
components. The only change that was required was a main beam that was 6 cm shorter. This
resulted in another $3.8 million of development and tooling savings (Exhibit 9).
Finally, the team examined the electrical equipment and steering system. Team members found
that while the airbag itself had to be tuned differently for the different models, the housing,
sensors, and control module could be re-used. The expensive combination switch (which
controls the turn signal, wiper washer, and headlight switches) could be re-used if the dashboard
cover was styled correctly and if different covers were used for the switch arms. Between the
electrical equipment and steering system, these actions saved an additional $4.7 million over the
initial plan.
In addition to savings in fixed costs, the variable costs of producing components also falls in this
example because the volume of the components increases. Suppliers offered an average 5%
price discount in return for standardizing components. This resulted in an annual savings of $9
million.

16
The team could have achieved further savings by using a common dashboard cover. However,
the dashboard cover is absolutely critical in differentiating the two products. Therefore, the team
chose to sacrifice commonality, even at substantial cost, because of the market value of the
resulting distinctiveness.
3. Attempt to express costs and benefits in terms of profits
To keep the problem-solving discussions that occur during platform planning productive, they
should be anchored in a common language. We suggest that the best way to let all groups
communicate is to focus the discussion on the impact of choices on platform profitability.
The group iteratively refining the differentiation plan must focus on the impacts of decisions on
market share, and link share points to profitability. The group refining the product architecture
should similarly focus on product costs. Only when both groups are working from the same
profitability model can they begin discussing the bottom-line tradeoffs between commonality and
distinctiveness.
In an ideal world, we would want to explicitly optimize the platform to achieve maximum
profits. While some current research efforts are directed at this objective (Krishnan et. al, 1996),
explicit profit maximization is hard for at least three reasons. First, the data are scarce, especially
related to the value of a particular choice of a DA. Second, decomposing the value of a product
into the value of individual DAs is difficult. Third, much of the problem solving activity in
platform planning involves creative design problem solving around the choice of product
architecture, for which there are no structured optimization techniques. For this reason, our
underlying assumptions are that a correct answer is unlikely, that providing a clear way of
displaying information will help, and that the team should work for a solution that is good
enough. The key to making the process a success is to avoid “analysis paralysis,” but to get data
that supports quick, creative problem solving iterations.
4. Become as sophisticated as possible in describing DAs
The ability to describe DAs well is vital to platform planning. Understanding how customers
view products, and what distinguishes one product from the next is a difficult task. By
describing DAs clearly and in a detailed manner, the linkage to the chunks of the vehicle will be

17
easier to understand. Developing an understanding of DA s that are holistic (i.e., that arise from
the entire product as a system) is especially critical (Ulrich and Ellison, 1997).
One good example of careful DA definition comes from Lotus Engineering (Lees, 1992). To
describe the handling characteristics of their cars, Lotus uses very sophisticated terms for the
characteristics of its vehicles. These terms, which are vividly descriptive of the feel of the car in
many different situations, help Lotus better connect a car’s handling characteristics to the
components that determine them. For example, three of Lotus’ attributes are:
• Umbrella is the feel that a car is descending after coming over the crest of a hill. A carhas motions that make a driver feel that it is flying off the road and motions that bringit closer to the road, and a car with good umbrella will have twice as many motionscloser to the road than motions off the road.
• Nibbling is the series of quick back-and-forth movements that happen when a car goesover a series of bumps.
• Standing up is the feeling that the rear end of the vehicle is rising. The back end of acar that stands up feels like it rises more than it falls as it goes over bumps and hill.
These DAs allow the different groups at Lotus to better work together to understand what has to
be differentiated and how. By describing very carefully how these should be different, the
specifications for the chunks of a car can be more exactly determined.
IV. MANAGING PLATFORM PLANNING
Top management should play a strong role in the platform planning process for three reasons:
(1) platform decisions are among the most important made by a company, (2) platform decisions
may cut across several product lines or divisional boundaries, and (3) platform decisions
frequently require the resolution of cross-functional conflict.
Platform planning will determine the products that will be introduced by a company into the
market over the next 5-10 years or longer, the types and levels of capital investment, and the
research and development agendas for both the company and its key suppliers. Because of the
impact of platform decisions, they warrant significant top management involvement.
Top management’s participation is needed because making good platform decisions requires
making complex tradeoffs across different areas of the business. For example, making an
18
instrument panel slightly less stylish could hurt the appeal to certain target segments, yet improve
commonality and manufacturability. Or a product plan that requires spinning five products off a
common platform may turn out to not be realistic, and have to be revised.
Different functions within the firm have different perspectives during product development.
Some functions, such as sales, market research, marketing, and styling, concentrate on those
characteristics of the product that the customer experiences while using the product. Other
functions, such as engineering, production, and after-sales service, may be more focused on the
cost of the product. When designing a new platform, the functions of the firm that focus on the
customer features of the product often are in conflict with groups that care about the parts and
production processes of the product. Top managers should recognize that the organization may
be in fundamental disagreement about the goals of the platform and that a top-management
perspective may be required to achieve the best overall solutions.
The following guidelines are intended to facilitate the initial organization of a platform planning
project:
• Put someone in charge of each plan (the product plan, the differentiation plan, and the
commonality plan), and someone else in charge of driving the whole process
• Make sure all key functions are involved: engineering, market research, manufacturing
engineering, industrial design, etc.
• Set up two support teams. One team estimates the value of differentiation or the cost of a
lack of differentiation. The other team estimates the costs associated with a given level of
commonality.
• Spend time building a high-performing team. The planning process is a difficult one,
involving many different functions that are not used to working together. Time spent in
the early phases clarifying objectives, building consensus, and creating a true team can
pay off handsomely in the later phases of the process.
• Set targets for the total cost of the platform, based on past performance, or on
benchmarked results. These cost targets will help prevent the activity from resulting in
too little commonality

19
Once the project is organized, several managerial guidelines can be used to facilitate the process:
• Help all understand that, while there is a tradeoff between commonality and variety, it is
not a zero sum game. It may take all functions quite a while to learn that choosing the
right architecture can do much to improve commonality and distinctiveness. Working
together can help improve the platform products from everyone’s perspective.
• Drive for quick, approximate results, not for slow, perfect answers. Challenge the
organization to quickly experiment with different architectures, evaluating them for their
ability to achieve commonality and distinctiveness. The secret to platform planning is
not deep detailed analysis, but fast, creative problem solving.
• Push for facts, not someone’s “gut feel” of the answer. Management should ask for and
get the best possible data on customer needs, size of segments, and cost of differentiation
before making decisions. This is not to suggest that analyses should be detailed,
bulletproof research papers. Rather the analyses, however approximate, should be based
on the best facts available, and not on personal hunches.
• Don’t insist on total agreement and perfect resolution of all issues, but rather ask for
design solutions that everyone believes are good enough on all dimensions, and very
good relative to the few critical competitive dimensions.
• Start as high in the structure as possible, and iteratively refine the plan in greater and
greater detail. For example, in the development of a new car, the first step might be to
examine the production process to maximize its flexibility. Then, planning would focus
on the complete vehicle, followed by systems, subsystems, then individual parts. The
planning process we describe would continue at some level through the entire design
process.
• Make the process a living process. The way in which platform planning is implemented
will (and should) be different in every company. One key to successful platform
planning is a continuing evaluation and improvement of the process. A static, regulated
implementation of the planning process is doomed for failure.
• Evolve the planning process into the next phase. As planning nears completion, more
and more members of the team that will execute the next phase of the project should be

20
involved, to make sure they understand and agree with the major decisions that have been
made.
• Use the results to drive the improvement agenda for the company. What should research
work on? Where does production need to be more flexible? What other customer
segments are out there? What dimensions of the product do the customers really care
about? How can the product technology be made more robust so that it can be used in
many platforms?
V. SUMMARY
The standard for minimum acceptable product development performance is high and rising fast
in many industries. It is no longer possible to dominate large markets by developing one product
at a time. Increasingly, good product development means good platform development.
To do platform development well, a company must carefully align its product plan, its
differentiation plan, and its commonality plan through an iterative planning process. No longer
can the product planning group throw its plan over the wall to other groups; the planning must
be a cooperative process involving all groups and guided by top management. Just as good
product engineering involves up-front consideration of manufacturing issues, good platform
planning requires up-front consideration of design and manufacturing issues.
Much academic and industrial attention has been concentrated on product strategy and on
product development project execution, but very little emphasis has been placed on coordinating
the development of the set of products that realize a product plan. Platform planning forms this
missing link. Yet platform planning is difficult: teams may achieve high commonality but fail to
differentiate the products; teams may differentiate the products, but create products with
excessive costs; or teams may create viable platform plans that are subsequently never realized.
The planning tools in this article are intended to be a common language that the marketing,
design, and manufacturing functions of the firm can all understand. The platform planning
process we present is intended to apply these tools in a way that no critical elements of the
process are forgotten and that coherence among the plans is achieved.
21
REFERENCES
“Will Success Spoil General Motors,” Fortune, August 22, 1983, (cover).
Clark, K. B. and S. Wheelwright, Leading Product Development, The Free Press, 1996.
Clark, K. B. and T. Fujimoto, “The Power of Product Integrity,” Harvard Business Review,Vol. 68, No. 6, 1990.
Feitzinger, Edward and Hau L. Lee, “Mass Customization at Hewlett-Packard: The Power ofPostponement,” Harvard Business Review, January-February 1997.
Fisher, M.L., K. Ramdas, and K. Ulrich, “Component Sharing: A Study of Automotive Brakes,”Working Paper, The Wharton School, Department of Operations and Information Management,1996.
Kim, Jong-Jae and Bruce Kogut, “Technological Platforms and Diversification,” OrganizationScience, Vol. 7, No. 3, May-June 1996.
Krishnan, V. et. al, “A Model-Based Approach for Planning and Developing a Family ofTechnology-Based Products,” Working Paper, University of Texas, Austin, 1996.
Lancaster, K., “The Economics of Product Variety,” Marketing Science, Vol. 9, No. 3, p. 189-206, 1990.
Lees, Howard, “Word Perfect: How do you accurately describe what a car feels like to drive?”Car Design & Technology, August 1992.
Nobeoka, K. and M. A. Cusumano, “Multi-Project Strategy and Market Share Growth: TheBenefits of Rapid Design Transfer in New Product Development,” International Center forResearch on the Management of Technology Working Paper #105-94, 1994.
Nobeoka, K. and M. A. Cusumano, “Multiproject strategy, design transfer, and projectperformance: A survey of automobile development projects in the US and Japan,” IEEETransactions on Engineering Management, Vol. 42, No. 4, p. 397-409, 1995.
Pine, B. Joseph II, Mass Customization: The New Frontier in Business Competition, HarvardBusiness School Press, Boston, 1993.
Pine, B. Joseph II, Bart Victor, and Andrew C. Boynton, “Making Mass Customization Work,”Harvard Business Review, Vol. 71, No. 5, p. 108-111, Sept/Oct 1993.
Ulrich, K. and D. Ellison, “Customer Requirements and the Design-Select Decision,” WorkingPaper, The Wharton School, Department of Operations and Information Management, 1997.

22
Ulrich, K. and S. Eppinger, Product Design and Development, McGraw-Hill, New York, 1995.
Ulrich, K., “The Role of Product Architecture in the Manufacturing Firm,” Research Policy, Vol.24, p. 419-440, 1995.
Ulrich, K., “Including the Value of Time in Design for Manufacturing Decision Making,”Management Science, Vol. 39, No. 4, p. 429-447, April 1993.

23
Exhibit 1: The trade-off between distinctiveness and commonality between two products for a given product architecture.
Common Parts (%) 100
100
Scenario A: productsare very distinctive,
but share few commonparts
Scenario B:products are less
distinctive, but sharemany parts
Scenario C: productsare not distinctiveand share few parts.
Scenario D: productsare very distinctiveand share many parts
Architecture 1
Architecture 2
Architecture 3

24
Exhibit 2: Modular and integral architectures for an instrument panel.
Modular Architecture Integral Architecture
plasticskin
metal supportstructure
Instrument Panel A Instrument Panel B Instrument Panel A Instrument Panel B
The modular architecture allows the same support structure to be used in two different instrument panel designs.
(Illustrative instrument panel designs shown in cross section.)

25
Exhibit 3: The platform planning challenge is to achieve consistency among the product plan, thedifferentiation plan, and the commonality plan.
DifferentiatingAttribute Model 1 Model 2 Model 3
Differentiation Plan Commonality Plan
Product Plan
Chunk Model 1 Model 2 Model 3
Goal:Perfect Consistency
What model concepts and variants will be delivered atwhat times to what target customers?
What major options are offered for each model andvariant?
How will the models be differentiated from oneanother?
How will we make sure the models attract ourtarget customers?
Which elements are common and which are distinctacross the models (and how are distinct elementsdifferent)?
Time
Segments
26
Exhibit 4: The product plan.
Time
FamilySegment
SportsSegment
SportyCoupe
FamilyStationWagon
FamilySedan
station wagon appealsto families
sedan appeals to youngerfamilies and older couples("empty nesters")
Sporty coupe appeals tosingles; young coupleswithout children

27
Exhibit 5: The differentiation plan.
Differentiating Attributes Sporty Coupe Family Sedan/Station Wagon Importance to Customer
Curvature of window glass More curvature. Straight, vertical. •••
Styling of instrument panel Evocative of English roadster. Highly functional. •••
Relationship between driverand instrument panel
Driver sits low to ground,distant from steering wheel,with seat reclined.
Driver sits higher, closer, moreupright.
•••
Front-end styling Shorter nose; vehicle appears toattack the road.
Longer nose, more substantiallook.
•••
Colors and textures Darker colors and mix ofleather and textiles.
Practical surfaces and colors. ••
Suspension stiffness Stiff, for improved handling. Softer, for improved comfort. ••
Interior noise Some engine noise desirable,70dB.
Noise minimized, 60 dB. •
28
Exhibit 6: The initial commonality plan.
Sporty Coupe Family Sedan/Station Wagon
Instrument PanelChunks
No. ofuniqueparts
Devel.cost ($millions)
Toolingcost ($millions)
Mfg. Cost($)
No. ofuniqueparts
Devel.cost ($millions)
Toolingcost ($millions)
Mfg. Cost($)
comments
HVAC system 45 4 9 202 35 3.8 7.5 200 Duct work and supportstructure different; Sharemotors and othercomponents.
Dash cover andstructure
52 4 7 123 48 3.8 6.5 120 Share some brackets andcomponents.
Electrical equipment 115 4 2.2 420 65 2 2.1 430 Share switches, wiring, andcentral module.
Cross car beam 12 2 2 35 12 2 2 35 Cross-car beam entirelydifferent.
Steering system andairbags
26 2 0.1 200 26 2 0.1 195 All components different.
Instruments andgauges
16 1 0.2 22 13 0.8 0.2 20 Can share someinstruments.
Molding and trim 10 0.4 0.2 11 10 0.4 0.2 10 All molding and trimdifferent.
Insulation 3 0.2 0.2 8 1 0.1 0 10 Change insulation in coupeto let in more engine noise.
Audio and radio 8 0.2 0 300 0 0 0 300 Same radio option in allvehicles.

29
Total 287 17.8 20.8 1321 210 14.9 18.5 1320

30
Exhibit 7: The relationship between Differentiating Attributes and Chunks.
DIfferentiating Attributes
incr
easi
ng v
alue
of v
arie
ty to
cus
tom
er
HV
AC
sys
tem
Das
hboa
rd c
over
and
stru
ctur
e
Ele
ctric
al e
quip
men
t
Cro
ss-c
ar b
eam
Ste
erin
g sy
stem
and
airb
ag
Inst
rum
ents
and
gaug
es
Mol
ding
and
trim
Insu
latio
n
Aud
io a
nd r
adio
Styling of instrument panel
Relationship between driverand instrument panel
Front-end styling
Colors and textures
Interior noise
Suspension stiffness
Curvature of window glass
Ch
un
ks
increasing cost of variety
critical few DAs and Chunks

31
Exhibit 8: The resulting design for the dashboard cover and structure and HVAC components.(Common components are shaded.) Components highly visible to the customer are differentiated;invisible components are common.

32
Exhibit 9: The revised Commonality Plan.
Sporty Coupe Family Sedan/Station Wagon
Instrument PanelChunks
No. ofuniqueparts
Devel.cost ($millions)
Toolingcost ($millions)
Mfg. Cost($)
No. ofuniqueparts
Devel.cost ($millions)
Toolingcost ($millions)
Mfg. Cost($) comments
HVAC system 45 4 9 196 8 0.4 0.5 195 Share all but ends of ducts.
Dash cover andstructure
52 4 7 123 48 3.8 6.5 120 All new shape andstructure for coupe.
Electrical equipment 115 4 2.2 412 30 0.5 0 415 Share wiring, controlmodule, and combinationswitch.
Cross car beam 12 2 2 33 1 0.2 0 33 Change horizontal beamlength.
Steering system andairbags
26 2 0.1 196 21 1.0 0 192 Change only steeringwheel and cover.
Instruments andgauges
16 1 0.2 22 13 0.8 0.2 20 Share gauge mechanisms.
Molding and trim 10 0.4 0.2 11 10 0.4 0.2 10 All molding and trim mustbe different.
Insulation 3 0.2 0.1 8 1 0.1 0 10 Change insulation in coupeto let in more engine noise.
Audio and radio 8 0.2 0 300 0 0 0 300 Same radio option in allvehicles.
Total 287 17.8 20.8 1301 132 7.2 7.4 1295

33