
Producing Usable Simulation Terrain Data from UAS ...ict.usc.edu/pubs/Producing Usable Simulation...
13
Interservice/Industry Training, Simulation, and Education Conference (I/ITSEC) 2016 2016 Paper No. 16069 Page 1 of 13 Producing Usable Simulation Terrain Data from UAS-Collected Imagery Ryan Spicer, Ryan McAlinden Damon Conover, Ph.D. USC – Institute for Creative Technologies Army Research Laboratory Los Angeles, CA Adelphi, MD {spicer, mcalinden}@ict.usc.edu [email protected] ABSTRACT At I/ITSEC 2015, we presented an approach to produce geo-referenced, highly-detailed (10cm or better) 3D models for an area of interest using imagery collected from cheap, commercial-off-the-shelf, multirotor Unmanned Aerial Systems (UAS). This paper discusses the next steps in making this data usable for modern-day game and simulation engines, specifically how it may be visually rendered, used and reasoned with by the physics system, the artificial intelligence (AI), the simulation entities, and other components. The pipeline begins by segmenting the georeferenced point cloud created by the UAS imagery into terrain (elevation data) and structures or objects, including vegetation, structures, roads and other surface features. Attributes such as slope and edge detection and color matching are used to perform segmentation and clustering. After the terrain and objects are segmented, they are exported into engine- agnostic formats (georeferenced GeoTIFF digital elevation model (DEM) and ground textures, OBJ/FBX mesh files and JPG textures), which serves as the basis for their representation in-engine. The data is then attributed with metadata used in reasoning – collision surfaces, navigation meshes/networks, apertures, physics attributes (line-of- sight, ray-tracing), material surfaces, and others. Finally, it is loaded into the engine for real-time processing during runtime. The pipeline has been tested with several engines, including Unity, VBS, Unreal and TitanIM. The paper discusses the pipeline from collection to rendering, and as well as how other market/commercially-derived data can serve as the foundation for M&S terrain in the future. Examples of the output of this research are available online (McAlinden, 2016). ABOUT THE AUTHORS Ryan Spicer is a Programmer Analyst at the University of Southern California’s Insti tute for Creative Technologies. At ICT, he supports simulation and training through applied research and advanced prototype systems development in mixed and virtual reality. Ryan holds a MA in Media Arts and Sciences from Arizona State University, and a BA in Film, Theater and Dance (Computing in the Arts Concentration) from Cornell University. In addition to his work at ICT, he is an active participant in the civilian Unmanned Aerial System space. Ryan McAlinden is the Director for Modeling, Simulation & Training at the University of Southern California’s Institute for Creative Technologies (USC-ICT). He rejoined ICT in 2013 after a three year post as a Senior Scientist at the NATO Communications & Information Agency (NCIA) in The Hague, Netherlands. There he led the provision of operational analysis support to the International Security Assistance Force (ISAF) Headquarters in Kabul, Afghanistan. Prior to joining NCIA, Ryan worked as a Computer Scientist and Project Director at USC-ICT from 2002 through 2009. He has a B.S. from Rutgers University and M.S. in computer science from USC. Damon Conover is a member of the Image Processing Branch at the U.S. Army Research Laboratory (ARL). At ARL, he develops data processing algorithms in support of 3D terrain visualization and imaging spectroscopy projects. Damon hold an B.S. in Electrical Engineering from Rose-Hulman Institute of Technology and earned his Ph.D. from George Washington University in 2015.
Transcript of Producing Usable Simulation Terrain Data from UAS ...ict.usc.edu/pubs/Producing Usable Simulation...

Interservice/Industry Training, Simulation, and Education Conference (I/ITSEC) 2016
2016 Paper No. 16069 Page 1 of 13
Producing Usable Simulation Terrain Data from UAS-Collected Imagery
Ryan Spicer, Ryan McAlinden Damon Conover, Ph.D.
USC – Institute for Creative Technologies Army Research Laboratory
Los Angeles, CA Adelphi, MD
{spicer, mcalinden}@ict.usc.edu [email protected]
ABSTRACT
At I/ITSEC 2015, we presented an approach to produce geo-referenced, highly-detailed (10cm or better) 3D models
for an area of interest using imagery collected from cheap, commercial-off-the-shelf, multirotor Unmanned Aerial
Systems (UAS). This paper discusses the next steps in making this data usable for modern-day game and simulation
engines, specifically how it may be visually rendered, used and reasoned with by the physics system, the artificial
intelligence (AI), the simulation entities, and other components. The pipeline begins by segmenting the georeferenced
point cloud created by the UAS imagery into terrain (elevation data) and structures or objects, including vegetation,
structures, roads and other surface features. Attributes such as slope and edge detection and color matching are used
to perform segmentation and clustering. After the terrain and objects are segmented, they are exported into engine-
agnostic formats (georeferenced GeoTIFF digital elevation model (DEM) and ground textures, OBJ/FBX mesh files
and JPG textures), which serves as the basis for their representation in-engine. The data is then attributed with
metadata used in reasoning – collision surfaces, navigation meshes/networks, apertures, physics attributes (line-of-
sight, ray-tracing), material surfaces, and others. Finally, it is loaded into the engine for real-time processing during
runtime. The pipeline has been tested with several engines, including Unity, VBS, Unreal and TitanIM. The paper
discusses the pipeline from collection to rendering, and as well as how other market/commercially-derived data can
serve as the foundation for M&S terrain in the future. Examples of the output of this research are available online
(McAlinden, 2016).
ABOUT THE AUTHORS
Ryan Spicer is a Programmer Analyst at the University of Southern California’s Institute for Creative Technologies.
At ICT, he supports simulation and training through applied research and advanced prototype systems development
in mixed and virtual reality. Ryan holds a MA in Media Arts and Sciences from Arizona State University, and a BA
in Film, Theater and Dance (Computing in the Arts Concentration) from Cornell University. In addition to his work
at ICT, he is an active participant in the civilian Unmanned Aerial System space.
Ryan McAlinden is the Director for Modeling, Simulation & Training at the University of Southern California’s
Institute for Creative Technologies (USC-ICT). He rejoined ICT in 2013 after a three year post as a Senior Scientist
at the NATO Communications & Information Agency (NCIA) in The Hague, Netherlands. There he led the provision
of operational analysis support to the International Security Assistance Force (ISAF) Headquarters in Kabul,
Afghanistan. Prior to joining NCIA, Ryan worked as a Computer Scientist and Project Director at USC-ICT from
2002 through 2009. He has a B.S. from Rutgers University and M.S. in computer science from USC.
Damon Conover is a member of the Image Processing Branch at the U.S. Army Research Laboratory (ARL). At
ARL, he develops data processing algorithms in support of 3D terrain visualization and imaging spectroscopy projects.
Damon hold an B.S. in Electrical Engineering from Rose-Hulman Institute of Technology and earned his Ph.D. from
George Washington University in 2015.
Interservice/Industry Training, Simulation, and Education Conference (I/ITSEC) 2016
2016 Paper No. 16069 Page 2 of 13
Producing Usable Simulation Terrain Data from UAS-Collected Imagery
Ryan Spicer, Ryan McAlinden Damon Conover, Ph.D.
USC – Institute for Creative Technologies Army Research Laboratory
Los Angeles, CA Adelphi, MD
{spicer, mcalinden}@ict.usc.edu [email protected]
INTRODUCTION
As recently as one year ago it required a TS/SCI clearance to access 30-cm satellite imagery. However, after the
launching of DigitalGlobe WorldView3 in late 2014 (and the upcoming WorldView4 in September 2016), virtually
anyone with a credit card can access such data. Though this example is an oversimplification, it drives the point that
certain data that was once allusive and confined to a select group of individuals and organizations is increasingly
becoming a commodity. Additionally, new, alternative sources for terrain data have appeared and are ripe for
exploitation by the modeling, simulation and training communities. Examples include social media, open-source and
crowd-sourced information feeds (RSS, Open Street Maps, Twitter, Google Earth), as well as government-collected
data available on the open marketplace (NASA SRTM2 elevation data). The traditional aerial imaging market has
also been upended with the advancement of air platforms, camera systems, optics, batteries and storage. In the past,
capturing the most rudimentary picture from an aircraft often required significant money ($10,000s) and long lead
times to produce. Now one can purchase a $500 off-the-shelf drone, and autonomously fly and collect that same data
in a matter of hours. This research centers around these newer sources of collection and associated terrain data, which
even a few years ago would have been cost prohibitive or technically infeasible.
One such example is commercial/off-the-shelf (COTS) Unmanned Aerial System (UAS) technology, which is
increasingly capable, easy to use, available, and competitively priced. And with the new Federal Aviation
Administration (FAA) 107 Regulations enacted in August 2016, the ability to fly UAS for non-hobbyist purposes
(commercial, academic, research) has been made exponentially less cumbersome. With this will come rapid and
beneficial advancements in aircraft design, batteries, imaging and other capabilities that M&S has the opportunity to
exploit. This particular paper describes a work-flow to leverage these assets for rapid development of simulation-ready
terrain assets from data captured in the field. We build on our earlier work in this area (McAlinden et al, 2015) and
describe our current pipeline and its applications in simulation and training both within the research and development
communities, as well as operational use cases. We describe the capability for small units (fire teams, squads) with an
organic asset such as handheld and launched UAS that allows them to define an Area of Interest (AOI), autonomously
fly the aircraft to capture the required imagery, reconstruct the terrain features including elevation, structures,
vegetation, and leverage this data for mission rehearsal, simulation, and enhancing situational awareness.
DATA COLLECTION FOR PHOTOGRAMMETRY
3D models of terrain can be developed from many sources, including airborne or ground-based LIDAR, manual
creation by artists, or photogrammetry. Photogrammetry, the 3D reconstruction of an area from images, provides
advantages relative to LIDAR, which is often more expensive, time-consuming, and physically more demanding. In
photogrammetry, a structure-from-motion (SFM) algorithm is used to reconstruct the geometry of a static scene, given
a moving camera perspective. Photogrammetry does not require emitting energy (unlike LIDAR), which offers
obvious advantages in the context of defense missions, as well as reduced power and weight requirements.

Interservice/Industry Training, Simulation, and Education Conference (I/ITSEC) 2016
2016 Paper No. 16069 Page 3 of 13
Photogrammetry requires at least three images of a given feature from different positions and orientations to
reconstruct that point in 3D space (Figure 1). Industry guidelines (Mikhail et al, 2001; Bohlin et al, 2012) suggest that
images used for photogrammetry should have 60% or greater overlap to maximize the quality of the reconstruction.
Since the 3D structure of the terrain and objects is reconstructed entirely from the images, it is necessary to have
coverage of any part of the environment that needs to be included – algorithms cannot generate surface detail for areas
that are not imaged from at least two (preferably many more) perspectives. The resolution of the final reconstruction
is a function of the sensor system resolution, field of view, and platform altitude above the surface to be reconstructed,
and results in tradeoffs between speed of data acquisition and detail level of the reconstruction.
Many contemporary Commercial, Off-the-Shelf (COTS) UAS platforms allow waypoint flying, an operating mode
where the user uploads a list of geographic locations and altitudes to the platform, which then executes the mission by
flying through the designated points. Our initial investigations into photogrammetry (McAlinden et al, 2015) utilized
manually-developed flight plans, where each waypoint was manually plotted. This process is laborious and time-
consuming. Additionally, since the control software used by the DJI Phantom 2 platform did not allow precision entry
of waypoints, positions needed to be “eyeballed,” making the process error-prone and inconsistent even with a skilled
operator. To improve data collection quality and to reduce the training required to successfully use the terrain
reconstruction pipeline, an automated approach was desired.
Contemporary platforms such as the DJI Phantom 3 and DJI Phantom 4 include integration with the imaging system
and gimbal, allowing the development of flight plans that specify geographic waypoints, gimbal pitch, and imaging
requirements (ISO, white balance, shutter timing). DJI also offers a Mobile Software Development Kit (SDK) that
permits developers to interact with the UAS platform via Android or iOS mobile devices. Similar SDKs exist for other
control systems such as MAVLink, an open UAS control protocol used by many open-source UAS autopilot systems.
Commercial photogrammetry applications exist for these systems, but do not meet the challenging needs of large-area
semi-autonomous capture. For large areas, data acquisition may span multiple flights and benefit from different
approaches depending on the mission requirements.
Note that FAA regulations currently limit operations of UAS for commercial purposes, including research, in the
national aerospace system. Commercial UAS operation requires either a 333 Exemption or a full Certificate of
Airworthiness for the platform. For the purposes of this research, a 333 Exemption was acquired and the UAS was
operated in compliance with the specific language of this exemption. Data collection on base installations (Ft. Irwin,
Camp Pendleton, MCAGCC Twentynine Palms) was conducted with the permission and approval of the controlling
entity.
Rapid Aerial PhoTogrammetric Reconstruction System – RAPTRS
ICT has developed for the Army a Rapid Aerial PhoTogrammetric Reconstruction System (RAPTRS), an Android
application (Figure 2). The application encodes our acquired knowledge of photogrammetry best practices in a
straightforward user interface (UI). While other photogrammetry planning and remote control software exists,
RAPTRS is designed to allow for imaging larger areas across multiple flights, and provides controls useful for
producing 3D representations of terrain required for game and simulation-based platforms. The application uses DJI’s
Mobile SDK 3.2 to control a DJI UAS and execute the planned mission from takeoff to touchdown.
Figure 1. Multiple aerial photographs of a pedestrian overpass. These images are representative; over 100
photos including this structure contributed to the reconstruction.
Interservice/Industry Training, Simulation, and Education Conference (I/ITSEC) 2016
2016 Paper No. 16069 Page 4 of 13
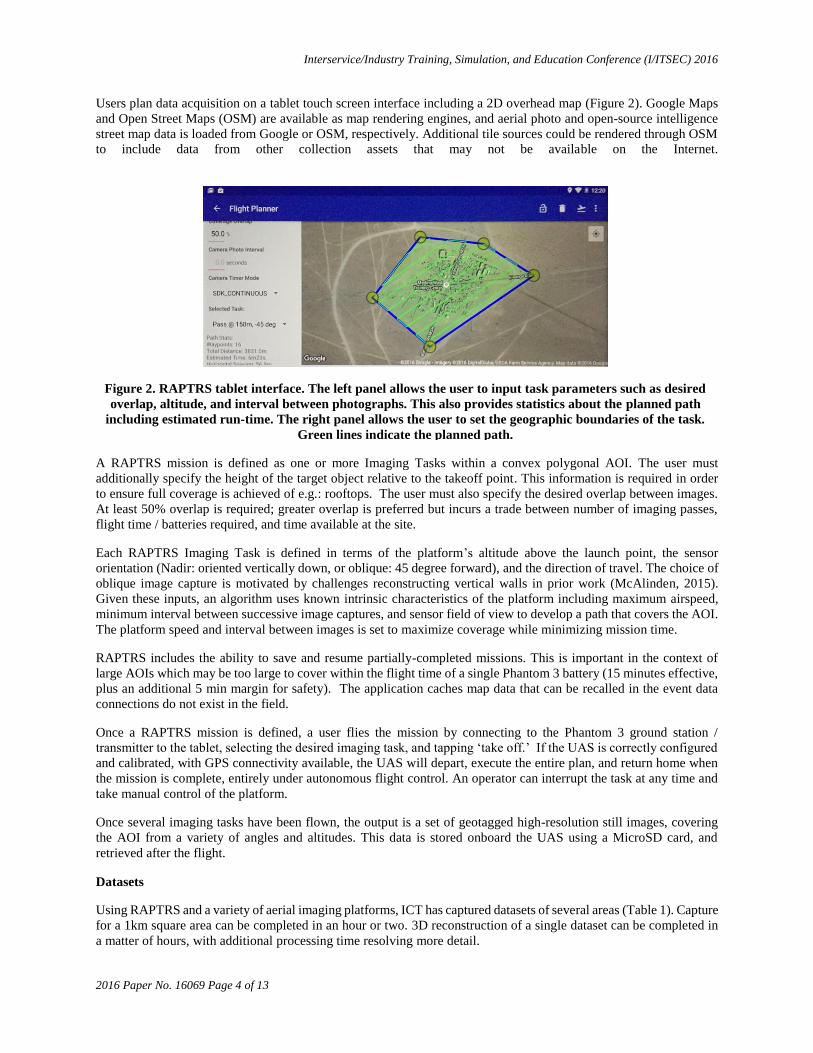
Users plan data acquisition on a tablet touch screen interface including a 2D overhead map (Figure 2). Google Maps
and Open Street Maps (OSM) are available as map rendering engines, and aerial photo and open-source intelligence
street map data is loaded from Google or OSM, respectively. Additional tile sources could be rendered through OSM
to include data from other collection assets that may not be available on the Internet.
A RAPTRS mission is defined as one or more Imaging Tasks within a convex polygonal AOI. The user must
additionally specify the height of the target object relative to the takeoff point. This information is required in order
to ensure full coverage is achieved of e.g.: rooftops. The user must also specify the desired overlap between images.
At least 50% overlap is required; greater overlap is preferred but incurs a trade between number of imaging passes,
flight time / batteries required, and time available at the site.
Each RAPTRS Imaging Task is defined in terms of the platform’s altitude above the launch point, the sensor
orientation (Nadir: oriented vertically down, or oblique: 45 degree forward), and the direction of travel. The choice of
oblique image capture is motivated by challenges reconstructing vertical walls in prior work (McAlinden, 2015).
Given these inputs, an algorithm uses known intrinsic characteristics of the platform including maximum airspeed,
minimum interval between successive image captures, and sensor field of view to develop a path that covers the AOI.
The platform speed and interval between images is set to maximize coverage while minimizing mission time.
RAPTRS includes the ability to save and resume partially-completed missions. This is important in the context of
large AOIs which may be too large to cover within the flight time of a single Phantom 3 battery (15 minutes effective,
plus an additional 5 min margin for safety). The application caches map data that can be recalled in the event data
connections do not exist in the field.
Once a RAPTRS mission is defined, a user flies the mission by connecting to the Phantom 3 ground station /
transmitter to the tablet, selecting the desired imaging task, and tapping ‘take off.’ If the UAS is correctly configured
and calibrated, with GPS connectivity available, the UAS will depart, execute the entire plan, and return home when
the mission is complete, entirely under autonomous flight control. An operator can interrupt the task at any time and
take manual control of the platform.
Once several imaging tasks have been flown, the output is a set of geotagged high-resolution still images, covering
the AOI from a variety of angles and altitudes. This data is stored onboard the UAS using a MicroSD card, and
retrieved after the flight.
Datasets
Using RAPTRS and a variety of aerial imaging platforms, ICT has captured datasets of several areas (Table 1). Capture
for a 1km square area can be completed in an hour or two. 3D reconstruction of a single dataset can be completed in
a matter of hours, with additional processing time resolving more detail.
Figure 2. RAPTRS tablet interface. The left panel allows the user to input task parameters such as desired
overlap, altitude, and interval between photographs. This also provides statistics about the planned path
including estimated run-time. The right panel allows the user to set the geographic boundaries of the task.
Green lines indicate the planned path.
Interservice/Industry Training, Simulation, and Education Conference (I/ITSEC) 2016
2016 Paper No. 16069 Page 5 of 13
Table 1. Terrain datasets captured.
Area Photo Count Platform
St. Louis Metro Area 3300 Manned aircraft + aerial photography system.
Echo Park Neighborhood, Los Angeles 505 Phantom 2 + GoPro Hero 3 Black
National Training Center Tiefort 1268 Phantom 2 + GoPro Hero 3 Black
National Training Center Medina Wasl 900 Phantom 3 Professional w/ RAPTRS
Twentynine Palms Range 400 835 Phantom 3 Advanced w/ RAPTRS
Camp Pendleton IIT 1421 Phantom 3 Advanced w/ RAPTRS
University of Southern California University
Park Campus
1322 Phantom 3 Advanced w/ RAPTRS
CREATION OF TERRAIN ASSETS BASED ON PHOTOGRAMMETRY
Once raw visual-spectrum photographic data is acquired through RAPTRS or another acquisition system, post-
processing must be performed to prepare the data for use in a real time 3D rendering system and assign meaningful
properties to the virtual environment. A high-density point cloud must be generated. The point cloud must be converted
into meshes, and texture data must be generated. The textures and meshes must then be down-sampled to a density
and resolution appropriate for use in real-time rendered graphics. We present an overview of our current pipeline,
which combines commercial software and tools developed specifically for this research.
Point Cloud Creation
A point cloud is a data structure containing information about a collection of points in three-dimensional space. The
point cloud does not contain data about any surface that may be defined by the points, but may contain additional per-
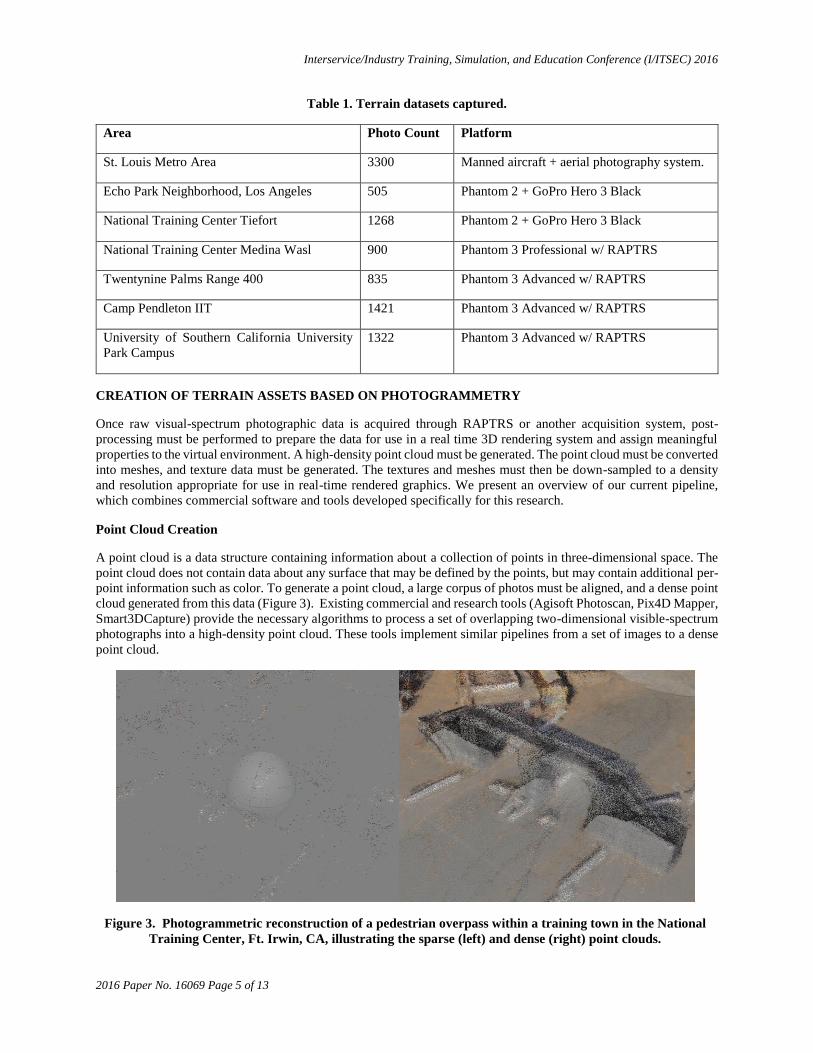
point information such as color. To generate a point cloud, a large corpus of photos must be aligned, and a dense point
cloud generated from this data (Figure 3). Existing commercial and research tools (Agisoft Photoscan, Pix4D Mapper,
Smart3DCapture) provide the necessary algorithms to process a set of overlapping two-dimensional visible-spectrum
photographs into a high-density point cloud. These tools implement similar pipelines from a set of images to a dense
point cloud.
Figure 3. Photogrammetric reconstruction of a pedestrian overpass within a training town in the National
Training Center, Ft. Irwin, CA, illustrating the sparse (left) and dense (right) point clouds.
Interservice/Industry Training, Simulation, and Education Conference (I/ITSEC) 2016
2016 Paper No. 16069 Page 6 of 13
Each photograph is analyzed individually to identify recognizable image features. An algorithm such as Scale
Invariant Feature Transforms (SIFT) (Lowe, 1999; Lowe, 2004) or Speeded Up Robust Features (SURF) (Bay et al,
2006) is generally used in this step, since these algorithms produce feature descriptors that remain consistent across
images when the camera moves relative to the target scene. These image features points are then correlated across
multiple images. Similarity metrics are used to determine when a feature point appears in multiple images. External
data including geotags embedded in image EXIF metadata may be used to constrain the search space for correlation.
These correlated points are termed “tie points,” and successful point cloud reconstruction requires on the order of tens
of thousands of tie points.
Once tie points are established, the three-dimensional location and orientation of the camera for each photograph is
determined using a bundle adjustment algorithm. This algorithm attempts to optimize the placement of each camera
position such that error across all tie points is minimized. The aligned images and known tie points are then used to
reconstruct a dense point cloud. This process fills in the majority of spatial data by projecting back through the camera
model to determine the depth of each pixel in each source image. The output of this pipeline is a dense point cloud
and a set of aligned photographs. In the context of simulation and game-engine based tools, point cloud data is more
useful when converted to meshes and/or height maps, which can be used in the underlying engine.
Mesh and Digital Elevation Model Creation
Real time 3D simulation engines typically do not
operate on raw point clouds. These applications,
instead, require meshes and digital elevation models
(DEMs) or heightmaps, which encode data about
the surface of the terrain and objects and structures
on the terrain in a format that is efficient to operate
on for rendering.
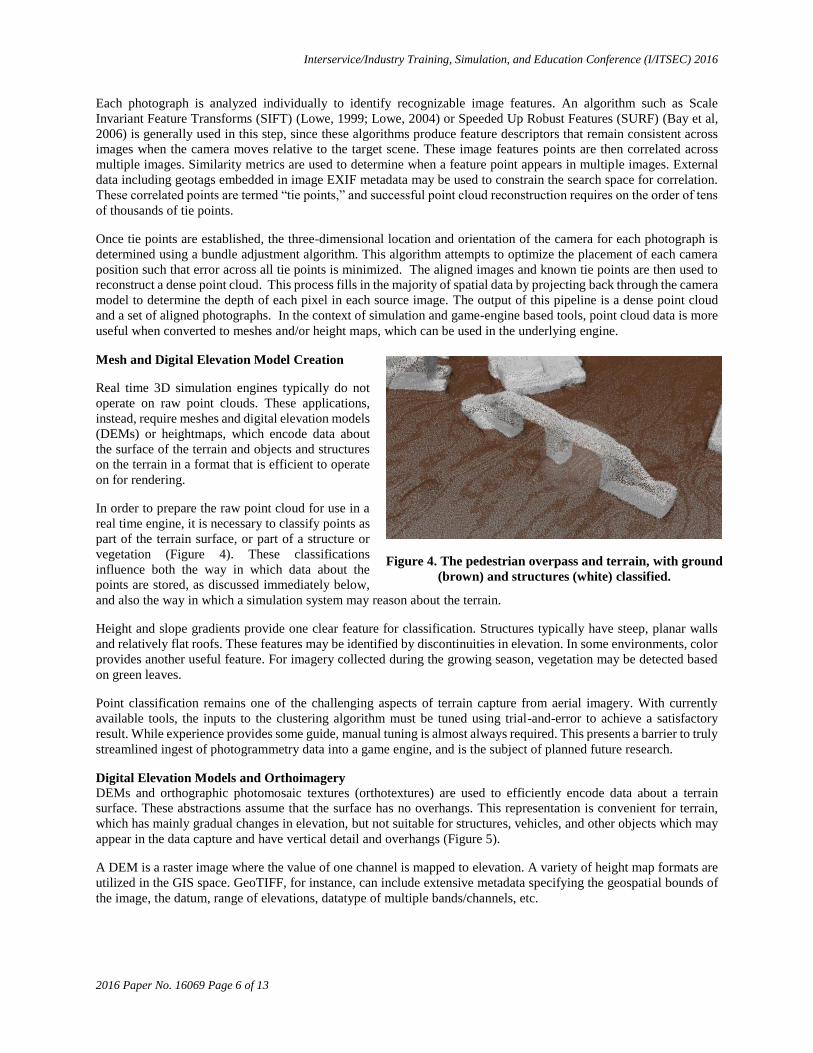
In order to prepare the raw point cloud for use in a
real time engine, it is necessary to classify points as
part of the terrain surface, or part of a structure or
vegetation (Figure 4). These classifications
influence both the way in which data about the
points are stored, as discussed immediately below,
and also the way in which a simulation system may reason about the terrain.
Height and slope gradients provide one clear feature for classification. Structures typically have steep, planar walls
and relatively flat roofs. These features may be identified by discontinuities in elevation. In some environments, color
provides another useful feature. For imagery collected during the growing season, vegetation may be detected based
on green leaves.
Point classification remains one of the challenging aspects of terrain capture from aerial imagery. With currently
available tools, the inputs to the clustering algorithm must be tuned using trial-and-error to achieve a satisfactory
result. While experience provides some guide, manual tuning is almost always required. This presents a barrier to truly
streamlined ingest of photogrammetry data into a game engine, and is the subject of planned future research.
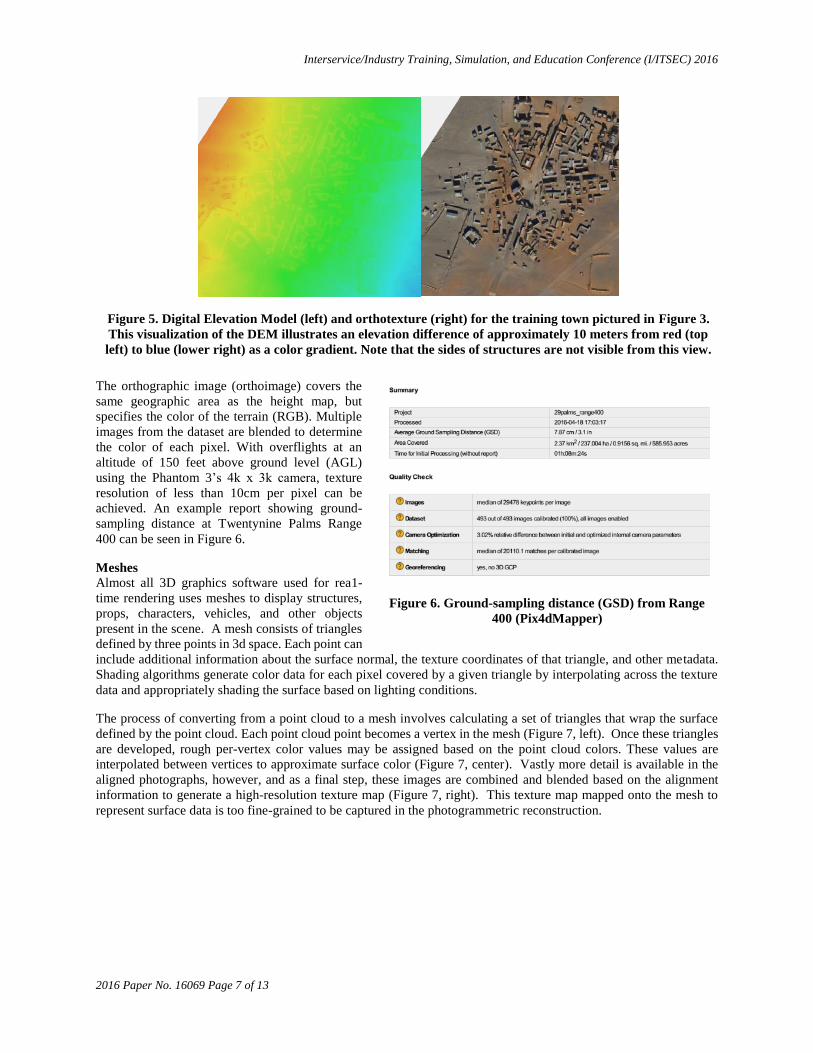
Digital Elevation Models and Orthoimagery
DEMs and orthographic photomosaic textures (orthotextures) are used to efficiently encode data about a terrain
surface. These abstractions assume that the surface has no overhangs. This representation is convenient for terrain,
which has mainly gradual changes in elevation, but not suitable for structures, vehicles, and other objects which may
appear in the data capture and have vertical detail and overhangs (Figure 5).
A DEM is a raster image where the value of one channel is mapped to elevation. A variety of height map formats are
utilized in the GIS space. GeoTIFF, for instance, can include extensive metadata specifying the geospatial bounds of
the image, the datum, range of elevations, datatype of multiple bands/channels, etc.
Figure 4. The pedestrian overpass and terrain, with ground
(brown) and structures (white) classified.
Interservice/Industry Training, Simulation, and Education Conference (I/ITSEC) 2016
2016 Paper No. 16069 Page 7 of 13
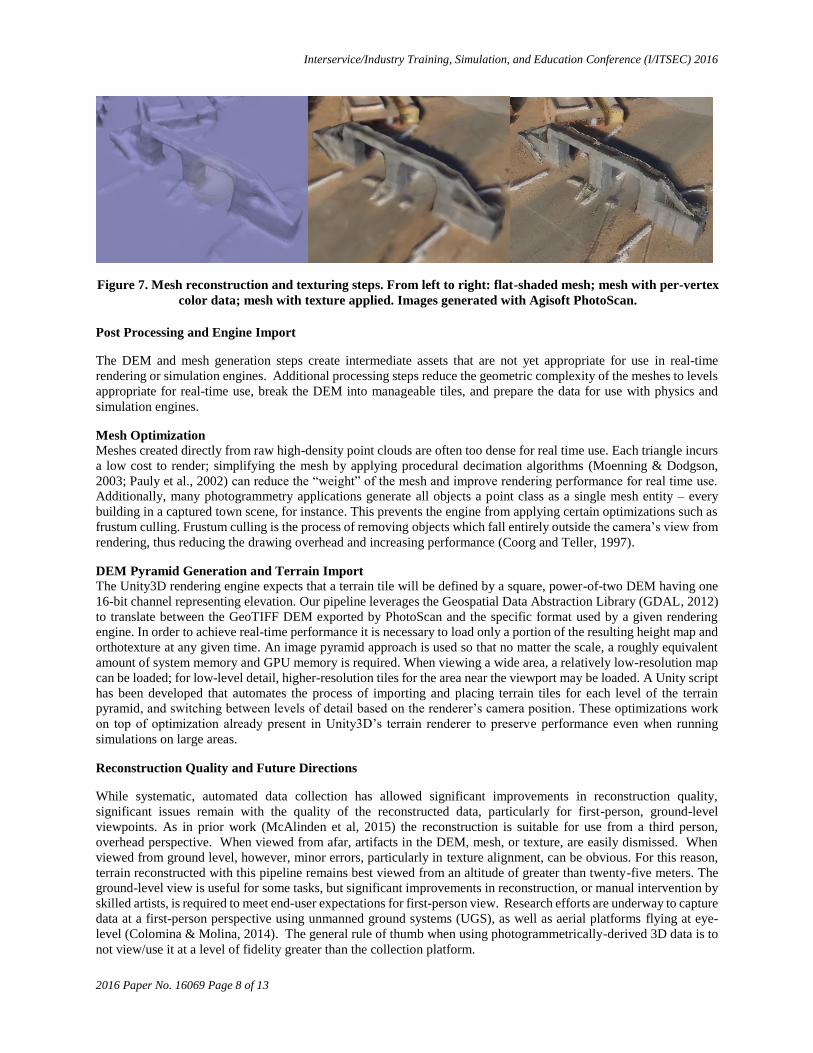
The orthographic image (orthoimage) covers the
same geographic area as the height map, but
specifies the color of the terrain (RGB). Multiple
images from the dataset are blended to determine
the color of each pixel. With overflights at an
altitude of 150 feet above ground level (AGL)
using the Phantom 3’s 4k x 3k camera, texture
resolution of less than 10cm per pixel can be
achieved. An example report showing ground-
sampling distance at Twentynine Palms Range
400 can be seen in Figure 6.
Meshes
Almost all 3D graphics software used for rea1-
time rendering uses meshes to display structures,
props, characters, vehicles, and other objects
present in the scene. A mesh consists of triangles
defined by three points in 3d space. Each point can
include additional information about the surface normal, the texture coordinates of that triangle, and other metadata.
Shading algorithms generate color data for each pixel covered by a given triangle by interpolating across the texture
data and appropriately shading the surface based on lighting conditions.
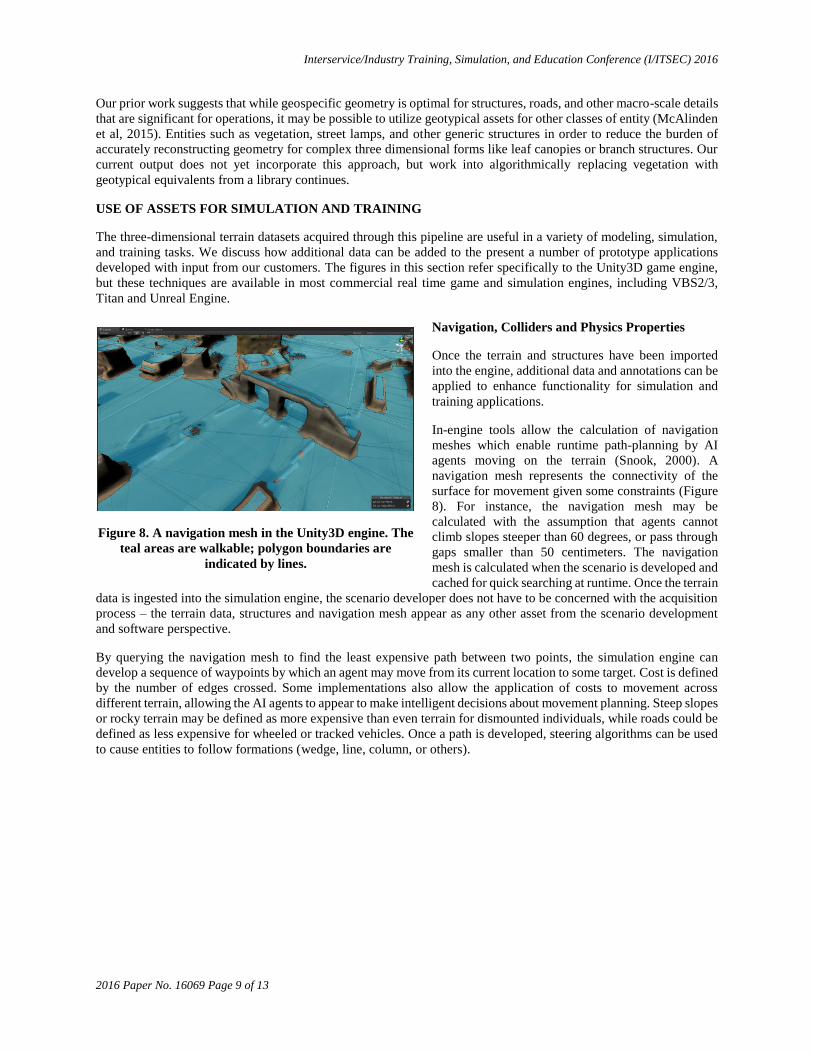
The process of converting from a point cloud to a mesh involves calculating a set of triangles that wrap the surface
defined by the point cloud. Each point cloud point becomes a vertex in the mesh (Figure 7, left). Once these triangles
are developed, rough per-vertex color values may be assigned based on the point cloud colors. These values are
interpolated between vertices to approximate surface color (Figure 7, center). Vastly more detail is available in the
aligned photographs, however, and as a final step, these images are combined and blended based on the alignment
information to generate a high-resolution texture map (Figure 7, right). This texture map mapped onto the mesh to
represent surface data is too fine-grained to be captured in the photogrammetric reconstruction.
Figure 5. Digital Elevation Model (left) and orthotexture (right) for the training town pictured in Figure 3.
This visualization of the DEM illustrates an elevation difference of approximately 10 meters from red (top
left) to blue (lower right) as a color gradient. Note that the sides of structures are not visible from this view.
Figure 6. Ground-sampling distance (GSD) from Range
400 (Pix4dMapper)
Interservice/Industry Training, Simulation, and Education Conference (I/ITSEC) 2016
2016 Paper No. 16069 Page 8 of 13
Post Processing and Engine Import
The DEM and mesh generation steps create intermediate assets that are not yet appropriate for use in real-time
rendering or simulation engines. Additional processing steps reduce the geometric complexity of the meshes to levels
appropriate for real-time use, break the DEM into manageable tiles, and prepare the data for use with physics and
simulation engines.
Mesh Optimization
Meshes created directly from raw high-density point clouds are often too dense for real time use. Each triangle incurs
a low cost to render; simplifying the mesh by applying procedural decimation algorithms (Moenning & Dodgson,
2003; Pauly et al., 2002) can reduce the “weight” of the mesh and improve rendering performance for real time use.
Additionally, many photogrammetry applications generate all objects a point class as a single mesh entity – every
building in a captured town scene, for instance. This prevents the engine from applying certain optimizations such as
frustum culling. Frustum culling is the process of removing objects which fall entirely outside the camera’s view from
rendering, thus reducing the drawing overhead and increasing performance (Coorg and Teller, 1997).
DEM Pyramid Generation and Terrain Import
The Unity3D rendering engine expects that a terrain tile will be defined by a square, power-of-two DEM having one
16-bit channel representing elevation. Our pipeline leverages the Geospatial Data Abstraction Library (GDAL, 2012)
to translate between the GeoTIFF DEM exported by PhotoScan and the specific format used by a given rendering
engine. In order to achieve real-time performance it is necessary to load only a portion of the resulting height map and
orthotexture at any given time. An image pyramid approach is used so that no matter the scale, a roughly equivalent
amount of system memory and GPU memory is required. When viewing a wide area, a relatively low-resolution map
can be loaded; for low-level detail, higher-resolution tiles for the area near the viewport may be loaded. A Unity script
has been developed that automates the process of importing and placing terrain tiles for each level of the terrain
pyramid, and switching between levels of detail based on the renderer’s camera position. These optimizations work
on top of optimization already present in Unity3D’s terrain renderer to preserve performance even when running
simulations on large areas.
Reconstruction Quality and Future Directions
While systematic, automated data collection has allowed significant improvements in reconstruction quality,
significant issues remain with the quality of the reconstructed data, particularly for first-person, ground-level
viewpoints. As in prior work (McAlinden et al, 2015) the reconstruction is suitable for use from a third person,
overhead perspective. When viewed from afar, artifacts in the DEM, mesh, or texture, are easily dismissed. When
viewed from ground level, however, minor errors, particularly in texture alignment, can be obvious. For this reason,
terrain reconstructed with this pipeline remains best viewed from an altitude of greater than twenty-five meters. The
ground-level view is useful for some tasks, but significant improvements in reconstruction, or manual intervention by
skilled artists, is required to meet end-user expectations for first-person view. Research efforts are underway to capture
data at a first-person perspective using unmanned ground systems (UGS), as well as aerial platforms flying at eye-
level (Colomina & Molina, 2014). The general rule of thumb when using photogrammetrically-derived 3D data is to
not view/use it at a level of fidelity greater than the collection platform.
Figure 7. Mesh reconstruction and texturing steps. From left to right: flat-shaded mesh; mesh with per-vertex
color data; mesh with texture applied. Images generated with Agisoft PhotoScan.
Interservice/Industry Training, Simulation, and Education Conference (I/ITSEC) 2016
2016 Paper No. 16069 Page 9 of 13
Our prior work suggests that while geospecific geometry is optimal for structures, roads, and other macro-scale details
that are significant for operations, it may be possible to utilize geotypical assets for other classes of entity (McAlinden
et al, 2015). Entities such as vegetation, street lamps, and other generic structures in order to reduce the burden of
accurately reconstructing geometry for complex three dimensional forms like leaf canopies or branch structures. Our
current output does not yet incorporate this approach, but work into algorithmically replacing vegetation with
geotypical equivalents from a library continues.
USE OF ASSETS FOR SIMULATION AND TRAINING
The three-dimensional terrain datasets acquired through this pipeline are useful in a variety of modeling, simulation,
and training tasks. We discuss how additional data can be added to the present a number of prototype applications
developed with input from our customers. The figures in this section refer specifically to the Unity3D game engine,
but these techniques are available in most commercial real time game and simulation engines, including VBS2/3,
Titan and Unreal Engine.
Navigation, Colliders and Physics Properties
Once the terrain and structures have been imported
into the engine, additional data and annotations can be
applied to enhance functionality for simulation and
training applications.
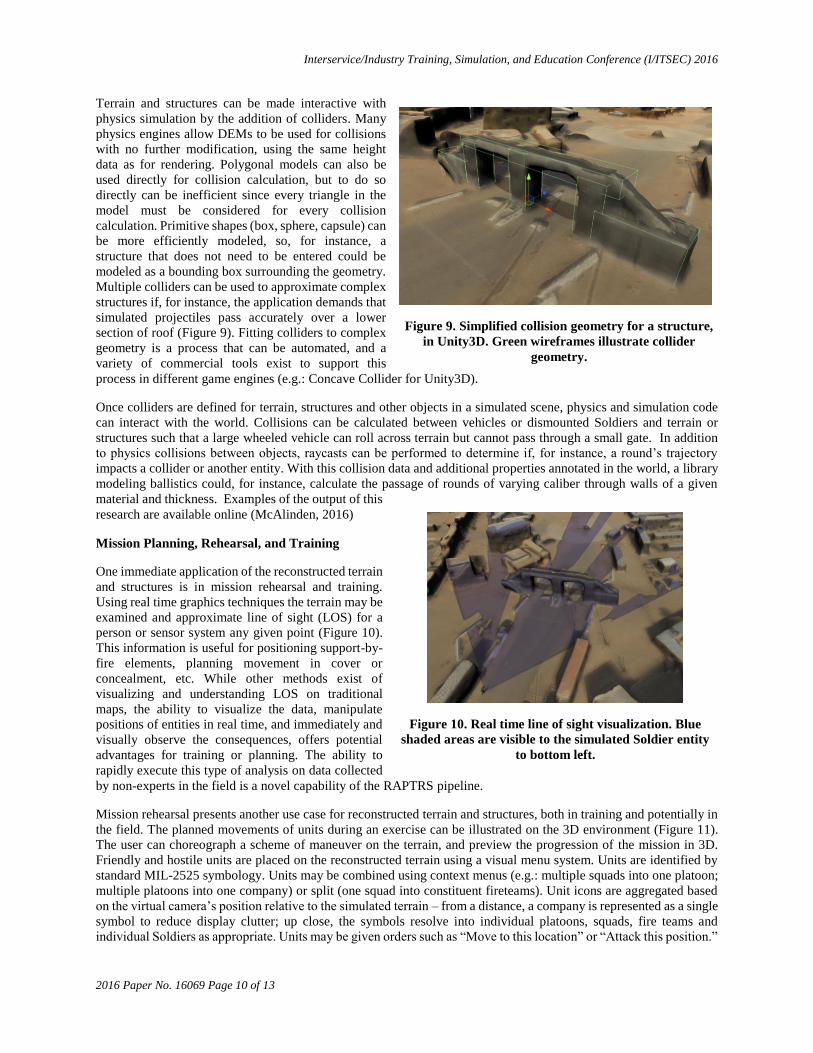
In-engine tools allow the calculation of navigation
meshes which enable runtime path-planning by AI
agents moving on the terrain (Snook, 2000). A
navigation mesh represents the connectivity of the
surface for movement given some constraints (Figure
8). For instance, the navigation mesh may be
calculated with the assumption that agents cannot
climb slopes steeper than 60 degrees, or pass through
gaps smaller than 50 centimeters. The navigation
mesh is calculated when the scenario is developed and
cached for quick searching at runtime. Once the terrain
data is ingested into the simulation engine, the scenario developer does not have to be concerned with the acquisition
process – the terrain data, structures and navigation mesh appear as any other asset from the scenario development
and software perspective.
By querying the navigation mesh to find the least expensive path between two points, the simulation engine can
develop a sequence of waypoints by which an agent may move from its current location to some target. Cost is defined
by the number of edges crossed. Some implementations also allow the application of costs to movement across
different terrain, allowing the AI agents to appear to make intelligent decisions about movement planning. Steep slopes
or rocky terrain may be defined as more expensive than even terrain for dismounted individuals, while roads could be
defined as less expensive for wheeled or tracked vehicles. Once a path is developed, steering algorithms can be used
to cause entities to follow formations (wedge, line, column, or others).
Figure 8. A navigation mesh in the Unity3D engine. The
teal areas are walkable; polygon boundaries are
indicated by lines.
Interservice/Industry Training, Simulation, and Education Conference (I/ITSEC) 2016
2016 Paper No. 16069 Page 10 of 13
Terrain and structures can be made interactive with
physics simulation by the addition of colliders. Many
physics engines allow DEMs to be used for collisions
with no further modification, using the same height
data as for rendering. Polygonal models can also be
used directly for collision calculation, but to do so
directly can be inefficient since every triangle in the
model must be considered for every collision
calculation. Primitive shapes (box, sphere, capsule) can
be more efficiently modeled, so, for instance, a
structure that does not need to be entered could be
modeled as a bounding box surrounding the geometry.
Multiple colliders can be used to approximate complex
structures if, for instance, the application demands that
simulated projectiles pass accurately over a lower
section of roof (Figure 9). Fitting colliders to complex
geometry is a process that can be automated, and a
variety of commercial tools exist to support this
process in different game engines (e.g.: Concave Collider for Unity3D).
Once colliders are defined for terrain, structures and other objects in a simulated scene, physics and simulation code
can interact with the world. Collisions can be calculated between vehicles or dismounted Soldiers and terrain or
structures such that a large wheeled vehicle can roll across terrain but cannot pass through a small gate. In addition
to physics collisions between objects, raycasts can be performed to determine if, for instance, a round’s trajectory
impacts a collider or another entity. With this collision data and additional properties annotated in the world, a library
modeling ballistics could, for instance, calculate the passage of rounds of varying caliber through walls of a given
material and thickness. Examples of the output of this
research are available online (McAlinden, 2016)
Mission Planning, Rehearsal, and Training
One immediate application of the reconstructed terrain
and structures is in mission rehearsal and training.
Using real time graphics techniques the terrain may be
examined and approximate line of sight (LOS) for a
person or sensor system any given point (Figure 10).
This information is useful for positioning support-by-
fire elements, planning movement in cover or
concealment, etc. While other methods exist of
visualizing and understanding LOS on traditional
maps, the ability to visualize the data, manipulate
positions of entities in real time, and immediately and
visually observe the consequences, offers potential
advantages for training or planning. The ability to
rapidly execute this type of analysis on data collected
by non-experts in the field is a novel capability of the RAPTRS pipeline.
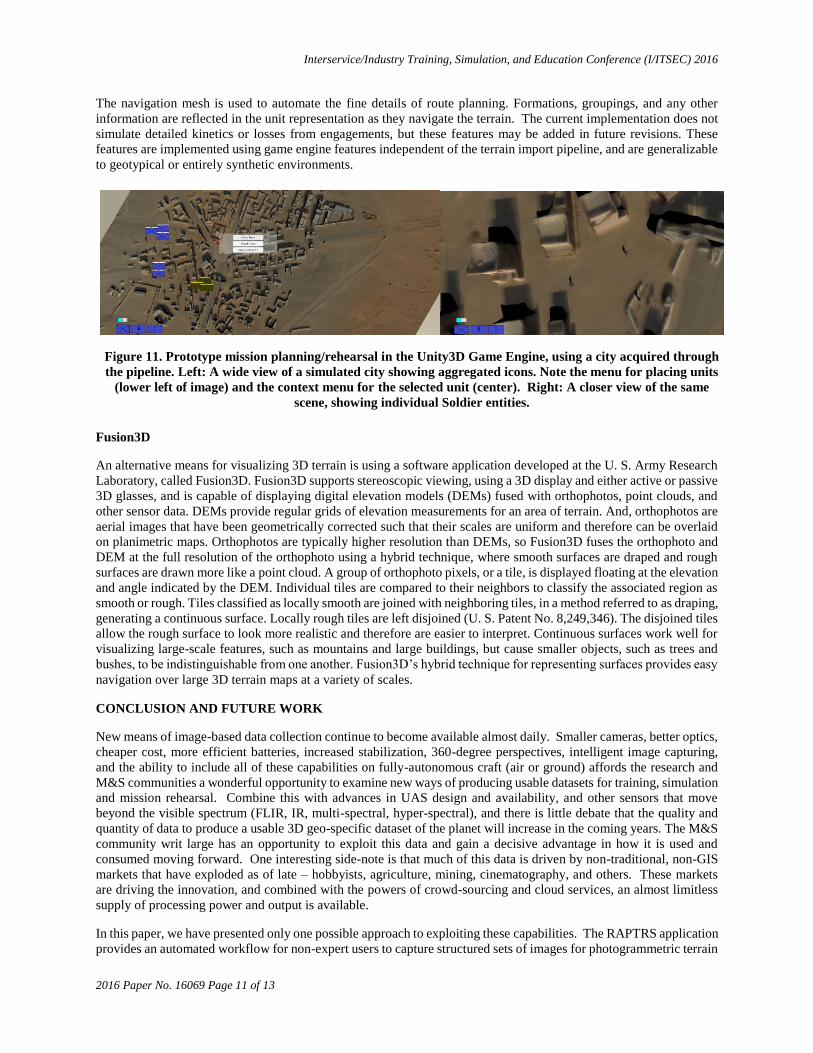
Mission rehearsal presents another use case for reconstructed terrain and structures, both in training and potentially in
the field. The planned movements of units during an exercise can be illustrated on the 3D environment (Figure 11).
The user can choreograph a scheme of maneuver on the terrain, and preview the progression of the mission in 3D.
Friendly and hostile units are placed on the reconstructed terrain using a visual menu system. Units are identified by
standard MIL-2525 symbology. Units may be combined using context menus (e.g.: multiple squads into one platoon;
multiple platoons into one company) or split (one squad into constituent fireteams). Unit icons are aggregated based
on the virtual camera’s position relative to the simulated terrain – from a distance, a company is represented as a single
symbol to reduce display clutter; up close, the symbols resolve into individual platoons, squads, fire teams and
individual Soldiers as appropriate. Units may be given orders such as “Move to this location” or “Attack this position.”
Figure 9. Simplified collision geometry for a structure,
in Unity3D. Green wireframes illustrate collider
geometry.
Figure 10. Real time line of sight visualization. Blue
shaded areas are visible to the simulated Soldier entity
to bottom left.
Interservice/Industry Training, Simulation, and Education Conference (I/ITSEC) 2016
2016 Paper No. 16069 Page 11 of 13
The navigation mesh is used to automate the fine details of route planning. Formations, groupings, and any other
information are reflected in the unit representation as they navigate the terrain. The current implementation does not
simulate detailed kinetics or losses from engagements, but these features may be added in future revisions. These
features are implemented using game engine features independent of the terrain import pipeline, and are generalizable
to geotypical or entirely synthetic environments.
Fusion3D
An alternative means for visualizing 3D terrain is using a software application developed at the U. S. Army Research
Laboratory, called Fusion3D. Fusion3D supports stereoscopic viewing, using a 3D display and either active or passive
3D glasses, and is capable of displaying digital elevation models (DEMs) fused with orthophotos, point clouds, and
other sensor data. DEMs provide regular grids of elevation measurements for an area of terrain. And, orthophotos are
aerial images that have been geometrically corrected such that their scales are uniform and therefore can be overlaid
on planimetric maps. Orthophotos are typically higher resolution than DEMs, so Fusion3D fuses the orthophoto and
DEM at the full resolution of the orthophoto using a hybrid technique, where smooth surfaces are draped and rough
surfaces are drawn more like a point cloud. A group of orthophoto pixels, or a tile, is displayed floating at the elevation
and angle indicated by the DEM. Individual tiles are compared to their neighbors to classify the associated region as
smooth or rough. Tiles classified as locally smooth are joined with neighboring tiles, in a method referred to as draping,
generating a continuous surface. Locally rough tiles are left disjoined (U. S. Patent No. 8,249,346). The disjoined tiles
allow the rough surface to look more realistic and therefore are easier to interpret. Continuous surfaces work well for
visualizing large-scale features, such as mountains and large buildings, but cause smaller objects, such as trees and
bushes, to be indistinguishable from one another. Fusion3D’s hybrid technique for representing surfaces provides easy
navigation over large 3D terrain maps at a variety of scales.
CONCLUSION AND FUTURE WORK
New means of image-based data collection continue to become available almost daily. Smaller cameras, better optics,
cheaper cost, more efficient batteries, increased stabilization, 360-degree perspectives, intelligent image capturing,
and the ability to include all of these capabilities on fully-autonomous craft (air or ground) affords the research and
M&S communities a wonderful opportunity to examine new ways of producing usable datasets for training, simulation
and mission rehearsal. Combine this with advances in UAS design and availability, and other sensors that move
beyond the visible spectrum (FLIR, IR, multi-spectral, hyper-spectral), and there is little debate that the quality and
quantity of data to produce a usable 3D geo-specific dataset of the planet will increase in the coming years. The M&S
community writ large has an opportunity to exploit this data and gain a decisive advantage in how it is used and
consumed moving forward. One interesting side-note is that much of this data is driven by non-traditional, non-GIS
markets that have exploded as of late – hobbyists, agriculture, mining, cinematography, and others. These markets
are driving the innovation, and combined with the powers of crowd-sourcing and cloud services, an almost limitless
supply of processing power and output is available.
In this paper, we have presented only one possible approach to exploiting these capabilities. The RAPTRS application
provides an automated workflow for non-expert users to capture structured sets of images for photogrammetric terrain
Figure 11. Prototype mission planning/rehearsal in the Unity3D Game Engine, using a city acquired through
the pipeline. Left: A wide view of a simulated city showing aggregated icons. Note the menu for placing units
(lower left of image) and the context menu for the selected unit (center). Right: A closer view of the same
scene, showing individual Soldier entities.

Interservice/Industry Training, Simulation, and Education Conference (I/ITSEC) 2016
2016 Paper No. 16069 Page 12 of 13
reconstruction. A pipeline from RAPTRS datasets through commercial photogrammetry software and into real time
gaming and simulation engines has been constructed and validated, with example applications illustrating the use of
the pipeline. Despite this progress, significant work remains before these results can be considered ready for ground-
level, first-person use. While automating the acquisition pipeline demonstrably improves quality, the tradeoff between
altitude and capture time remains poorly quantified. High detail reconstruction requires many images at high
resolution; lower altitude allows for greater detail from the same optics, but requires more passes and more images,
consuming more time.
Terrain surface, structures, and vegetation benefit from different reconstruction strategies: DEMs, reconstructed
meshes, and replacement with geotypical meshes. Improvements must be made, however, in the process of classifying
the point cloud, reconstructing structures and other objects in the scene with acceptable geometry and textures for
ground-level first-person views, and in recognizing and inserting appropriate geotypical vegetation and props when
possible to improve the first-person experience. Promising preliminary results have been obtained by employing
computer vision techniques on individual photographs to classify objects in the scene; work continues on this
trajectory.
Specific areas of additional research include producing first-person quality datasets using more detailed imagery and
collection techniques, as well as alternative forms of classification/segmentation of surfaces that allow the data to be
usable in a game/simulation environment. With this additional research and development, there exists the opportunity
to produce a highly-automated pipeline that allows non-expert UAS operators in organic, small-unit environments to
acquire imagery and rapidly reconstruct terrain in the field for use in simulation and training.
In contrast to most other forms of terrain capture (satellite assets, manned aerial LIDAR or photography), a small UAS
(sUAS) can be moved to the point of need and deployed by end-users without extensive training. Many sUAS can be
fielded for the cost of a single manned asset, and these low-cost UAS may be essentially treated as expendable,
allowing their use in higher-risk scenarios. This capability gives smaller elements the ability to map out an area of
operations for training or operations more quickly and update that map more often than would be possible with a
manned fixed-wing platform or satellite system. A squad-sized element could image a training area of operations with
an sUAS, process the data on a ruggedized PC, and have a 3D representation representing the area as it is today, not
as it was the last time it was overflown by BUCKEYE (LIDAR/orthophoto co-collection from a fixed winged aircraft)
or Google Earth, ready for training and rehearsal needs within a few hours. This allows the capture of scenario-specific
terrain features or structures such as berms, trenches, sandbags, and the like without extensive artist or map designer
effort. The potential value of this timely data for training, simulation, and operations is enormous.
The data captured by a small UAS platform also offers potential value to augment collects by manned aerial assets,
satellites, etc. The commercial sector is already imaging much of the world at sub-meter resolution, and this
information is widely available. Ongoing work such as One World Terrain could integrate spot data from small UAS
with data from other sources to provide an advantage over widely-available public datasets, while still leveraging the
availability of worldwide terrain.
ACKNOWLEDGEMENTS
The work depicted here is sponsored by the U.S. Army Research Laboratory (ARL) under contract number W911NF-
14-D-0005. Statements and opinions expressed and content included do not necessarily reflect the position or the
policy of the Government, and no official endorsement should be inferred. The authors would like to extend special
thanks to the U.S. Army’s National Training Center (Mr. John Kafides), the National Simulation Center (Mr. Mike
Enloe), the Advanced Training & Simulation Division (ATSD), and the US Marine Corps’ Twentynine Palms (CPT
Paul Kempf) and Camp Pendleton installations. The team also wishes to acknowledge the previous work of Dr. Evan
Suma Rosenberg and Dr. Timofey Grechkin (USC ICT) on earlier iterations of the photogrammetry pipeline that
underlie the current research efforts.
REFERENCES
Bay, H., Tuytelaars, T., & Van Gool, L. (2006). Surf: Speeded up robust features. In Computer vision–ECCV 2006
(pp. 404-417). Springer Berlin Heidelberg.

Interservice/Industry Training, Simulation, and Education Conference (I/ITSEC) 2016
2016 Paper No. 16069 Page 13 of 13
Bohlin, J., Wallerman, J., & Fransson, J. E. (2012). Forest variable estimation using photogrammetric matching of
digital aerial images in combination with a high-resolution DEM. Scandinavian Journal of Forest Research, 27(7),
692-699.
Coorg, S., & Teller, S. (1997, April). Real-time occlusion culling for models with large occluders. In Proceedings of
the 1997 symposium on Interactive 3D graphics (pp. 83-ff). ACM.
Colomina, I., & Molina, P. (2014). Unmanned aerial systems for photogrammetry and remote sensing: A review.
ISPRS Journal of Photogrammetry and Remote Sensing, 92, 79-97.
GDAL, G. (2012). Geospatial Data Abstraction Library. Open Source Geospatial Foundation.
Lowe, D. G. (1999). Object recognition from local scale-invariant features. In Computer vision, 1999. The proceedings
of the seventh IEEE international conference on (Vol. 2, pp. 1150-1157). Ieee.
Lowe, D. G. (2004). Distinctive image features from scale-invariant keypoints. International journal of computer
vision, 60(2), 91-110.
Mikhail, E. M., Bethel, J. S., & McGlone, J. C. (2001). Introduction to modern photogrammetry (Vol. 1). John Wiley
& Sons Inc.
Moenning, C., & Dodgson, N. A. (2003, September). A new point cloud simplification algorithm. In Proc. Int. Conf.
on Visualization, Imaging and Image Processing (pp. 1027-1033).
McAlinden, R., Suma, E., Grechkin, T. & Enloe, M. (2015). Procedural Reconstruction of Simulation Terrain Using
Drones. Proceedings of I/ITSEC 2015. NTSA.
McAlinden, R. (2016). Drone 3D Reconstruction Videos. Retrieved August 9, 2016, from
https://www.youtube.com/playlist?list=PLfjrdVFvB2wXD0E51m5MIHQIOPQvVDYr3
Pauly, M., Gross, M., & Kobbelt, L. P. (2002, October). Efficient simplification of point-sampled surfaces. In
Proceedings of the conference on Visualization'02 (pp. 163-170). IEEE Computer Society.
Snook, G. (2000) Simplified 3D movement and pathfinding using navigation meshes. In DeLoura, M. Game
Programming Gems. 288-304. Charles River Media.