
Producing MIDS NAC DEMs from MESSENGER Images · Producing MESSENGER DEMs from MDIS NAC Images...
24
Producing MESSENGER DEMs from MDIS NAC Images MANHEIM 1 , HENRIKSEN, ROBINSON, AND THE MESSENGER TEAM 1 ARIZONA STATE UNIVERSITY, TEMPE AZ—[email protected]
Transcript of Producing MIDS NAC DEMs from MESSENGER Images · Producing MESSENGER DEMs from MDIS NAC Images...

Producing MESSENGER DEMs
from MDIS NAC ImagesMANHEIM1, HENRIKSEN, ROBINSON, AND THE MESSENGER TEAM
1ARIZONA STATE UNIVERSITY, TEMPE AZ—[email protected]
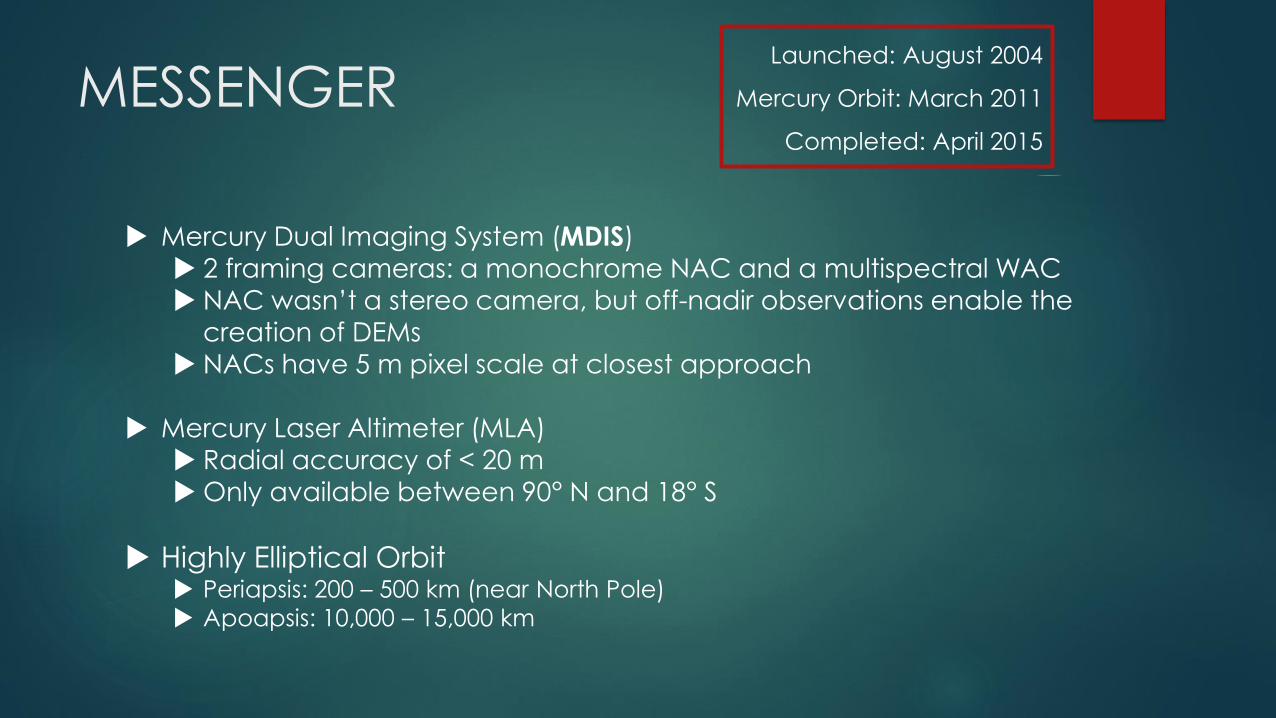
MESSENGER
Mercury Dual Imaging System (MDIS)
2 framing cameras: a monochrome NAC and a multispectral WAC NAC wasn’t a stereo camera, but off-nadir observations enable the
creation of DEMs
NACs have 5 m pixel scale at closest approach
Mercury Laser Altimeter (MLA)
Radial accuracy of < 20 m
Only available between 90° N and 18° S
Highly Elliptical Orbit Periapsis: 200 – 500 km (near North Pole)
Apoapsis: 10,000 – 15,000 km
Launched: August 2004
Mercury Orbit: March 2011
Completed: April 2015
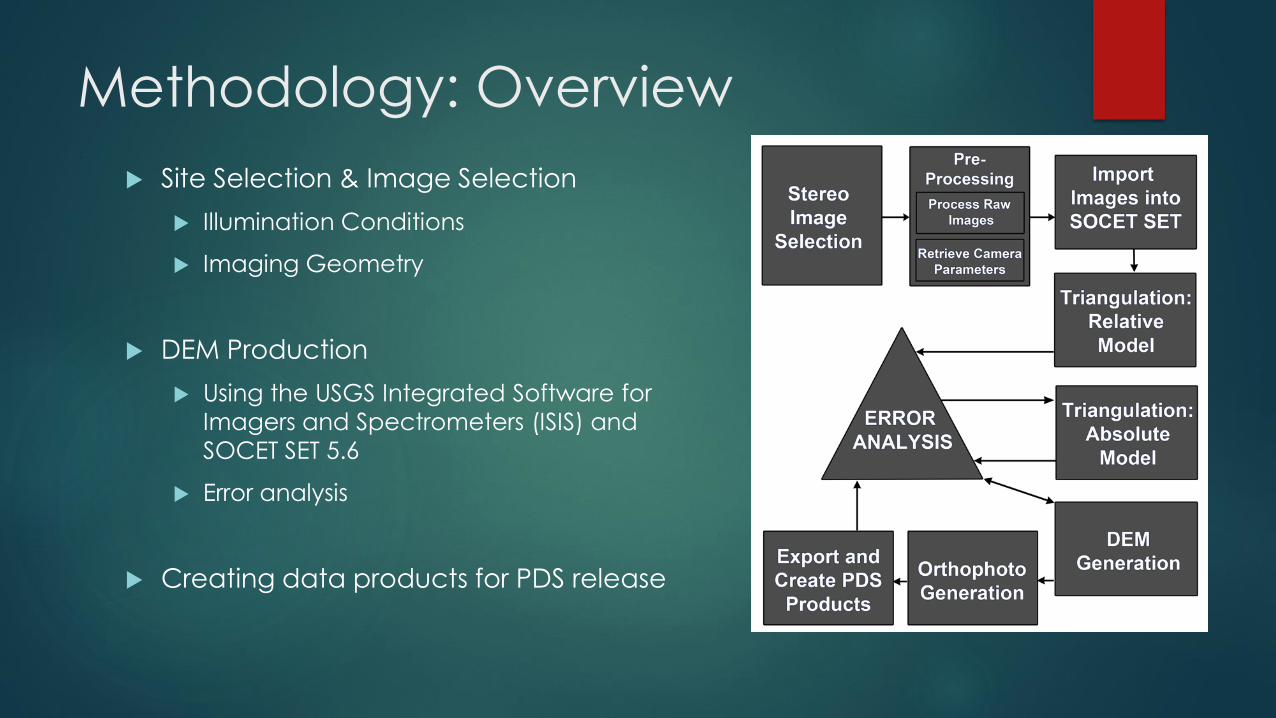
Methodology: Overview
Site Selection & Image Selection
Illumination Conditions
Imaging Geometry
DEM Production
Using the USGS Integrated Software for
Imagers and Spectrometers (ISIS) and
SOCET SET 5.6
Error analysis
Creating data products for PDS release

Image Selection
Selecting stereo images
requires compromise
between finding optimal
images and building up
desired coverage.
These parameters will
dictate the precision of
the final product.
Strength of stereo: parallax between the two images / unit height
Illumination compatibility: distance between the tips of shadows in two images / unit height
*Guidelines adapted from Becker, et al. 2015.

Images Selected for Our DEMs n=49

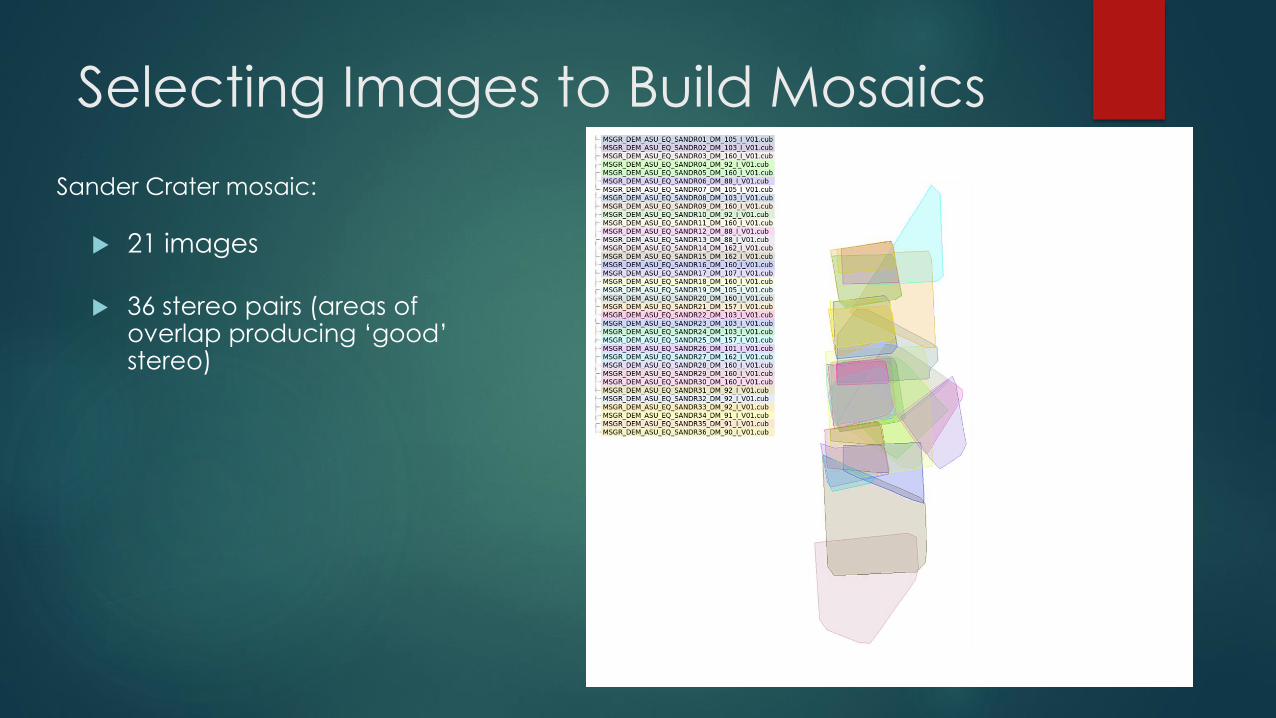
Selecting Images to Build Mosaics
Sander Crater mosaic:
21 images
Selecting Images to Build Mosaics
Sander Crater mosaic:
21 images
36 stereo pairs (areas of overlap producing ‘good’ stereo)

Selecting Images to Build Mosaics
Sander Crater mosaic:
21 images
36 stereo pairs (areas of overlap producing ‘good’ stereo)
Resulting DEMs can be
mosaicked together
(using ISIS) to create one
large-area DEM

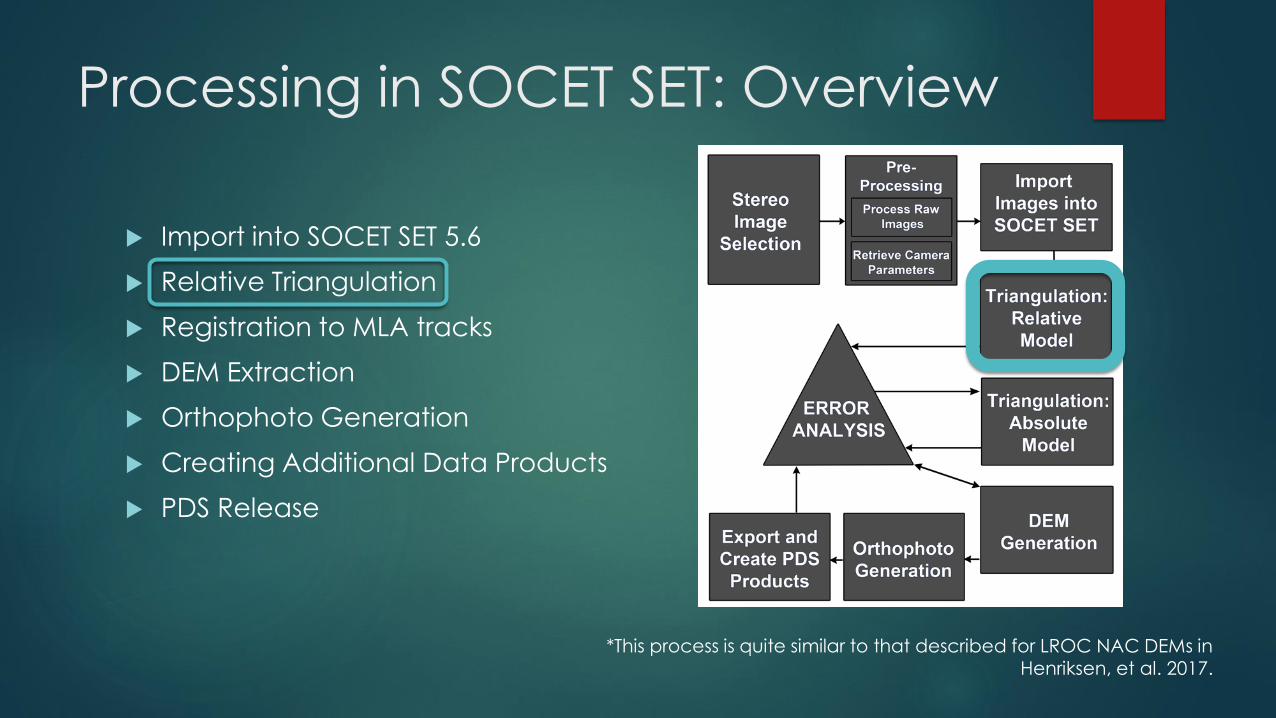
*This process is quite similar to that described for LROC NAC DEMs in Henriksen, et al. 2017.
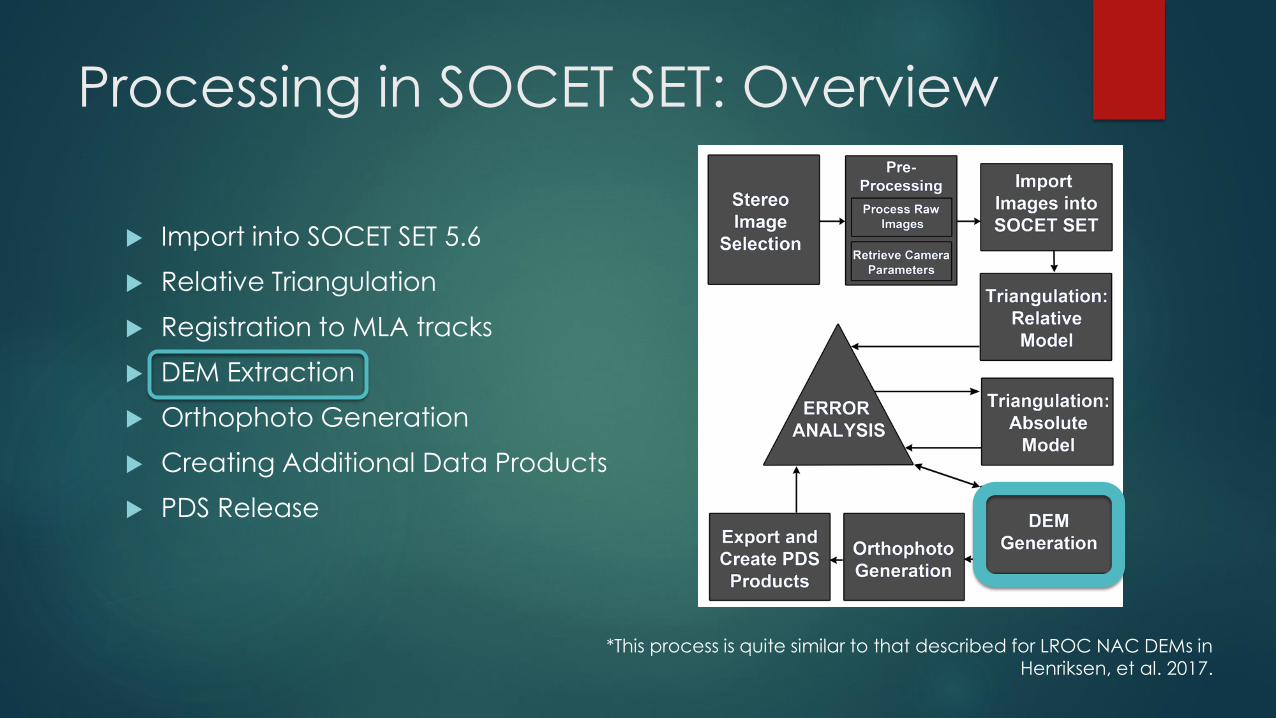
Processing in SOCET SET: Overview
Import into SOCET SET 5.6
Relative Triangulation
Registration to MLA tracks
DEM Extraction
Orthophoto Generation
Creating Additional Data Products
PDS Release
Processing in SOCET SET: Overview
Import into SOCET SET 5.6
Relative Triangulation
Registration to MLA tracks
DEM Extraction
Orthophoto Generation
Creating Additional Data Products
PDS Release
*This process is quite similar to that described for LROC NAC DEMs in Henriksen, et al. 2017.

*This process is quite similar to that described for LROC NAC DEMs in Henriksen, et al. 2017.
Processing in SOCET SET: Overview
Import into SOCET SET 5.6
Relative Triangulation
Registration to MLA tracks
DEM Extraction
Orthophoto Generation
Creating Additional Data Products
PDS Release

Registration to MLA
Not always possible: for DEMs with little
coverage, or further south, there may be little or no MLA coverage.
In this case, find an overlapping stereo
pair of WAC images
Tie NACs to the WACs
WACs are manually registered to MLA
NACs and WACs are bundle-adjusted
together for absolute orientation
NAC
WAC
MLA
*This process is quite similar to that described for LROC NAC DEMs in Henriksen, et al. 2017.
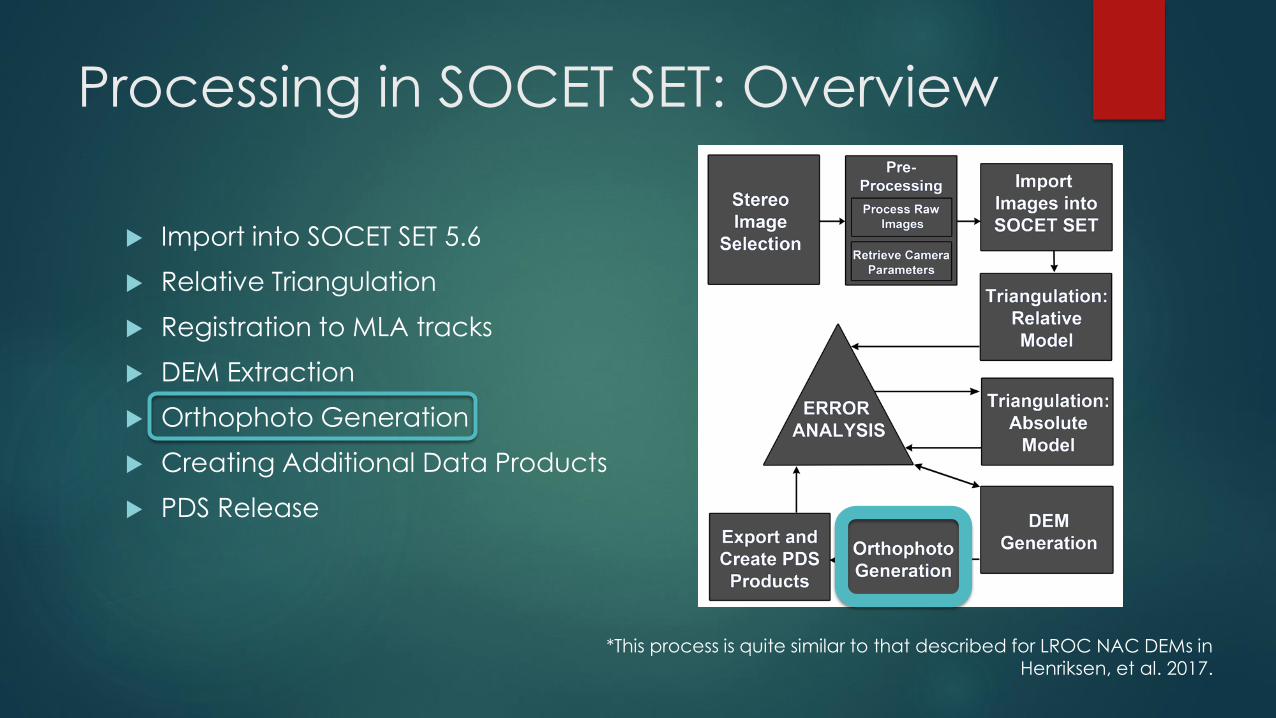
Processing in SOCET SET: Overview
Import into SOCET SET 5.6
Relative Triangulation
Registration to MLA tracks
DEM Extraction
Orthophoto Generation
Creating Additional Data Products
PDS Release
Processing in SOCET SET: Overview
Import into SOCET SET 5.6
Relative Triangulation
Registration to MLA tracks
DEM Extraction
Orthophoto Generation
Creating Additional Data Products
PDS Release
*This process is quite similar to that described for LROC NAC DEMs in Henriksen, et al. 2017.

Processing in SOCET SET: Overview
Import into SOCET SET 5.6
Relative Triangulation
Registration to MLA tracks
DEM Extraction
Orthophoto Generation
Creating Additional Data Products
PDS Release
*This process is quite similar to that described for LROC NAC DEMs in Henriksen, et al. 2017.

Data Products
Sander DEM: 21 images, 36
stereo pairs
A readme file was also
produced for each DEM,
containing error analysis
results.

Error Analysis
Vertical precision (“relative linear error”)
is calculated by SOCET SET at a 90%
confidence level
expected to be < DEM pixel scale
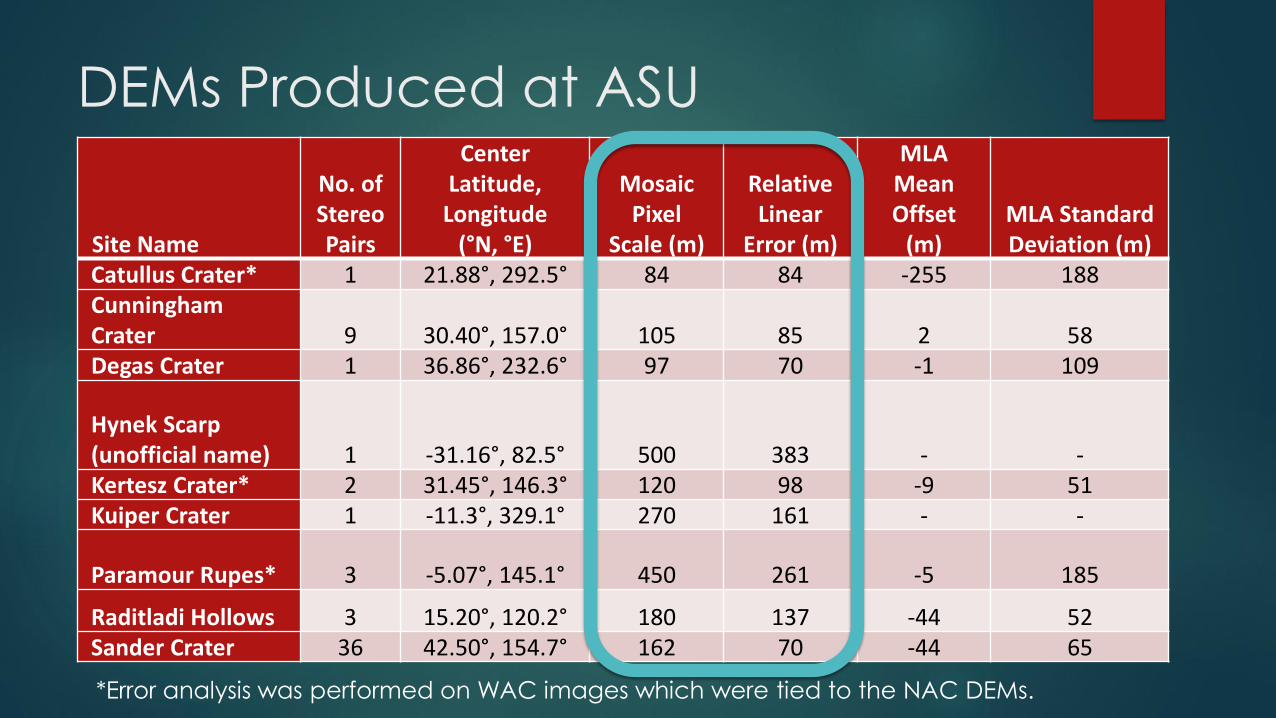
DEMs Produced at ASU
Site Name
No. ofStereo Pairs
Center Latitude,
Longitude(°N, °E)
Mosaic Pixel
Scale (m)
RelativeLinear
Error (m)
MLA Mean Offset
(m)MLA Standard Deviation (m)
Catullus Crater* 1 21.88°, 292.5° 84 84 -255 188Cunningham Crater 9 30.40°, 157.0° 105 85 2 58Degas Crater 1 36.86°, 232.6° 97 70 -1 109
Hynek Scarp(unofficial name) 1 -31.16°, 82.5° 500 383 - -Kertesz Crater* 2 31.45°, 146.3° 120 98 -9 51Kuiper Crater 1 -11.3°, 329.1° 270 161 - -
Paramour Rupes* 3 -5.07°, 145.1° 450 261 -5 185
Raditladi Hollows 3 15.20°, 120.2° 180 137 -44 52Sander Crater 36 42.50°, 154.7° 162 70 -44 65
*Error analysis was performed on WAC images which were tied to the NAC DEMs.
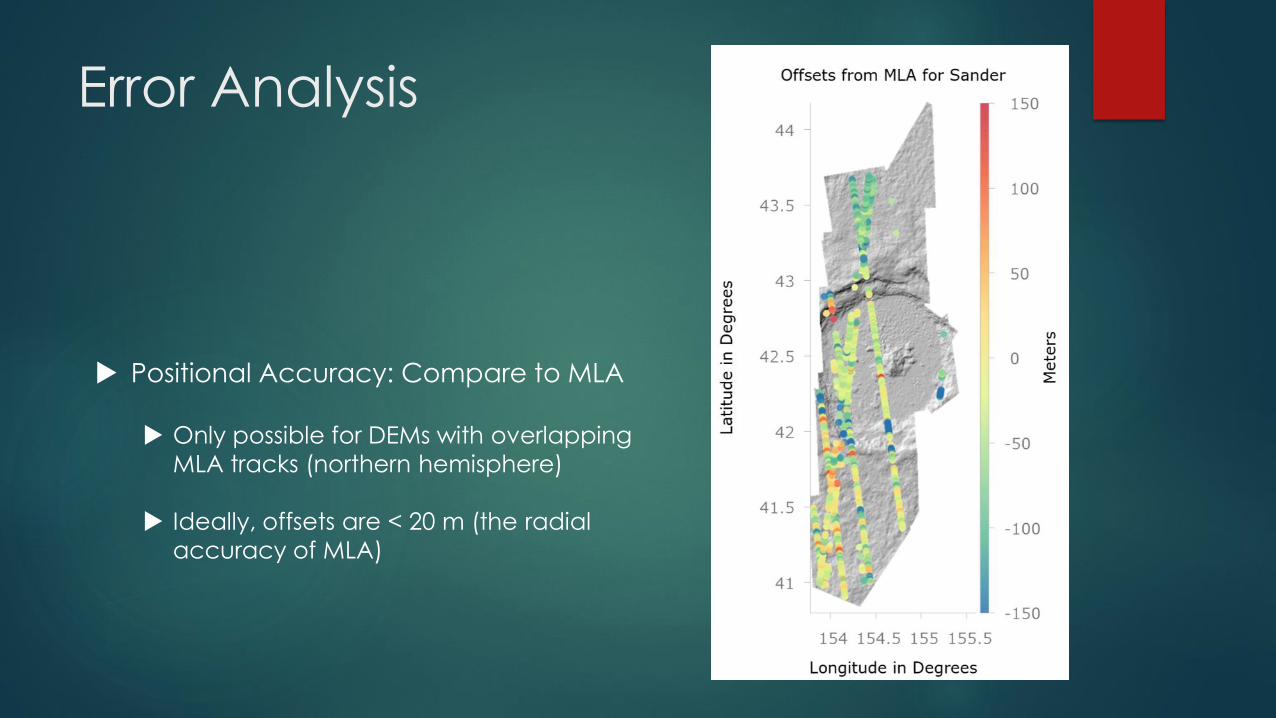
Error Analysis
Positional Accuracy: Compare to MLA
Only possible for DEMs with overlapping
MLA tracks (northern hemisphere)
Ideally, offsets are < 20 m (the radial
accuracy of MLA)

DEMs Produced at ASU
Site Name
No. ofStereo Pairs
Center Latitude,
Longitude(°N, °E)
Mosaic Pixel
Scale (m)
RelativeLinear
Error (m)
MLA Mean Offset
(m)MLA Standard Deviation (m)
Catullus Crater* 1 21.88°, 292.5° 84 84 -255 188Cunningham Crater 9 30.40°, 157.0° 105 85 2 58Degas Crater 1 36.86°, 232.6° 97 70 -1 109
Hynek Scarp(unofficial name) 1 -31.16°, 82.5° 500 383 - -Kertesz Crater* 2 31.45°, 146.3° 120 98 -9 51Kuiper Crater 1 -11.3°, 329.1° 270 161 - -
Paramour Rupes* 3 -5.07°, 145.1° 450 261 -5 185
Raditladi Hollows 3 15.20°, 120.2° 180 137 -44 52Sander Crater 36 42.50°, 154.7° 162 70 -44 65
*Error analysis was performed on WAC DEMs which were tied to the NAC DEMs.
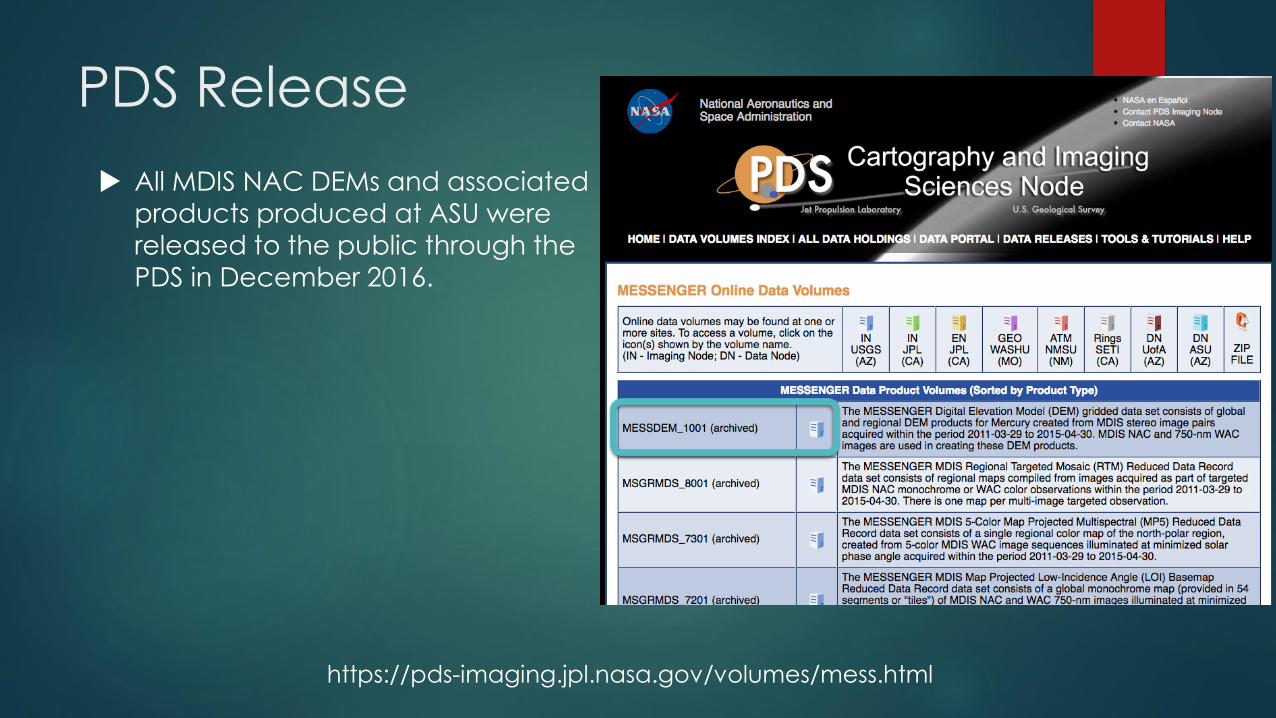
PDS Release
All MDIS NAC DEMs and associated
products produced at ASU were
released to the public through the
PDS in December 2016.
PDS Release
All MDIS NAC DEMs and associated
products produced at ASU were
released to the public through the
PDS in December 2016.
https://pds-imaging.jpl.nasa.gov/volumes/mess.html
References[1] Becker, K. J. et al. (2015) LPS, 46, Abs. 2703.
[2] Henriksen, M. R. et al. (2017) Icarus, 283, 122-137.
[3] Cavanaugh, J. F. et al. (2007) Space Sci. Rev., 131, 451-497.
[4] Fassett, C. I. (2016) Planet. Space Sci., 134, 19-28.
[5] Zuber, M. T. et al. (2012) Science, 336, 217-220.
[6] Anderson, J. A. et al. (2004) LPS, 35, Abs. 2039.
[7] Becker, K. J. et al. (2016) LPS, 47, Abs. 2959.
[8] Forstner, W. et al. (2013) Manual of Photogrammetry (6th ed.), 785-955.
[9] BAE Systems (2011) SOCET SET User's Manual, v. 5.6.
[10] BAE Systems (2007) NGATE. White Paper.
[11] Zhang, B. (2006) ASPRS, p. 12.
[12] Miller, S. et al. (2013) Manual of Photogrammetry (6th ed.), 1009- 1043.
[13] Warmerdam, F. (2008) Open Source Approaches in Spatial Data Handling, 87-108.
[14] Hawkins, S. E., III et al. (2007) Space Sci. Rev., 131, 247-338.


