PRODUCE INDUSTRY PROCUREMENT - United Fresh · growers and retail grocers. ... C&S Wholesale has...
21
September 2015 E.B. 2015-10 PRODUCE INDUSTRY PROCUREMENT: Changing Preferences and Practices Edward W. McLaughlin, Kristen S. Park, and Gerard F. Hawkes Charles H. Dyson School of Applied Economics and Management College of Agriculture and Life Sciences Cornell University Ithaca, NY 14853-7801
Transcript of PRODUCE INDUSTRY PROCUREMENT - United Fresh · growers and retail grocers. ... C&S Wholesale has...

September 2015 E.B. 2015-10
PRODUCE INDUSTRY PROCUREMENT: Changing Preferences and Practices
Edward W. McLaughlin, Kristen S. Park, and Gerard F. Hawkes
Charles H. Dyson School of Applied Economics and Management College of Agriculture and Life Sciences
Cornell University Ithaca, NY 14853-7801

It is the Policy of Cornell University actively to support equality of educational
and employment opportunity. No person shall be denied admission to any
educational program or activity or be denied employment on the basis of any
legally prohibited discrimination involving, but not limited to, such factors as
race, color, creed, religion, national or ethnic origin, sex, age or handicap.
The University is committed to the maintenance of affirmative action programs
which will assure the continuation of such equality of opportunity.

1
PRODUCE INDUSTRY PROCUREMENT: CHANGING STRUCTURE AND PRACTICES
EDWARD W. MCLAUGHLIN, KRISTEN S. PARK, AND GERARD F. HAWKES
FOOD INDUSTRY MANAGEMENT PROGRAM CHARLES H. DYSON SCHOOL OF APPLIED ECONOMICS AND MANAGEMENT
COLLEGE OF AGRICULTURE AND LIFE SCIENCES CORNELL UNIVERSITY
INTRODUCTION Changes in consumer preferences, technology, and production capacity continue to transform the produce industry. Companies throughout the supply chain need unbiased information to evaluate these changes and implement appropriate strategies. This project was developed to shed light on the changes in produce procurement offices so
produce industry practitioners have the most current information and to improve overall supply chain performance.
Cornell University’s Food Industry Management Program has provided education and research to the food and retail industries, for almost 60 years. The fresh produce sector is one of the areas on which Cornell focuses its research, and this study continues that rich vein of exploration and sharing.
No research project is possible without cooperation, and we are very grateful for the time and effort expended by the over 150 companies, large and small, that participated in this project. In exchange for sharing sensitive data, the identities of the participating companies will remain confidential, and no individual company data are revealed in this report or elsewhere. Also, this study would not have been possible without the support of and input from United Fresh Produce Association and its retail board.

2
RATIONALE The role of buyers and category managers has become fundamental to the success of supermarket companies. In a world where fresh produce is procured globally year round and where food safety and sustainability are becoming paramount concerns, produce procurement has become a complex arena where supply chain coordination and transparency are vital but not easily achieved.
Retail trends: Consumers are gradually shifting their food spending away from processed foods toward their fresh counterparts. Figure 1 illustrates this shift as the share of retail sales from non-perishable products has decreased while the share of perishables has increased. The produce department’s share of retail sales increased by 140 basis points between 1995 and 2014.
Figure 1. Perishables Gain Supermarket Share
Source: Consumer Expenditures Study, Supermarket Business, September 1996 & 2001 and Progressive Grocer, September 2006, 2011, & 2015.
Figure 2. Produce Department Gross and Net Margin, as a Percent of Sales At the same time, retail competition is intense. Retailers face pressure from consumers and competitors to keep prices low while product and operating costs continue to rise. The result is declining profit margins in many supermarket departments, including produce (figure 2). The profit squeeze is unlikely to be resolved in the near future, thus, the pressure on produce procurement teams to improve efficiencies and ensure product availability at fair prices is even greater.
Note: Net margin in this case assumed to equal operating margin Source: Retail Produce & Floral Review, Progressive Grocer, October issues, 2000 through 2014.
10.3 10.5 10.5 11.4 11.7
0%
10%
20%
30%
40%
50%
60%
70%
80%
90%
100%
1995 2000 2005 2010 2014
Produce
Deli
Frozen
Dairy
Bakery
Meat/Seafood
Non-Perishables
36.1 34.5 34.0 33.0
NA
21.9
17.7 17.4
0.0
5.0
10.0
15.0
20.0
25.0
30.0
35.0
40.0
00 05 10 13Gross margin % Net margin %

3
From 2005 to 2013, average produce gross margin percent declined by 220 basis points while net margin, or operating margin, declined by 470 basis points. The relative decline for gross margin was 4 percent versus 22 percent for operating margin. Gross margin is calculated by retail price minus cost of goods sold. Operating margin is the margin remaining after subtracting cost of goods sold and direct selling expenses such as labor. These declines suggest that pricing pressure prevented retailers from raising prices to keep pace with the increasing operating and product costs.
Wholesaler Trends: The United States Department of Agriculture (USDA) describes produce wholesalers as various types of commission merchants, brokers, distributors, merchant wholesalers, re-packers, importers, and exporters. As retailers became larger through growth and acquisitions, they have purchased more of their produce directly from grower-shippers and less from produce wholesalers. To survive, produce wholesalers have increased the services they provide, diversified their customer base, and expanded their product mix. The produce wholesalers have taken on fresh-cut services to meet new market demands for convenience and fresh-cut produce and been primary suppliers of emerging products, such as organics, before they become mainstream items.
Produce wholesalers also find opportunities to sell to retailers new to produce. Convenience stores, dollar stores, and drug stores all are increasing their food offerings and, more specifically, starting to offer more fresh produce. These formats require small but frequent deliveries and in many cases are serviced by local produce wholesalers.
Sales, costs of goods sold, and percent gross margins for fresh fruit and vegetable merchant wholesalers are presented in figure 3. Sales for the industry have been growing while the number of produce wholesale establishments have been
declining. The average percent gross margin for these wholesalers has been increasing. In 1997, the gross margin was 17.9 percent while in 2007 it had increased to 21.1 percent. The increase in gross margin has likely been used to pay for the increase in the number of services and functions that wholesalers have added.
METHODOLOGY This project combines findings from a two-part data collection initiative:
an online survey of produce executives, buyers, and merchandisers on buying activities and trends
personal interviews with retail produce executives on topline issues
The online survey collected quantitative data from produce wholesale and supermarket companies and was used to document and describe the current structure and state of produce procurement. Personal interviews were subsequently conducted solely with retailer and general line grocery wholesaler executives to provide in-depth perspectives on the important elements that emerged from the online survey.
Figure 3. Sales, Costs of Goods Purchased, and Gross Margins for Fresh Fruit and Vegetable Merchant Wholesalers, 1997 - 2007
Note: 2012 Economic Census gross margin data not released as of August 2015 Source: U.S. Census Bureau, Economic Census, 1997, 2002, and 2007
16.0
17.0
18.0
19.0
20.0
21.0
22.0
10,000,000
20,000,000
30,000,000
40,000,000
50,000,000
60,000,000
70,000,000
1997 2002 2007
%
$1
,00
0
sales-on own account % gross margin
Number of wholesaler establishments:1997 5,4742002 5,3972007 5,074

4
The online survey included responses from 34 retail and grocery wholesale companies and 119 produce wholesale companies (table 1). Company size ranged from small retailers and wholesalers to large multi-region operators.
The 34 retailer/grocery wholesaler respondents included 26 of the top 50 U.S. retailers and grocery wholesalers that represented 78 percent of the combined sales of the top 50 companies. Collectively, retailer/grocery wholesaler respondents have operations in all 50 U.S. states.
The 119 produce wholesale respondents include many types of produce intermediaries between growers and retail grocers. What these companies have in common is the specialized nature of sourcing and selling produce that represents the vast majority of their sales. These intermediaries include produce merchant wholesalers, brokers, distributors, importers, and others. Collectively,
produce wholesale respondents operate in all 50 U.S. states.
Company sales of the average retailer/grocery wholesaler respondent were almost 100 times sales of the average produce wholesaler respondent (table 2). This size discrepancy is reduced somewhat when comparing just produce sales of each respondent type. After adjusting for wholesale vs. retail price levels, the average retailer/grocery wholesaler respondent had about 10 times the produce sales as the average produce wholesaler respondent.
Table 2. Respondents’ Business Profile
Average company sales Produce as a % of sales Average produce sales
$ millions % $ millions Retailers and grocery wholesalers $13,100.0 10.6% $1,388.6 Produce wholesalers $138.0 95.6% $131.9
Source: Cornell study 2015
Where possible, results from our 2014 survey are compared with similar previous Cornell produce industry studies. In some cases, since issues and research methodologies have changed over the years, there is no comparable data in earlier studies to compare with the 2015 survey results. It should be noted that the groups of respondents from previous studies may have had a difference mix of companies than the current study; however, the industries represented by the respondents are the same even if the exact same companies are not represented in all survey years.
IMPLICATIONS If the average retailer/general line wholesaler wanted to source all of its produce from the fewest number of produce wholesalers, it would require the annual produce sales of more than ten average produce wholesalers to meet the volume needed. Decades of consolidation trends at the retail and grocery wholesale levels have resulted in fewer, much larger companies. Recent examples include the mergers of Bi-Lo with Winn-Dixie, Albertsons with Safeway and, if approved, Delhaize and Ahold. The grocery wholesale sector has also experienced concentration through acquisition. For example, C&S Wholesale has grown through acquisitions of other wholesalers and through contracting with retailers seeking to outsource distribution operations.
Table 1. Composition of Survey Respondents, by Buyer Type
34 Retailer/Grocery wholesale companies: %
Retailer 85.3
Grocery wholesaler 14.7
Total grocery retail companies 100.0
119 Produce wholesale companies: %
Produce merchant wholesaler 47.1
Distributor or broker 24.4
Importer 6.7
Grower/Shipper 5.0
Other 16.7
Total produce wholesale companies 100.0 Source: Cornell study 2015

5
THE PROCUREMENT OFFICE
BACKGROUND/SITUATION Category managers and buyers work together to forecast store level produce needs and to procure the right mix of fresh fruits and vegetables. Category managers plan sales and merchandising for the stores and work with buyers to anticipate produce needs for the stores.
Efficient procurement performance is critical to store produce department performance, and to overall store profitability and brand image. Therefore, buyers are evaluated on factors aligned with produce department sales and profitability.
FINDINGS Retailers and grocery wholesalers reported an average of 15.6 people responsible for procurement activities, including an average of 3.5 category managers and 12.1 produce buyers (figure 4), approximately 4 buyers for each category manager. Although produce wholesalers have category managers, they may not perform exactly the same functions for produce wholesalers as they do for retail/grocery wholesalers. As shown in figure 4, produce wholesalers have about two-thirds the total number of category managers and buyers as do retailers/grocery wholesalers, and their ratio of buyers to category managers is roughly 2 to 1 (vs. almost 4 to 1 for retailer/grocery wholesalers.)
Insufficient historical information is available about the size of the procurement offices of small retailers or produce wholesalers. However, large supermarket companies, defined here as those with annual sales over $2 billion, appear to be reducing the size of their procurement office (figure 5). In 1999, researchers reported an average of 26.6 people in large supermarket produce procurement departments (McLaughlin, et. al, 1999). In this study, the reported averages are 5.1 category managers and 18.3 buyers for a total of 23.4 procurement office personnel. The average number of buyers declined 8.5 percent, the number
of category managers declined 25 percent, and, overall, the total number of procurement people declined 12 percent.
Figure 4. Average Number of Category Managers and Buyers, Retailers/Grocery Wholesalers versus Produce Wholesalers, 2014
Source: Cornell study 2015
12.1
7.3
3.5
3.4
0
2
4
6
8
10
12
14
16
18
Retailers/grocery wholesalers Produce wholesalers
nu
mb
er
Buyers Category managers
15.6
10.7

6
Assessing Buyer Performance
Interviews conducted with retailers and grocery wholesaler executives identified the most common criteria used to evaluate buyer performance are, not surprisingly, two related factors: quality and freshness. Metrics to help determine freshness were inventory turns and shrink. Quantitative metrics for these general terms; however, were imprecise and included executive observations, shopper feedback, and “meeting specifications” (table 3).
Table 3. Typical Buyer Performance Assessment Criteria and Metrics
Criteria Metrics
Quality/freshness Imprecise: executive observation, shopper feedback, formal and informal measures, meeting department specifications
Inventory turns 2.5-2.7 turns/week; 80 or more per year
Shrink 4%-5%
Sales & gross margin Hitting budget; improving on year ago
Source: Cornell study 2015
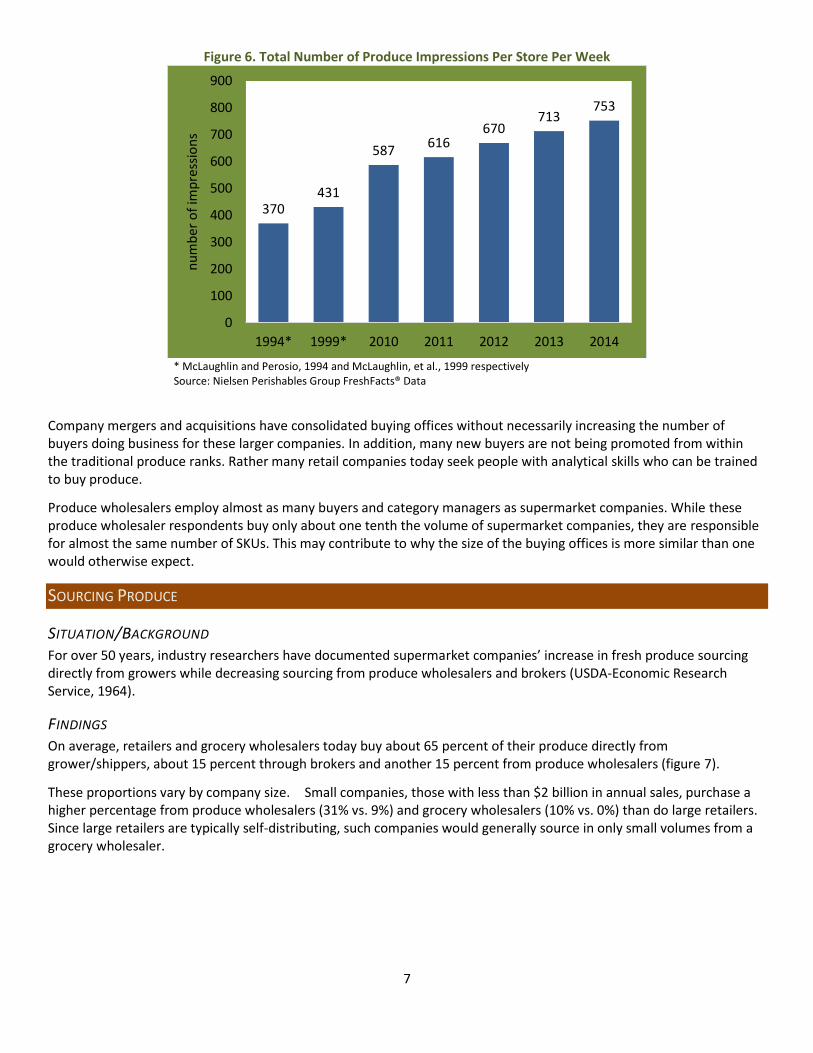
IMPLICATIONS Nielsen Perishables Group FreshFacts® Data tracks the number of produce items carried in retail stores. These items, or impressions, are proxies for stock keeping units (SKUs) used by the grocery industry. According to these new data and to Cornell University research, the total number of produce impressions per store per week has continued to grow considerably over the past 20 years (figure 6). At the same time, as this study suggests, retailers have reduced their ranks of buyers and category managers. As a result, the average buyer is now expected to handle more items, indeed over twice as many as two decades ago. The retail demand for greater efficiency from buyers is unlikely to diminish. However, produce procurement is more complex than procurement of most non-perishable products. Given product perishability and supplier/distributor fragmentation, produce buyers need to make decisions using current, accurate, fast-changing information.
Figure 5. Number of Category Managers and Buyers in 2014, Large Retailers (sales over $2 billion)
Source: Cornell study 2015
19.8 18.3
6.85.1
0
5
10
15
20
25
30
1999 2014
Buyers Category Managers
26.6
23.4
7
Figure 6. Total Number of Produce Impressions Per Store Per Week
* McLaughlin and Perosio, 1994 and McLaughlin, et al., 1999 respectively Source: Nielsen Perishables Group FreshFacts® Data
Company mergers and acquisitions have consolidated buying offices without necessarily increasing the number of buyers doing business for these larger companies. In addition, many new buyers are not being promoted from within the traditional produce ranks. Rather many retail companies today seek people with analytical skills who can be trained to buy produce.
Produce wholesalers employ almost as many buyers and category managers as supermarket companies. While these produce wholesaler respondents buy only about one tenth the volume of supermarket companies, they are responsible for almost the same number of SKUs. This may contribute to why the size of the buying offices is more similar than one would otherwise expect.
SOURCING PRODUCE
SITUATION/BACKGROUND For over 50 years, industry researchers have documented supermarket companies’ increase in fresh produce sourcing directly from growers while decreasing sourcing from produce wholesalers and brokers (USDA-Economic Research Service, 1964).
FINDINGS On average, retailers and grocery wholesalers today buy about 65 percent of their produce directly from grower/shippers, about 15 percent through brokers and another 15 percent from produce wholesalers (figure 7).
These proportions vary by company size. Small companies, those with less than $2 billion in annual sales, purchase a higher percentage from produce wholesalers (31% vs. 9%) and grocery wholesalers (10% vs. 0%) than do large retailers. Since large retailers are typically self-distributing, such companies would generally source in only small volumes from a grocery wholesaler.
370431
587616
670713
753
0
100
200
300
400
500
600
700
800
900
1994* 1999* 2010 2011 2012 2013 2014
nu
mb
er o
f im
pre
ssio
ns

8
Figure 7. Produce Sources for Retailer and Grocery Wholesaler Respondents
Source: Cornell study 2015
On average, produce wholesale respondents buy over three-quarters of their produce directly from grower/shippers and supplement with purchases from brokers and other produce wholesalers (figure 8).
Figure 8. Produce Sources for Produce Wholesalers, 2014
Source: Cornell study 2015
Smaller retailers sourced from an average of about 69 suppliers in 2014, seven fewer suppliers (9%) than reported in 2001 and less than one-fifth the number of suppliers used by large retailers (figure 9). While small retailers use fewer produce suppliers now than in 2001, larger companies use more produce suppliers, up about 26 suppliers (7 percent). Perhaps large retailers are increasing the number of local suppliers because of the strong demand for local produce or perhaps they are now so large that they simply require more suppliers to fill their needs.
65
15 15
3 3
44
12
31
103
71
169
0 4
0
20
40
60
80
Grower-Shipper Brokers Producewholesaler
General-linewholesaler
Other
% o
f p
rod
uce
pu
rch
ases
All Small Large
77.2
14.57.0
0.6 0.80
10
20
30
40
50
60
70
80
90
Grower-Shipper Brokers Producewholesaler
General-linewholesaler
Other
%

9
Produce wholesalers use about 123 suppliers (figure 11), roughly half the number of suppliers as large supermarket companies (see figure 9), to purchase a tenth of the volume purchased by the supermarket companies. Produce wholesalers purchase about 60 percent of their volume from their top 10 suppliers, roughly the same as the average retailer/grocery wholesale respondent.
Figure 11. Average Number of Suppliers and Average Percent of Purchases from Top 10 Suppliers, Reported by Produce Wholesalers
Sources: McLaughlin, et. al, 1997 and Cornell study 2015
0
72
123
64
0
20
40
60
80
100
120
140
Number of Suppliers % from top 10 suppliers
nu
mb
er
1997 2014
Figure 9. Average Number of Suppliers Figure 10. Average Percent from Top 10 Reported by Retailers and Grocery Suppliers Reported by Retailers and Grocery Wholesalers Wholesalers
Sources: Perosio, et. al, 2001 and Cornell study 2015 Sources: Perosio, et. al, 2001 and Cornell study 2015
249
76
367
256
69
393
0
50
100
150
200
250
300
350
400
450
All Small Large
nu
mb
er
2001 2014
68
81
6058
76
47
0
10
20
30
40
50
60
70
80
90
All Small Large
%
2001 2014
10
BUYER-SUPPLIER RELATIONSHIPS
SITUATION/BACKGROUND Beyond the attributes expected of all suppliers – quality, food safety, traceability, and integrity – we asked executives for attributes of a preferred supplier above and beyond these entry level expectations.
FINDINGS Produce executives look for alignment with the retailer’s goals. Above all, retailers want suppliers who have product when it is needed and who can find product when supply is tight. When supply opportunities arise for a limited scale or a short time, retailers expect suppliers to communicate those opportunities. Anecdotally, many respondents related examples of suppliers failing to meet expectations, often while trying to make up for shortages or gaps in supply. In those situations retailers/wholesalers would prefer the supplier to be transparent about supply issues rather than receive product that was either did not meet specification or other requirements. Respondents emphasized that transparency is paramount in both good and bad supply situations.
In retailer interviews, flavor was identified as an increasingly important aspect of quality compared to historical buying patterns. As retailers strive to differentiate themselves from competitors, produce executives expect suppliers to offer new, flavorful varieties. This shift to seek suppliers who can offer flavorful products indicates interest in ways to differentiate other than appearance, size, convenience, or price. Several retailers said they expect suppliers to have produce with great flavor. Whereas taste and flavor have always been key attributes for buyers, the frequency with which these terms were mentioned in interviews and the increased emphasis given them marks a considerable change from the past.
Evaluating Suppliers - Retailers report that they increasingly evaluate their suppliers on performance metrics and communicate supplier performance in meetings or on formal scorecards. Virtually all retailers and wholesalers evaluate suppliers on a regular basis but the formality and criteria vary substantially across companies. Some respondents reported highly structured scorecard-type evaluation systems for vendor performance. Others rely on more informal methods revolving around regular communication and relationship building.
A modest majority of the study’s respondents employ formal scorecards with quantitative criteria. In addition, a significant number meet with 15 to 30 major vendors at least annually (a few quarterly; a very few weekly). Many respondents indicated that they do not have time to evaluate every supplier, but do evaluate major suppliers. Some others are considering a formal evaluation process whether with scorecards or with supplier meetings. Some of the criteria (not ranked) used to evaluate produce suppliers include:
Costs and revenues
quality
Fill-rates, on-time performance, rejections, tardiness
Category performance
Social responsibility
Food safety—used to qualify vendor, rarely afterward
Category management assistance
To paraphrase one retailer, “We share results by giving them their measurements against all vendors. They seem to like understanding where they are; more to educate and motivate them.”
IMPLICATIONS As larger retailers purchase more produce directly from grower-shippers, their use of brokers and produce wholesalers has declined. Indeed, one retailer reported using brokers primarily for “non-fresh” produce items such as refrigerated salad dressings and birdseed.
11
In conversations with grower-shippers, they report that they cannot afford to share their margin with middlemen and only using brokers for temporary situations. In some instances, grower-shippers also perform their own brokering functions such as brokering product for other growers, especially when looking for more supply to satisfy retailer demand.
Retailers reported growing interest in sourcing from vertically integrated growers that control growing acreage and can ensure food safety. Most buyers favor suppliers who have already shifted sourcing away from areas affected by extreme weather or political or economic stress. That is, they favor multi-region suppliers who have spread their risk across diverse geographic regions.
TRANSPORTATION
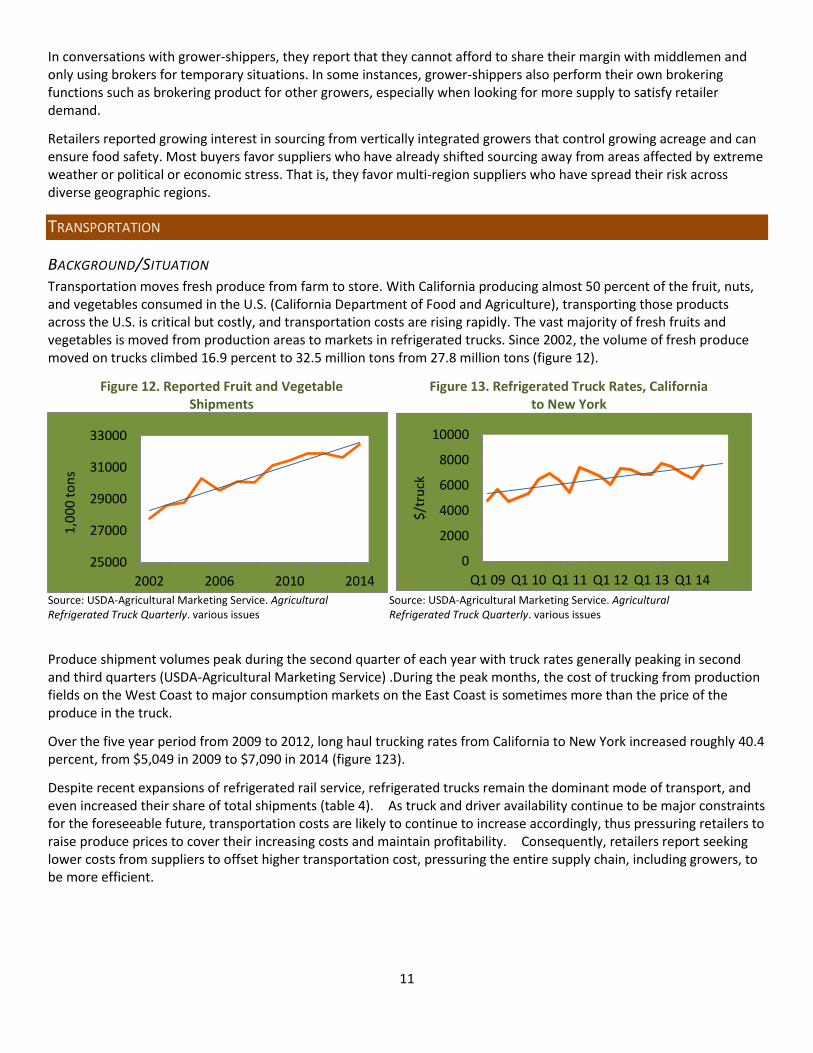
BACKGROUND/SITUATION Transportation moves fresh produce from farm to store. With California producing almost 50 percent of the fruit, nuts, and vegetables consumed in the U.S. (California Department of Food and Agriculture), transporting those products across the U.S. is critical but costly, and transportation costs are rising rapidly. The vast majority of fresh fruits and vegetables is moved from production areas to markets in refrigerated trucks. Since 2002, the volume of fresh produce moved on trucks climbed 16.9 percent to 32.5 million tons from 27.8 million tons (figure 12).
Figure 12. Reported Fruit and Vegetable Figure 13. Refrigerated Truck Rates, California Shipments to New York
Source: USDA-Agricultural Marketing Service. Agricultural Source: USDA-Agricultural Marketing Service. Agricultural Refrigerated Truck Quarterly. various issues Refrigerated Truck Quarterly. various issues
Produce shipment volumes peak during the second quarter of each year with truck rates generally peaking in second and third quarters (USDA-Agricultural Marketing Service) .During the peak months, the cost of trucking from production fields on the West Coast to major consumption markets on the East Coast is sometimes more than the price of the produce in the truck.
Over the five year period from 2009 to 2012, long haul trucking rates from California to New York increased roughly 40.4 percent, from $5,049 in 2009 to $7,090 in 2014 (figure 123).
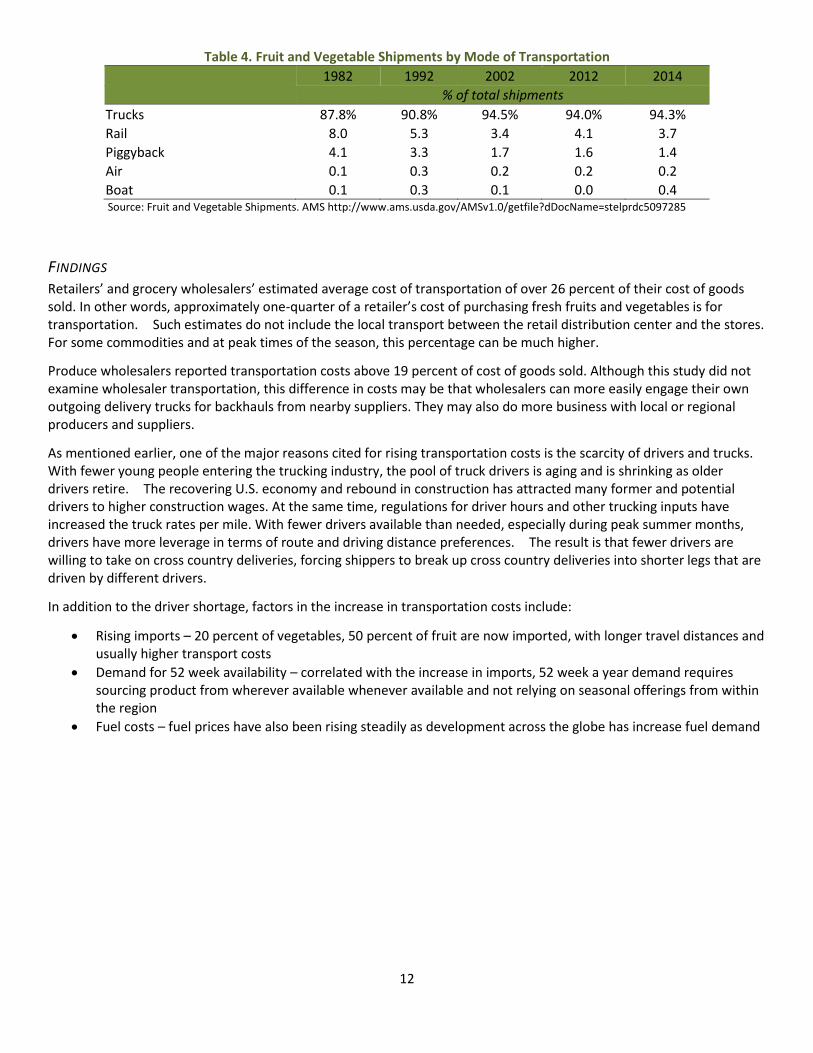
Despite recent expansions of refrigerated rail service, refrigerated trucks remain the dominant mode of transport, and even increased their share of total shipments (table 4). As truck and driver availability continue to be major constraints for the foreseeable future, transportation costs are likely to continue to increase accordingly, thus pressuring retailers to raise produce prices to cover their increasing costs and maintain profitability. Consequently, retailers report seeking lower costs from suppliers to offset higher transportation cost, pressuring the entire supply chain, including growers, to be more efficient.
25000
27000
29000
31000
33000
2002 2006 2010 2014
1,0
00
to
ns
0
2000
4000
6000
8000
10000
Q1 09 Q1 10 Q1 11 Q1 12 Q1 13 Q1 14
$/t
ruck
12
Table 4. Fruit and Vegetable Shipments by Mode of Transportation
1982 1992 2002 2012 2014
% of total shipments
Trucks 87.8% 90.8% 94.5% 94.0% 94.3%
Rail 8.0 5.3 3.4 4.1 3.7
Piggyback 4.1 3.3 1.7 1.6 1.4
Air 0.1 0.3 0.2 0.2 0.2
Boat 0.1 0.3 0.1 0.0 0.4 Source: Fruit and Vegetable Shipments. AMS http://www.ams.usda.gov/AMSv1.0/getfile?dDocName=stelprdc5097285
FINDINGS Retailers’ and grocery wholesalers’ estimated average cost of transportation of over 26 percent of their cost of goods sold. In other words, approximately one-quarter of a retailer’s cost of purchasing fresh fruits and vegetables is for transportation. Such estimates do not include the local transport between the retail distribution center and the stores. For some commodities and at peak times of the season, this percentage can be much higher.
Produce wholesalers reported transportation costs above 19 percent of cost of goods sold. Although this study did not examine wholesaler transportation, this difference in costs may be that wholesalers can more easily engage their own outgoing delivery trucks for backhauls from nearby suppliers. They may also do more business with local or regional producers and suppliers.
As mentioned earlier, one of the major reasons cited for rising transportation costs is the scarcity of drivers and trucks. With fewer young people entering the trucking industry, the pool of truck drivers is aging and is shrinking as older drivers retire. The recovering U.S. economy and rebound in construction has attracted many former and potential drivers to higher construction wages. At the same time, regulations for driver hours and other trucking inputs have increased the truck rates per mile. With fewer drivers available than needed, especially during peak summer months, drivers have more leverage in terms of route and driving distance preferences. The result is that fewer drivers are willing to take on cross country deliveries, forcing shippers to break up cross country deliveries into shorter legs that are driven by different drivers.
In addition to the driver shortage, factors in the increase in transportation costs include:
Rising imports – 20 percent of vegetables, 50 percent of fruit are now imported, with longer travel distances and usually higher transport costs
Demand for 52 week availability – correlated with the increase in imports, 52 week a year demand requires sourcing product from wherever available whenever available and not relying on seasonal offerings from within the region
Fuel costs – fuel prices have also been rising steadily as development across the globe has increase fuel demand
13
Buyers have three options for arranging transportation. They can arrange for trucks themselves, rely on their suppliers to arrange transportation, or use a third-party logistics provider. In 2014, retailers/grocery wholesalers arranged about 40 percent of transportation themselves and relied on their suppliers for another 40 percent (figure 14). Third-party providers arranged transportation about 20 percent of the time.
Produce wholesalers arrange more of their transportation than do supermarket companies: about 55 percent of their transportation is self-arranged. They rely on suppliers for 21 percent and third party logistics providers for 24 percent of produce transportation.
IMPLICATIONS The difficulties finding trucks and drivers for long hauls go beyond higher transportation costs. Suppliers report more drop shipments and transfers needed to get product across the country due to regulations limiting hours of driving time for drivers. These increase the likelihood of slower deliveries and interruptions in the cold chain required to maintain product quality.
These transportation issues also impact how shippers themselves organize their transportation or logistics departments. Conversations with shippers’ reveal their reactions to range from adding in-house logistics departments and controlling transportation as a competitive advantage to outsourcing all logistics to third-party provider in order to remain focused on their core business.
PROCUREMENT TECHNOLOGY SHIFT
BACKGROUND/SITUATION Rapidly evolving technologies are transforming many aspects of the food industry, not the least of which is the procurement process. The shift from analog technologies like telephone, fax, and paper toward digital technologies is easier in non-perishable product lines where labor, perishability and weather conditions are not as critical as in the produce sector. Electronic ordering systems have many advantages over analog technologies, eliminating many of the human errors that once plagued ordering and shipping produce. However, the immediate demands from harvest conditions to the nuances of quality often need a more personal, interactive mode of communication for which a phone conversation is often unequaled.
As major retailers embrace electronic systems, their buyers handle more and more items and have less time to cultivate and maintain personal relationships. They and their suppliers along the produce value chain face a dilemma. Switching to digital systems may well eliminate most accuracy and tracking issues but also reduces the richness of the personal relationships with suppliers and customers that help differentiate one supplier from another.
FINDINGS Produce order transmission by retailer/grocery wholesalers has shifted from 75 percent via phone/fax in 1997 to almost 80 percent transmitted electronically (email, EDI, and online ordering platforms) in 2014 (figure 15).
Figure 14. Responsibility for Arranging Produce Transportation, Percent of Orders Received, 2014
Source: Cornell study 2015
39.1 40.4
20.6
55.1
20.724.3
0
10
20
30
40
50
60
Arranged by self Arranged bysupplier
Arranged by 3rdparty
Retailers and GroceryWholesalers
Produce wholesalers
14
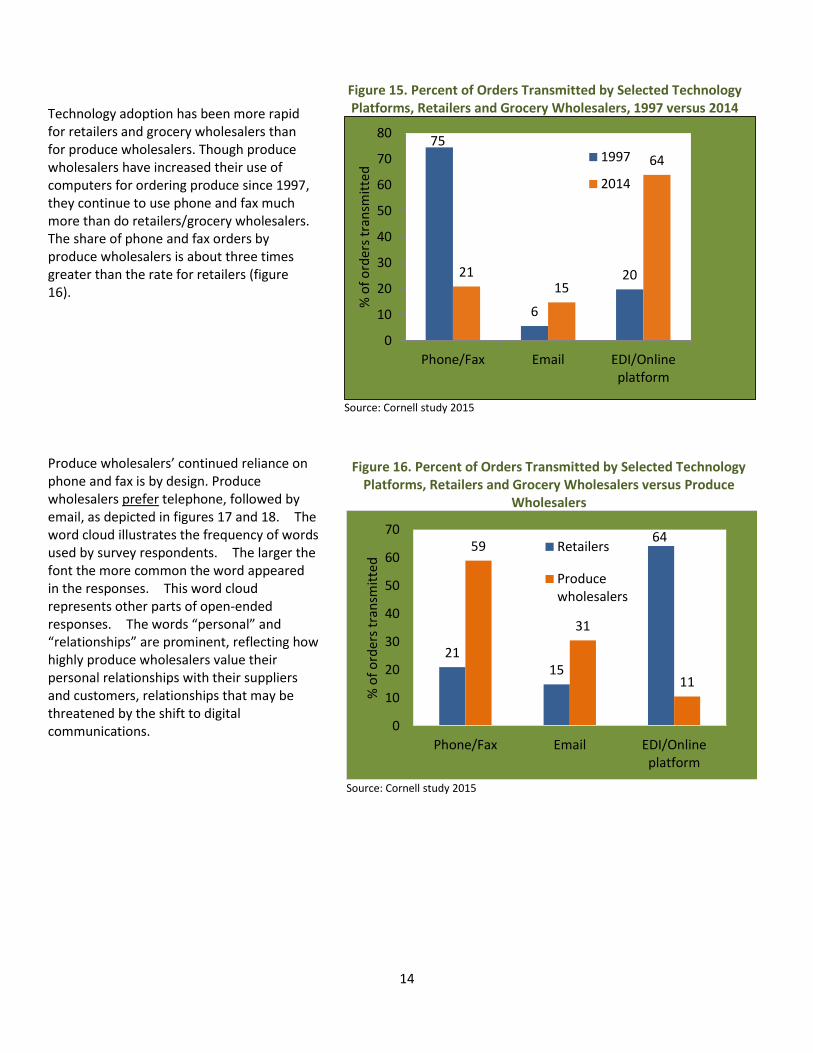
Technology adoption has been more rapid for retailers and grocery wholesalers than for produce wholesalers. Though produce wholesalers have increased their use of computers for ordering produce since 1997, they continue to use phone and fax much more than do retailers/grocery wholesalers. The share of phone and fax orders by produce wholesalers is about three times greater than the rate for retailers (figure 16).
Produce wholesalers’ continued reliance on phone and fax is by design. Produce wholesalers prefer telephone, followed by email, as depicted in figures 17 and 18. The word cloud illustrates the frequency of words used by survey respondents. The larger the font the more common the word appeared in the responses. This word cloud represents other parts of open-ended responses. The words “personal” and “relationships” are prominent, reflecting how highly produce wholesalers value their personal relationships with their suppliers and customers, relationships that may be threatened by the shift to digital communications.
Figure 15. Percent of Orders Transmitted by Selected Technology Platforms, Retailers and Grocery Wholesalers, 1997 versus 2014
Source: Cornell study 2015
75
6
202115
64
0
10
20
30
40
50
60
70
80
Phone/Fax Email EDI/Onlineplatform
% o
f o
rder
s tr
ansm
itte
d
1997
2014
Figure 16. Percent of Orders Transmitted by Selected Technology Platforms, Retailers and Grocery Wholesalers versus Produce
Wholesalers
Source: Cornell study 2015
2115
6459
31
11
0
10
20
30
40
50
60
70
Phone/Fax Email EDI/Onlineplatform
% o
f o
rder
s tr
ansm
itte
d
Retailers
Producewholesalers

15
IMPLICATIONS Electronic ordering systems, such as EDI or online networks such as Foodlink, are extremely labor efficient and make order transactions routine. These systems electronically integrate orders from buyers with sales systems from suppliers. In order to make the process routine, however, it relies on standardizing as many product attributes as possible. Standardizing product attributes also helps retailers price and merchandise product in-store.
Despite the inherent accuracy and reliability of electronic communications, one implication of the shift to electronic order transmission is that the quality of overall buyer-seller communication may suffer. Fresh produce cannot be fully standardized, thus ordering cannot be totally routine. Reducing the frequency of personal conversations that dominated the interactions of buyers and sellers in the past can also impact the quality and quantity of produce purchased.
One of the factors driving the increased use of electronic ordering exchanges is that category managers and buyers are handling many more items than they did in the past. With more items to manage, speed and accuracy of order transmission is paramount.
At the same time, many retail and grocery wholesale companies have adopted retail buyer staffing practices that often rotate buyers across departments to broaden their experience. One outcome of such practices is that new produce buyers may not have as much produce experience as in the past when produce buyers were typically promoted from within the ranks of produce specialists and managers within the produce department. New produce buyers are less familiar with produce specifications, supply volatility, and seasonal production shifts. Therefore, reliance on electronic order communication, despite its inherent accuracy, may result in poorer communication. One tradeoff of the efficiency of electronic communication is that suppliers need to work harder to engage produce buyers in conversations to ensure that those with less produce experience understand the current dynamics of the market for each commodity.
Figure 17. Preferences for Order Transmission, Retailers versus Produce Wholesalers, 2014
Source: Cornell study 2015
19
11
69
50
35
15
0
10
20
30
40
50
60
70
80
Phone/Fax Email EDI/Onlineplatform
% o
f re
spo
nd
ents
Retailers
Producewholesalers
Figure 18: Preferences for Order Transmission, Produce Wholesalers, 2014
Source: Cornell study 2015

16
Likewise, many retail formats that traditionally did not sell fresh fruits and vegetables are now selling them, and these companies may not have in-house produce expertise. Such companies may also suffer the consequences of relying on accurate electronic order communications at the possible expense of completeness of communication, especially when current market conditions are changing rapidly.
While buyers and sellers need to maximize efficiency they also need to minimize the loss of quality information they are receiving from suppliers. One implication is that the most effective suppliers will become more involved in helping buyers understand and manage their products.
Missed buying opportunities for buyers, sellers, and consumers as a result of poor quality information or missed communications are highly possible. Another consequence may be as buying specifications become more standardized and product purchasing becomes more routine, product waste will increase potentially resulting in higher fruit and vegetable prices for consumers.
CLIMATE AND ECONOMIC INSTABILITY
BACKGROUND/SITUATION
Climate change is having a profound impact on the produce industry. Episodic extreme weather events, once rare are now happening more often and, in many cases, increased severity. At the same time long term climate trends portend significant changes in the climate that are already affecting and will increasingly affect the climate in ways that impact growing seasons, rainfall, and other critical agricultural conditions.
Extended droughts, for example, in California, threaten the viability of many crops, especially ones that rely most heavily on irrigation, while competition with domestic and other commercial demands for water increase each year. California’s case is the most obvious and critical, due to the state’s large share of the nation’s fruit, vegetable, nut, and dairy production, but droughts have also affected many other regions of the U.S. where farming has traditionally relied on rainfall and thus agriculture does not have irrigation installed to offset dry conditions even when water supplies are nearby.
Economic and political changes also impact both demand and supply for produce. As consumers have grown accustomed to year round availability of many fruits and vegetables, the produce industry has become increasingly global. At the same time, sourcing product from worldwide markets introduces variability and complexity as economic and political situations in regions and individual countries impact both the supply and demand for fruits and vegetables. Beyond those realities, the dual needs of food safety and supply chain transparency add additional layers of complexity to produce procurement and distribution.
FINDINGS Interviewees described various strategies and measures their companies employ to mitigate these issues. Most prefer to deal with fewer but larger suppliers able to supply product year round, with direct control over the growing fields for products supplied. Many also reported a goal to source as much product as possible close to their retail operations to reduce transportation costs and time, provide fresher product with longer shelf life (in consumers’ homes), and support regional economies. While these goals seem divergent, these companies are simply responding to consumer demand for both year round supply and local foods.
Suppliers are also taking measures to mitigate climate change impacts. Some are drilling deep wells in California to ensure their own water supply during droughts. Some are exploring desalination plants. Some are relocating operations to regions or countries where water supplies are more reliable.
Economic growth in various developing nations has changed the dynamics of importing fruits and vegetables from traditionally reliable countries and regions. For example, China’s growing population and expanding economy has increased household income and demand for food. Competition from China for fruit and vegetable imports from countries like Chile has impacted the availability and cost of product available to U.S. importers. For instance, Chilean cherry exports to China doubled from 28,491 tons in the 2012/13 season to 77,000 tons in the 2014/15 season (Muñoz, 2015).

17
Implications – Managing risk is more important today as buyers must ensure year round consistency and safety of their supply chain in face of economic, political, and climate change. Consumer awareness and concern about where and how food is sourced, food safety, and food quality are at record levels and will likely increase as social media and the Internet allow increased access to information.
As these trends continue, the role of brokers and other intermediaries in the produce supply chain will change and likely be reduced. At the same time, as retailers grow, few suppliers can satisfy all needs internally, thus supplier consolidation or out-sourcing is inevitable.
One specific area that will be more challenging for the U.S. produce industry is the growing demand for organics. The increased availability of organics is fueling more demand as prices moderate to become more in line with conventionally grown produce and consumer awareness of the products increases. However, supply constraints loom large for organics, especially when year round availability is also a consumer expectation.
CONCLUSIONS
Retail and wholesale produce category managers and buyers are facing an increasingly complex procurement environment. Today’s supermarkets are pressured by consumers for year round availability of fruits and vegetables at affordable prices. To meet such consumer demand a host of supply chain issues—e.g., climate change, traceability, sustainability, local, limited transportation availability and others—must be addressed. All of these issues contribute to rising costs that must either be offset by efficiencies or reflected in higher retail prices.
This study investigated changes to retailer and wholesaler procurement practices in light of current demands on the supply chain. Topics included the structure of the procurement office, sourcing, buyer-seller relationships, and transportation. The study reveals that exceptional relationships and trust among buyers and sellers will be the most important means to deliver superior supply chain performance. Trust is gained by meeting and exceeding expectations in terms of quality, consistency, pricing, and volumes.
Retailers and wholesalers prefer the supplier to be totally transparent about supply issues in both good and bad supply situations. When supply conditions are strong or special opportunities arise for a limited scale or a short time, retailers expect suppliers to communicate those opportunities in a timely manner.
As consumer interest in food sources continues to increase, retailers focus on production and distribution systems to ensure that the products they procure are grown and handled in a safe manner through the entire supply chain from farm to store. Therefore, many retailers and grocery wholesalers prefer relationships with vertically integrated suppliers who provide all the certifications and traceability throughout their supply chain regardless of where the produce is grown.
Many produce wholesalers may be particularly vulnerable to their customers’ demands to provide certifications for all their suppliers.
While retailers reported preferring to use integrated suppliers who can meet their needs for volume, year-round availability, and traceability, at the same time, they want to purchase directly from growers to reduce distribution costs and shorten supply chains.
Procurement practices need to harness technology to provide buyers and sellers quality information. This may mean developing better “proactive procurement” practices and reducing “reactive procurement” practices. For example, vendor managed inventory (VMI) could be considered proactive as it places most inventory management decisions with the shipper, who has current product and market knowledge. VMI seems to be a practice of the past, but should it be revisited? VMI requires trust on the part of the retailer and exceptional performance on the part of the supplier,

18
however, it may reduce the number of “low-quality” transactional conversations leaving more time for “high-quality” strategic conversations.
In a world where consumers expect outstanding appearance and freshness, retailers are turning to flavor as a point of differentiation. Retailers are also asking for exclusive rights to that flavorful product in their marketplace, even for a limited time.
Retailers have been leveraging consumer demand for “local” foods to reduce transportation costs and perhaps to increase the flavor profile of their produce. Retailers are sometimes challenged, however, to provide local products in regions of the country where growing seasons and/or conditions are limited.
Local suppliers are being empowered by consumer demand for local foods. Cultivating relationships with reliable, high quality local suppliers is a costly process for retailers. Thus, local suppliers may exert disproportionate leverage on retailers in pricing and negotiations. As a result, most retailers reported that local produce is no more profitable than other produce.
Within the U.S., transportation is becoming a major constraint to receiving timely produce deliveries. The trucking industry struggles with driver shortages, an aging drivers, increased regulations, and higher fuel prices. As a result, even though the amount of produce transported via rail and air has grown, demand for refrigerated trucks has increased even more, Many retailers reported that a major consideration in selecting vendors is the vendor’s ability to ensure delivery.
The trends have significant implications for growers, shippers, and other produce suppliers. Retailer demand for vertical integration and supply chain coordination is likely to lead to further consolidation among suppliers. As large, vertically integrated suppliers partner with major retailers, there will be pressure on smaller suppliers to merge to meet retailer volume, quality, and logistics expectations.
Recent retailer mergers and acquisitions, and the likelihood of more to follow, will further consolidate produce buying power. Produce wholesalers and other supply chain participants face a rapidly changing business environment in which the dual pressures of increasing retailer concentration and retailer focus on supply chain transparency and traceability are raising costs of doing business across the supply chain while downward price pressure intensifies.
Relationships and responsiveness have long been key competitive advantages for success in the produce supply chain. To remain viable, suppliers will need to invest in technology, facilities, equipment, transportation, communication, food safety, and technical support to meet retailer expectations. This new model will also require significant cultural shifts for many supply chain companies, with current skills sets not necessarily being optimal in the future. New business models and management training will be key for supplier organizations to ramp up talent and capabilities to conduct business effectively in tomorrow’s marketplace.

19
REFERENCES
California Department of Food and Agriculture. California Agricultural Production Statistics. website: http://www.cdfa.ca.gov/statistics/.
McLaughlin, Edward W., Park, Kristen, Perosio, Debra J., and Green, Geoffrey M. 1999. The New Dynamics of Produce Buying and Selling. Dyson School of Applied Economics and Management, R.B. 99-10, Cornell University, Ithaca, NY.
McLaughlin, Edward W., Perosio, Debra J. 1994. Fresh Fruit and Vegetable Procurement Dynamics: The Role of the Supermarket Buyer. Department of Agricultural Economics, Cornell University, Ithaca, NY.
Muoz, Marcelo V. 2015. “Cerezas-exportaciones-producción-superficie-precios-variedades.” OFICINA DE ESTUDIOS Y POLÍTICAS AGRARIAS. Agosto de 2015. www.odepa.gob.cl.
Nielsen Perishables Group 2015. FreshFacts® Data.
Perosio, Debra J., McLaughlin, Edward W., Cuellar, Sandra, and Park Kristen. 2001. Supply Chain Management in the Produce Industry. Dyson School of Economics and Management R.B. 01-05. Cornell University, Ithaca, NY.
Progressive Grocer Source: Consumer Expenditures Study, Supermarket Business, September 1996 and 2001 and Progressive Grocer, September 2006, 2011, and 2015.
Progressive Grocer, Retail Produce & Floral Review, various issues, October 2000 through 2014.
U.S. Census Bureau, Economic Census, 1997, 2002, and 2007, Miscellaneous Series.
USDA-Agricultural Marketing Service, Agricultural Refrigerated Truck Quarterly. various issues.
USDA-Agricultural Marketing Service, Fruit and Vegetable Shipments. various issues. http://www.ams.usda.gov/AMSv1.0/ams.fetchTemplateData.do?template=TemplateR&page=FVMNSummaryLinkTable.
USDA-Economic Research Service, 1964. The Structure of Wholesale Produce Markets. AER No. 45. Washington, D.C.