Procyclical Behavior of Institutional Investors During the ... · adapted to each institutional...
53
Procyclical Behavior of Institutional Investors During the Recent Financial Crisis: Causes, Impacts, and Challenges Michael G. Papaioannou, Joonkyu Park, Jukka Pihlman, and Han van der Hoorn WP/13/193
-
Upload
vuongkhanh -
Category
Documents
-
view
214 -
download
0
Transcript of Procyclical Behavior of Institutional Investors During the ... · adapted to each institutional...
Procyclical Behavior of Institutional Investors
During the Recent Financial Crisis:
Causes, Impacts, and Challenges
Michael G. Papaioannou, Joonkyu Park,
Jukka Pihlman, and Han van der Hoorn
WP/13/193
© 2013 International Monetary Fund
IMF Working Paper
Monetary and Capital Markets Department
Procyclical Behavior of Institutional Investors during the Recent Financial Crisis:
Causes, Impacts, and Challenges
Prepared by Michael G. Papaioannou, Joonkyu Park, Jukka Pihlman, and
Han van der Hoorn1
Authorized for distribution by Luc Everaert
September 2013
Abstract
This paper (i) provides evidence on the procyclical investment behavior of major institutional
investors during the global financial crisis; (ii) identifies the main factors that could account for
such behavior; (iii) discusses the implications of procyclical behavior; and (iv) proposes a
framework for sound investment practices for long-term investors. Such procyclical investment
behavior is understandable and may be considered rational from an individual institution’s
perspective. However, our main conclusion is that behaving in a manner consistent with long-
term investing would lead to better long-term, risk-adjusted returns and, importantly, could
lessen the potential adverse effects of the procyclical investment behavior of institutional
investors on global financial stability.
JEL Classification Numbers: G01; G11; G15; G21; G23; G32; H12
Keywords: Financial crisis, long-term investments,institutional investors, procyclicality
Authors’ E-Mail Addresses: [email protected], [email protected], [email protected],
1 Jukka Pihlman and Han van der Hoorn were previously with the Monetary and Capital Markets Department of the
IMF and currently work with Standard Chartered Bank and PGGM, respectively. We are grateful to
Abdullah Al-Hassan, Luc Everaert, Roberts Grava, Anna Ilyina, Bradley Anthony Jones, Lev Ratnovski, Bayasgalan
Rentsendorj, and Robert Sheehy for insightful comments and suggestions. The usual disclaimer applies.
This Working Paper should not be reported as representing the views of the IMF.
The views expressed in this Working Paper are those of the author(s) and do not necessarily
represent those of the IMF or IMF policy. Working Papers describe research in progress by the
author(s) and are published to elicit comments and to further debate.
WP/13/193
2
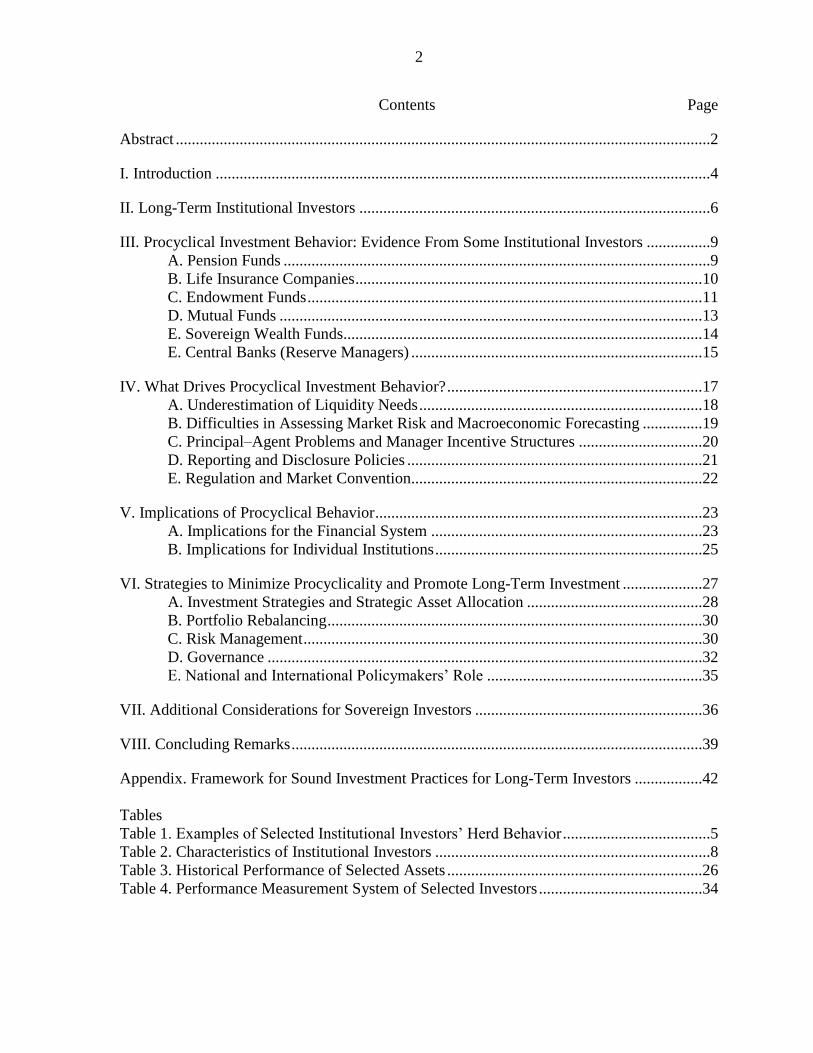
Contents Page
Abstract ......................................................................................................................................2
I. Introduction ............................................................................................................................4
II. Long-Term Institutional Investors ........................................................................................6
III. Procyclical Investment Behavior: Evidence From Some Institutional Investors ................9
A. Pension Funds ...........................................................................................................9 B. Life Insurance Companies .......................................................................................10 C. Endowment Funds ...................................................................................................11
D. Mutual Funds ..........................................................................................................13 E. Sovereign Wealth Funds..........................................................................................14 E. Central Banks (Reserve Managers) .........................................................................15
IV. What Drives Procyclical Investment Behavior? ................................................................17
A. Underestimation of Liquidity Needs .......................................................................18 B. Difficulties in Assessing Market Risk and Macroeconomic Forecasting ...............19 C. Principal–Agent Problems and Manager Incentive Structures ...............................20 D. Reporting and Disclosure Policies ..........................................................................21 E. Regulation and Market Convention .........................................................................22
V. Implications of Procyclical Behavior ..................................................................................23
A. Implications for the Financial System ....................................................................23 B. Implications for Individual Institutions ...................................................................25
VI. Strategies to Minimize Procyclicality and Promote Long-Term Investment ....................27
A. Investment Strategies and Strategic Asset Allocation ............................................28 B. Portfolio Rebalancing ..............................................................................................30 C. Risk Management ....................................................................................................30 D. Governance .............................................................................................................32 E. National and International Policymakers’ Role ......................................................35
VII. Additional Considerations for Sovereign Investors .........................................................36
VIII. Concluding Remarks .......................................................................................................39
Appendix. Framework for Sound Investment Practices for Long-Term Investors .................42
Tables
Table 1. Examples of Selected Institutional Investors’ Herd Behavior .....................................5
Table 2. Characteristics of Institutional Investors .....................................................................8
Table 3. Historical Performance of Selected Assets ................................................................26
Table 4. Performance Measurement System of Selected Investors .........................................34
3
Figures
Figure 1. Asset Size of Selected Institutional Investors ............................................................8
Figure 2. Net Purchases of Equities by Pension Funds in Selected Countries ........................10
Figure 3. U.S. Life Insurance Companies’ Asset Allocation ...................................................11
Figure 4. Harvard and Yale Endowment Fund Portfolios .......................................................12
Figure 5. Net Inflows to Various Mutual Funds ......................................................................13
Figure 6. Difficulties in Maintaining Consistency in Investment Policy.................................15
Figure 7. Composition of Global Reserves ..............................................................................16
Figure 8. Evolution of Currency Composition of Reserves .....................................................17
Figure 9. Evolution of Global Central Bank Gold Holdings ...................................................17
Figure 10. Evolution of VIX on S&P 500 ...............................................................................19
Figure 11. Growth in Global Financial Assets .........................................................................24
Figure 12. Flight to Quality and Selected Indicators ...............................................................25
Figure 13. Change in Treasury Securities Holdings (2008 vs. 2007) ......................................25
Figure 14. CalPERS’ Strategic Asset Allocation .....................................................................28
Figure 15. Alaska Permanent Fund Corporation’s SAA by Asset Class and ..........................29
Figure 16. Asset Compositions of Korea’s Foreign Reserves and Korea’s SWF ...................37
Appendix. Framework for Sound Investment Practices for Long-Term Investors .................42
References ................................................................................................................................45
4
I. INTRODUCTION
The global financial crisis caught many financial market participants by surprise. Institutional
investors, by and large, were no exception. As the crisis intensified, concerns about capital
preservation arose, and several investors responded by abandoning long-term investment
strategies, reducing risk exposures, and switching to safer asset classes, usually with the
intention to switch back as soon as market conditions improved. Exceptions certainly exist,
but as a group, institutional investors tended to move with the rest of the market. This
“institutional herding” is what we refer to in this paper as procyclical investment behavior.2
It is well documented that the financial system is inherently procyclical, and that this
procyclicality can be economically and financially harmful, especially in a downturn (Borio,
Furfine, and Lowe, 2001; Rochet, 2008; BIS, 2008; Hardouvelis, 2010; Danielsson, 2013).
The Financial Stability Forum (FSF, 2009) refers to procyclicality as “the dynamic
interactions (positive feedback mechanisms) between the financial and the real sectors of the
economy. These mutually reinforcing interactions tend to amplify business cycle fluctuations
and cause or exacerbate financial instability.” As the global financial crisis has reaffirmed,
this instability can easily feed through into the real economy.3 The banking sector is
especially prone to this procyclicality, as high leverage, in combination with rigid market-
based risk management systems and capital requirements, triggers a tightening of credit
standards in an economic downturn (Persaud, 2000; Gerlach and Gruenwald, 2006;
Brunnermeier, 2009; Fernandez de Lis and García-Herrero, 2010).4
Many institutional investors have long investment horizons, which allow them to ride out
short-term volatility in asset prices. In theory, they should be able to avoid the pitfalls of
herding, which tends to hurt performance in the long run. Recent financial stress episodes
have, however, demonstrated that various types of institutional investors are not immune to
herd behavior (Table 1 and Section III).
2 Herding or investing procyclically is closely related to momentum investing. The former refers to investors
buying and selling the same assets at the same time. Momentum investing refers to buying assets that were past
winners and selling those that were past losers. Evidently, there is significant overlap between the two concepts.
3 The notion that financial markets and the real economy can be mutually reinforcing is known as the financial
accelerator. The term was introduced by Bernanke, Gertler, and Gilchrist (1996), but the concept dates back to
Fisher (1933).
4 Efforts to make the financial system less procyclical have concentrated on the banking sector (FSF, 2009, and
various publications of the Basel Committee on Banking Supervision—BCBS). The initiatives taken by the
BCBS include an analysis of the impact of countercyclical capital buffers on credit supply in good and bad
times. Countercyclical bank buffers, it is argued, mitigate bank procyclicality; in particular, they reduce credit
availability in good times and increase it in bad times, in general, for macroprudential purposes.
5
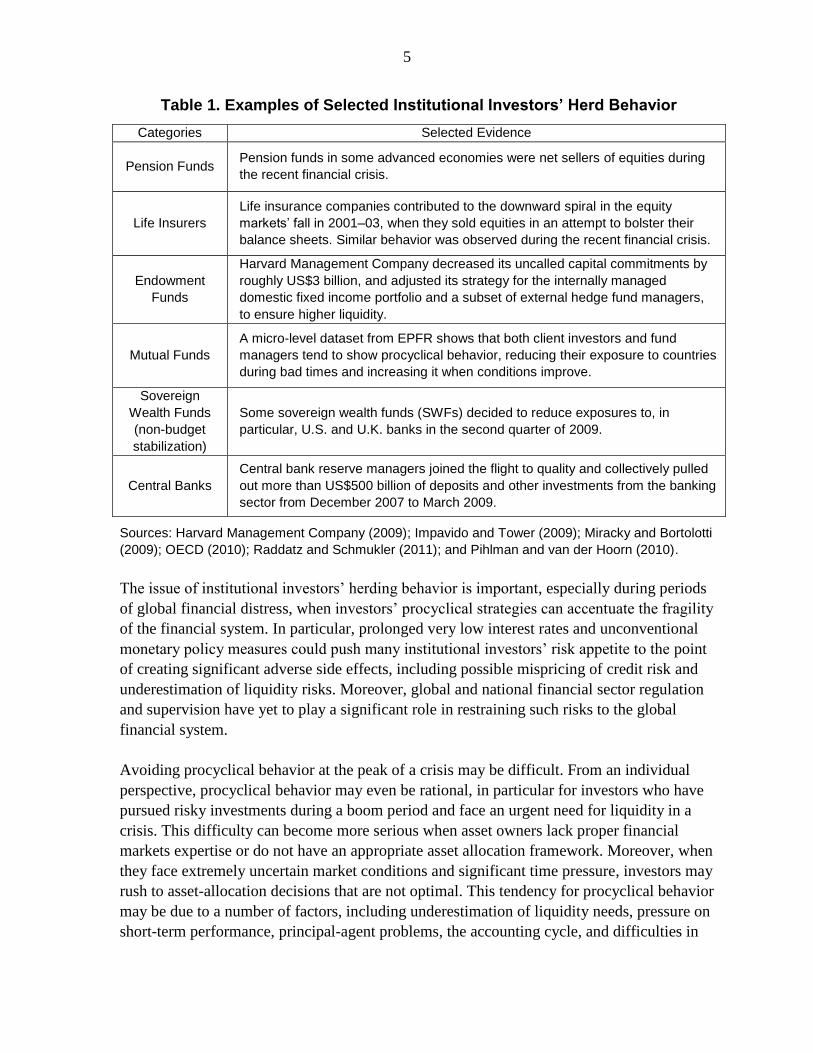
Table 1. Examples of Selected Institutional Investors’ Herd Behavior
Categories Selected Evidence
Pension Funds Pension funds in some advanced economies were net sellers of equities during
the recent financial crisis.
Life Insurers
Life insurance companies contributed to the downward spiral in the equity
markets’ fall in 2001–03, when they sold equities in an attempt to bolster their
balance sheets. Similar behavior was observed during the recent financial crisis.
Endowment
Funds
Harvard Management Company decreased its uncalled capital commitments by
roughly US$3 billion, and adjusted its strategy for the internally managed
domestic fixed income portfolio and a subset of external hedge fund managers,
to ensure higher liquidity.
Mutual Funds
A micro-level dataset from EPFR shows that both client investors and fund
managers tend to show procyclical behavior, reducing their exposure to countries
during bad times and increasing it when conditions improve.
Sovereign
Wealth Funds
(non-budget
stabilization)
Some sovereign wealth funds (SWFs) decided to reduce exposures to, in
particular, U.S. and U.K. banks in the second quarter of 2009.
Central Banks
Central bank reserve managers joined the flight to quality and collectively pulled
out more than US$500 billion of deposits and other investments from the banking
sector from December 2007 to March 2009.
Sources: Harvard Management Company (2009); Impavido and Tower (2009); Miracky and Bortolotti
(2009); OECD (2010); Raddatz and Schmukler (2011); and Pihlman and van der Hoorn (2010).
The issue of institutional investors’ herding behavior is important, especially during periods
of global financial distress, when investors’ procyclical strategies can accentuate the fragility
of the financial system. In particular, prolonged very low interest rates and unconventional
monetary policy measures could push many institutional investors’ risk appetite to the point
of creating significant adverse side effects, including possible mispricing of credit risk and
underestimation of liquidity risks. Moreover, global and national financial sector regulation
and supervision have yet to play a significant role in restraining such risks to the global
financial system.
Avoiding procyclical behavior at the peak of a crisis may be difficult. From an individual
perspective, procyclical behavior may even be rational, in particular for investors who have
pursued risky investments during a boom period and face an urgent need for liquidity in a
crisis. This difficulty can become more serious when asset owners lack proper financial
markets expertise or do not have an appropriate asset allocation framework. Moreover, when
they face extremely uncertain market conditions and significant time pressure, investors may
rush to asset-allocation decisions that are not optimal. This tendency for procyclical behavior
may be due to a number of factors, including underestimation of liquidity needs, pressure on
short-term performance, principal-agent problems, the accounting cycle, and difficulties in
6
risk assessment and projection. Overcoming these constraints requires changes in behavior,
as well as in the institutional set-up.
This paper analyzes the procyclical investment behavior of a wide variety of classes of
institutional investors during the recent crisis. Their individual and collective behaviors can
create the tendency for the whole system to act in a certain way. Our focus is on identifying
the key causes of herd behavior and exploring possible good practices that address herd
behavior. In particular, we try to develop a framework that could help long-term institutional
investors set up their investment policies in ways that avoid purely individualistic procyclical
behavior which undermines financial stability. The paper advocates an approach that is based
mainly on prevention (i.e., minimizing ex ante the likelihood that an investor may behave
procyclically ex post).5 This mainly entails a combination of a more forward-looking
strategic asset allocation, portfolio rebalancing, sophisticated risk management, appropriate
incentive structures for portfolio managers, and sound governance.
Based on these considerations, a broad framework for sound investment practices for typical
institutional investors is proposed (see Appendix). These practices are intended to help
institutional investors determine their investment policies on the basis of sound financial risk
and return-related considerations, taking into account key lessons from crises and
uncertainties in the financial markets. In this way, long-term investors can avoid, for
example, a “herd” sale of assets to cover liquidity shortfalls, which might have been caused
by excessive risk taking during a boom period. Also, these practices are not meant to be a
“one-size-fits-all” investment policy (e.g., long positions only), as policies would need to be
adapted to each institutional investor’s unique characteristics (e.g., objectives, liabilities,
capacity, home country regulations).
The paper is organized as follows. Section II provides taxonomy of long-term institutional
investors and explains their main characteristics. Section III presents evidence of procyclical
behavior during the recent global financial crisis. Sections IV and V discuss, respectively, the
main reasons for investors’ procyclical behavior and the implications of such behavior.
Based on this analysis, Section VI presents several options for minimizing procyclical
behavior, and Section VII addresses some special considerations for sovereign investors.
Finally, Section VIII provides concluding remarks on the benefits for institutional investors
of taking global financial stability considerations into account.
II. LONG-TERM INSTITUTIONAL INVESTORS
Financial markets theory presumes rational behavior of both short-term and long-term
investors for the efficient allocation of capital. Typically, short-term investors trade
5 The paper does not attempt to provide policy remedies, either domestic or international, to curb procyclical
behavior by long-term institutional investors, including at times of financial distress.
7
frequently and thus contribute to market liquidity, which facilitates price discovery. They
intend to exploit mispricings, thus making markets more efficient. On the other hand, long-
term investors can provide stable sources of funding to governments and companies, as well
as to critical long-term projects for economic development such as infrastructure and
research and development investment (World Economic Forum, 2011). The maturity
structure of liabilities usually separates long- and short-term investors. Many long-term
investors, especially some SWFs, have relatively longer-term liabilities or sometimes no
(explicit) expenditure requirements. The OECD (2013) argues that institutional investors
generally benefit from a stable net income flow and can follow a less cyclical investment
pattern.
We define long-term investors as those who have the intention of holding an asset for
multiple years and are not expected to liquidate their positions in the short term. This
definition does not rule out selling assets before they mature. Even long-term investors may
need to dispose of part of their assets under certain conditions, including (i) portfolio
rebalancing; (ii) unexpected events (e.g., accounting fraud, natural disasters); (iii) tactical
positioning for overvalued or insolvent assets; and (iv) legally mandated liquidations (e.g.,
conservatorship on issuers). What is important is the decision-making process and intention
at the time of purchasing an asset.
Long-term institutional investors typically include pension funds, life insurance companies,
endowment funds, mutual funds, non-budget stabilization SWFs, and central banks (Table 2).
The classification as short-term or long-term investors may evolve over time. Pension funds,
for instance, can migrate from long-term to short-term as their membership matures.
Similarly, the horizon of SWFs capitalized by non-renewable natural resources shortens as
these resources are exhausted. Banks are not considered long-term investors, even though as
maturity transformers they do have long-term assets. Their share of capital allocated to long-
term investing is limited by regulatory and capital constraints on the maturity mismatch
between their assets and liabilities. Other private sector investors, such as hedge funds and
private equity firms, are also excluded from our analysis as they follow a wide range of asset
management strategies which are different from those of traditional institutional investors.6
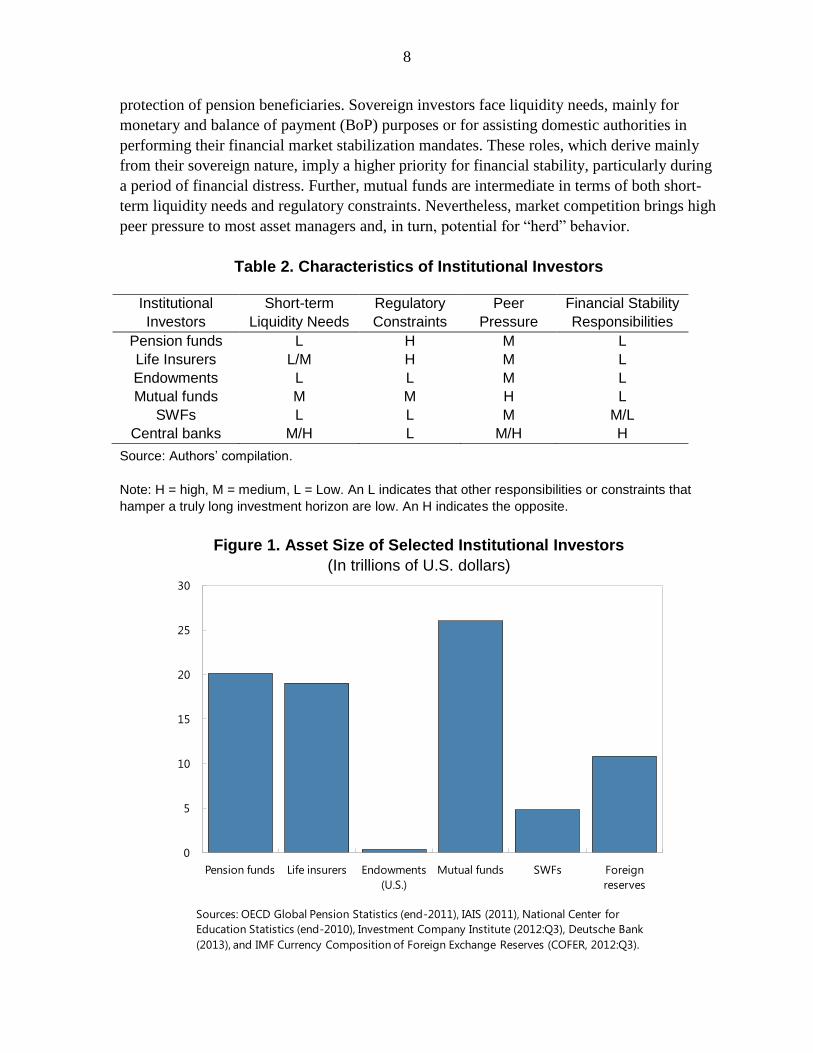
Regarding asset size, mutual funds, pension funds, and life insurance companies dominate,
while foreign reserves of central banks and assets of SWFs are increasing rapidly, especially
in emerging economies (Figure 1). Table 2 shows some of the main characteristics of various
institutional investors. For example, endowment funds have few (explicit) liabilities and are
not subject to regulatory constraints, enabling them to pursue a very long investment horizon
with a significant allocation to illiquid assets. Pension funds have relatively limited needs for
short-term liquidity beyond predictable payments to existing beneficiaries, due to their long-
term liability structure, but they are typically under a stricter regulatory framework for the
6 In many cases, classifying their strategies is difficult because their asset management styles change and evolve
rapidly.
8
protection of pension beneficiaries. Sovereign investors face liquidity needs, mainly for
monetary and balance of payment (BoP) purposes or for assisting domestic authorities in
performing their financial market stabilization mandates. These roles, which derive mainly
from their sovereign nature, imply a higher priority for financial stability, particularly during
a period of financial distress. Further, mutual funds are intermediate in terms of both short-
term liquidity needs and regulatory constraints. Nevertheless, market competition brings high
peer pressure to most asset managers and, in turn, potential for “herd” behavior.
Table 2. Characteristics of Institutional Investors
Institutional
Investors
Short-term
Liquidity Needs
Regulatory
Constraints
Peer
Pressure
Financial Stability
Responsibilities
Pension funds L H M L
Life Insurers L/M H M L
Endowments L L M L
Mutual funds M M H L
SWFs L L M M/L
Central banks M/H L M/H H
Source: Authors’ compilation.
Note: H = high, M = medium, L = Low. An L indicates that other responsibilities or constraints that
hamper a truly long investment horizon are low. An H indicates the opposite.
Figure 1. Asset Size of Selected Institutional Investors
(In trillions of U.S. dollars)
0
5
10
15
20
25
30
Pension funds Life insurers Endowments
(U.S.)
Mutual funds SWFs Foreign
reserves
Sources: OECD Global Pension Statistics (end-2011), IAIS (2011), National Center for
Education Statistics (end-2010), Investment Company Institute (2012:Q3), Deutsche Bank
(2013), and IMF Currency Composition of Foreign Exchange Reserves (COFER, 2012:Q3).
9
PROCYCLICAL INVESTMENT BEHAVIOR: EVIDENCE FROM SOME INSTITUTIONAL
INVESTORS
Our analysis of procyclical investment behavior starts around the time that central banks in
advanced economies announced measures to address liquidity problems in the market,
(i.e., 2007–08). This period marks the realization that the imbalances built up in the
preceding period were unsustainable (Kjaer, 2010). Certainly, behavior prior to 2007 was
equally procyclical. We focus on the downturn, as this is where procyclicality is the most
harmful because of the tendency of the imbalances to unravel uncontrollably in a short period
of time.
The empirical evidence that we have collected (some of which is anecdotal) from various
data sources and studies, although incomplete, suggests that many institutional long-term
investors engaged in procyclical investment actions during the recent crisis, though the extent
of such behavior varied depending on investment styles and market conditions. We discuss
below some of the actions of the main global institutional investors such as pension funds,
life insurance companies, endowments, mutual funds, SWFs, and central banks (reserve
managers).
A. Pension Funds
Many defined contribution (DC) pension funds with rate of return guarantees tend to have
similar benchmarks, thereby creating an incentive for herd behavior. Such behavior can have
a spillover impact on capital markets through trading activities. According to the World
Economic Forum (2011), these institutions “feel that their countercyclical role in the markets
has begun to change as regulatory and accounting changes (e.g., mark-to-market accounting
and strict solvency regimes) have forced institutions to be concerned with short-term changes
in market prices. Therefore, the investment strategies and behaviors of these institutions have
become more procyclical.”
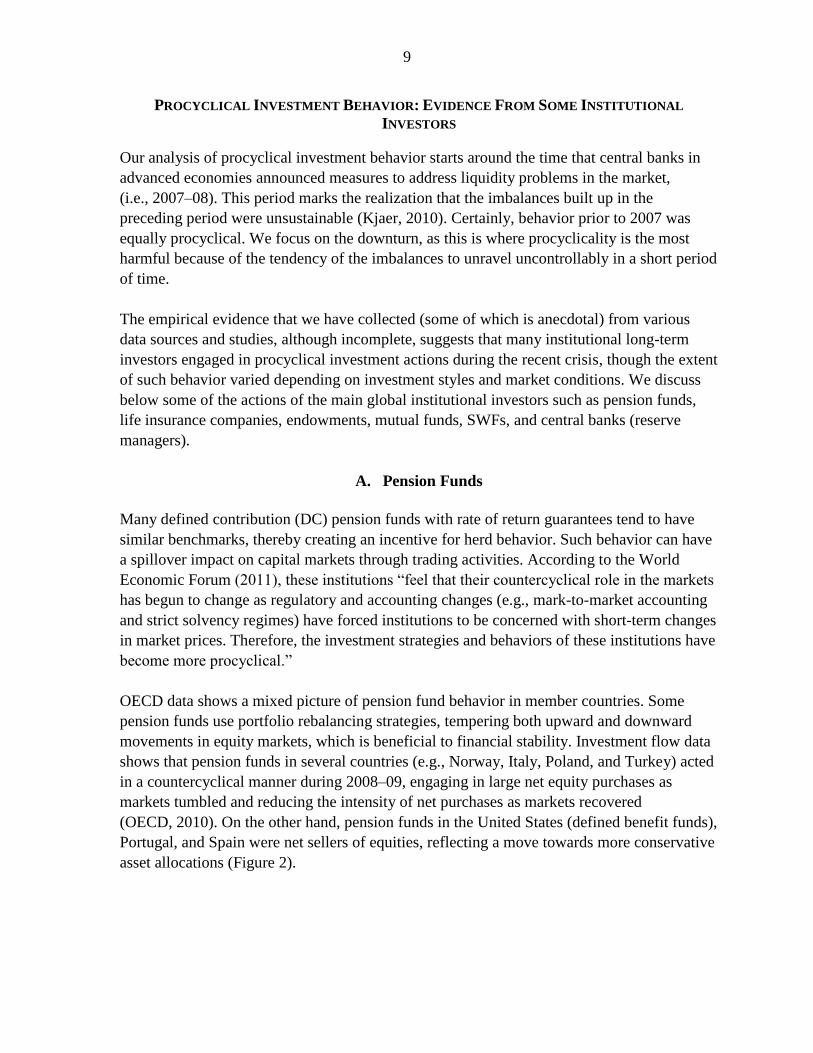
OECD data shows a mixed picture of pension fund behavior in member countries. Some
pension funds use portfolio rebalancing strategies, tempering both upward and downward
movements in equity markets, which is beneficial to financial stability. Investment flow data
shows that pension funds in several countries (e.g., Norway, Italy, Poland, and Turkey) acted
in a countercyclical manner during 2008–09, engaging in large net equity purchases as
markets tumbled and reducing the intensity of net purchases as markets recovered
(OECD, 2010). On the other hand, pension funds in the United States (defined benefit funds),
Portugal, and Spain were net sellers of equities, reflecting a move towards more conservative
asset allocations (Figure 2).
10
Figure 2. Net Purchases of Equities by Pension Funds in Selected Countries
(Annual change in percent)
B. Life Insurance Companies
Life insurance companies tend to have a long-term investment orientation, due to the long-
term nature of their liabilities, and take limited investment risk.7 A relatively strong
regulatory framework has contributed to maintaining life insurers’ conservative asset
allocation (Rudolph, 2011). Nevertheless, risky activities grew in retirement savings products
in some advanced economies during the past decade. Annuity products, offering return
guarantees, increased substantially in the United States, reflecting in part marketing strategies
designed to compete with other pension products like the 401(K).
Further, some insurance-dominated conglomerates conducted investment bank-like lending
activities. The systemic relevance of these groups was magnified by activities that went
beyond the traditional insurance business field. One prime example was the credit default
swap (CDS) business conducted by AIG Financial Products, a non-insurance subsidiary of
AIG. These companies were not immune to liquidity risk, especially when negative
developments (e.g., a rating downgrade) triggered collateral calls or liquidity shocks rapidly
led to increased claims over available liquidity. Under these circumstances, some life
insurance companies turned to procyclical asset sales to mitigate the respective adverse
effects on their balance sheets.
7 In contrast, non-life insurance companies are generally not regarded as long-term investors, as they often need
to liquidate their assets to cover short-term drains on their portfolios when big accidents or natural disasters hit.
-30
-20
-10
0
10
20
30
40
50
Spain USA Finland Portugal Poland Turkey Norway Italy
2008 2009
Source: OECD Global Pension Statistics.
11
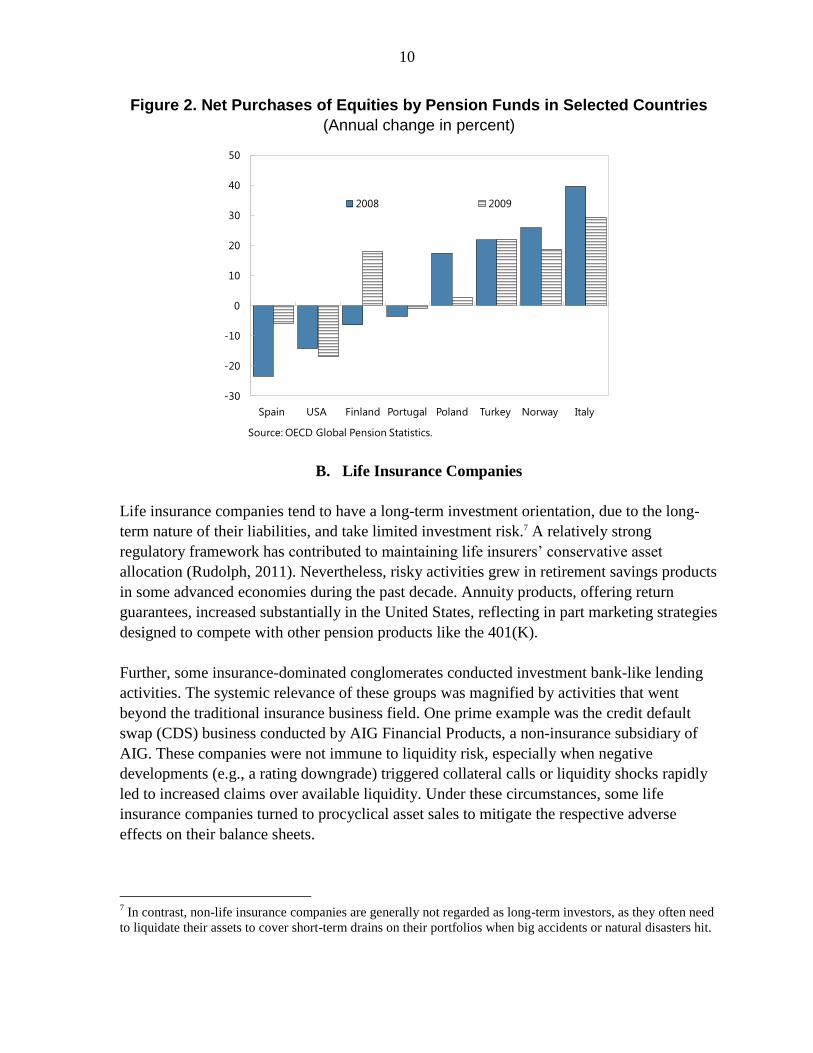
However, the evidence of life insurance companies’ procyclical behavior during the recent
financial crisis is mixed. Rudolph (2011) found that U.S. life insurance companies’ asset
allocations stayed remarkably steady through 2001–10, with only about 3 percent moving
from equities to bonds (+ 2 percent) and cash (+ 1 percent) in 2007–08, although this may
reflect valuation effects and was partially reversed in 2009 (Figure 3). On the other hand,
Impavido and Tower (2009) found that life insurance companies contributed to the
downward spiral during the equity markets’ fall in 2001–03 when they sold equities in an
attempt to bolster their balance sheets that led to further declines in the market.8 According to
the latter study, sales of equities and other financial instruments by this class of institutional
investors have been more widespread in the recent financial crisis.
Figure 3. U.S. Life Insurance Companies’ Asset Allocation
C. Endowment Funds
For many years before the crisis, wide portfolio diversification with a focus on alternative
asset classes was a prevalent trend in endowment investing. Following Yale and Harvard and
inspired by the pioneering work of Swensen (2009), many endowments allocated an
increasing share of their portfolios into illiquid assets such as private equities, hedge funds,
and real assets. However, the global financial crisis caused large losses and a shift of their
strategies away from illiquid assets.
Asset allocation data from Harvard and Yale show that their overall strategic asset allocation
has remained consistent with their long-term investment objectives (i.e., a stable allocation
toward alternative assets). However, both endowment funds’ negative cash position during
8 IAIS (2011) also finds that U.K. life insurers came under pressure due to the significant fall in equity prices
and, thus, needed to sell their assets into an already unstable market.
0%
10%
20%
30%
40%
50%
60%
70%
80%
90%
100%
2006 2007 2008 2009
Cash Bonds Mortgage Loans Equities Real Estate Others
Source: Rudolph (2011).
12
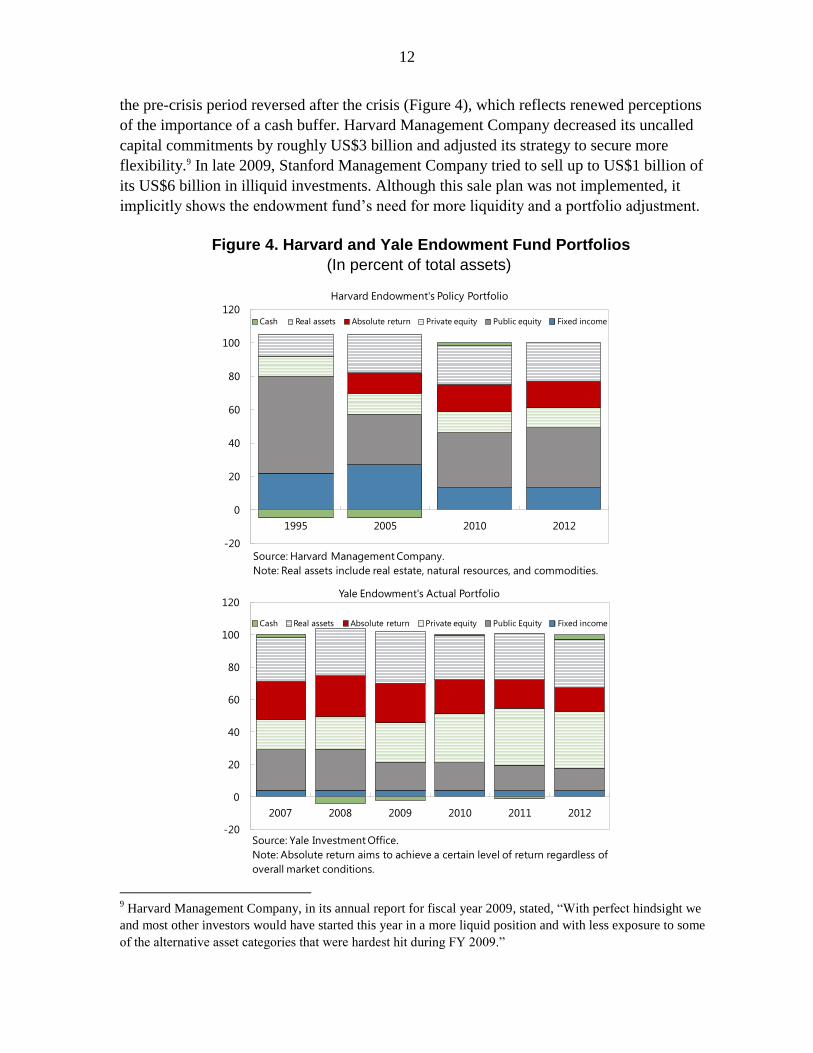
the pre-crisis period reversed after the crisis (Figure 4), which reflects renewed perceptions
of the importance of a cash buffer. Harvard Management Company decreased its uncalled
capital commitments by roughly US$3 billion and adjusted its strategy to secure more
flexibility.9 In late 2009, Stanford Management Company tried to sell up to US$1 billion of
its US$6 billion in illiquid investments. Although this sale plan was not implemented, it
implicitly shows the endowment fund’s need for more liquidity and a portfolio adjustment.
Figure 4. Harvard and Yale Endowment Fund Portfolios
(In percent of total assets)
9 Harvard Management Company, in its annual report for fiscal year 2009, stated, “With perfect hindsight we
and most other investors would have started this year in a more liquid position and with less exposure to some
of the alternative asset categories that were hardest hit during FY 2009.”
-20
0
20
40
60
80
100
120
1995 2005 2010 2012
Harvard Endowment's Policy Portfolio
Cash Real assets Absolute return Private equity Public equity Fixed income
Source: Harvard Management Company.
Note: Real assets include real estate, natural resources, and commodities.
-20
0
20
40
60
80
100
120
2007 2008 2009 2010 2011 2012
Yale Endowment's Actual Portfolio
Cash Real assets Absolute return Private equity Public Equity Fixed income
Source: Yale Investment Office.
Note: Absolute return aims to achieve a certain level of return regardless of
overall market conditions.
13
According to Preqin’s survey report in 2009, 57 percent of endowments had altered their
private equity strategy through, for example, more stringent due diligence, reductions in
commitments, and postponement of investments. Some endowments, despite their very long-
term investment horizon, faced liquidity issues during the financial crisis. A Center for Social
Philanthropy and Tellus Institute (2010) study of six university endowments found evidence
of taking on excessive risks and investing in overcrowded asset classes prior to the crisis. The
study argues that the funds played a role in magnifying certain systemic risks in the capital
markets. The study reports that during the crisis “illiquidity in particular forced endowments
to sell what few liquid holdings they had into tumbling markets, magnifying volatile price
declines even further.”
D. Mutual Funds
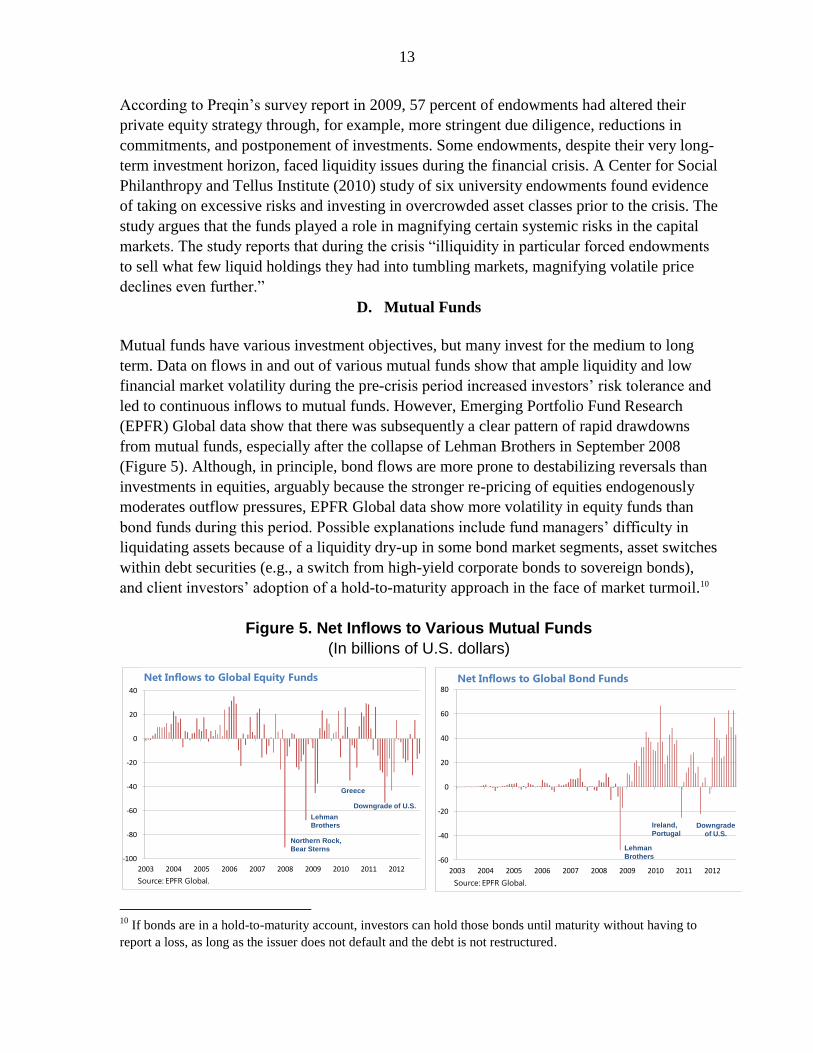
Mutual funds have various investment objectives, but many invest for the medium to long
term. Data on flows in and out of various mutual funds show that ample liquidity and low
financial market volatility during the pre-crisis period increased investors’ risk tolerance and
led to continuous inflows to mutual funds. However, Emerging Portfolio Fund Research
(EPFR) Global data show that there was subsequently a clear pattern of rapid drawdowns
from mutual funds, especially after the collapse of Lehman Brothers in September 2008
(Figure 5). Although, in principle, bond flows are more prone to destabilizing reversals than
investments in equities, arguably because the stronger re-pricing of equities endogenously
moderates outflow pressures, EPFR Global data show more volatility in equity funds than
bond funds during this period. Possible explanations include fund managers’ difficulty in
liquidating assets because of a liquidity dry-up in some bond market segments, asset switches
within debt securities (e.g., a switch from high-yield corporate bonds to sovereign bonds),
and client investors’ adoption of a hold-to-maturity approach in the face of market turmoil.10
Figure 5. Net Inflows to Various Mutual Funds
(In billions of U.S. dollars)
10
If bonds are in a hold-to-maturity account, investors can hold those bonds until maturity without having to
report a loss, as long as the issuer does not default and the debt is not restructured.
-100
-80
-60
-40
-20
0
20
40
2003 2004 2005 2006 2007 2008 2009 2010 2011 2012
Northern Rock,
Bear Sterns
Lehman
Brothers
Greece
Downgrade of U.S.
Net Inflows to Global Equity Funds
Sources: Segoe UI - Size 18
Source: EPFR Global.
-60
-40
-20
0
20
40
60
80
2003 2004 2005 2006 2007 2008 2009 2010 2011 2012
Lehman
Brothers
Ireland,
PortugalDowngrade
of U.S.
Net Inflows to Global Bond Funds
Source: EPFR Global.
14
Raddatz and Schmukler (2011) analyzed micro-level data on mutual funds and found that
both client investors and fund managers tend to show procyclical behavior, reducing their
exposure to countries experiencing turmoil during bad times and increasing it when
conditions improve. They conclude that capital flows from mutual funds did not seem to
have a stabilizing role by, for example, generating large reallocations during the global
financial crisis. Also, there is some evidence that a retrenchment of U.S. money-market
mutual funds from European countries contributed to the rise in funding costs experienced by
banks in the euro area in the fall of 2011 (Jenkins, 2011).
E. Sovereign Wealth Funds
The long-term investment strategy of non-budget stabilization SWFs enabled most of them to
maintain their stance on asset allocations during the crisis. However, Miracky and Bortolotti
(2009) describe how several SWFs decided to reduce exposures to, in particular, U.S. and
U.K. banks in the second quarter of 2009. In retrospect, these SWFs may have liquidated part
of their holdings at the worst possible moment and thus could have missed the subsequent
(albeit temporary) recovery that followed. Although these SWFs were certainly
countercyclical when they invested in bank stocks, the liquidations shortly afterward seemed
to have been procyclical. Further, Bernstein, Lerner, and Schoar (2009) find that SWFs often
pursue assets at home when domestic equity prices are already relatively higher and thus
engage in “trend chasing.”
The crisis also brought significant changes in the implementation of SWFs’ stated strategies.
Kunzel and others (2011) analyzed the asset allocation changes of a subset of SWFs and
found evidence of some SWFs liquidating positions in an effort to support domestic
economies or to increase the share of liquid instruments in their portfolios. Some SWFs,
especially stabilization funds, have shown patterns of a flight to quality by increasing their
exposure to high-quality sovereign assets, reflecting increased risk aversion. Measures to
alleviate credit risk include a reduction of the portfolio allocated to bank deposits, early
expiration of deposits, and shortening of the maximum maturity of deposits. They also
adopted a more stringent process for the selection and approval of counterparties.
In other cases, assets from long-term SWFs were used to support domestic banks by
providing liquidity to the banking system (by depositing their assets in domestic banks) and
to help with bank recapitalization. For example, Ireland’s National Pensions Reserve Fund
(NPRF) liquidated its assets in two tranches in 2011 to realize €10 billion cash, which was
used to recapitalize the domestic banking sector (NPRF’s annual report for 2011). The
Russian government used US$22 billion of the National Wealth Fund (NWF), whose mission
is to co-finance the voluntary pension systems of the population, to support the domestic
banking sector (Kazakevitch and Trishkina, 2010). While this behavior can be considered
countercyclical, it does highlight the challenges in keeping to intended mandates during a
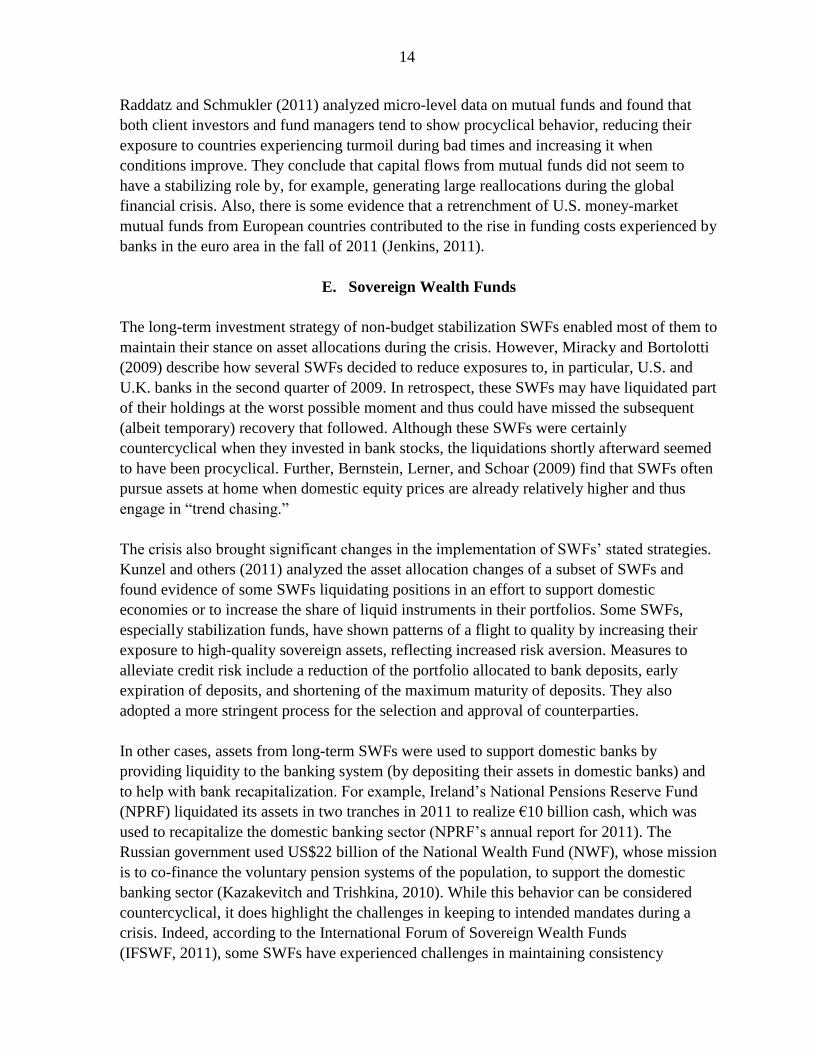
crisis. Indeed, according to the International Forum of Sovereign Wealth Funds
(IFSWF, 2011), some SWFs have experienced challenges in maintaining consistency
15
between their investment policies and the underlying objectives of the fund, especially during
periods of market turbulence (Figure 6). The debt crisis in the euro zone also posed a
challenge to many SWFs in striking a reasonable balance between long-term investing and
short-term flexibility (Park and van der Hoorn, 2012).
Figure 6. Difficulties in Maintaining Consistency in Investment Policy
(Number of SWF respondents)
E. Central Banks (Reserve Managers)
Central banks hold official foreign exchange reserves for various reasons. These include
“self-insurance” against financial shocks and sudden stops in accessing the international
capital markets, and enhancement of the credibility of monetary policy. Thus, the primary
objectives of reserve management are safety (i.e., preserving the value of the reserves) and a
high degree of liquidity.
Prior to the crisis, as reserves grew rapidly, an increasingly larger share was invested with a
more prominent return objective (sometimes separated in an “investment tranche” as opposed
to a “liquidity tranche” with more traditional objectives). In particular, reserve managers
started to take more credit risk to enhance investment returns. Borio, Galati, and Heath
(2008) and Bakker and van Herpt (2007), among others, observe that central banks’ weight
on the return objective has generally increased over time, for example, by showing a
preference for asset-backed securities, increasingly using derivatives, and hiring more
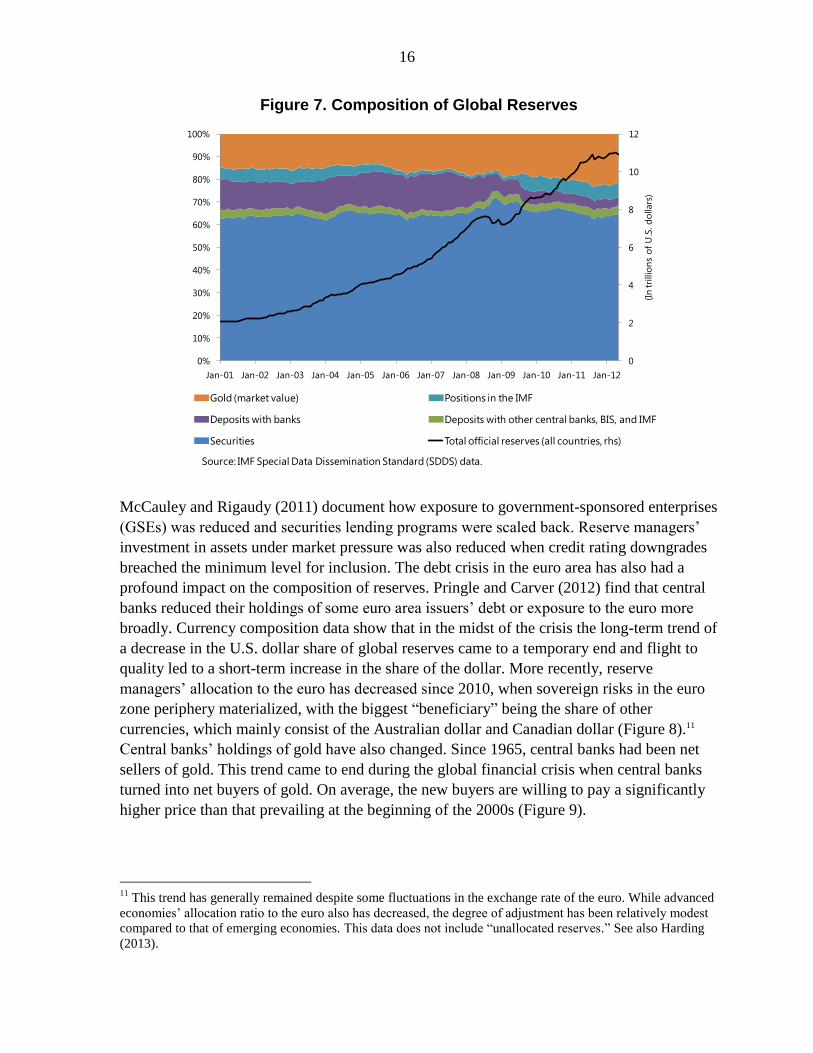
external managers. This trend was sharply reversed in the wake of the crisis. Pihlman and
van der Hoorn (2010) find evidence of procyclical investment behavior by central bank
reserve managers, who collectively pulled more than US$500 billion of deposits and other
investments out of the banking sector between December 2007 and March 2009 (Figure 7).
0
2
4
6
8
10
12
14
Unexpected
economic and
financial event
Pressure on short-
term performance
Pressure on
disclosure of
financial information
Relationship with
other entities (e.g.,
asset owners)
Source: IFSWF (2011).
16
Figure 7. Composition of Global Reserves
McCauley and Rigaudy (2011) document how exposure to government-sponsored enterprises
(GSEs) was reduced and securities lending programs were scaled back. Reserve managers’
investment in assets under market pressure was also reduced when credit rating downgrades
breached the minimum level for inclusion. The debt crisis in the euro area has also had a
profound impact on the composition of reserves. Pringle and Carver (2012) find that central
banks reduced their holdings of some euro area issuers’ debt or exposure to the euro more
broadly. Currency composition data show that in the midst of the crisis the long-term trend of
a decrease in the U.S. dollar share of global reserves came to a temporary end and flight to
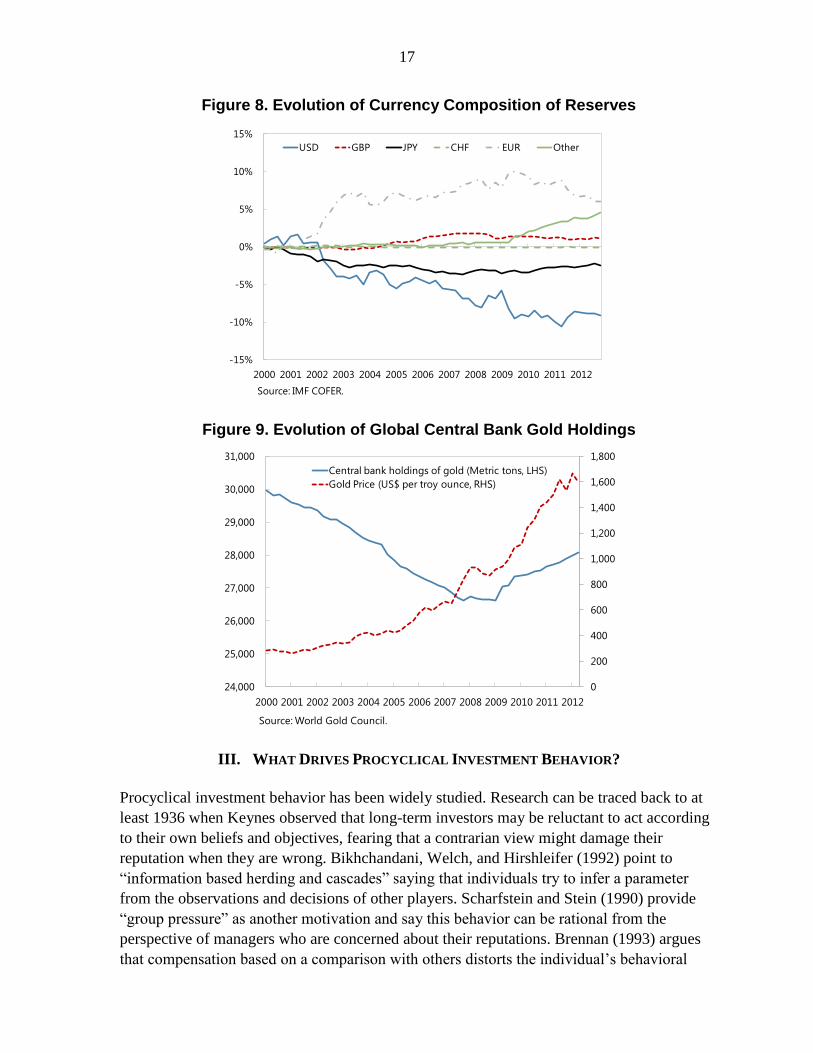
quality led to a short-term increase in the share of the dollar. More recently, reserve
managers’ allocation to the euro has decreased since 2010, when sovereign risks in the euro
zone periphery materialized, with the biggest “beneficiary” being the share of other
currencies, which mainly consist of the Australian dollar and Canadian dollar (Figure 8).11
Central banks’ holdings of gold have also changed. Since 1965, central banks had been net
sellers of gold. This trend came to end during the global financial crisis when central banks
turned into net buyers of gold. On average, the new buyers are willing to pay a significantly
higher price than that prevailing at the beginning of the 2000s (Figure 9).
11
This trend has generally remained despite some fluctuations in the exchange rate of the euro. While advanced
economies’ allocation ratio to the euro also has decreased, the degree of adjustment has been relatively modest
compared to that of emerging economies. This data does not include “unallocated reserves.” See also Harding
(2013).
0
2
4
6
8
10
12
0%
10%
20%
30%
40%
50%
60%
70%
80%
90%
100%
Jan-01 Jan-02 Jan-03 Jan-04 Jan-05 Jan-06 Jan-07 Jan-08 Jan-09 Jan-10 Jan-11 Jan-12
(In
tri
llio
ns
of
U.S
. d
ollars
)
Gold (market value) Positions in the IMF
Deposits with banks Deposits with other central banks, BIS, and IMF
Securities Total official reserves (all countries, rhs)
Source: IMF Special Data Dissemination Standard (SDDS) data.
17
Figure 8. Evolution of Currency Composition of Reserves
Figure 9. Evolution of Global Central Bank Gold Holdings
III. WHAT DRIVES PROCYCLICAL INVESTMENT BEHAVIOR?
Procyclical investment behavior has been widely studied. Research can be traced back to at
least 1936 when Keynes observed that long-term investors may be reluctant to act according
to their own beliefs and objectives, fearing that a contrarian view might damage their
reputation when they are wrong. Bikhchandani, Welch, and Hirshleifer (1992) point to
“information based herding and cascades” saying that individuals try to infer a parameter
from the observations and decisions of other players. Scharfstein and Stein (1990) provide
“group pressure” as another motivation and say this behavior can be rational from the
perspective of managers who are concerned about their reputations. Brennan (1993) argues
that compensation based on a comparison with others distorts the individual’s behavioral
-15%
-10%
-5%
0%
5%
10%
15%
2000 2001 2002 2003 2004 2005 2006 2007 2008 2009 2010 2011 2012
USD GBP JPY CHF EUR Other
Source: IMF COFER.
0
200
400
600
800
1,000
1,200
1,400
1,600
1,800
24,000
25,000
26,000
27,000
28,000
29,000
30,000
31,000
2000 2001 2002 2003 2004 2005 2006 2007 2008 2009 2010 2011 2012
Central bank holdings of gold (Metric tons, LHS)
Gold Price (US$ per troy ounce, RHS)
Source: World Gold Council.
18
incentives. Bikhchandani and Sharma (2000) also provide theoretical and illustrative
explanations about three key drivers (e.g., information cascade, reputation, and
compensation) behind herding. Ilyina (2006) argues that investors show herding behavior as
they take into account actions of other market participants and certain portfolio constraints
(e.g., benchmark-based performance criteria), which can create a transmission mechanism for
propagating shocks. Various empirical studies have confirmed this notion (e.g.,
Arnswald, 2001, and Smit and van den Berg, 2006).
There are numerous studies about investors’ herd behavior during the crisis. Beber, Brandt,
and Kavajecz (2009) argue that during periods of large flows into or out of the bond market,
liquidity explains a large proportion of sovereign yield spreads. They also suggest that, while
credit quality matters for bond valuation, in times of market stress investors chase liquidity.
Broner and others (2010) argue that total gross capital flows retrench significantly during a
crisis, especially during severe ones. Chian and Zheng (2010), by applying daily data for
18 countries, observe that a crisis triggers herd activity in the crisis country of origin and then
produces a contagion effect, which spreads the crisis to neighboring countries. According to
Kremer (2011), financial institutions herd more on the sell side, resulting in a rise in the
volatility of stock prices. Rösch and Kaserer (2012) find that there is a positive relationship
between credit risk and liquidity risk and that in times of increased market uncertainty the
impact of credit risk on liquidity risk intensifies.
Five main factors can be identified as major drivers of the procyclical investment behavior of
the major institutional investors, namely (i) underestimation of liquidity needs; (ii)
difficulties in assessing market risk and macroeconomic forecasting; (iii) principal-agent
problems and managers’ incentive structure; (iv) reporting and disclosure policies; and
(v) regulations and market convention.
A. Underestimation of Liquidity Needs
Long-term investors sometimes face short-term liquidity needs. For example, central banks
hold all or part of their foreign reserves in short-term liquid assets because reserves may need
to be mobilized to provide necessary foreign currency (e.g., during a BoP crisis or for
servicing external debt). Also, the open-ended structure of mutual funds means that client
investors can redeem their shares on short notice, which leads fund managers to maintain a
certain level of liquid assets rather than allocate all the fund’s assets to long-term securities.
Managing liquidity is an integral part of asset and liability management (ALM) modeling.
Usually, liquidity needs can be anticipated and projected with reasonable accuracy (e.g.,
pension payments or life insurance claims). However, asymmetric assessment of liquidity
risk could lead to procyclical behavior. In the pre-crisis period, there was considerable
liquidity in the financial system, and competitive pressure led to an underestimation of
required liquidity buffers. From an individual investor’s point of view, piling up sufficient
cash can be a costly approach, lowering the asset manager’s short-term performance and
19
sending a negative signal to clients about the manager’s capability. These constraints lead
asset managers to underestimate liquidity buffer needs and allocate more to illiquid and risky
assets. When favorable conditions are abruptly reversed and market funding conditions
deteriorate, almost all investors are forced to sell investments quickly in order to raise cash.
This brings serious disruption to long-term investors’ existing portfolios.
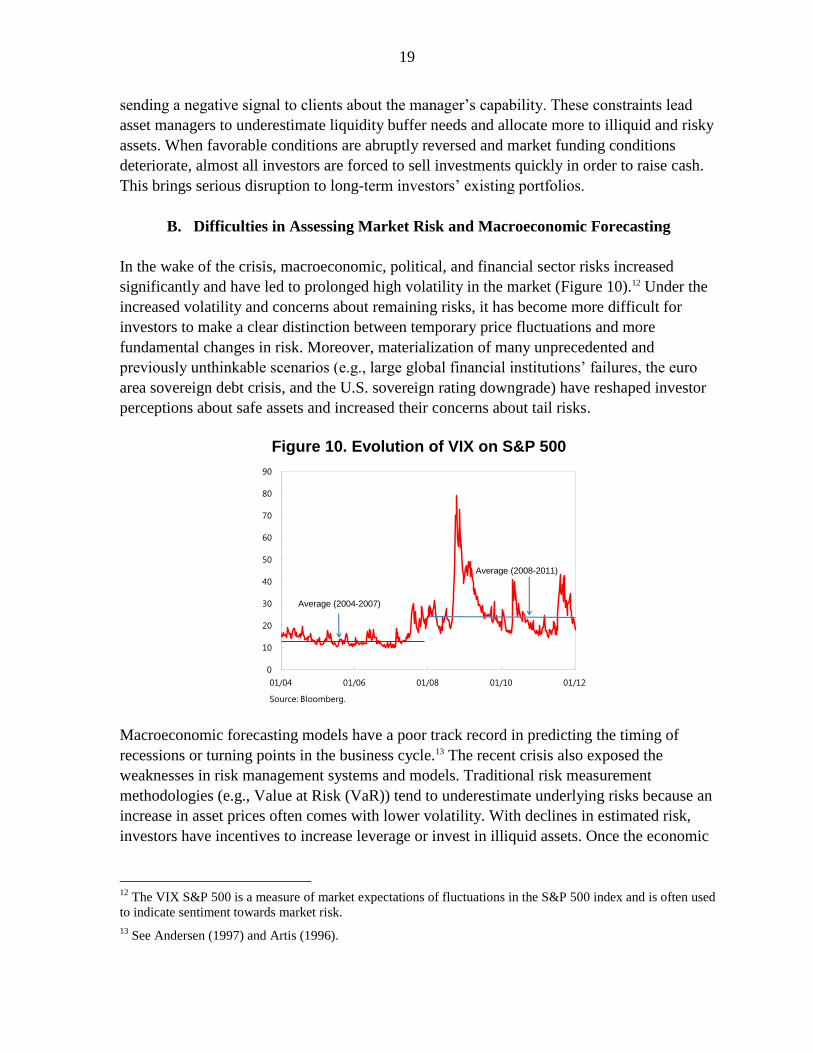
B. Difficulties in Assessing Market Risk and Macroeconomic Forecasting
In the wake of the crisis, macroeconomic, political, and financial sector risks increased
significantly and have led to prolonged high volatility in the market (Figure 10).12 Under the
increased volatility and concerns about remaining risks, it has become more difficult for
investors to make a clear distinction between temporary price fluctuations and more
fundamental changes in risk. Moreover, materialization of many unprecedented and
previously unthinkable scenarios (e.g., large global financial institutions’ failures, the euro
area sovereign debt crisis, and the U.S. sovereign rating downgrade) have reshaped investor
perceptions about safe assets and increased their concerns about tail risks.
Figure 10. Evolution of VIX on S&P 500
Macroeconomic forecasting models have a poor track record in predicting the timing of
recessions or turning points in the business cycle.13 The recent crisis also exposed the
weaknesses in risk management systems and models. Traditional risk measurement
methodologies (e.g., Value at Risk (VaR)) tend to underestimate underlying risks because an
increase in asset prices often comes with lower volatility. With declines in estimated risk,
investors have incentives to increase leverage or invest in illiquid assets. Once the economic
12
The VIX S&P 500 is a measure of market expectations of fluctuations in the S&P 500 index and is often used
to indicate sentiment towards market risk.
13 See Andersen (1997) and Artis (1996).
0
10
20
30
40
50
60
70
80
90
01/04 01/06 01/08 01/10 01/12
Source: Bloomberg.
Average (2004-2007)
Average (2008-2011)
20
or credit cycle reaches the peak, the subsequent decrease in asset prices results in greater
asset price volatility.
A traditional risk measurement system does not see risks “through the cycle” and leaves
investors vulnerable to rising risk premiums and higher volatility if market liquidity dries up.
This causes greater investor losses than in normal credit cycles. Ang and Kjaer (2011) point
out that California Public Employees’ Retirement System’s (CalPERS) internal control
system did not work well when real estate markets surged during the 2000s, and their use of
leverage peaked with the real estate market. Gorton and Ordoñez (2012) show that investors
start to rigorously assess underlying default and liquidity risks only after financial distress
materializes. As uncertainty increases substantially and issuers become more reluctant to
provide information, investor analysis requires much greater efforts to gather adequate
information, process complex data, and prepare for the risk of an unexpected event. In
normal conditions, default risk of investment-grade issuers is considered remote and attracts
insufficient attention (Economist, 2008).
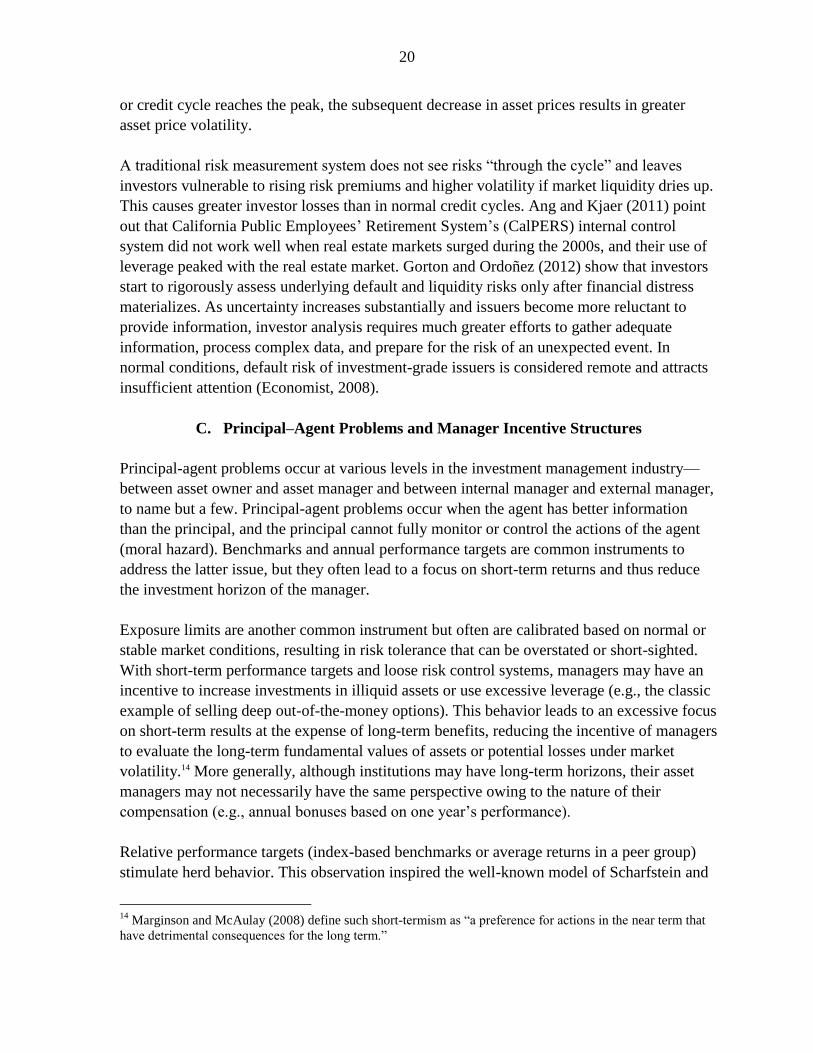
C. Principal–Agent Problems and Manager Incentive Structures
Principal-agent problems occur at various levels in the investment management industry—
between asset owner and asset manager and between internal manager and external manager,
to name but a few. Principal-agent problems occur when the agent has better information
than the principal, and the principal cannot fully monitor or control the actions of the agent
(moral hazard). Benchmarks and annual performance targets are common instruments to
address the latter issue, but they often lead to a focus on short-term returns and thus reduce
the investment horizon of the manager.
Exposure limits are another common instrument but often are calibrated based on normal or
stable market conditions, resulting in risk tolerance that can be overstated or short-sighted.
With short-term performance targets and loose risk control systems, managers may have an
incentive to increase investments in illiquid assets or use excessive leverage (e.g., the classic
example of selling deep out-of-the-money options). This behavior leads to an excessive focus
on short-term results at the expense of long-term benefits, reducing the incentive of managers
to evaluate the long-term fundamental values of assets or potential losses under market
volatility.14 More generally, although institutions may have long-term horizons, their asset
managers may not necessarily have the same perspective owing to the nature of their
compensation (e.g., annual bonuses based on one year’s performance).
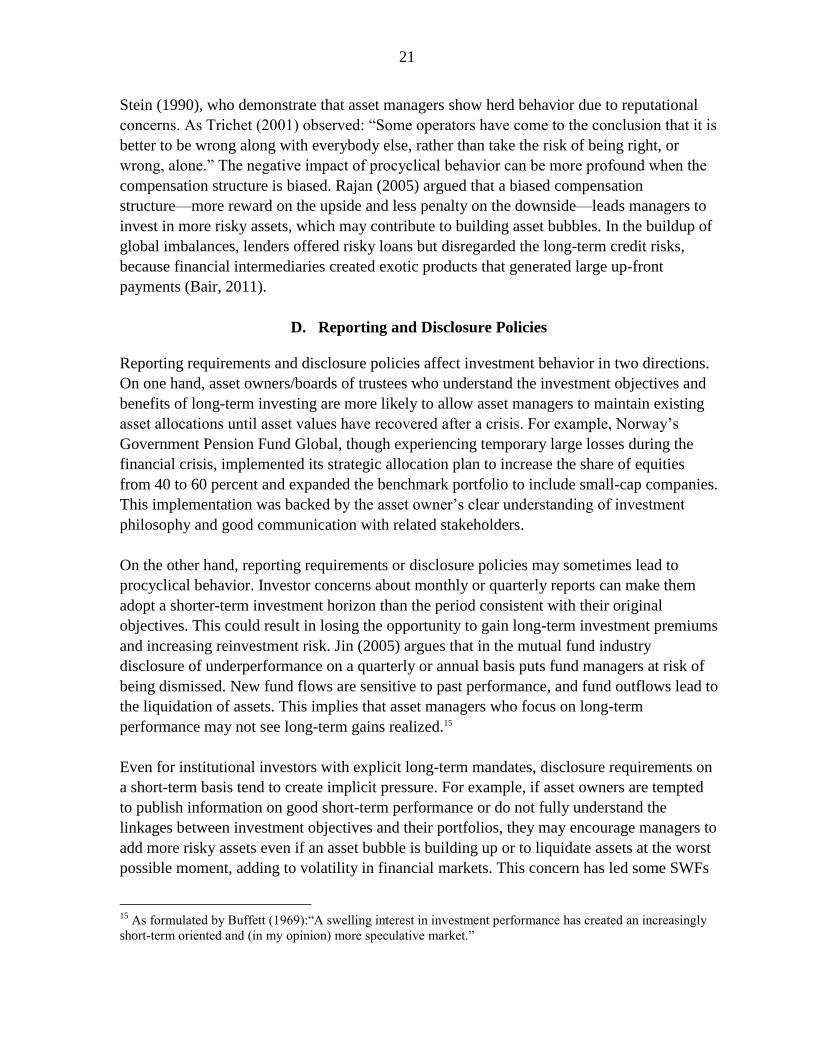
Relative performance targets (index-based benchmarks or average returns in a peer group)
stimulate herd behavior. This observation inspired the well-known model of Scharfstein and
14
Marginson and McAulay (2008) define such short-termism as “a preference for actions in the near term that
have detrimental consequences for the long term.”
21
Stein (1990), who demonstrate that asset managers show herd behavior due to reputational
concerns. As Trichet (2001) observed: “Some operators have come to the conclusion that it is
better to be wrong along with everybody else, rather than take the risk of being right, or
wrong, alone.” The negative impact of procyclical behavior can be more profound when the
compensation structure is biased. Rajan (2005) argued that a biased compensation
structure—more reward on the upside and less penalty on the downside—leads managers to
invest in more risky assets, which may contribute to building asset bubbles. In the buildup of
global imbalances, lenders offered risky loans but disregarded the long-term credit risks,
because financial intermediaries created exotic products that generated large up-front
payments (Bair, 2011).
D. Reporting and Disclosure Policies
Reporting requirements and disclosure policies affect investment behavior in two directions.
On one hand, asset owners/boards of trustees who understand the investment objectives and
benefits of long-term investing are more likely to allow asset managers to maintain existing
asset allocations until asset values have recovered after a crisis. For example, Norway’s
Government Pension Fund Global, though experiencing temporary large losses during the
financial crisis, implemented its strategic allocation plan to increase the share of equities
from 40 to 60 percent and expanded the benchmark portfolio to include small-cap companies.
This implementation was backed by the asset owner’s clear understanding of investment
philosophy and good communication with related stakeholders.
On the other hand, reporting requirements or disclosure policies may sometimes lead to
procyclical behavior. Investor concerns about monthly or quarterly reports can make them
adopt a shorter-term investment horizon than the period consistent with their original
objectives. This could result in losing the opportunity to gain long-term investment premiums
and increasing reinvestment risk. Jin (2005) argues that in the mutual fund industry
disclosure of underperformance on a quarterly or annual basis puts fund managers at risk of
being dismissed. New fund flows are sensitive to past performance, and fund outflows lead to
the liquidation of assets. This implies that asset managers who focus on long-term
performance may not see long-term gains realized.15
Even for institutional investors with explicit long-term mandates, disclosure requirements on
a short-term basis tend to create implicit pressure. For example, if asset owners are tempted
to publish information on good short-term performance or do not fully understand the
linkages between investment objectives and their portfolios, they may encourage managers to
add more risky assets even if an asset bubble is building up or to liquidate assets at the worst
possible moment, adding to volatility in financial markets. This concern has led some SWFs
15
As formulated by Buffett (1969):“A swelling interest in investment performance has created an increasingly
short-term oriented and (in my opinion) more speculative market.”
22
(e.g., the Government of Singapore Investment Corporation (GIC) and the Abu Dhabi
Investment Authority (ADIA)) to disclose only long-term performance in their annual
reports.16 While reporting quarterly returns, Future Fund is also trying to educate its
stakeholders on focusing on the longer-term returns. The headline risk (e.g., disclosing actual
losses) seems to be an important consideration for sovereign investors who need to respond
to the general public. This complexity also suggests that increasing attention should be given
to finding a reasonable balance in information disclosure and frequency.
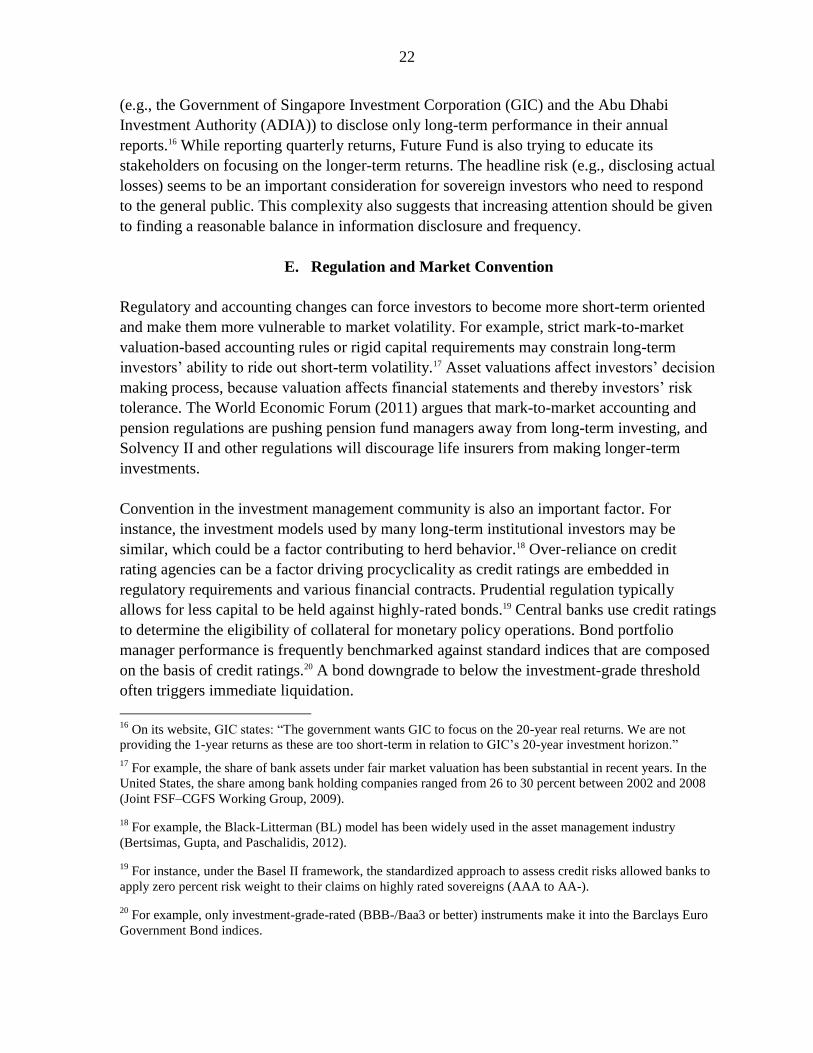
E. Regulation and Market Convention
Regulatory and accounting changes can force investors to become more short-term oriented
and make them more vulnerable to market volatility. For example, strict mark-to-market
valuation-based accounting rules or rigid capital requirements may constrain long-term
investors’ ability to ride out short-term volatility.17 Asset valuations affect investors’ decision
making process, because valuation affects financial statements and thereby investors’ risk
tolerance. The World Economic Forum (2011) argues that mark-to-market accounting and
pension regulations are pushing pension fund managers away from long-term investing, and
Solvency II and other regulations will discourage life insurers from making longer-term
investments.
Convention in the investment management community is also an important factor. For
instance, the investment models used by many long-term institutional investors may be
similar, which could be a factor contributing to herd behavior.18 Over-reliance on credit
rating agencies can be a factor driving procyclicality as credit ratings are embedded in
regulatory requirements and various financial contracts. Prudential regulation typically
allows for less capital to be held against highly-rated bonds.19 Central banks use credit ratings
to determine the eligibility of collateral for monetary policy operations. Bond portfolio
manager performance is frequently benchmarked against standard indices that are composed
on the basis of credit ratings.20 A bond downgrade to below the investment-grade threshold
often triggers immediate liquidation.
16
On its website, GIC states: “The government wants GIC to focus on the 20-year real returns. We are not
providing the 1-year returns as these are too short-term in relation to GIC’s 20-year investment horizon.”
17 For example, the share of bank assets under fair market valuation has been substantial in recent years. In the
United States, the share among bank holding companies ranged from 26 to 30 percent between 2002 and 2008
(Joint FSF–CGFS Working Group, 2009).
18 For example, the Black-Litterman (BL) model has been widely used in the asset management industry
(Bertsimas, Gupta, and Paschalidis, 2012).
19 For instance, under the Basel II framework, the standardized approach to assess credit risks allowed banks to
apply zero percent risk weight to their claims on highly rated sovereigns (AAA to AA-).
20 For example, only investment-grade-rated (BBB-/Baa3 or better) instruments make it into the Barclays Euro
Government Bond indices.
23
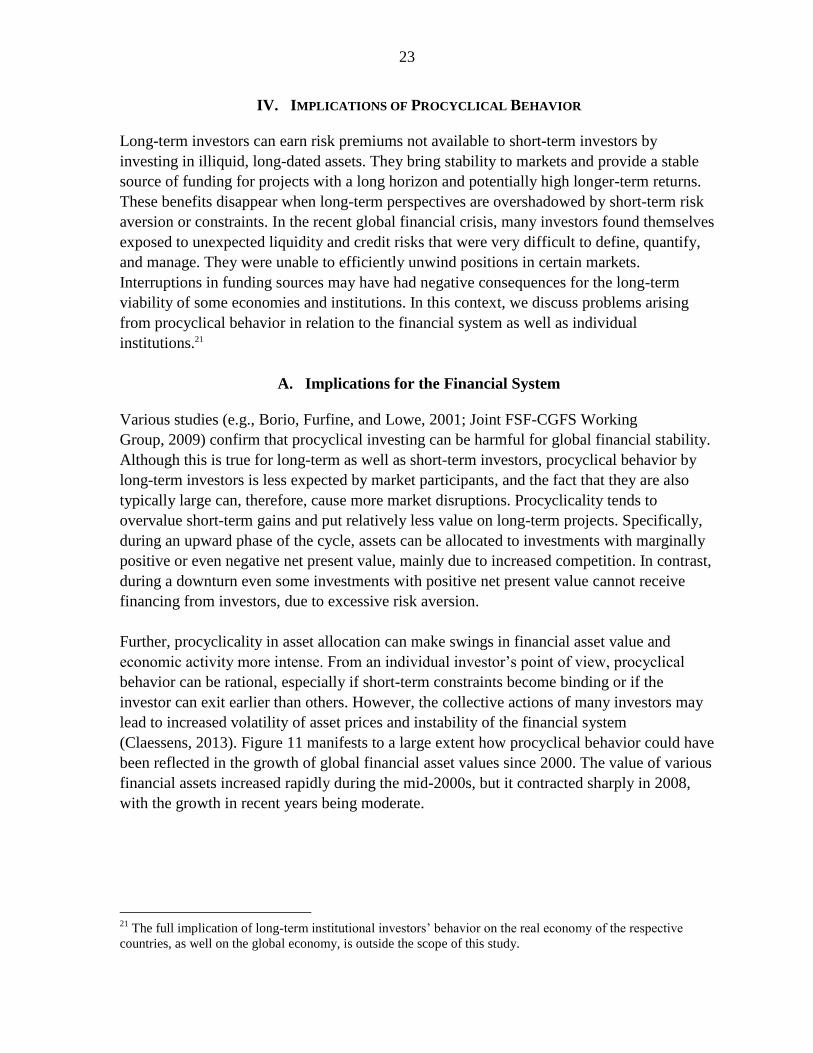
IV. IMPLICATIONS OF PROCYCLICAL BEHAVIOR
Long-term investors can earn risk premiums not available to short-term investors by
investing in illiquid, long-dated assets. They bring stability to markets and provide a stable
source of funding for projects with a long horizon and potentially high longer-term returns.
These benefits disappear when long-term perspectives are overshadowed by short-term risk
aversion or constraints. In the recent global financial crisis, many investors found themselves
exposed to unexpected liquidity and credit risks that were very difficult to define, quantify,
and manage. They were unable to efficiently unwind positions in certain markets.
Interruptions in funding sources may have had negative consequences for the long-term
viability of some economies and institutions. In this context, we discuss problems arising
from procyclical behavior in relation to the financial system as well as individual
institutions.21
A. Implications for the Financial System
Various studies (e.g., Borio, Furfine, and Lowe, 2001; Joint FSF-CGFS Working
Group, 2009) confirm that procyclical investing can be harmful for global financial stability.
Although this is true for long-term as well as short-term investors, procyclical behavior by
long-term investors is less expected by market participants, and the fact that they are also
typically large can, therefore, cause more market disruptions. Procyclicality tends to
overvalue short-term gains and put relatively less value on long-term projects. Specifically,
during an upward phase of the cycle, assets can be allocated to investments with marginally
positive or even negative net present value, mainly due to increased competition. In contrast,
during a downturn even some investments with positive net present value cannot receive
financing from investors, due to excessive risk aversion.
Further, procyclicality in asset allocation can make swings in financial asset value and
economic activity more intense. From an individual investor’s point of view, procyclical
behavior can be rational, especially if short-term constraints become binding or if the
investor can exit earlier than others. However, the collective actions of many investors may
lead to increased volatility of asset prices and instability of the financial system
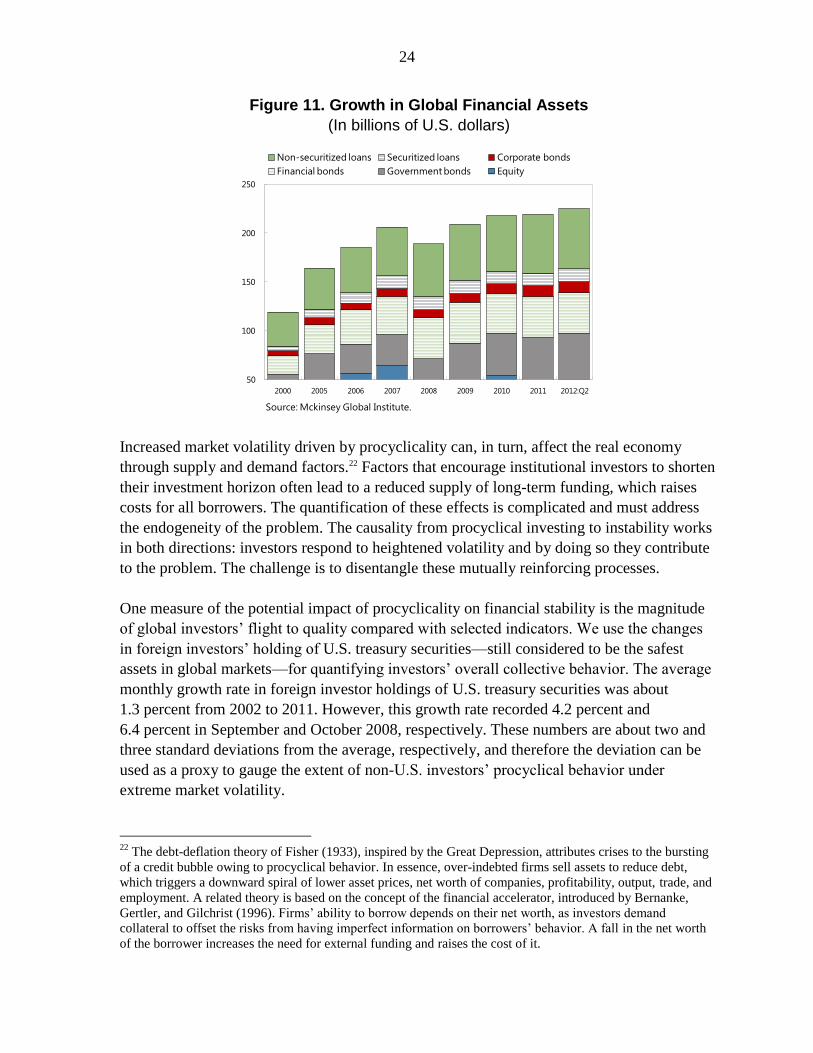
(Claessens, 2013). Figure 11 manifests to a large extent how procyclical behavior could have
been reflected in the growth of global financial asset values since 2000. The value of various
financial assets increased rapidly during the mid-2000s, but it contracted sharply in 2008,
with the growth in recent years being moderate.
21
The full implication of long-term institutional investors’ behavior on the real economy of the respective
countries, as well on the global economy, is outside the scope of this study.
24
Figure 11. Growth in Global Financial Assets
(In billions of U.S. dollars)
Increased market volatility driven by procyclicality can, in turn, affect the real economy
through supply and demand factors.22 Factors that encourage institutional investors to shorten
their investment horizon often lead to a reduced supply of long-term funding, which raises
costs for all borrowers. The quantification of these effects is complicated and must address
the endogeneity of the problem. The causality from procyclical investing to instability works
in both directions: investors respond to heightened volatility and by doing so they contribute
to the problem. The challenge is to disentangle these mutually reinforcing processes.
One measure of the potential impact of procyclicality on financial stability is the magnitude
of global investors’ flight to quality compared with selected indicators. We use the changes
in foreign investors’ holding of U.S. treasury securities—still considered to be the safest
assets in global markets—for quantifying investors’ overall collective behavior. The average
monthly growth rate in foreign investor holdings of U.S. treasury securities was about
1.3 percent from 2002 to 2011. However, this growth rate recorded 4.2 percent and
6.4 percent in September and October 2008, respectively. These numbers are about two and
three standard deviations from the average, respectively, and therefore the deviation can be
used as a proxy to gauge the extent of non-U.S. investors’ procyclical behavior under
extreme market volatility.
22
The debt-deflation theory of Fisher (1933), inspired by the Great Depression, attributes crises to the bursting
of a credit bubble owing to procyclical behavior. In essence, over-indebted firms sell assets to reduce debt,
which triggers a downward spiral of lower asset prices, net worth of companies, profitability, output, trade, and
employment. A related theory is based on the concept of the financial accelerator, introduced by Bernanke,
Gertler, and Gilchrist (1996). Firms’ ability to borrow depends on their net worth, as investors demand
collateral to offset the risks from having imperfect information on borrowers’ behavior. A fall in the net worth
of the borrower increases the need for external funding and raises the cost of it.
50
100
150
200
250
2000 2005 2006 2007 2008 2009 2010 2011 2012:Q2
Non-securitized loans Securitized loans Corporate bonds
Financial bonds Government bonds Equity
Source: Mckinsey Global Institute.
25
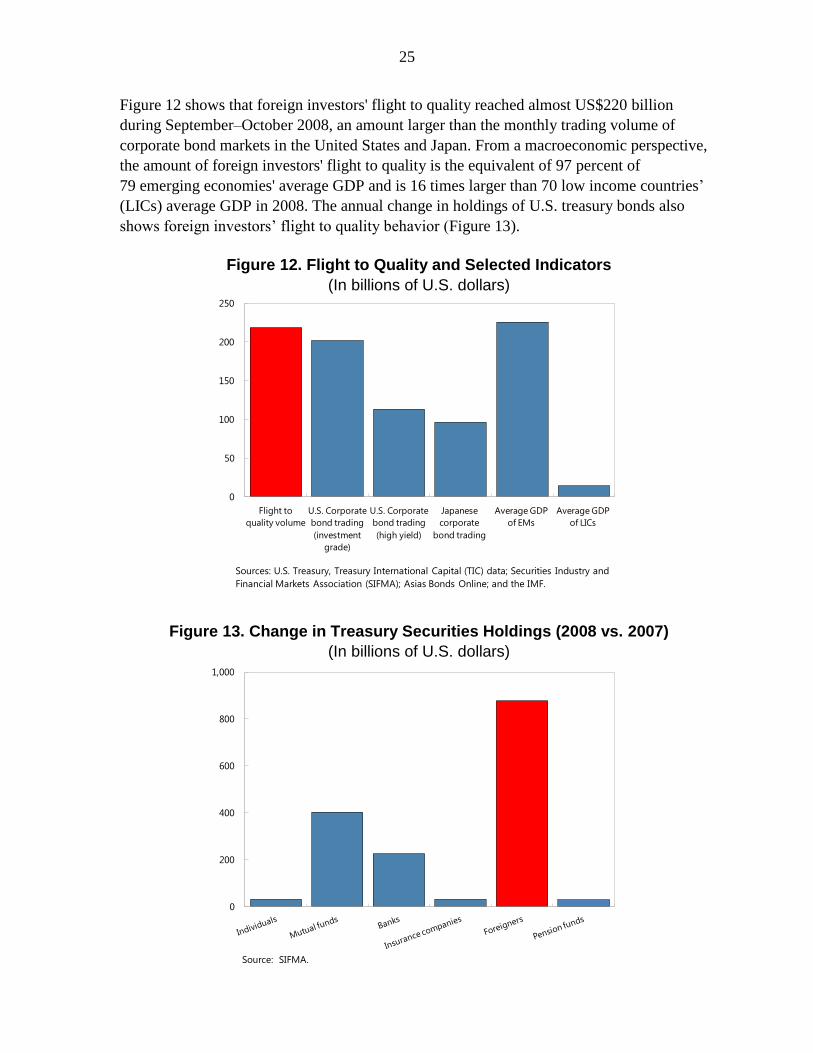
Figure 12 shows that foreign investors' flight to quality reached almost US$220 billion
during September–October 2008, an amount larger than the monthly trading volume of
corporate bond markets in the United States and Japan. From a macroeconomic perspective,
the amount of foreign investors' flight to quality is the equivalent of 97 percent of
79 emerging economies' average GDP and is 16 times larger than 70 low income countries’
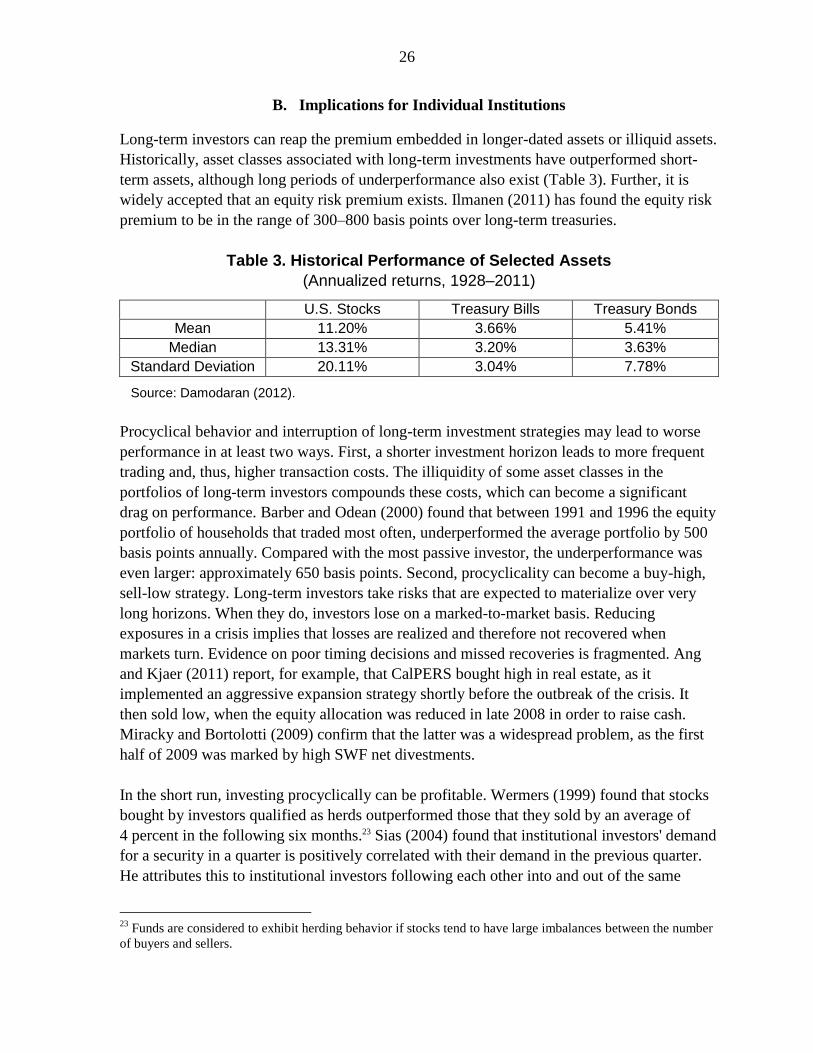
(LICs) average GDP in 2008. The annual change in holdings of U.S. treasury bonds also
shows foreign investors’ flight to quality behavior (Figure 13).
Figure 12. Flight to Quality and Selected Indicators
(In billions of U.S. dollars)
Figure 13. Change in Treasury Securities Holdings (2008 vs. 2007)
(In billions of U.S. dollars)
0
50
100
150
200
250
Flight to
quality volume
U.S. Corporate
bond trading
(investment
grade)
U.S. Corporate
bond trading
(high yield)
Japanese
corporate
bond trading
Average GDP
of EMs
Average GDP
of LICs
Sources: U.S. Treasury, Treasury International Capital (TIC) data; Securities Industry and
Financial Markets Association (SIFMA); Asias Bonds Online; and the IMF.
0
200
400
600
800
1,000
Source: SIFMA.
26
B. Implications for Individual Institutions
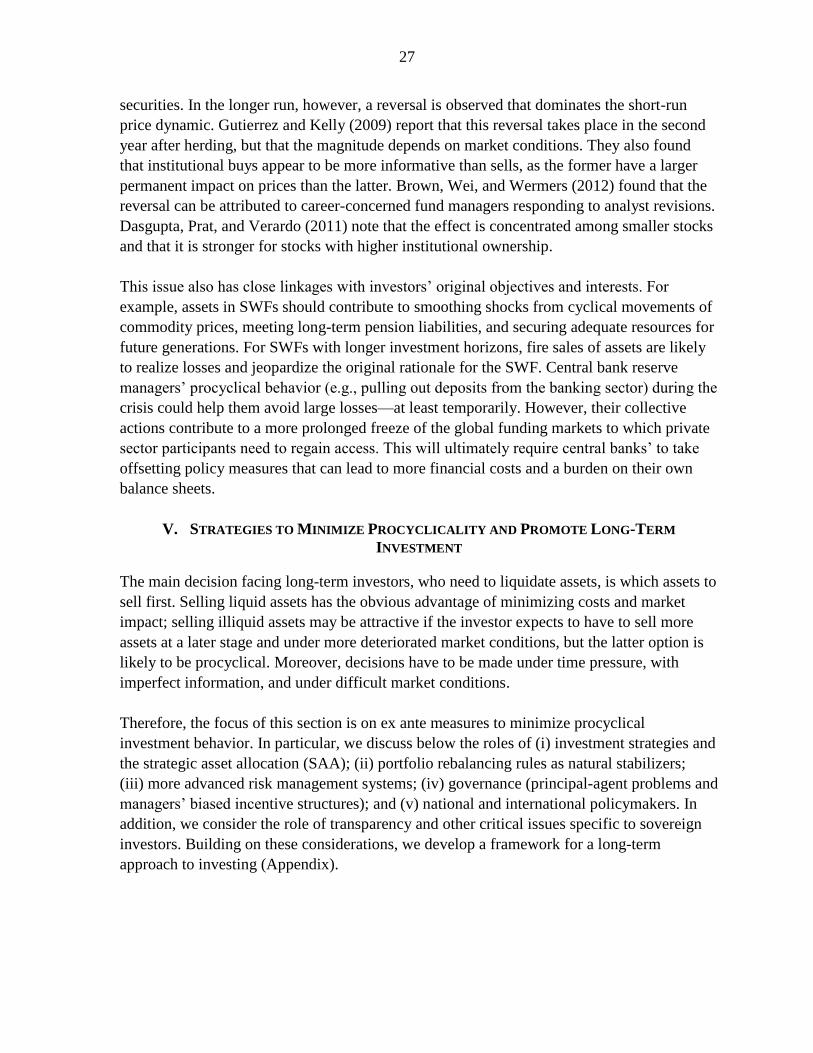
Long-term investors can reap the premium embedded in longer-dated assets or illiquid assets.
Historically, asset classes associated with long-term investments have outperformed short-
term assets, although long periods of underperformance also exist (Table 3). Further, it is
widely accepted that an equity risk premium exists. Ilmanen (2011) has found the equity risk
premium to be in the range of 300–800 basis points over long-term treasuries.
Table 3. Historical Performance of Selected Assets
(Annualized returns, 1928–2011)
U.S. Stocks Treasury Bills Treasury Bonds
Mean 11.20% 3.66% 5.41%
Median 13.31% 3.20% 3.63%
Standard Deviation 20.11% 3.04% 7.78%
Source: Damodaran (2012).
Procyclical behavior and interruption of long-term investment strategies may lead to worse
performance in at least two ways. First, a shorter investment horizon leads to more frequent
trading and, thus, higher transaction costs. The illiquidity of some asset classes in the
portfolios of long-term investors compounds these costs, which can become a significant
drag on performance. Barber and Odean (2000) found that between 1991 and 1996 the equity
portfolio of households that traded most often, underperformed the average portfolio by 500
basis points annually. Compared with the most passive investor, the underperformance was
even larger: approximately 650 basis points. Second, procyclicality can become a buy-high,
sell-low strategy. Long-term investors take risks that are expected to materialize over very
long horizons. When they do, investors lose on a marked-to-market basis. Reducing
exposures in a crisis implies that losses are realized and therefore not recovered when
markets turn. Evidence on poor timing decisions and missed recoveries is fragmented. Ang
and Kjaer (2011) report, for example, that CalPERS bought high in real estate, as it
implemented an aggressive expansion strategy shortly before the outbreak of the crisis. It
then sold low, when the equity allocation was reduced in late 2008 in order to raise cash.
Miracky and Bortolotti (2009) confirm that the latter was a widespread problem, as the first
half of 2009 was marked by high SWF net divestments.
In the short run, investing procyclically can be profitable. Wermers (1999) found that stocks
bought by investors qualified as herds outperformed those that they sold by an average of
4 percent in the following six months.23 Sias (2004) found that institutional investors' demand
for a security in a quarter is positively correlated with their demand in the previous quarter.
He attributes this to institutional investors following each other into and out of the same
23
Funds are considered to exhibit herding behavior if stocks tend to have large imbalances between the number
of buyers and sellers.
27
securities. In the longer run, however, a reversal is observed that dominates the short-run
price dynamic. Gutierrez and Kelly (2009) report that this reversal takes place in the second
year after herding, but that the magnitude depends on market conditions. They also found
that institutional buys appear to be more informative than sells, as the former have a larger
permanent impact on prices than the latter. Brown, Wei, and Wermers (2012) found that the
reversal can be attributed to career-concerned fund managers responding to analyst revisions.
Dasgupta, Prat, and Verardo (2011) note that the effect is concentrated among smaller stocks
and that it is stronger for stocks with higher institutional ownership.
This issue also has close linkages with investors’ original objectives and interests. For
example, assets in SWFs should contribute to smoothing shocks from cyclical movements of
commodity prices, meeting long-term pension liabilities, and securing adequate resources for
future generations. For SWFs with longer investment horizons, fire sales of assets are likely
to realize losses and jeopardize the original rationale for the SWF. Central bank reserve
managers’ procyclical behavior (e.g., pulling out deposits from the banking sector) during the
crisis could help them avoid large losses—at least temporarily. However, their collective
actions contribute to a more prolonged freeze of the global funding markets to which private
sector participants need to regain access. This will ultimately require central banks’ to take
offsetting policy measures that can lead to more financial costs and a burden on their own
balance sheets.
V. STRATEGIES TO MINIMIZE PROCYCLICALITY AND PROMOTE LONG-TERM
INVESTMENT
The main decision facing long-term investors, who need to liquidate assets, is which assets to
sell first. Selling liquid assets has the obvious advantage of minimizing costs and market
impact; selling illiquid assets may be attractive if the investor expects to have to sell more
assets at a later stage and under more deteriorated market conditions, but the latter option is
likely to be procyclical. Moreover, decisions have to be made under time pressure, with
imperfect information, and under difficult market conditions.
Therefore, the focus of this section is on ex ante measures to minimize procyclical
investment behavior. In particular, we discuss below the roles of (i) investment strategies and
the strategic asset allocation (SAA); (ii) portfolio rebalancing rules as natural stabilizers;
(iii) more advanced risk management systems; (iv) governance (principal-agent problems and
managers’ biased incentive structures); and (v) national and international policymakers. In
addition, we consider the role of transparency and other critical issues specific to sovereign
investors. Building on these considerations, we develop a framework for a long-term
approach to investing (Appendix).
28
A. Investment Strategies and Strategic Asset Allocation
SAA is fundamental to ensuring sustainable long-term investing and minimizing
procyclicality. The first step in the SAA process is to determine the objectives and liabilities
of a long-term investor, which, in turn, determines the investment horizon. An accurate
estimate of the true investment horizon reduces the probability that a significant share of
assets will need to be sold unexpectedly or at short notice in response to movements in
benchmark indices. For example, pension funds should focus on beneficiaries’ retirement
horizon and risk tolerance in constructing their products, and all factors, including liabilities,
benefit payments, operating expenses, and employer and member contributions, should be
taken into account in determining the appropriate asset allocation mix.
A well-defined ALM approach is needed to derive the SAA of a long-term investor. An
ALM approach aims at matching assets and liabilities, so that a long-term investor can invest
in assets that mature when cash is needed, thus minimizing financial risks and avoiding
procyclical behavior. Ideally, long-term investors could invest most of their assets in illiquid
securities or loans. However, uncertainty about financial market conditions may imply that a
long-term investor needs to hold liquid assets as well, as a buffer to accommodate potential
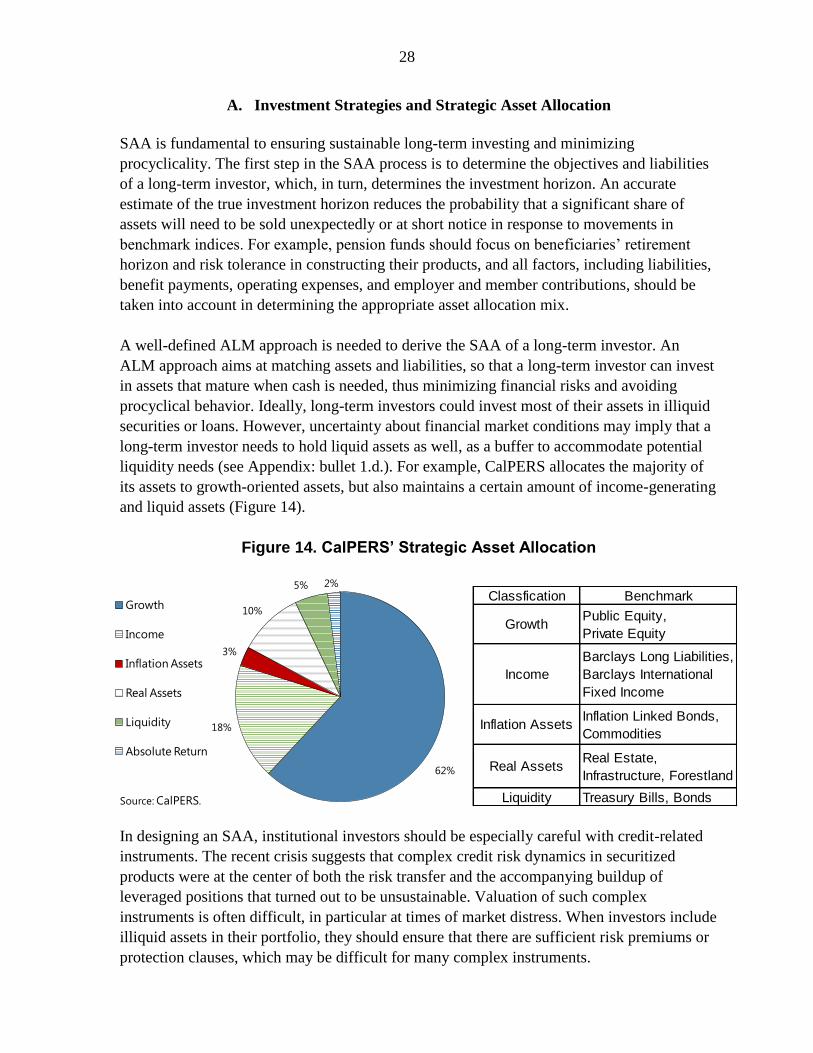
liquidity needs (see Appendix: bullet 1.d.). For example, CalPERS allocates the majority of
its assets to growth-oriented assets, but also maintains a certain amount of income-generating
and liquid assets (Figure 14).
Figure 14. CalPERS’ Strategic Asset Allocation
In designing an SAA, institutional investors should be especially careful with credit-related
instruments. The recent crisis suggests that complex credit risk dynamics in securitized
products were at the center of both the risk transfer and the accompanying buildup of
leveraged positions that turned out to be unsustainable. Valuation of such complex
instruments is often difficult, in particular at times of market distress. When investors include
illiquid assets in their portfolio, they should ensure that there are sufficient risk premiums or
protection clauses, which may be difficult for many complex instruments.
62%
18%
3%
10%
5% 2%
Growth
Income
Inflation Assets
Real Assets
Liquidity
Absolute Return
Source: CalPERS.
Classfication Benchmark
GrowthPublic Equity,
Private Equity
Income
Barclays Long Liabilities,
Barclays International
Fixed Income
Inflation AssetsInflation Linked Bonds,
Commodities
Real AssetsReal Estate,
Infrastructure, Forestland
Liquidity Treasury Bills, Bonds
29
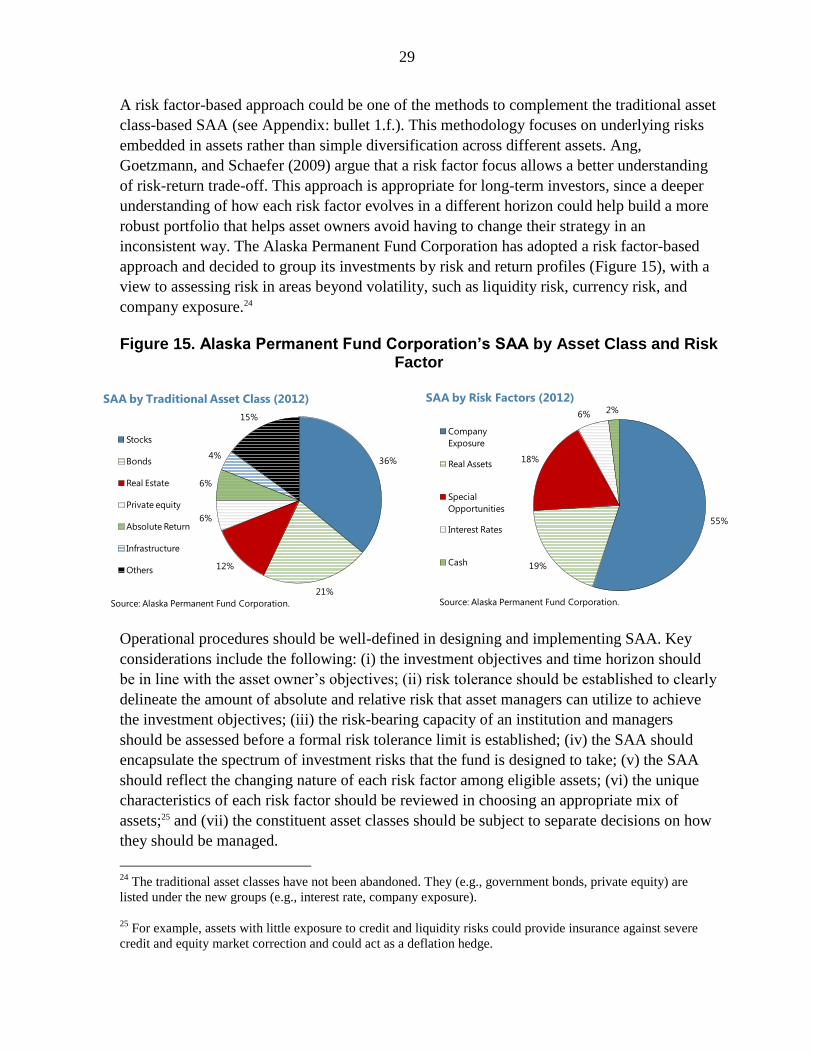
A risk factor-based approach could be one of the methods to complement the traditional asset
class-based SAA (see Appendix: bullet 1.f.). This methodology focuses on underlying risks
embedded in assets rather than simple diversification across different assets. Ang,
Goetzmann, and Schaefer (2009) argue that a risk factor focus allows a better understanding
of risk-return trade-off. This approach is appropriate for long-term investors, since a deeper
understanding of how each risk factor evolves in a different horizon could help build a more
robust portfolio that helps asset owners avoid having to change their strategy in an
inconsistent way. The Alaska Permanent Fund Corporation has adopted a risk factor-based
approach and decided to group its investments by risk and return profiles (Figure 15), with a
view to assessing risk in areas beyond volatility, such as liquidity risk, currency risk, and
company exposure.24
Figure 15. Alaska Permanent Fund Corporation’s SAA by Asset Class and Risk Factor
Operational procedures should be well-defined in designing and implementing SAA. Key
considerations include the following: (i) the investment objectives and time horizon should
be in line with the asset owner’s objectives; (ii) risk tolerance should be established to clearly
delineate the amount of absolute and relative risk that asset managers can utilize to achieve
the investment objectives; (iii) the risk-bearing capacity of an institution and managers
should be assessed before a formal risk tolerance limit is established; (iv) the SAA should
encapsulate the spectrum of investment risks that the fund is designed to take; (v) the SAA
should reflect the changing nature of each risk factor among eligible assets; (vi) the unique
characteristics of each risk factor should be reviewed in choosing an appropriate mix of
assets;25 and (vii) the constituent asset classes should be subject to separate decisions on how
they should be managed.
24
The traditional asset classes have not been abandoned. They (e.g., government bonds, private equity) are
listed under the new groups (e.g., interest rate, company exposure).
25 For example, assets with little exposure to credit and liquidity risks could provide insurance against severe
credit and equity market correction and could act as a deflation hedge.
36%
21%
12%
6%
6%
4%
15%
Stocks
Bonds
Real Estate
Private equity
Absolute Return
Infrastructure
Others
SAA by Traditional Asset Class (2012)
Source: Alaska Permanent Fund Corporation.
55%
19%
18%
6% 2%
Company
Exposure
Real Assets
Special
Opportunities
Interest Rates
Cash
SAA by Risk Factors (2012)
Source: Alaska Permanent Fund Corporation.
30
B. Portfolio Rebalancing
Portfolio rebalancing creates investment discipline and can help avoid procyclical behavior
or even make behavior countercyclical.26 The SAA is implemented via a benchmark or target
allocation to which the actual asset allocation needs to be rebalanced periodically to keep risk
exposures constant (see Appendix: bullet 2.b.). Rebalancing involves selling assets that have
risen in price and buying those that have declined, thus preventing a single asset class from
dominating the portfolio if its value keeps rising. Rebalancing also helps to avoid herd
behavior. If asset prices mean-revert, then rebalancing benefits from buy low-sell high
dynamics, which increase returns over the long run. Norway’s Government Pension Fund
Global provides a prime example of an institutionalized rebalancing framework. The ministry
of finance has set rules for full rebalancing back to the strategic weights. These specify the
maximum permitted deviation between the weights in the actual benchmark portfolio and the
strategic benchmark portfolio before the fund must be rebalanced.
Rebalancing rules can be further improved by incorporating forward-looking risk and return
measures. Traditional rebalancing is based on realized (ex post) returns and fixed weights for
asset classes or risk factors. A long-term investor can benefit from time-varying risk
premiums, for instance by increasing the allocation to asset classes or risk factors beyond the
normal level when risk premiums are unusually high. These more sophisticated rebalancing
rules require adequate forward-looking, risk-adjusted valuation models.
C. Risk Management
The global financial crisis brought important challenges for risk management. First, because
of the magnitude and breadth of the shock, correlations between the returns of almost all
asset classes increased, and thus the benefits of diversification failed to protect asset values.
Second, many investors failed to anticipate the contagion to economic growth and risky
assets throughout the world. Third, it was difficult to assess liquidity risks, because this
depends to a large extent on macroeconomic factors and tail events rather than asset
composition itself. Fourth, traditional models assume that distributions of losses are not
correlated over time, but sizable losses at one moment led to a severe lack of liquidity and
confidence, which resulted in larger losses in the following periods.
Learning from the recent crisis, institutional investors can strengthen their risk management
in several ways:
26
There is also the opposite possibility if market indices are being used. For instance, every year (typically) the
composition of equity indices is reviewed, and a limited number of new companies may be added to the index
while others drop out. When that happens, all index trackers need to buy the new companies and sell those that
leave the index. This can be procyclical.
31
Gain a more complete assessment of risk
This experience suggests that institutional investors need to take a long-term perspective and
a more sophisticated approach to risk management. Risk managers should fully understand
the strengths and weaknesses of all the risk metrics and apply them in line with the
characteristics of their portfolios. For example, it is not appropriate to choose a time horizon
that is not consistent with the liquidity of the assets in the portfolio. If long-term institutional
investors fail to take account of whole economic cycles in advance, they may underestimate
the potential risk of crisis. CalPERS, in early 2009, enlarged the concept of risk to include
additional measures such as counterparty risk, concentration risk, leverage, and liquidity risk.
These measures were intended to supplement the existing volatility measures and provide a
more complete assessment of risk.
Adopt a broader approach to rating downgrades
Automatic rating triggers that induce fire sales of downgraded assets must be used with much
care. Many investors use a single rating threshold to determine eligibility of issuers and
counterparties. A downgrade—especially from investment to non-investment grade—can
spark fire sales by index investors and trigger so-called cliff effects. A simple rating corridor
with different thresholds for investing and divesting reduces the probability that a portfolio
will have to be adjusted excessively. Better still would be to use a rating downgrade (or
negative outlook, for instance) as a trigger for reviewing the risk and expected return of the
entire portfolio, rather than simply inducing a fire sale of downgraded instruments.
Strengthen and complement traditional risk assessment models
The recent crisis also showed that a significant event can change the nature of a return
distribution for a given period as well as across periods. Traditional VaR models can fail to
estimate the true loss distribution, if they assume a normal distribution of returns and stable
volatility, and thus can give signals that contribute to procyclicality. One method to address
this issue can be a regime-switching volatility model that assumes different market regimes
with various volatilities.27 Institutional investors should complement traditional models with
scenario analysis or stress testing (see Appendix: bullet 3.d.). Scenario analysis requires
inputs and prudent judgment from professionals who have a solid understanding of not only
economics, but also human behavior. Back testing, which compares losses predicted by the
model to those actually experienced over the sample testing period, could also be used for
making the risk assessment model more reliable.
27
Guo and Wohar (2006) found multiple structural breaks in the mean level of market volatility. Arisoy, Salih,
and Akdeniz (2012) found that portfolio betas change significantly when aggregate market volatility is beyond a
certain threshold.
32
In New Zealand’s Superannuation Fund, stress tests and scenario analyses have become an
integral tool for their risk management practices by providing the board with an estimate of
the scale of maximum losses, testing the ability of the fund to maintain the portfolio under
specific macro shocks, and considering potential downside risks around specific investment
opportunities. Australia’s Future Fund is maintaining its long-term risk management
framework by focusing on the risk of significant capital loss over the medium term (e.g., the
worst 5 percent of potential outcomes over the next three years) rather than just trying to
offset the pension liabilities.
Consider the potential impact of one’s actions on capital markets
Large investors need to carefully manage the risk of the potential impact on capital markets
caused by their own investment actions (see Appendix: bullet 3.e.). The extent of market
impact is determined not only by the relative size of their investment actions, but also by the
overall transaction volume, pace of portfolio adjustments, and other market participants’
reactions. If large investors aggressively join the market’s overall downward trend, their
actions may accelerate price movements and cause large transaction costs through drying up
market liquidity. Large prominent investors, who are well recognized by other participants,
should also pay attention to the impact of indirect signaling on other players in the market.
These risks need to be included in the risk management framework.
Undertake a prudent due diligence process before undertaking new investment
activities
A prudent due diligence process is critical when institutional investors move into new
investment markets and instruments (e.g., financial derivatives and alternative assets).
Competition pressure may lead them to rush into new areas regardless of deficiencies in the
risk control framework. A structured process helps establish strong discipline in ensuring that
sufficient analysis, time, and resources are devoted to the introduction of new investment
activities. For example, investing in alternative assets or derivatives has become popular in
the investment community. They can help in the further diversification of assets,
implementation of active strategies, and hedging of unwanted risks. Nevertheless, due to
leverage and complexity, they may cause large financial and reputational losses if not
appropriately controlled.
D. Governance
Investment policies must be anchored with and understood by the owners/boards of trustees,
who should feel comfortable with the risks taken also in “bad times.” Investment decisions,
including allowing deviations from the benchmark (in the case of active management), are
33
typically taken by the manager.28 Active portfolio management can bring financial and non-
financial benefits, but it is hard to align the incentives for portfolio managers (as agents) with
the long-term objectives of the fund owners (as principals). Through active management,
portfolio managers aim to outperform a benchmark over a given horizon. This horizon is, by
construction, shorter than the horizon of the fund itself. Active management creates
incentives for short-term profit seeking and, potentially, less aversion to short-term loss.
Although active positions tend to be relatively small when compared with overall SAA
decisions, collectively they may contribute to procyclical volatility in the market. The
optimal degree of active management depends, however, on the size of the fund and the
markets in which it operates (Malkiel, 2003).
Further, empirical evidence in favor of the financial benefits of active management is limited
at best. Ang and others (2009) and Ibbotson and Kaplan (2000) found that the contribution of
active management to the overall return that is genuinely idiosyncratic is very small. The
reported risk reduction that took place during the crisis was, in many cases, a timing decision,
as investors returned to the market when the “worst” of the crisis appeared to them to be
over. However, market timing can be very risky and often tends to be costly. Active
management can be profitable in less efficient markets where arbitrage opportunities remain,
but, because of the lower liquidity, procyclical investment behavior can be disruptive.
Nevertheless, financial markets still need some active managers, as not all portfolios can be
managed passively. A certain share needs to be managed actively to ensure liquidity and
price discovery in the markets. Very large investors may not be able to manage their
portfolios in a totally passive manner for this reason.
Owners/boards of trustees of long-term funds could design active/tactical management
mandates to be countercyclical (i.e., allow explicitly for exploiting the periods of illiquidity
or dislocations in the market to provide liquidity and buy long-term assets cheaper at a time
of (temporary) market dislocation). The Future Fund (2012) for example, as one of the
lessons learned from the crisis, explicitly recognizes the option value of cash: “With the
benefit of operating the portfolio for the past few years, recognition of the value of having
the ‘dry powder’ to respond opportunistically to attractive investments has grown.”
Whether or not to allow active management by managers and the exact nature of these
mandates is a key decision to manage the risk of procyclical behavior. It is important that
incentives for the manager are compatible with those of the owner, so that the manager does
not inappropriately adjust risks if that is not in the long-term interest of the owner. This can
be achieved, for example, by giving shares to managers or requiring them to invest in the
28
In principle, governance distinguishes between decision making by the owner/board of trustees and
implementation by the manager(s). Contracts of asset managers should be designed to minimize principal–agent
problems between owners/boards of trustees and managers and be consistent with the long-term objectives of
the institution. The owner of the assets bears the risks and is therefore responsible for the investment policy,
including the SAA and the risk control framework.
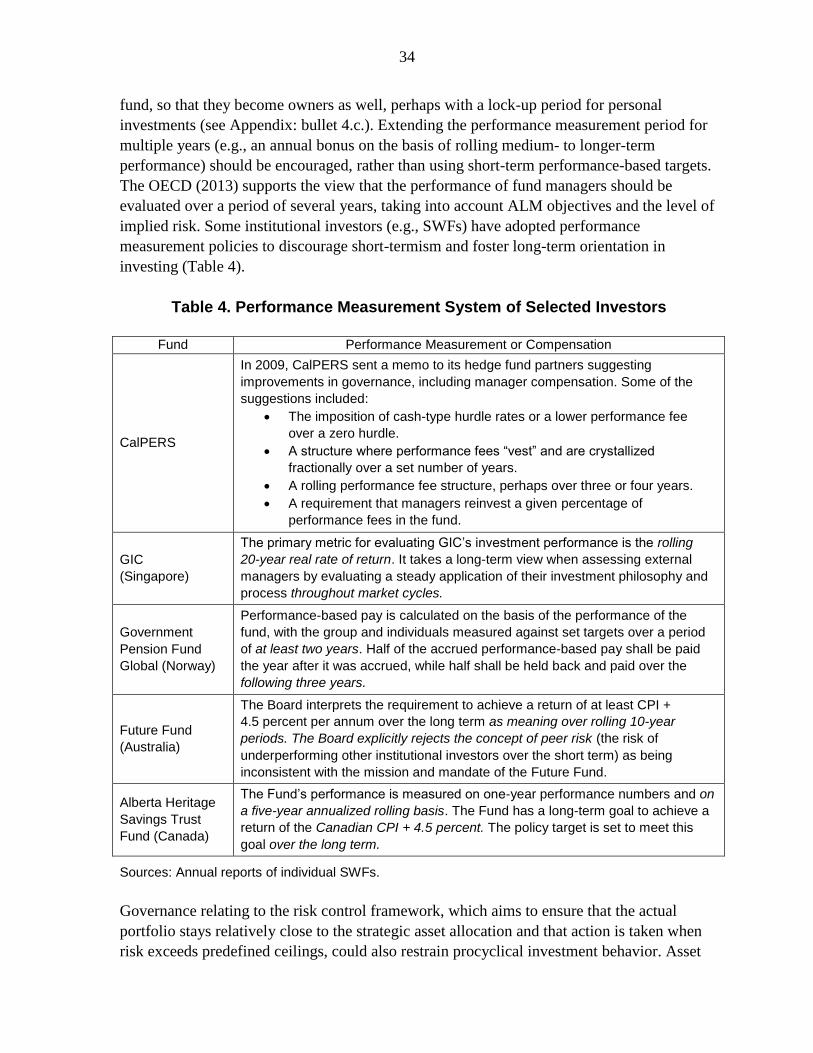
34
fund, so that they become owners as well, perhaps with a lock-up period for personal
investments (see Appendix: bullet 4.c.). Extending the performance measurement period for
multiple years (e.g., an annual bonus on the basis of rolling medium- to longer-term
performance) should be encouraged, rather than using short-term performance-based targets.
The OECD (2013) supports the view that the performance of fund managers should be
evaluated over a period of several years, taking into account ALM objectives and the level of
implied risk. Some institutional investors (e.g., SWFs) have adopted performance
measurement policies to discourage short-termism and foster long-term orientation in
investing (Table 4).
Table 4. Performance Measurement System of Selected Investors
Fund Performance Measurement or Compensation
CalPERS
In 2009, CalPERS sent a memo to its hedge fund partners suggesting
improvements in governance, including manager compensation. Some of the
suggestions included:
The imposition of cash-type hurdle rates or a lower performance fee
over a zero hurdle.
A structure where performance fees “vest” and are crystallized
fractionally over a set number of years.
A rolling performance fee structure, perhaps over three or four years.
A requirement that managers reinvest a given percentage of
performance fees in the fund.
GIC
(Singapore)
The primary metric for evaluating GIC’s investment performance is the rolling
20-year real rate of return. It takes a long-term view when assessing external
managers by evaluating a steady application of their investment philosophy and
process throughout market cycles.
Government
Pension Fund
Global (Norway)
Performance-based pay is calculated on the basis of the performance of the
fund, with the group and individuals measured against set targets over a period
of at least two years. Half of the accrued performance-based pay shall be paid
the year after it was accrued, while half shall be held back and paid over the
following three years.
Future Fund
(Australia)
The Board interprets the requirement to achieve a return of at least CPI +
4.5 percent per annum over the long term as meaning over rolling 10-year
periods. The Board explicitly rejects the concept of peer risk (the risk of
underperforming other institutional investors over the short term) as being
inconsistent with the mission and mandate of the Future Fund.
Alberta Heritage
Savings Trust
Fund (Canada)
The Fund’s performance is measured on one-year performance numbers and on
a five-year annualized rolling basis. The Fund has a long-term goal to achieve a
return of the Canadian CPI + 4.5 percent. The policy target is set to meet this
goal over the long term.
Sources: Annual reports of individual SWFs.
Governance relating to the risk control framework, which aims to ensure that the actual
portfolio stays relatively close to the strategic asset allocation and that action is taken when
risk exceeds predefined ceilings, could also restrain procyclical investment behavior. Asset
35
owners/boards of trustees should have a firm understanding of how asset allocation creates
risks, what risk factors are behind each asset class, and how managers’ risk taking is
compensated in terms of expected return (see Appendix: bullet 4.e.). To this end, managers
should have frequent communication with asset owners by providing adequate information
about the portfolio construction process. Ang and others (2009) argue that Norway’s Pension
Fund Global could have reduced its losses in 2008, if key risk factor exposures in the
pre-crisis period had been better communicated and the asset owner had had a good
understanding of the potential drawdown of these factors. Finally, the risk from procyclical
behavior should be considered when owners make important decisions on the investment
framework and compensation system.
E. National and International Policymakers’ Role
Since the global financial crisis, many countries and international institutions have made
extensive efforts to strengthen regulation and supervision with the purpose of enhancing
financial stability. One of the many objectives is to reduce excessive risk taking and prevent
procyclical behavior. In the banking sector, the countercyclical capital buffer under the
Basel III framework intends to promote the buildup of capital in good times, which can be
drawn down in periods of stress. A similar measure (Solvency II) was introduced in the
European insurance sector.
There has been relatively little discussion of how to promote institutional investors’ role in
avoiding procyclical behavior and providing stable long-term capital. On the contrary, some
regulatory measures can bring unintended costs or discourage long-term investment
activities. For instance, a strict mark-to-market rule may lead long-term investors to focus on
short-term gains or losses in asset values, rather than their investments’ long-term valuations,
making it difficult to properly match their long-term liabilities with long-term assets. Adding
an ALM perspective to regulatory issues may help strike the right balance between reducing
short-term vulnerability and promoting long-term investment. For example, regulators could
apply a differentiated approach to investors depending on their liability structures (e.g.,
banks: short-term liabilities, pension funds: long-term liabilities).
Institutional investors’ increased presence in the global capital markets has also raised
concerns about the implications of their potential procyclical investment activities, especially
with regard to the recent huge capital flows across countries. A surge in capital inflows or
outflows can pose challenges to policymakers: the former can create financial market
volatility, asset bubbles, and rapid exchange rate appreciation, while the latter can lead to
currency collapse, the loss of foreign reserves, and disruption in financial markets.
Responding to these problems, some authorities have introduced capital flow management
(CFM) measures. These measures can be necessary when a country has specific external
vulnerabilities, but they need to be balanced with benefits in long-term cross-border
investments. Thus, policymakers’ flexible approach to different types of investments (e.g., in
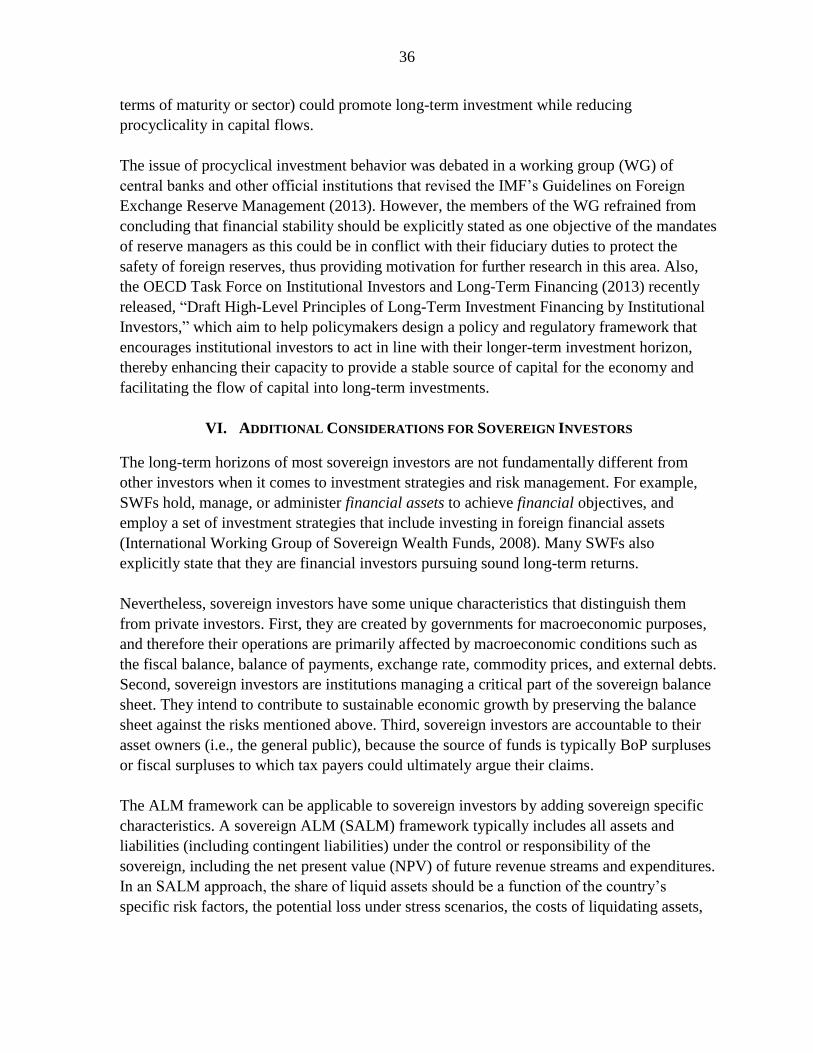
36
terms of maturity or sector) could promote long-term investment while reducing
procyclicality in capital flows.
The issue of procyclical investment behavior was debated in a working group (WG) of
central banks and other official institutions that revised the IMF’s Guidelines on Foreign
Exchange Reserve Management (2013). However, the members of the WG refrained from
concluding that financial stability should be explicitly stated as one objective of the mandates
of reserve managers as this could be in conflict with their fiduciary duties to protect the
safety of foreign reserves, thus providing motivation for further research in this area. Also,
the OECD Task Force on Institutional Investors and Long-Term Financing (2013) recently
released, “Draft High-Level Principles of Long-Term Investment Financing by Institutional
Investors,” which aim to help policymakers design a policy and regulatory framework that
encourages institutional investors to act in line with their longer-term investment horizon,
thereby enhancing their capacity to provide a stable source of capital for the economy and
facilitating the flow of capital into long-term investments.
VI. ADDITIONAL CONSIDERATIONS FOR SOVEREIGN INVESTORS
The long-term horizons of most sovereign investors are not fundamentally different from
other investors when it comes to investment strategies and risk management. For example,
SWFs hold, manage, or administer financial assets to achieve financial objectives, and
employ a set of investment strategies that include investing in foreign financial assets
(International Working Group of Sovereign Wealth Funds, 2008). Many SWFs also
explicitly state that they are financial investors pursuing sound long-term returns.
Nevertheless, sovereign investors have some unique characteristics that distinguish them
from private investors. First, they are created by governments for macroeconomic purposes,
and therefore their operations are primarily affected by macroeconomic conditions such as
the fiscal balance, balance of payments, exchange rate, commodity prices, and external debts.
Second, sovereign investors are institutions managing a critical part of the sovereign balance
sheet. They intend to contribute to sustainable economic growth by preserving the balance
sheet against the risks mentioned above. Third, sovereign investors are accountable to their
asset owners (i.e., the general public), because the source of funds is typically BoP surpluses
or fiscal surpluses to which tax payers could ultimately argue their claims.
The ALM framework can be applicable to sovereign investors by adding sovereign specific
characteristics. A sovereign ALM (SALM) framework typically includes all assets and
liabilities (including contingent liabilities) under the control or responsibility of the
sovereign, including the net present value (NPV) of future revenue streams and expenditures.
In an SALM approach, the share of liquid assets should be a function of the country’s
specific risk factors, the potential loss under stress scenarios, the costs of liquidating assets,
37
alternative options to generate liquidity, and the willingness to actually use liquid assets.29
Sovereign investors need to take account of not only financial loss, but also other additional
consequences such as reputational damage and negative impact to the country’s
macroeconomic policy framework. This discipline in asset management could help reduce
procyclicality. Further, Korea’s case shows that its reserve manager and SWF have different
investment mandates under an SALM framework, and therefore each one establishes its own
asset allocation: the reserve manager is more focused on securing liquidity and preserving
asset values, while the SWF intends to maximize real purchasing power in the long-term
(Figure 16).
Figure 16. Asset Compositions of Korea’s Foreign Reserves and Korea’s SWF
Sovereign investors could also reduce procyclicality by taking account of country specific
risk factors in estimating potential financial drains (see Appendix: bullet 5.b.). Sovereign
investors’ exposure to risk factors and liquidity needs partly depend on the country specific
factors. Advanced economies may face risks associated with an unfunded pension liability
due to an aging population, structural issues in the healthcare system, and/or contingent
liabilities arising from large financial institutions or state-owned companies. Emerging or
low-income countries, especially those that rely heavily on external demand and capital
inflows, are exposed to risks arising from capital flight and external demand shocks. Greater
vulnerability requires sovereign investors to prepare for contingent liabilities and to consider
this in developing their SAA. In this regard, reserve managers’ SAA needs to be based on
their forward-looking assessment of various scenarios for macroeconomic development,
financial market conditions, and implications for each asset class by considering the
relationship between their country’s vulnerabilities and the risk-return profile of assets. Thus,
29
Goodhart (2008) illustrates why liquidity is useless if it cannot be used, or if the asset owner is unwilling to
use it: “The most salient metaphor and fable in prudential regulation is of the weary traveler who arrives at the
railway station late at night, and, to his delight, sees a taxi there who could take him to his distant destination.
He hails the taxi, but the taxi driver replies that he cannot take him, since local bylaws require that there must
always be one taxi standing ready at the station. Required liquidity is not true, usable liquidity.”
5%
38%
22%
13%
17%
6%
Deposits
Government
bonds
Agency bonds
Corporate bonds
ABS
Stocks
Asset Composition of Korea's Foreign Reserves (2012)
Source: Bank of Korea.
39%
45%
3%
2%2%
9%
Bonds
Equities
Inflation-linked
bonds
Hedge funds
Private equities
Others
Asset Allocation of Korea' SWF
Source: Korea Investment Corporation (2012).
38
trade relations and external debt compositions can be important factors in reserve managers’
decisions about currency diversification.
Sovereign investors face unique challenges in designing the SAA and risk management
framework. While private sector companies usually have clearly defined balance sheets (e.g.,
assets, liabilities, and equity), sovereigns sometimes do not have fully consolidated balance
sheets, especially when some related entities (e.g., pension plans, local governments, and
public corporations) are not included in the reporting system. Many financial variables, such
as the exchange rate, interest rates, and inflation rate, are closely related to the country’s
macroeconomic policies, providing additional constraints on sovereign investors’ asset
allocation. Failures in sovereign investors’ risk management could have spillover impacts on
other entities in the private sector, and this may lead to procyclical behavior. For example,
the lack of adequate liquidity in the central bank’s foreign reserves could trigger a financial
and economic crisis, leading to an increased burden on private sector financing activities.30
Ensuring accountability is critical for maintaining a long-term investment horizon and
avoiding pressure for procyclical behavior. Sovereign investors’ asset allocation should be
clearly communicated, in easily understandable language, to the general public. Disclosure
should include not only financial numbers, but also the detailed information about how their
objective, return target, risk tolerance, asset mix, and performance correlate with each other.
An adequate level of transparency could help key stakeholders and the public understand
sovereign investors’ operations and maintain confidence in long-term asset management.
Several SWFs have found that ex ante public support for the risks they were taking allowed
them to keep these positions during the crisis, and in some cases to even increase the risks
after prices had fallen. These SWFs benefited when the markets recovered. Building this
level of trust and credibility takes time, though, and it was the more established funds that
benefited most (World Economic Forum, 2011). The following quote from the Norwegian
SWF’s report to the Norwegian Parliament shows how important communication is for
maintaining long-term investments, especially under market uncertainty (Management of the
Government Pension Fund, 2011).
“It is important that we succeed in maintaining a long-term investment strategy during
periods of unrest in the financial markets. Broad support for how the Government
Pension Fund is managed provides a solid foundation for long-term management. The
Storting’s consideration of the annual report on the management of the Government
Pension Fund is part of this. Transparency is a prerequisite for securing widespread
confidence in the management of the Government Pension Fund. The risk which is
assumed in management activities must be presented properly.”
30
For the countries perceived as vulnerable by markets, an adverse feedback loop could occur, with widening
sovereign credit spreads and increasing concerns about banks’ exposures to those sovereigns. This perception
would drive up counterparty risk and lead to higher funding costs for banks.
39
Finally, sovereign investors’ crisis experience suggests that they face a complex relationship
among their several objectives: return objectives, domestic financial stability, and global
financial stability (IMF, 2013). This complexity can arise within an individual institution
(e.g., central bank) mainly because in many cases asset management, risk management,
financial reporting, and the financial stability function are conducted by different units. An
ex ante framework to resolve this potential issue and a well-defined decision-making process
could help reduce inadvertent costs from potential conflict between functions. Competition
among sovereign investors, who want to exit from specific asset markets earlier than others
during the crisis, can lead to a more serious situation in the market. Information exchange or
coordination (e.g., notification to recipient countries in case of a large-sized portfolio
adjustment) between sovereign investors can contribute to a reduction in market uncertainty
from unexpected actions. Also, sovereign investors should be aware of the signaling effect
and financial stability implications of their large-scale asset sales before taking action. The
IMF, based on its global membership and its mandate to ensure the stability of the
international monetary system, can play an important role in coordinating the interests of
different countries.
VII. CONCLUDING REMARKS
The role of long-term institutional investors in preventing procyclical patterns is becoming
more important in light of the anticipated increased demand for long-term investment. In
many advanced economies, an increased life expectancy and accompanying retirement wave,
especially in the baby boomer generation, is fueling investment demand from pension and
healthcare systems. Also, many emerging economies and low-income countries need to
invest more in their infrastructure and human capital, as they seek to promote long-term
growth potential. Further, a large amount of new infrastructure needs to be built over the next
few decades. According to Ottesen (2011), at least US$40 trillion will be needed in the
coming 20 years for urban infrastructure investments globally.
Moreover, recent global market developments present challenges to institutional investors.
Although some confidence in the global financial system has returned, market participants
are now concerned about the impact of the phasing out of quantitative easing (QE) in
advanced economies, which has pushed volatility to low levels and accelerated some
investors’ shift toward high-risk assets or emerging markets. According to the IMF (2011),
positive growth prospects and falling risks in the recipient countries were the main factors
driving investors’ long-term real-money asset allocations, while a decline in global risk
aversion had increased investment in the equities and bonds of emerging markets. It also
suggests that a negative shock to these markets could potentially lead to a reversal of
investment flows, which could be similar in scale to the outflows they experienced during the
global financial crisis. Anecdotal evidence suggests that some institutional investors are now
turning from public to private equity or to financial products with built-in leverage, which
may lead to another round of procyclicality (Corkery, 2012). Also, hedge fund managers are
40
becoming more bullish about the financial markets and potentially high return opportunities,
thus raising the risk of heightened procyclical investment behavior (Jones, 2013).
Institutional investors are now facing a wide range of risks and structural changes. The
prevailing low interest rate environment is crystallizing structural weaknesses in pension
funds and life insurance companies. Stringent regulations make it difficult to re-price
products on the liability side, and there is not much pricing power in premiums, creating
pressure to take additional (credit) risk. The increased variability of returns, especially under
rigid mark-to-market accounting rules, may make some investors’ asset allocation more
volatile, leading to procyclical investor activity and a risk of sudden reversals that may
adversely affect financial stability. Also, reserve managers noted that the level of secondary
market liquidity in European government bonds, agency bonds, and supranational bonds is
lower than pre-crisis levels (Pringle and Carver, 2012). A turn in the current low interest and
ample liquidity cycle may trigger exaggerated price declines or an inability to exit, creating
pressure for procyclical behavior. This has already been evidenced by the recent outflows
from emerging market equity and bond funds prompted by the U.S. Federal Reserve’s
statement on potential tapering of their QE measures.
Our analysis of procyclical institutional investment behavior, aligned with important lessons
from the crisis, could be important to address these challenges and promote long-term
investing. The crisis has shown that inappropriate responses to market dynamics resulted in
excessive risk taking and rapid reversals in positions. Long-term investments make it
possible to reap risk premiums that are difficult to achieve in the short run. However, a
number of constraints, such as pressure on short-term performance, principal–agent
problems, governance, and difficulties in risk assessment, can be obstacles in realizing this
benefit of the long-term horizon. Such procyclical investment behavior may be
understandable and considered rational from an individual institution’s perspective.
However, our main conclusion is that appropriately addressing these issues and behaving in a
manner consistent with long-term investing would lead to better long-term risk-adjusted
returns and, importantly, could lessen the potential adverse effects of the procyclical
investment behavior of institutional investors and public entities on global financial stability.
Taking full advantage of the benefits of more long‐term and less procyclical investment
actions requires rigorous efforts in a number of areas:
ALM approach. A well-defined ALM approach is needed to derive the optimal SAA
of a long-term investor. This process should go beyond asset classes and use the
underlying factors (e.g., macroeconomic, political) that drive risk premiums as the
basis for portfolio construction.
Rebalancing process. In implementing the SAA, the rebalancing process can create
investment discipline and therefore help avoid procyclical behavior.
41
Risk management. Asset owners should make a strategic decision on the level of
risk to be taken and the key sources of risk premiums to be exploited. Risk managers
should fully understand the strengths and weaknesses of all the risk metrics and apply
them in line with the characteristics of their portfolios.
Governance. Countercyclical investing requires strong governance structures to
withstand the temptation to sell when asset prices drop. It is important that incentives
for the manager are compatible with those of the owner, so that the manager neither
seeks excessive short-term risk nor inappropriately adjusts the level of risk.
However, whether regulators should intervene in each of these areas (e.g., ALM, governance,
risk management) with specific regulatory measures remains an open question that needs to
be analyzed further and the findings reported in a subsequent study.
Finally, several considerations should apply to investors, especially sovereign investors who
are managing part of the sovereign balance sheet for macroeconomic purposes. Sovereign
investors should deeply analyze country-specific risk factors in estimating potential financial
drains, as well as in designing sovereign SAA. Ensuring accountability is critical for gaining
the public’s confidence and maintaining a long-term investment horizon, thus ensuring
financial stability through less procyclical investment activities. Financial stability can then
contribute to the achievement of a higher risk-adjusted return in the long run, because, in a
stable market, investors can minimize the risk of abrupt redemption requests from asset
owners and thereby maintain their original long-term investment horizons. This would
ultimately help them enjoy higher risk premiums to which short-term investors cannot easily
gain access.

42
APPENDIX. FRAMEWORK FOR SOUND INVESTMENT PRACTICES FOR LONG-TERM
INVESTORS
1. Design appropriate investment strategies and SAA
a) Define investors’ objectives and liabilities clearly, in order to determine the
investment horizon over which risks and expected returns are measured.
b) Use conservative economic scenarios to estimate the investment horizon in order to
reduce the probability that a significant share of assets may need to be sold
unexpectedly or at short notice.
c) Derive an optimal asset allocation in line with any liabilities the fund may have. Take
a long-term, through-the-life-cycle approach to minimize procyclical behavior.
d) Secure an appropriate level of liquid assets, given uncertainty in the investment
horizon and potential unexpected liquidity needs.
e) Ensure an adequate level of risk premiums in illiquid assets, especially when
investments involve considerable discretion for external managers.
f) Consider using a risk factor-based approach, as this can complement traditional asset
class-based SAA models by focusing on underlying risks embedded in each asset
class.
g) Ensure that operational procedures are well defined in designing and implementing
the SAA.
2. Develop effective portfolio rebalancing rules
a) Institutionalize portfolio rebalancing rules, in order to create investment discipline
and avoid procyclical behavior.
b) Establish a framework in which the actual portfolio maintains a risk exposure in line
with the policy portfolio. In this context, it is important that (i) the risk tolerance is
not reduced in adverse market scenarios and (ii) countercyclical rebalancing is
encouraged.
c) Incorporate forward-looking risk and return measures so as to further improve the
SAA and rebalancing rules.
3. Build a robust risk management system
a) Note key lessons from the financial crisis and implications (e.g., limited benefits of
diversification and the contagion effect) for institutional investors’ risk management.

43
b) Adopt a long-term horizon and take account of whole economic cycles in designing a
risk management system.
c) Understand the strengths and weaknesses of each risk metric and apply risk
management models in line with the characteristics of portfolios.
d) Use traditional risk management models with complementary methodologies (e.g.,
scenario analysis and stress testing).
e) Manage with great care the risk of the potential impact of one’s own investment
decisions on capital markets (applicable to very large investors in particular).
f) Undertake a prudent due diligence process before investors move into new
investment markets and instruments.
4. Establish an appropriate governance structure
a) Investors (asset owners) bear the risk and are therefore responsible for the investment
policy, including the SAA and the risk control framework.
b) Asset owners’ access to accurate and relevant information is essential to an effective
accountability framework.
c) Asset managers’ incentives should be compatible with those of the owners, so that
they do not inappropriately adjust risks if that is not consistent with the owners’ long-
term interests.
d) A long-term performance measurement, covering multiple years, should be
encouraged rather than using short-term performance-based targets.
e) Asset owners should have a firm understanding of how asset allocation creates risks,
what risk factors are behind each asset class, and how managers’ risk taking is
compensated in terms of expected returns.
f) Timely communication and reporting from risk managers to asset owners, without
distortion by intermediaries, is essential for optimal strategic decisions.
5. Consider country-specific factors in developing the investment strategy (for sovereign
investors)
a) An SALM framework should start from the sovereign balance sheet and include all
assets and liabilities under the control or responsibility of the sovereign.
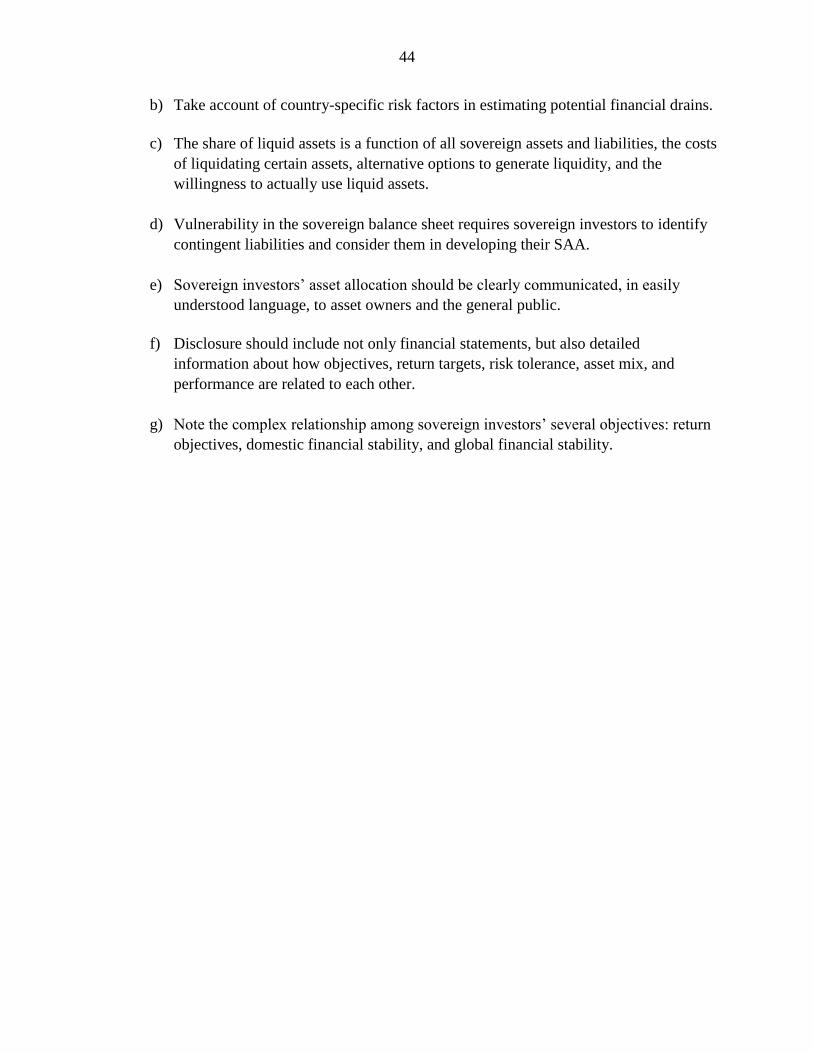
44
b) Take account of country-specific risk factors in estimating potential financial drains.
c) The share of liquid assets is a function of all sovereign assets and liabilities, the costs
of liquidating certain assets, alternative options to generate liquidity, and the
willingness to actually use liquid assets.
d) Vulnerability in the sovereign balance sheet requires sovereign investors to identify
contingent liabilities and consider them in developing their SAA.
e) Sovereign investors’ asset allocation should be clearly communicated, in easily
understood language, to asset owners and the general public.
f) Disclosure should include not only financial statements, but also detailed
information about how objectives, return targets, risk tolerance, asset mix, and
performance are related to each other.
g) Note the complex relationship among sovereign investors’ several objectives: return
objectives, domestic financial stability, and global financial stability.
45
REFERENCES
Abu Dhabi Investment Authority, 2012, “2011 Review: Prudent Global Growth” (Abu
Dhabi).
Andersen, Palle, 1997, “Forecast Errors and Financial Developments,” BIS Working
Paper 51 (Basel: Bank for International Settlements).
Ang, Andrew, William N. Goetzmann, and Stephen M. Schaefer, 2009, “Evaluation of
Active Management of the Norwegian Government Pension Fund – Global,” Report
to the Norwegian Ministry of Finance.
———, and Knut N. Kjaer, 2011, “Investing for the Long Run,” Available via the Internet:
http://ssrn.com/abstract=1958258.
Arisoy, Yakup Eser, Aslihan Altay Salih, and Levent Akdeniz, 2012, “Aggregate Volatility
and Threshold CAPM,” Available via the Internet: http://ssrn.com/abstract=2083727.
Arnswald, Torsten, 2001, “Investment Behaviour of German Equity Fund Managers,”
Discussion Paper 08/01 (Frankfurt: Economic Research Centre of the Deutsche
Bundesbank).
Artis, Michael J., 1996, “How Accurate Are the IMF’s Short-term Forecasts? Another
Examination of the World Economic Outlook,” IMF Working Paper 96/89
(Washington: International Monetary Fund).
Bair, Sheila C., 2011, “Lessons of the Financial Crisis: The Dangers of Short-Termism,”
Remarks to the National Press Club, Washington, D.C., June 24.
Bakker, Age F.P., and Ingmar R.Y. van Herpt, 2007, Central Bank Reserve Management:
New Trends, from Liquidity to Return, (Cheltenham, U.K.: Edward Elgar).
Bank for International Settlements, 2008, Addressing Financial System Procyclicality: a
Possible Framework, Note for the FSF Working Group on Market and Institutional
Resilience, September (Basel).
Barber, Bard M., and Terrance Odean, 2000, “Trading Is Hazardous to Your Wealth: The
Common Stock Investment Performance of Individual Investors,” Journal of
Finance, Vol. 55 (April), No. 2, pp. 773–806.
Beber, Alessandro, Michael W. Brandt, and Kenneth A. Kavajecz, 2009, “Flight-to-Quality
or Flight-to-Liquidity? Evidence from the Euro-Area Bond Market,” Review of
Financial Studies, Vol. 22 (March), No. 3, pp. 925–57.
Bernanke, Ben, Mark Gertler, and Simon Gilchrist, 1996, “The Financial Accelerator and the
Flight to Quality,” Review of Economics and Statistics, Vol. 78 (February), No. 1,
pp. 1–15.
46
Bernstein, Shai, Josh Lerner, and Antoinette Schoar, 2013, “The Investment Strategies of
Sovereign Wealth Funds,” Journal of Economic Perspectives, Vol. 27 (Spring),
pp. 219–238.
Bertsimas, Dimitris, Vishal Gupta, and Ioannis Ch. Paschalidis, 2012, “Inverse Optimization:
A New Perspective on the Black-Litterman Model,” Operations Research, Vol. 60
(November–December), No. 6, pp. 1389–1403.
Bikhchandani, Sushil, David A. Hirshleifer, and Ivo Welch, 1992, “A Theory of Fads,
Fashion, Custom and Cultural Changes as Informational Cascades,” Journal of
Political Economy, Vol. 100 (October), No. 5, pp. 992–1026.
———, and Sunil Sharma, 2010, “Herd Behavior in Financial Markets: A Review,” IMF
Working Paper 00/48 (Washington: International Monetary Fund).
Borio, Claudio, Gabriele Galati and Alexandra Heath, 2008, “FX reserve management:
trends and challenges,” BIS Paper 40 (Basel: Bank for International Settlements).
———, Craig Furfine, and Philip Lowe, 2001, “Procyclicality of the Financial System and
Financial Stability: Issues and Policy Options,” BIS Paper 1 (Basel: Bank for
International Settlements).
Brennan, Michael, 1993, “Agency and Asset Prices,” Finance Working Paper No. 6-93
(Los Angeles: UCLA).
Broner, Fernando A., Tatian Didier, Aitor Erce, and Sergio L. Schumukler, 2013, “Gross
Capital Flows: Dynamics and Crises,” Journal of Monetary Economics, Volume 60
(January), Issue 1, pp 113–133.
Brown, Aaron, Michael Papaioannou, and Iva Petrova, 2010, “Macrofinancial Linkages of
the Strategic Asset Allocation of Commodity-Based Sovereign Wealth Funds,” IMF
Working Paper 10/9 (Washington: International Monetary Fund).
Brunnermeier, Markus K., 2009, “Deciphering the Liquidity and Credit Crunch 2007–08,”
Journal of Economic Perspectives, Vol. 23 (Winter), No. 1, pp. 77–100.
Buffett Partnership Letter to Partners, 1969. Available via the Internet: http://www.rational
walk.com/wp-content/uploads/2010/04/BuffettPartnershipNotesGifford.pdf.
CalPERS, 2009, “Memorandum to CalPERS Hedge Fund Partners,” Available via the
Internet: http://www.calpers.ca.gov/eip-docs/investments/assets/equities/hedge-fund-
memo.pdf
Center for Social Philanthropy and Tellus Institute, 2010, Educational Endowments and the
Financial Crisis: Social Costs and Systemic Risks in the Shadow Banking System—A
Study of Six New England Schools (Boston).
47
Chiang, Thomas C., and Dazhi Zheng, 2010, “An Empirical Analysis of Herd Behavior in
Global Stock Markets,” Journal of Banking & Finance, Vol. 34 (August), No. 8,
pp. 1911–21.
Claessens, Stijn, and M. Ayhan Kose, 2013, “Financial Crises: Explanations, Types, and
Implications,” IMF Working Paper 13/28 (Washington: International Monetary
Fund).
Corkery, Michael, 2012, “Public Pensions Increase Private-Equity Investments, Wall Street
Journal (New York), January 26.
Damodaran, Aswath, 2012, “Equity Risk Premiums (ERP): Determinants, Estimation and
Implications – The 2012 Edition,” March (New York City: New York University:
Stern School of Business).
Danielsson, Jon, 2013, “Towards a More Procyclical Financial System,” VOX, March 6.
Available via the Internet: http://www.voxeu.org/article/towards-more-procyclical-
financial-system.
Dasgupta, Amil, Andrea Prat, and Michela Verardo, 2011, “The Price Impact of Institutional
Herding,” Review of Financial Studies, Vol. 24 (March), No. 3, pp. 892–925.
Economist, 2008, “Confessions of a Risk Manager,” August 9. Available via the Internet:
http://www.economist.com/node/11897037.
Fernandez de Lis, Santiago, and Alicia García-Herrero, 2010, “Dynamic Provisioning: Some
Lessons from Existing Experiences,” ADBI Working Paper No. 218 (Tokyo: Asian
Development Bank Institute).
Financial Stability Forum, 2009, “Report of the Financial Stability Forum on Addressing
Procyclicality in the Financial System,” April 2 (Basel).
Fisher, Irving, 1933, “The Debt-Deflation Theory of Great Depressions,” Econometrica,
Vol. 1 (October), No. 4, pp. 337–57.
Future Fund, 2012, “Statement of Investment Policies,” (Melbourne). Available via the
Internet: http://www.futurefund.gov.au/__data/assets/pdf_file/0007/4120/
Statement_of_Investment_Policies_February_2012_A227802.pdf.
Gerlach, Stefan, and Paul F. Gruenwald, 2006, Procyclicality of Financial Systems in Asia
(Washington: International Monetary Fund).
Gonzales, Jose Ernesto N., 2009, “The Fundamentals of Procyclicality of the Financial
System,” Economic Newsletter, No. 09-03, July.
Goodhart, Charles, 2008, “Liquidity Risk Management,” Banque de France Financial
Stability Review, Vol. 11 (February), pp. 39–44.
48
Gorton, Gary B., and Guillermo L. Ordoñez, 2012, “Collateral Crises,” NBER Working
Paper 17771 (Cambridge, MA: National Bureau of Economic Research).
Government of Singapore Investment Corporation, 2009, “Report on the Management of the
Government’s Portfolio for the Year 2008/2009” (Singapore).
________________, 2010, “Report on the Management of the Government’s Portfolio for
the Year 2009/2010” (Singapore).
Grinblatt, Mark, Sheridan Titman, and Russ Wermers, 1995, “Momentum Investment
Strategies, Portfolio Performance, and Herding: A Study of Mutual Fund Behavior,”
American Economic Review, Vol. 85 (December), No. 5, pp. 1088–1105.
Guo, Weiyu and Mark E. Wohar, 2006, “Regime Changes in Market Volatility,” Journal of
Financial Research, Vol. 29 (March), Issue 1, pp. 79-93.
Harding, Robin, 2013, “Emerging Markets Dump Euro Reserves,” Financial Times
(London), March 31.
Hardouvelis, Gikas A., 2010, “Actions for a Less Procyclical Financial System,” Economy &
Markets, Eurobank Research, Vol. 5 (September), Issue 5, pp. 1–33.
Harvard Management Company, 2009, Harvard Management Company Endowment Report
(Cambridge, MA: Harvard University).
Ilmanen, Antti, 2011, Expected Returns: An Investor’s Guide to Harvesting Market Rewards,
(West Sussex, United Kingdom: Wiley).
Ilyina, Anna, 2007, “Portfolio Constraints and Contagion in Emerging Markets,” Staff Paper,
International Monetary Fund, Vol. 53, No. 3 (Washington: International Monetary
Fund).
Impavido, Gregorio and Ian Tower, 2009, “How the Financial Crisis Affects Pensions and
Insurance and Why the Impacts Matter,” IMF Working Paper 09/151 (Washington:
International Monetary Fund).
International Association of Insurance Supervisors (IAIS), 2011, “Insurance and Financial
Stability,” November (Basel).
International Forum of Sovereign Wealth Funds (IFSWF), 2011, IFSWF Members’
Experiences in the Application of the Santiago Principles, Available via the Internet:
http://www.ifswf.org/pst/stp070711.pdf.
International Monetary Fund, 2011, “Long-term Investors and Their Asset Allocation: Where
Are They Now?” Global Financial Stability Report, (September), Chapter 2, World
Economic and Financial Surveys, (Washington: International Monetary Fund).
49
__________________, 2012, “Restoring Confidence and Containing Global Spillovers,”
Global Financial Stability Report, (October), Chapter 2, World Economic and
Financial Surveys (Washington: International Monetary Fund).
__________________, 2013, Revised Guidelines for Foreign Exchange Reserve
Management (Washington: International Monetary Fund).
International Working Group of Sovereign Wealth Funds (IWG), 2008, Sovereign Wealth
Funds: Generally Accepted Principles and Practices—“Santiago Principles,”
Available via the Internet: http://www.iwg-swf.org/pubs/eng/santiagoprinciples.pdf.
Jenkins, Patrick, 2011, “It Is Hard to Understate the Bank Liquidity Crisis,” Financial Times
(London), September 6.
Jin Li, 2005, “How Does Investor Short-Termism Affect Mutual Fund Manager Short-
Termism?” (Cambridge: Harvard Business School).
Joint FSF–CGFS Working Group, 2009, “The Role of Valuation and Leverage in
Procyclicality,” March.
Jones, Sam, 2013, “Hedge Funds Storm Back into Form,” Financial Times (London),
March 24.
Kazakevitch, Peter, and Alexandra Trishkina, 2010, “The Russian Federation: Challenges for
a Rainy Day,” Economics of Sovereign Wealth Funds: Issues for Policymakers, ed.
by Udaibir S. Das, Adnan Mazarei, and Han van der Hoorn, pp. 277–279 ,
(Washington: International Monetary Fund).
Keynes, John Maynard, 1936, The General Theory of Employment, Interest, and Money,
(Hampshire: Palgrave Macmillan).
Kjaer, Knut N., 2010, “Asset and Risk Management in a Post-Crisis Market,” Presentation at
the CFA Institute Third Annual European Investment Conference, Copenhagen,
Denmark, November.
Kremer, Stephanie, 2011, “Herding of Institutional Traders: New Evidence from Daily
Data,” (Berlin: Free University of Berlin).
Kunzel, Peter, Yinqiu Lu, Iva Petrova, and Jukka Pihlman, 2011, “Investment Objectives of
Sovereign Wealth Funds: A Shifting Paradigm,” IMF Working Paper 11/19
(Washington: International Monetary Fund).
Lakonishok, Josef, Andrei Shleifer, and Robert W. Vishny, 1992, “The Impact of
Institutional Trading on Stock Prices,” Journal of Financial Economics, Vol. 32
(August), pp. 23–43.
Malkiel, Burton G., 2003, “Passive Investment Strategies and Efficient Markets,” European
Financial Management, Vol. 9 (March), No. 1, pp. 1–10.
50
Marginson, David, and Laurie McAulay, 2008, “Exploring the Debate on Short-Termism: a
Theoretical and Empirical Analysis,” Strategic Management Journal, Vol. 29
(March), No. 3, pp. 273–92.
McCauley, Robert N., and Jean-François Rigaudy, 2011, “Managing Foreign Exchange
Reserves in the Crisis and After,” BIS Paper 58 (Basel: Bank for International Settlements).
McKinsey Global Institute, 2013, “Financial Globalization: Retreat or Reset?”McKinsey and
Company, March. Available via the Internet: http://www.mckinsey.com/insights/
global_capital_markets/financial_globalization
Miracky, William, and Bernardo Bortolotti (eds.), 2009, “Weathering the Storm: Sovereign
Wealth Funds in the Global Economic Crisis of 2008,” SWF Annual Report 2008,
April (Milan: Monitor Group and Fondazione Eni Enrico Mattei).
National Pension Reserve Fund, 2012, Annual Report 2011 (Dublin).
Norway Pension Fund Global, 2009, Annual Report 2008 (Oslo).
———, 2010, Annual Report 2009 (Oslo).
———, 2012, Management of the Government Pension Fund in 2011 (Oslo).
Organisation for Economic Co-operation and Development (OECD), 2008, Pension Markets
in Focus, Issue 5, December (Paris).
———, 2010, Pension Markets in Focus, Issue 7, July (Paris).
———, 2011, Pension Markets in Focus, Issue 8, July (Paris).
———, 2011, “Special feature: Focus on Long-term Investment and Growth,” Financial
Market Trends, Vol. 2011, Issue 1 (Paris: OECD).
———, 2013, Draft High-Level Principles of Long-Term Investment Financing by
Institutional Investors, May (Paris).
Ottesen, Frederic, 2011, “Infrastructure Needs and Pension Investments: Creating the Perfect
Match,” Financial Market Trends, Vol. 2011, Issue 1 (Paris: OECD).
Park, Joonkyu, and Han van der Hoorn, 2012, “Financial Crisis, SWF Investing, and
Implications for Financial Stability,” Global Policy Journal, Vol. 3 (May), No. 2,
pp. 211–21.
Persaud, Avinash, 2001, “Sending the Herd off the Cliff Edge: The Disturbing Interaction
Between Herding and Market-Sensitive Risk Management Practices,” Market
Liquidity: Proceedings of BIS Workshop, Vol. 02 (April), pp. 223-240 (Basel: Bank
for International Settlements).
51
Pihlman, Jukka, and Han van der Hoorn, 2010, “Procyclicality in Central Bank Reserve
Management: Evidence from the Crisis,” IMF Working Paper 10/150 (Washington:
International Monetary Fund).
Preqin, 2009, “Survey of Endowments Investing in Private Equity,” Preqin Research Report,
October.
Pringle, Robert and Nick Carver, 2012, “Trends in Reserve Management—2012 Survey
Results,” RBS Reserve Management Trends 2012 (London: Central Banking
Publications).
Pucket, Andy and Xuemin Yan, 2008, “Short-term Institutional Herding and Its Impact on
Stock Prices,” Available via the Internet: http://ssrn.com/abstract=972254.
Raddatz, Claudio, and Schmukler, Sergio, 2011, “On the International Transmission of
Shocks: Micro-Evidence from Mutual Fund Portfolios,” NBER Working Paper 17358
(Cambridge: National Bureau of Economic Research).
Rajan, Raghuram G., 2005, “Has Financial Development Made the World Riskier?”
Proceedings, Federal Reserve Bank of Kansas City, August, pp. 313–69.
Rochet, Jean Charles, 2008, “Procyclicality of Financial Systems: Is There a Need to Modify
Current Accounting and Regulatory Rules?” Financial Stability Review, No. 12–
Valuation and Financial Stability (October), pp. 95–99 (Paris: Banque de France).
Rösch, Christoph G., and Christoph Kaserer, 2012, “Market Liquidity in the Financial Crisis:
The Role of Liquidity Commonality and Flight-to-Quality,” August (Munich:
Technical University of Munich).
Rudolph, Max J., 2011, “U.S. Insurance Company Investment Strategies in an Economic
Downturn,” White Paper sponsored by Committee on Financial Research, Society of
Actuaries (Schaumburg, IL).
Scharfstein, David S., and Jeremy C. Stein, 1990, “Herd Behavior and Investment,”
American Economic Review, Vol. 80 (June), No. 3, pp. 465–79.
Sharpe, William F., 1991, “The Arithmetic of Active Management,” Financial Analysts’
Journal, Vol. 47 (January–February), No. 1, pp. 7–9.
Sias, Richard W., 2004, “Institutional Herding,” Review of Financial Studies, Vol. 17
(Spring), No. 1, pp. 156–206.
Smit, Han T.J., and Ward A. van den Berg, 2006, “Private Equity Waves,” Tinbergen
Institute Discussion Paper, TI 2006-053/2.
Stanford Management Company, 2009, Report from the Stanford Management Company
(Stanford, CA).
52
Swensen, David F., 2009, Pioneering Portfolio Management: An Unconventional Approach
to Institutional Investment, (New York: Simon & Schuster, rev. ed.).
Trichet, Jean-Claude, 2001, “Preserving Financial Stability in an Increasingly Globalised
World,” keynote speech at the European Financial Markets Convention, Paris, France
June. Available via the Internet: http://www.banque-france.fr/uploads/tx_bdfgrandes
dates/sp150601.pdf.
Wermers, Russ, 1999, “Mutual Fund Herding and the Impact on Stock Prices,” Journal of
Finance, Vol. 54 (April), No. 2, pp. 581–622.
World Economic Forum, 2011, The Future of Long-term Investing (Geneva).