Processing Big Data Using Secure HDFS
54
St. Cloud State University theRepository at St. Cloud State Culminating Projects in Mechanical and Manufacturing Engineering Department of Mechanical and Manufacturing Engineering 5-2016 Processing Big Data Using Secure HDFS Snigdha Pavuluri St. Cloud State University Follow this and additional works at: hps://repository.stcloudstate.edu/mme_etds is Starred Paper is brought to you for free and open access by the Department of Mechanical and Manufacturing Engineering at theRepository at St. Cloud State. It has been accepted for inclusion in Culminating Projects in Mechanical and Manufacturing Engineering by an authorized administrator of theRepository at St. Cloud State. For more information, please contact [email protected]. Recommended Citation Pavuluri, Snigdha, "Processing Big Data Using Secure HDFS" (2016). Culminating Projects in Mechanical and Manufacturing Engineering. 34. hps://repository.stcloudstate.edu/mme_etds/34
Transcript of Processing Big Data Using Secure HDFS
St. Cloud State UniversitytheRepository at St. Cloud StateCulminating Projects in Mechanical andManufacturing Engineering
Department of Mechanical and ManufacturingEngineering
5-2016
Processing Big Data Using Secure HDFSSnigdha PavuluriSt. Cloud State University
Follow this and additional works at: https://repository.stcloudstate.edu/mme_etds
This Starred Paper is brought to you for free and open access by the Department of Mechanical and Manufacturing Engineering at theRepository at St.Cloud State. It has been accepted for inclusion in Culminating Projects in Mechanical and Manufacturing Engineering by an authorized administratorof theRepository at St. Cloud State. For more information, please contact [email protected].
Recommended CitationPavuluri, Snigdha, "Processing Big Data Using Secure HDFS" (2016). Culminating Projects in Mechanical and ManufacturingEngineering. 34.https://repository.stcloudstate.edu/mme_etds/34
1
Processing Big Data Using Secure HDFS
by
Snigdha Pavuluri
A Starred Paper
Submitted to the Graduate Faculty of
St. Cloud State University
in Partial Fulfillment of the Requirements
for the Degree
Master of Engineering Management
May, 2016
Starred Paper Committee:
Hiral Shah, Chairperson
Ben Baliga
Balasubramanian Kasi

2
Abstract
The main objective of this project was to collect the data and provide a solution to the
problems faced by a huge organization, which holds the data of many diverse fields. The
challenge here was to understand Hadoop and its key features for successful implementation
of a Hadoop platform. Users and clients evaluate or analyze the functioning and progress of it.
By applying DAIMC methodology, which supports a rapid, iterative development
style and better result driven. The team focused on the decision driven as well as data driven.
The team also concentrated on the necessities of the decisions to be made, rather than
enclosing all existing data. While following this, organization totally relied on agile
development and business opportunity management for a successful implementation.

3
Acknowledgement
Foremost, I would like to convey my honest gratitude to my mentors Dr. Hiral Shah,
Dr. Ben Baliga, and Prof. Gary Nierengarten for their continuous and tremendous support of
my Master’s study at Saint Cloud State University, for all their patience, inspiration, and
enormous knowledge. And also Dr. Balsy Kasi for his time invested in this project review and
support. Finally, I would honestly thank my parents, family and friends, who provided the
advice and financial support. The project would not have been a possible thing without all of
them.
I’m very thankful to the department of Engineering Management and Saint Cloud State
University for providing the resources.
4
Table of Contents
Page
List of Tables ...................................................................................................................... 6
List of Figures ..................................................................................................................... 7
Chapter
1. Introduction ............................................................................................................ 9
Introduction ...................................................................................................... 9
Problem Statement ............................................................................................ 10
Drawbacks of Using Traditional Approach ...................................................... 10
Objective ........................................................................................................... 12
Project Questions .............................................................................................. 12
Limitations ........................................................................................................ 12
Summary ........................................................................................................... 13
2. Background and Review of Literature ................................................................... 14
Introduction ...................................................................................................... 14
Review of Literature ......................................................................................... 14
Literature Related to Methodology .................................................................. 19
Summary ........................................................................................................... 31
3. Methodology ........................................................................................................... 32
Introduction ...................................................................................................... 32
Design of the Study .......................................................................................... 32
Data Analysis .................................................................................................... 34
5
Chapter Page
Budget ............................................................................................................... 37
Time Line ......................................................................................................... 37
Summary ........................................................................................................... 38
4. Data Presentation and Analysis .............................................................................. 39
Introduction ...................................................................................................... 39
Data Presentation .............................................................................................. 39
Data Analysis .................................................................................................... 43
Summary ........................................................................................................... 47
5. Results, Conclusions, and Recommendations ........................................................ 48
Introduction ...................................................................................................... 48
Results .............................................................................................................. 48
Conclusion ........................................................................................................ 50
Recommendations ............................................................................................ 50
References .......................................................................................................................... 52
6
List of Tables
Table Page
1. Sample Resultant Data ........................................................................................... 42
2. Sample Resultant Data ........................................................................................... 43
7
List of Figures
Figure Page
1. Hadoop Node Data Interactions ............................................................................. 15
2. Hadoop Clustering Diagram ................................................................................... 16
3. HDFS Architecture ................................................................................................. 18
4. Data Processing Diagram ....................................................................................... 18
5. Hadoop Distribution File System and Map Reduce ............................................... 19
6. Map Reduce Architecture ....................................................................................... 20
7. Map and Reduce Architectural Illustration ............................................................ 22
8. Key Features of Hadoop ......................................................................................... 22
9. HDFS Data Distribution System ............................................................................ 24
10. MapReduce Compute Distribution System ............................................................ 24
11. Big Data Technology Requirement Research Result ............................................. 26
12. Hadoop Logical Architecture ................................................................................. 27
13. Automated Data Collection Types ......................................................................... 29
14. Data Flow Architecture .......................................................................................... 29
15. Flow Chart Representation of DMAIC .................................................................. 34
16. Hadoop Approach Divided Tasks .......................................................................... 36
17. Step-by-Step Cycle Time Representation .............................................................. 37
18. Traditional Approach Layout ................................................................................. 40
19. Data Processing Diagram ....................................................................................... 41
20. Block Diagram for the Framework ......................................................................... 44
8
Figure Page
21. Logical Architecture of Map Reduce ..................................................................... 45
22. HDFS Storage System ............................................................................................ 45
23. Physical Architecture .............................................................................................. 46
24. Map Reduce Process Flow Diagram ...................................................................... 47
9
Chapter 1: Introduction
Introduction
Big data is the huge volume of data that cannot be stored and processed with the
traditional approach with in the given time frame. The big data is referred to the size of the
data which is GB/TB/PB /EX bytes. Small amount of data can also be referred as big data
with respect to its context being used for example if we try to attach a document of 100mb in
size to email it would not able to do so, as the email system will not support 100mb of file
attachment. So this 100mb of data can be referred as big data with respect to email. For
example if we are having 10TB of data which is images files upon which some process is to
be done for instance we if we want to resize the image files and enhance these image files
with in a given a time frame. Suppose if we make use of the traditional system to perform this
task we would not be able to accomplish this task with in the given time frame thus the
computing resources of the traditional system would not be sufficient to accomplish this task
on time therefore this 10TB of data is considered as big data (Beyer, 2011).
Big data is hard to analyze with the traditional computing techniques. Companies,
which involve in logistics, financial, health and others, have huge volumes of data, which they
are unable to analyze, understand, and most importantly on how to utilize this huge volume of
data. With the Internet of things computers are unable to extract meaningful information,
which is thus generated. New scientific data is being generated which is also hard to
understand and analyze the pattern (HP, 2015).
10
Problem Statement
Traditional approach of storing and processing big data. In a traditional approach
usually the data that is being generated out of the organization, the financial institutions such
as banks, stock markets and the hospitals is given as an input to the ETL systems and the ETL
system would extract this data and transform this data, i.e., it would convert the data into a
proper format and finally load this data on to the database and now the end user can generate
reports and perform analytics by querying this data. But as this data grows, it becomes a
challenging task to manage and process this data using the traditional approach. This is one of
the fundamental draw backs using the traditional approach.
Drawbacks of Using Traditional Approach
Expensive. It is an expensive system, i.e., it requires a lot of investment for
implementing or upgrading the system. Therefore it is out of the reach for small and medium
organizations.
Scalability. As the data grows expanding it is a challenging task to process the data.
Time consuming system. It takes lot of time to process and extract the valuable
information from this huge data.
Safeguarding data. In a traditional approach a third party can access data easily. As
an example, consider a bank transaction or an electronic filling may have the advantage but it
has disadvantages as well. These electronic files can be hacked easily and are very to software
virus and are easily accessed by an unauthorized person. Thus prevents in a huge data loss,
which is not good.
11
Poor data integration/sharing. This is considered, as the major drawback for the
traditional filling system is that it does not allow the data sharing or the data integration.
Typically, with complete software file filling computer-based system one can access the file
while many others as well accessing the same file, which again reduces the time? But in a
traditional approach consider large amount of client-based data, without the file-sharing
concept it is hard to work with the time taken for a file being accessed by multiple users.
Nature and significance of the problem. Hadoop is an open source, fundamentally
infrastructure software for storing and processing large amount of data sets. To understand
Hadoop one need to understand two main things, the first one is how Hadoop stores the data
and how it processes or analyses the data. Hadoop is a clustered based file system, which uses
HDFS, which stands for Hadoop Distributed file system, and Map Reduce. Hadoop can store
both structured and unstructured data as well. Hadoop is not actually a database, it can store
the data and pull the data out without any sql coding; so it’s more of a data warehousing
system.
With the Hadoop framework the huge amount of data can be stored easily and the
huge volume of data can be processed. Since this data holds a lot of valuable information this
data needs to be processed in a short period of time. By using this valuable information
organizations can boost up their sales and can generate more revenue. By making use of
traditional system we would not accomplish this task with in the given time frame. This is
where Hadoop came into picture.
For the above significant problem the main intentions of Hadoop are:
Storage and processing of huge volume of data.
12
Making the system time ineffective.
Making the cluster automated.
Making the cluster cost effective.
Comparing performance against both internal and external standard.
Objective
The objective of this research was to store and process huge volume of data effectively
within the given time frame with low cost and the analysis of that huge volume of data to
retrieve the valuable information. Achieving a drastic hike in the process cycle of at least 10
times faster than any traditional process. Targeting a 10 TB data processing time of any
format in 10 minutes or less.
Project Questions
The following questions have been answered in this project:
What will be the process to store and manage such a huge volume data processing
10 times efficient?
What will the architecture of processed and extracted valuable information be to
retrieve and store huge volume of data within a given time frame?
Limitations
The project is not fit for small data sets, as HDFS is not efficiently in supporting
random reading of small files.
The project has few stability issues as it is an open source platform and many
developers constantly make improvements.

13
Summary
This chapter gives a thorough introduction of the project. The nature and significance
of the project are discussed. The limitations of the project implementation are also discussed.
The next chapter discusses the background of the project and the research methodologies
used.
14
Chapter 2: Background and Review of Literature
Introduction
The primary objective of this chapter is to understand the background and the
complexities related to it. Literature related to methodologies used to conduct the project is
discussed in detail so that the reader can refer to this for further analysis. This chapter will
provide readers, a complete aspect of the project.
Review of Literature
Hadoop is an open source framework. A tool designed to store and process huge
volume of data efficiently. Hadoop primarily consist of two main components (Apache,
2013). The interaction of Hadoop systems is shown below in Figure 1.
Hadoop distributed file system (HDFS). HDFS engages in storing and managing
huge amounts of data within the Hadoop cluster. And the Hadoop cluster is the combination
of two major nodes Master node, Slave node.
Master Node: The master node is responsible for name node and job tracker.
Node is a machine or a computer that is present in the cluster and demon is a
technical word refers to the background process.
Slave Node: The slave node is responsible for running the data node and task
tracker. Name node and data node responsible for storing and managing the data
and also commonly referred as storage node. Below diagram explains a master
node can have any number of slave or worker nodes.
15
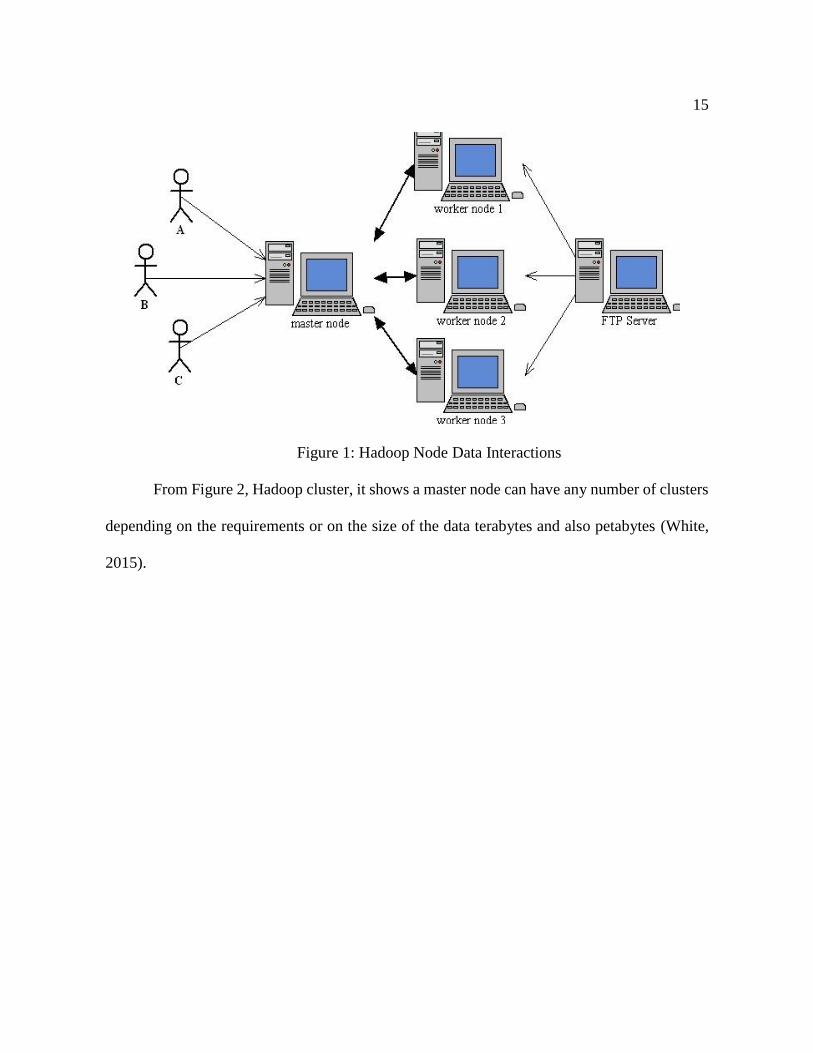
Figure 1: Hadoop Node Data Interactions
From Figure 2, Hadoop cluster, it shows a master node can have any number of clusters
depending on the requirements or on the size of the data terabytes and also petabytes (White,
2015).
16
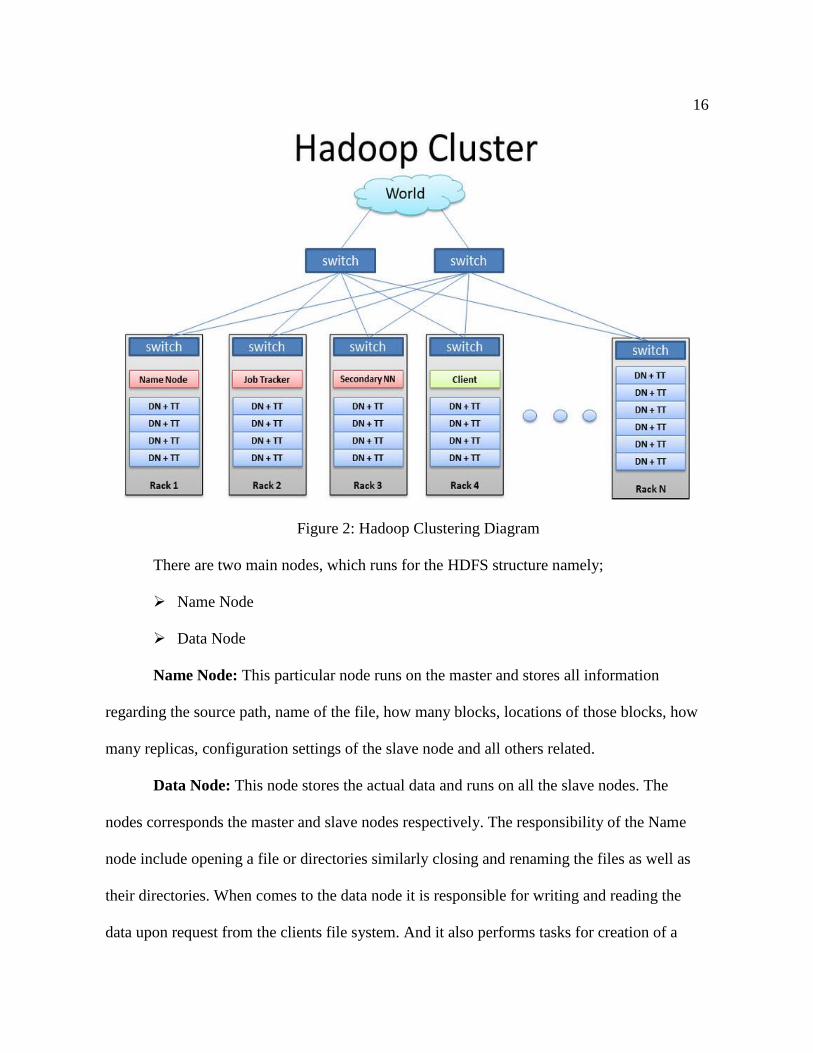
Figure 2: Hadoop Clustering Diagram
There are two main nodes, which runs for the HDFS structure namely;
Name Node
Data Node
Name Node: This particular node runs on the master and stores all information
regarding the source path, name of the file, how many blocks, locations of those blocks, how
many replicas, configuration settings of the slave node and all others related.
Data Node: This node stores the actual data and runs on all the slave nodes. The
nodes corresponds the master and slave nodes respectively. The responsibility of the Name
node include opening a file or directories similarly closing and renaming the files as well as
their directories. When comes to the data node it is responsible for writing and reading the
data upon request from the clients file system. And it also performs tasks for creation of a
17
block replication of block and deletion of a block. Triggered upon requesting from the Name
node only (Serge & Nice, 2013).
After the completion of the process the data structure or the data algorithm needs to
migrate to the data within the nodes instead of data migration to the algorithm. This process is
done because it is more efficient to move the algorithm, which is of less, size rather that
moving the data, which has a size of tera bytes or peta bytes. It also reduces the loss of data
while moving from one node to another, which may cause by any technical glitch. Above
process is referred as Data Locality.
Name node makes all the results on creating/deletion or any replication of the data.
Replication is nothing but making a copy the data on other node or geographical location. The
HDFS system the default replicating factor is of 3, which can be increased upon the request
(HP, 2014).
In the process the replication factor is determined to set to 3 defaults. In this case of 4
nodes with 2TB of data in each. The HDFS is forced to create a replica in node 1 as well as in
node 2 for the third replica data can be replicated in node 3 or node 4 au is in rack 1 or rack 2.
Then these blocks or chunks of files replicated is for fault tolerance across the cluster and
this generally improves the performance. This placement of data is an important step for the
HDFS system to improve the performance and the reliability.
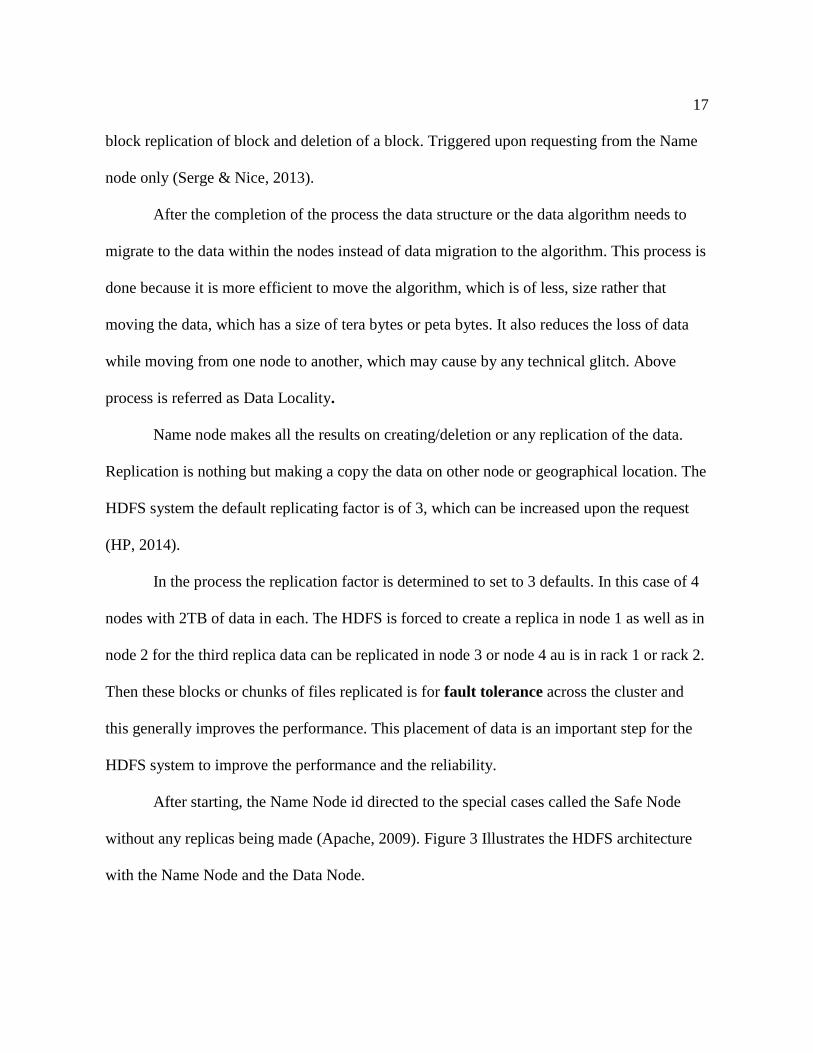
After starting, the Name Node id directed to the special cases called the Safe Node
without any replicas being made (Apache, 2009). Figure 3 Illustrates the HDFS architecture
with the Name Node and the Data Node.
18
Figure 3: HDFS Architecture
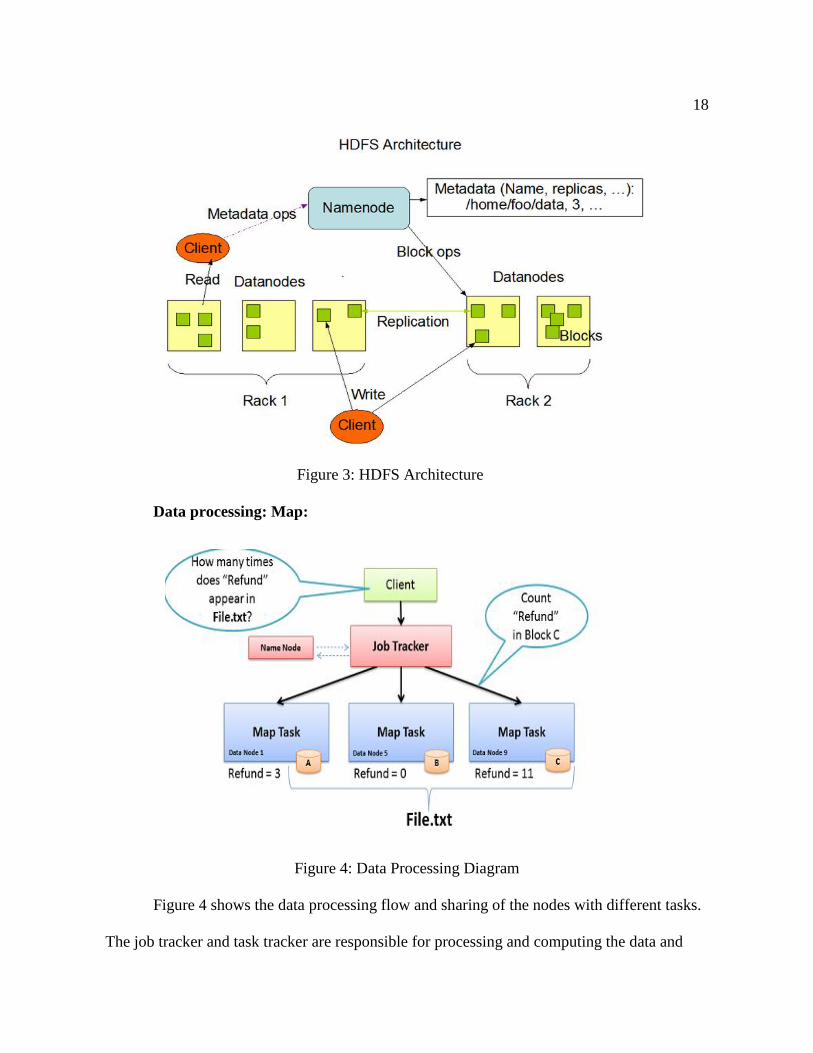
Data processing: Map:
Figure 4: Data Processing Diagram
Figure 4 shows the data processing flow and sharing of the nodes with different tasks.
The job tracker and task tracker are responsible for processing and computing the data and
19
they are referred as compute node. The name node and job tracker are configured on a single
machine whereas data node and task tracker are configured on multiple machines a part from
this we are having a secondary name node as a part on Hadoop cluster.
Literature Related to Methodology
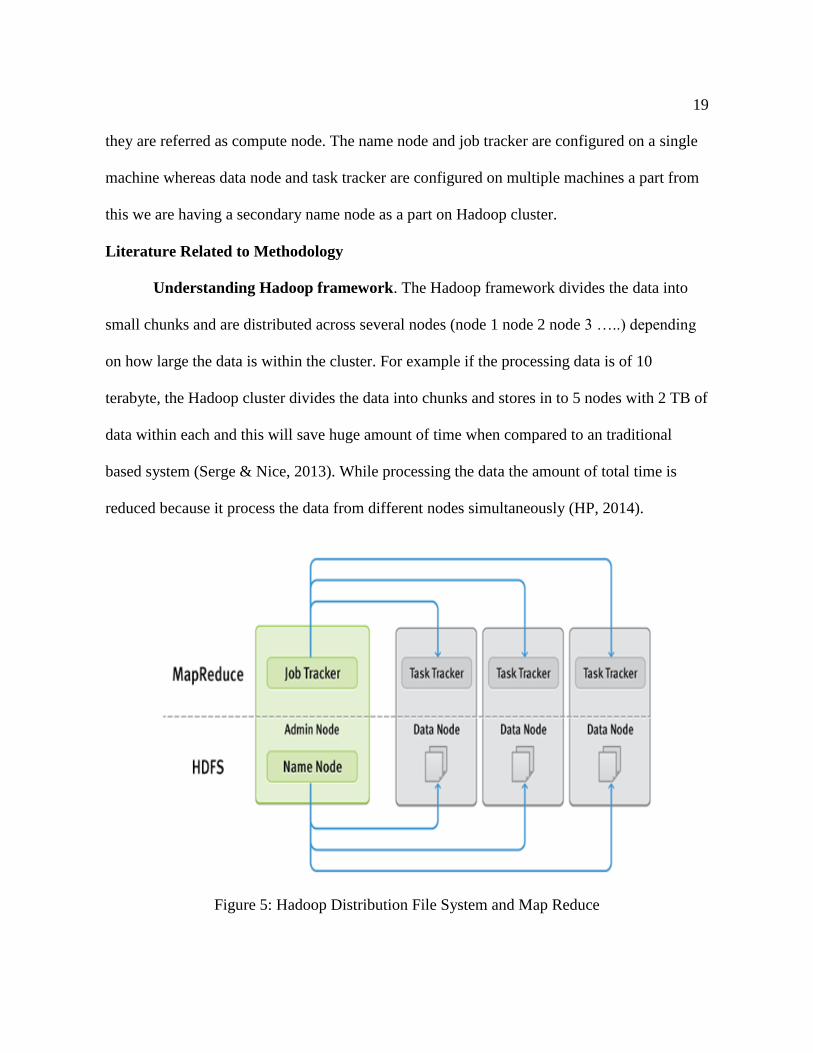
Understanding Hadoop framework. The Hadoop framework divides the data into
small chunks and are distributed across several nodes (node 1 node 2 node 3 …..) depending
on how large the data is within the cluster. For example if the processing data is of 10
terabyte, the Hadoop cluster divides the data into chunks and stores in to 5 nodes with 2 TB of
data within each and this will save huge amount of time when compared to an traditional
based system (Serge & Nice, 2013). While processing the data the amount of total time is
reduced because it process the data from different nodes simultaneously (HP, 2014).
Figure 5: Hadoop Distribution File System and Map Reduce
20
Map reduce: Map reduce takes care of processing and computing the data that is
present with in the HDFS. For an unstructured data of both character data as well as numeric
data, when the data is being processed the map reduces the data to provide the user only with
the output. The output will be in the form of all the character data in one block and all the
numerical data in another block the calculated values will be presented in the third and final
block (Serge & Nice, 2013).
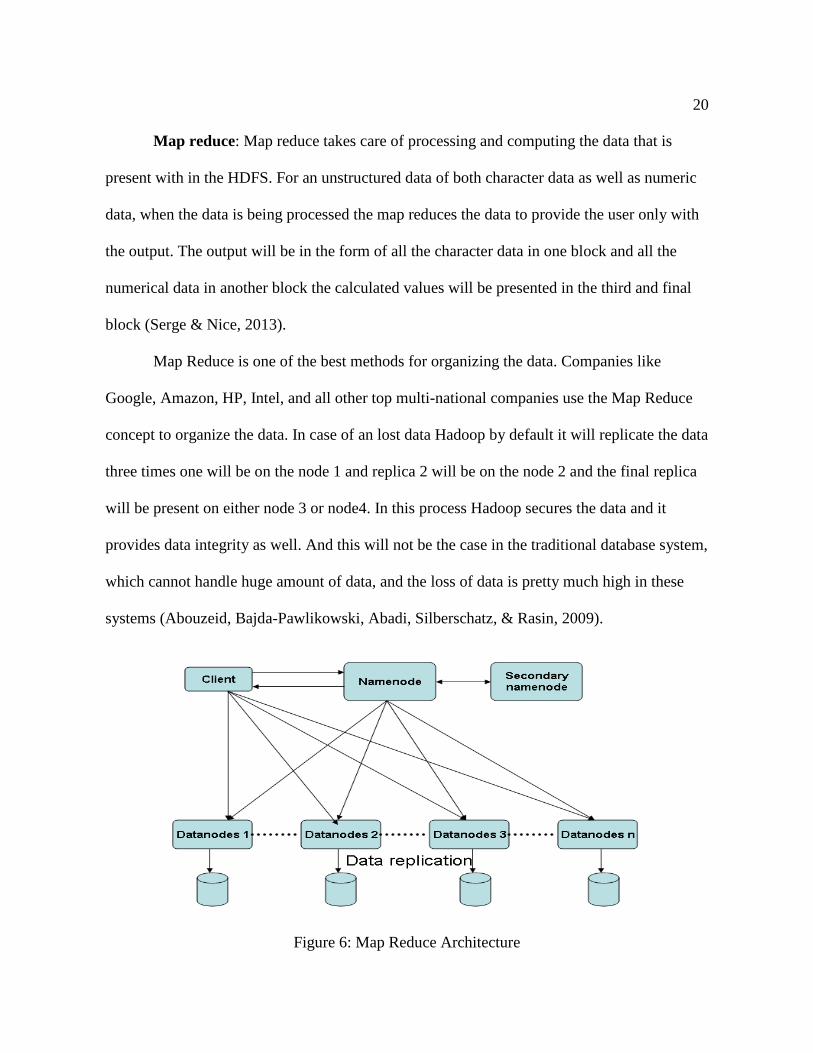
Map Reduce is one of the best methods for organizing the data. Companies like
Google, Amazon, HP, Intel, and all other top multi-national companies use the Map Reduce
concept to organize the data. In case of an lost data Hadoop by default it will replicate the data
three times one will be on the node 1 and replica 2 will be on the node 2 and the final replica
will be present on either node 3 or node4. In this process Hadoop secures the data and it
provides data integrity as well. And this will not be the case in the traditional database system,
which cannot handle huge amount of data, and the loss of data is pretty much high in these
systems (Abouzeid, Bajda-Pawlikowski, Abadi, Silberschatz, & Rasin, 2009).
Figure 6: Map Reduce Architecture
21
Figure 6 clearly demonstrates how the data is distributed across 4 nodes to do the
processing. Map Reduce takes the input process and then produces the result across several
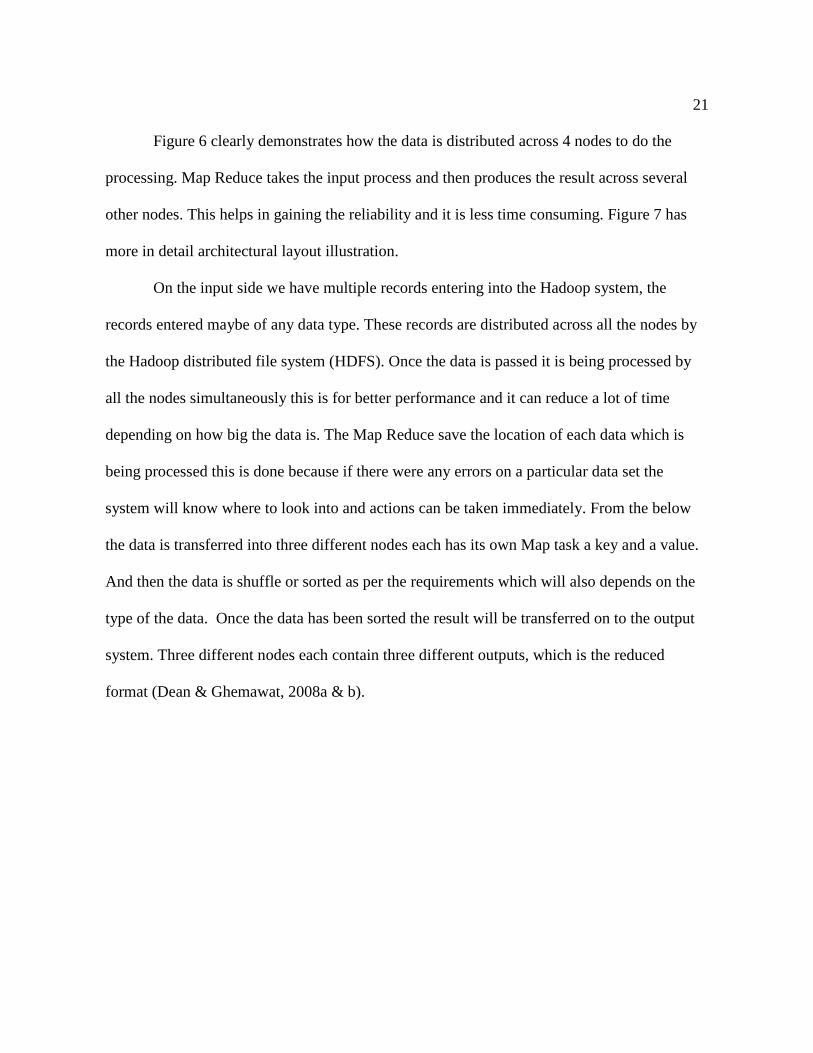
other nodes. This helps in gaining the reliability and it is less time consuming. Figure 7 has
more in detail architectural layout illustration.
On the input side we have multiple records entering into the Hadoop system, the
records entered maybe of any data type. These records are distributed across all the nodes by
the Hadoop distributed file system (HDFS). Once the data is passed it is being processed by
all the nodes simultaneously this is for better performance and it can reduce a lot of time
depending on how big the data is. The Map Reduce save the location of each data which is
being processed this is done because if there were any errors on a particular data set the
system will know where to look into and actions can be taken immediately. From the below
the data is transferred into three different nodes each has its own Map task a key and a value.
And then the data is shuffle or sorted as per the requirements which will also depends on the
type of the data. Once the data has been sorted the result will be transferred on to the output
system. Three different nodes each contain three different outputs, which is the reduced
format (Dean & Ghemawat, 2008a & b).
22
Figure 7: Map and Reduce Architectural Illustration
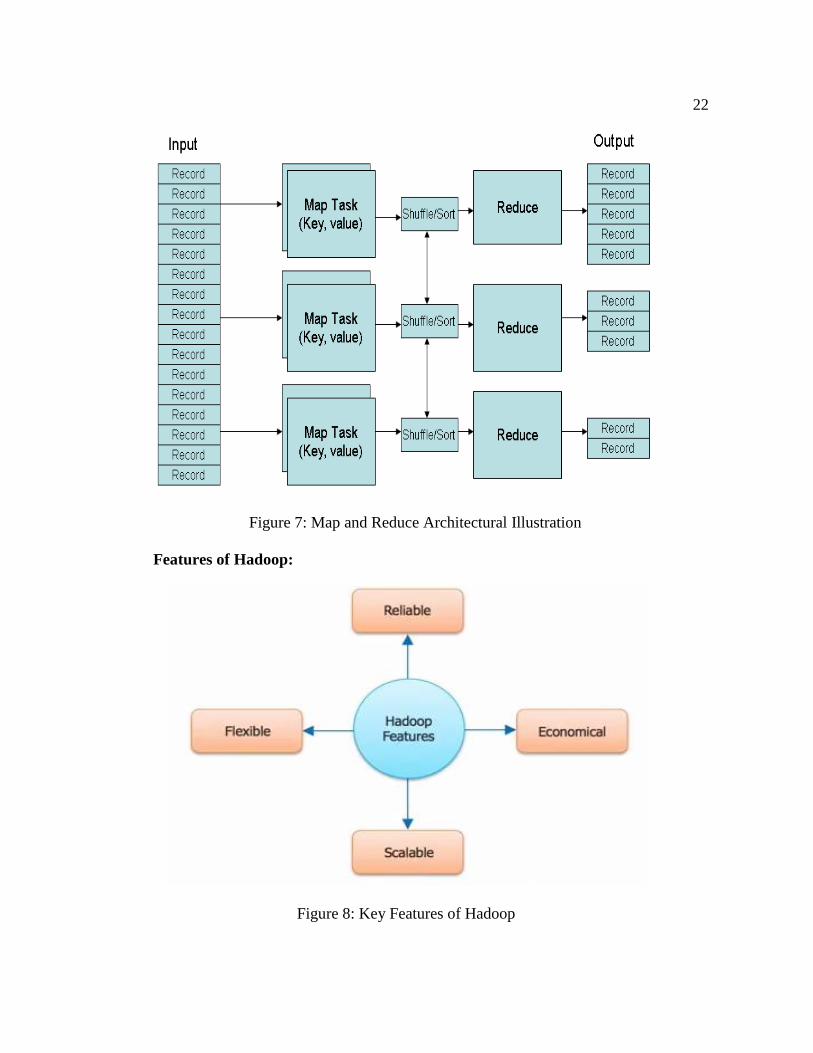
Features of Hadoop:
Figure 8: Key Features of Hadoop
23
Cost effective system: Hadoop does not require any expensive hardware; it can be
implemented by using a simple hardware. These hard ware components are
referred as commodity hardware Hadoop supports a large clusters of nodes
therefore a Hadoop cluster can be made of 100 of nodes. The advantage of having
large cluster is it offers more computing power and huge storage system to the
clients (Baldesehwieler, 2012).
Hadoop supports parallel processing of data: The data can be processed
simultaneously across all the nodes in the cluster and thus saving a lot of time.
Distributed data: The Hadoop framework takes care of splitting and distributing
the data across all the nodes with in a cluster it also replicates the data over the
entire cluster.
Automatic failover management: In case if any of the node within the cluster
fails the Hadoop framework would replace that particular machine with another
machine and it also replicates all the configuration settings and the data from the
failed machine.
Fault tolerance: This is considered as the key feature of Hadoop. When the data is
distributed across different nodes the data is replicated by default three times.
While in the event of failure a backup copy of the original data is always up to
date.
Accuracy: It is a known fact Hadoop distributes the data and maps them and all
the data processing tools are on the same server where the data is which results in
much faster data processing.
24
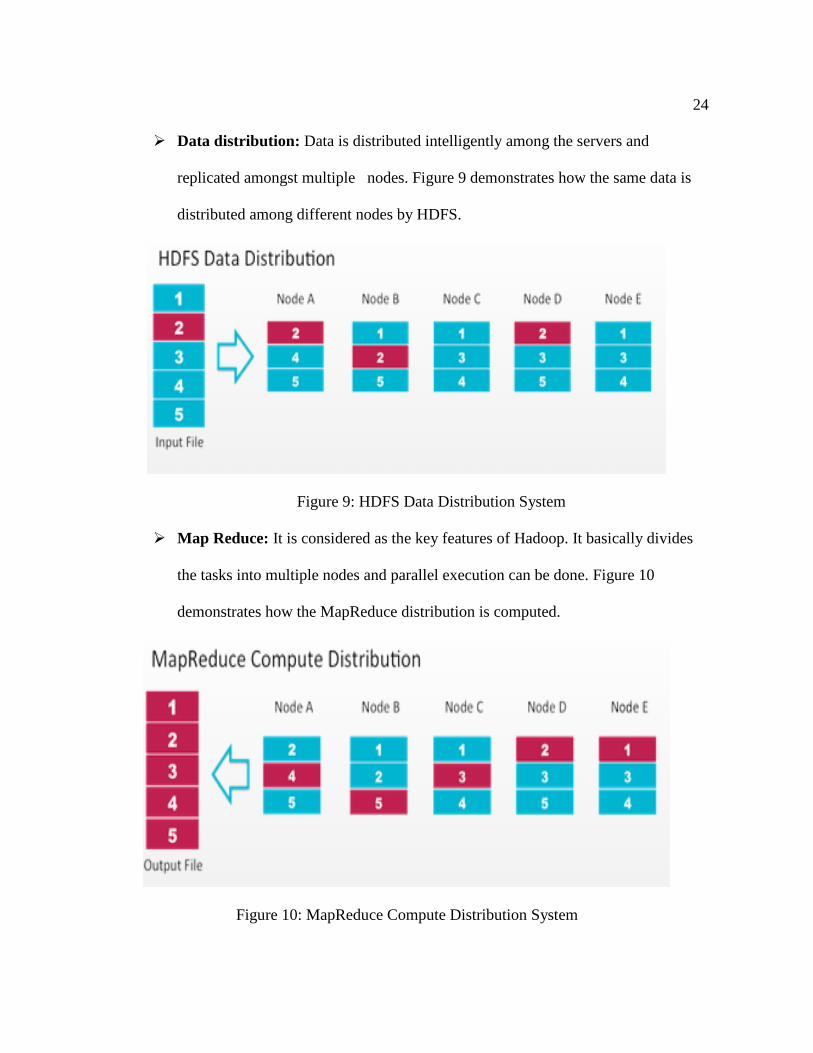
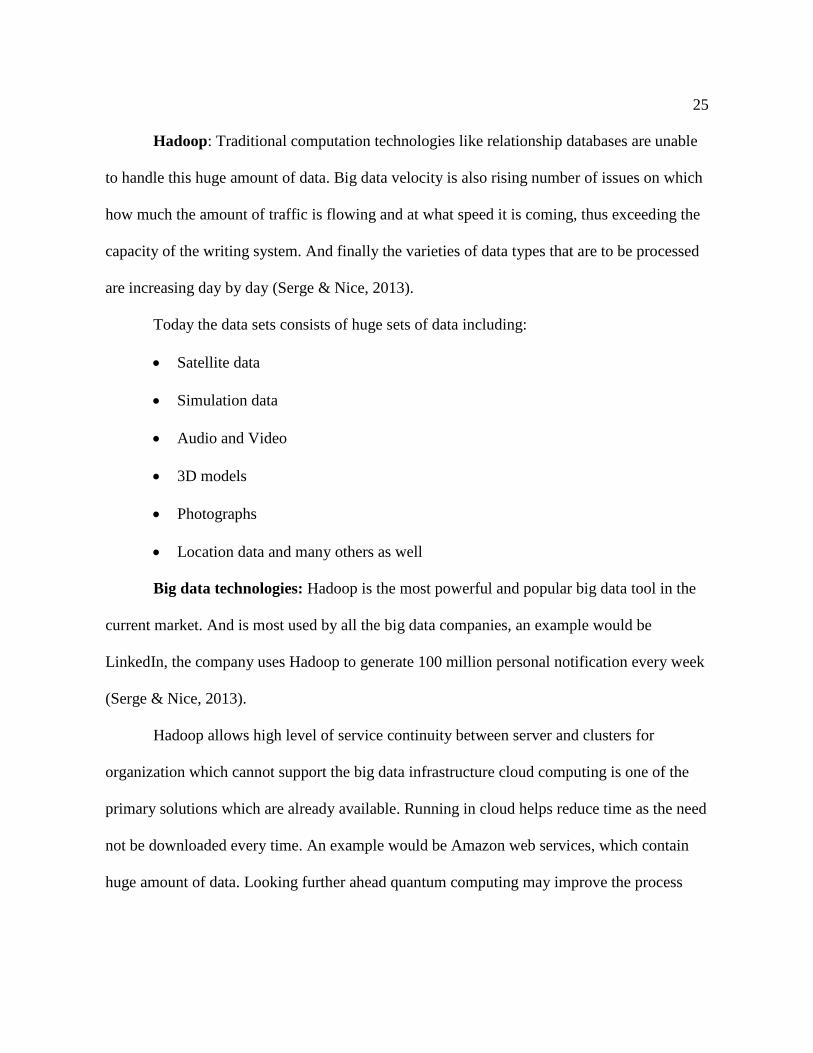
Data distribution: Data is distributed intelligently among the servers and
replicated amongst multiple nodes. Figure 9 demonstrates how the same data is
distributed among different nodes by HDFS.
Figure 9: HDFS Data Distribution System
Map Reduce: It is considered as the key features of Hadoop. It basically divides
the tasks into multiple nodes and parallel execution can be done. Figure 10
demonstrates how the MapReduce distribution is computed.
Figure 10: MapReduce Compute Distribution System
25
Hadoop: Traditional computation technologies like relationship databases are unable
to handle this huge amount of data. Big data velocity is also rising number of issues on which
how much the amount of traffic is flowing and at what speed it is coming, thus exceeding the
capacity of the writing system. And finally the varieties of data types that are to be processed
are increasing day by day (Serge & Nice, 2013).
Today the data sets consists of huge sets of data including:
Satellite data
Simulation data
Audio and Video
3D models
Photographs
Location data and many others as well
Big data technologies: Hadoop is the most powerful and popular big data tool in the
current market. And is most used by all the big data companies, an example would be
LinkedIn, the company uses Hadoop to generate 100 million personal notification every week
(Serge & Nice, 2013).
Hadoop allows high level of service continuity between server and clusters for
organization which cannot support the big data infrastructure cloud computing is one of the
primary solutions which are already available. Running in cloud helps reduce time as the need
not be downloaded every time. An example would be Amazon web services, which contain
huge amount of data. Looking further ahead quantum computing may improve the process
26
and analysis of big data. Quantum computers store and process data using quantum mechanics
states.
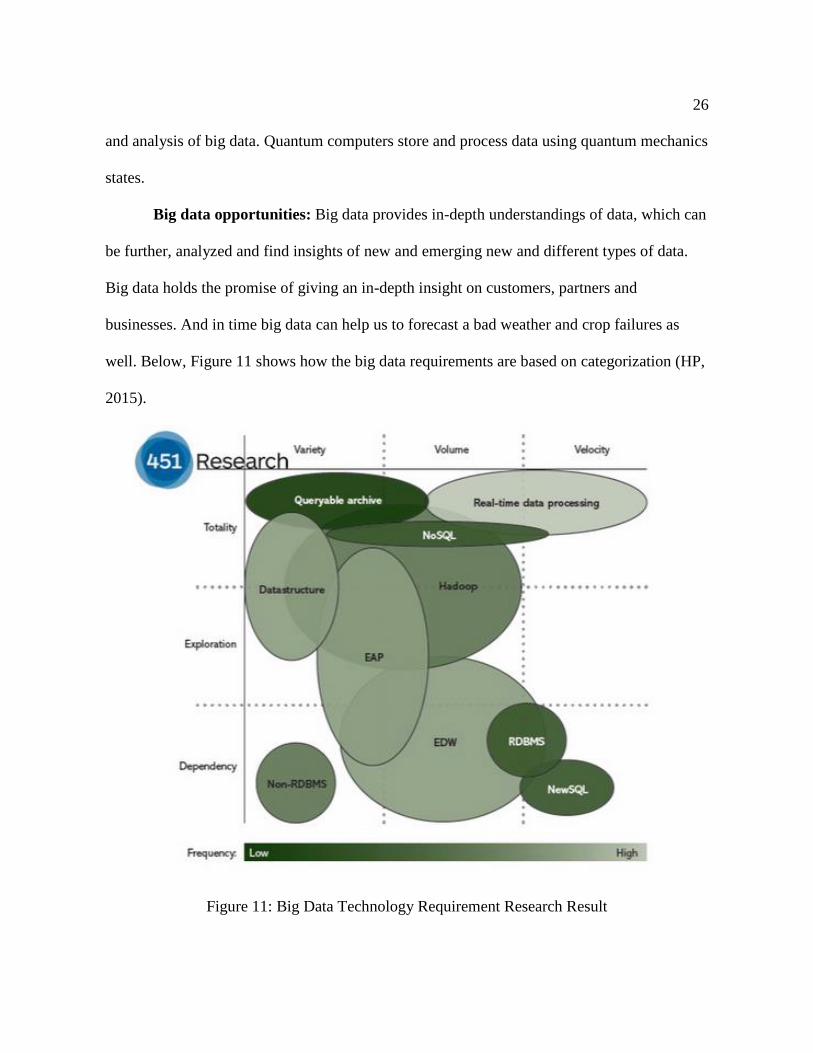
Big data opportunities: Big data provides in-depth understandings of data, which can
be further, analyzed and find insights of new and emerging new and different types of data.
Big data holds the promise of giving an in-depth insight on customers, partners and
businesses. And in time big data can help us to forecast a bad weather and crop failures as
well. Below, Figure 11 shows how the big data requirements are based on categorization (HP,
2015).
Figure 11: Big Data Technology Requirement Research Result
27
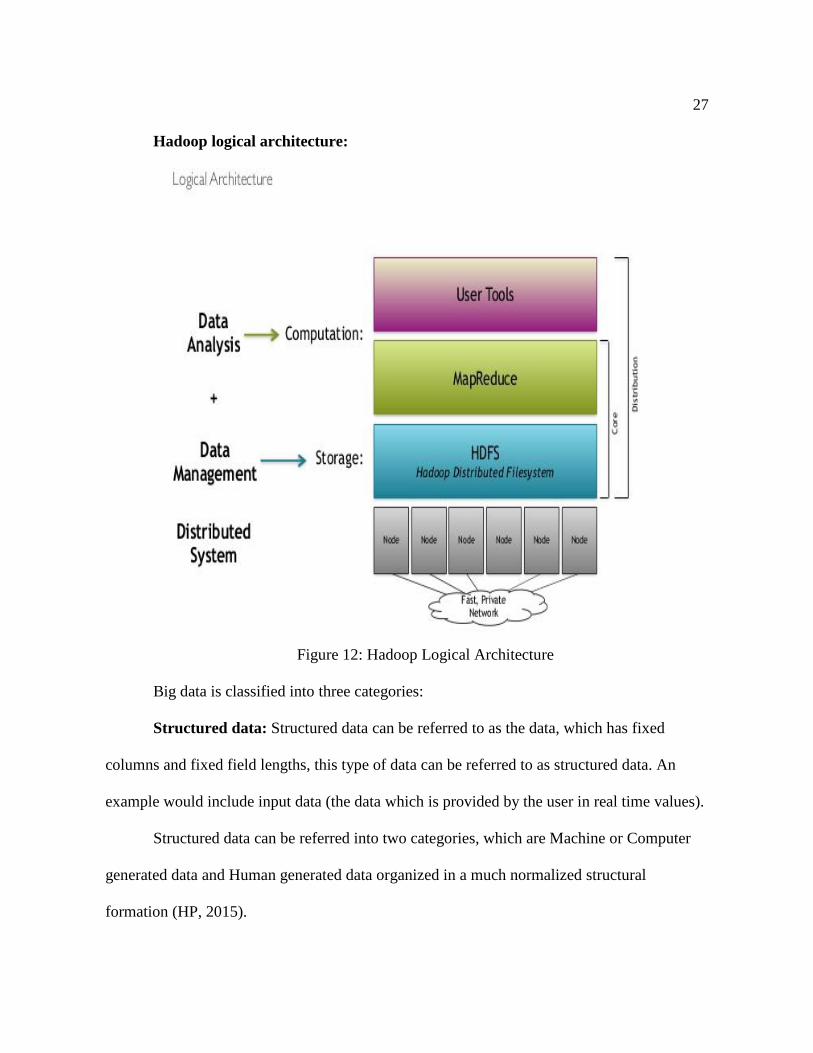
Hadoop logical architecture:
Figure 12: Hadoop Logical Architecture
Big data is classified into three categories:
Structured data: Structured data can be referred to as the data, which has fixed
columns and fixed field lengths, this type of data can be referred to as structured data. An
example would include input data (the data which is provided by the user in real time values).
Structured data can be referred into two categories, which are Machine or Computer
generated data and Human generated data organized in a much normalized structural
formation (HP, 2015).
28
Machine generated data: The data, which is automatically recorded by a machine,
are referred to as machine data. For example a GPS device gathering data, satellite recording
information, temperature and sensor recordings, web data (i.e., how many pages did the user
view in a particular website), a weather reading and recording and more. These are machine
generated structured data which can be used for further analysis involving predictive analysis
as well. These types of data grow more each and every single data, thus resulting in huge
volumes of structured big data.
Human generated data: Unlike machine-generated data, it involves more with
human options. For instance, a person buying or selling products in a popular website, bank
deposits, transactions. A most common example would be tweet on twitter which is simply
about 200 bytes of data approximately and now the company is processing about 300 million
tweets per day which is about (200 * 300= 60000) that means 60 gigabytes of data per single
day and this type of data cannot be recorded on a small device such a mobile phone. And
analyzing this data will result in big data (Apache, 2009).
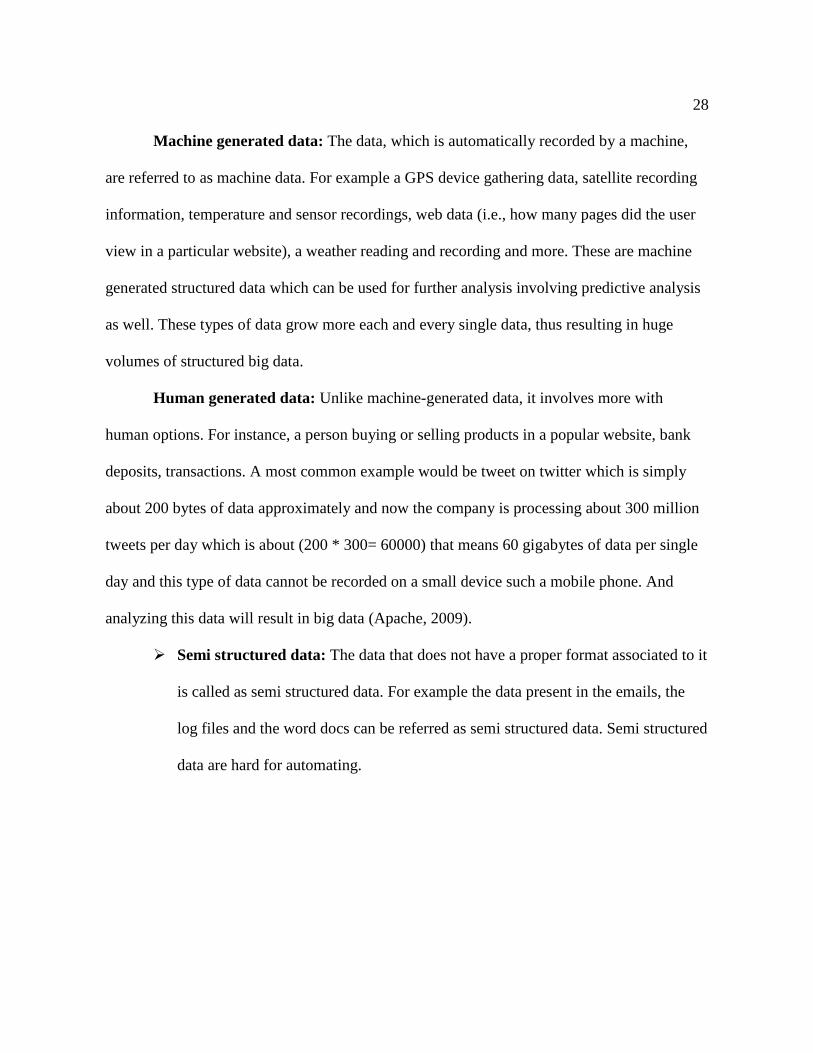
Semi structured data: The data that does not have a proper format associated to it
is called as semi structured data. For example the data present in the emails, the
log files and the word docs can be referred as semi structured data. Semi structured
data are hard for automating.
29
Figure 13: Automated Data Collection Types
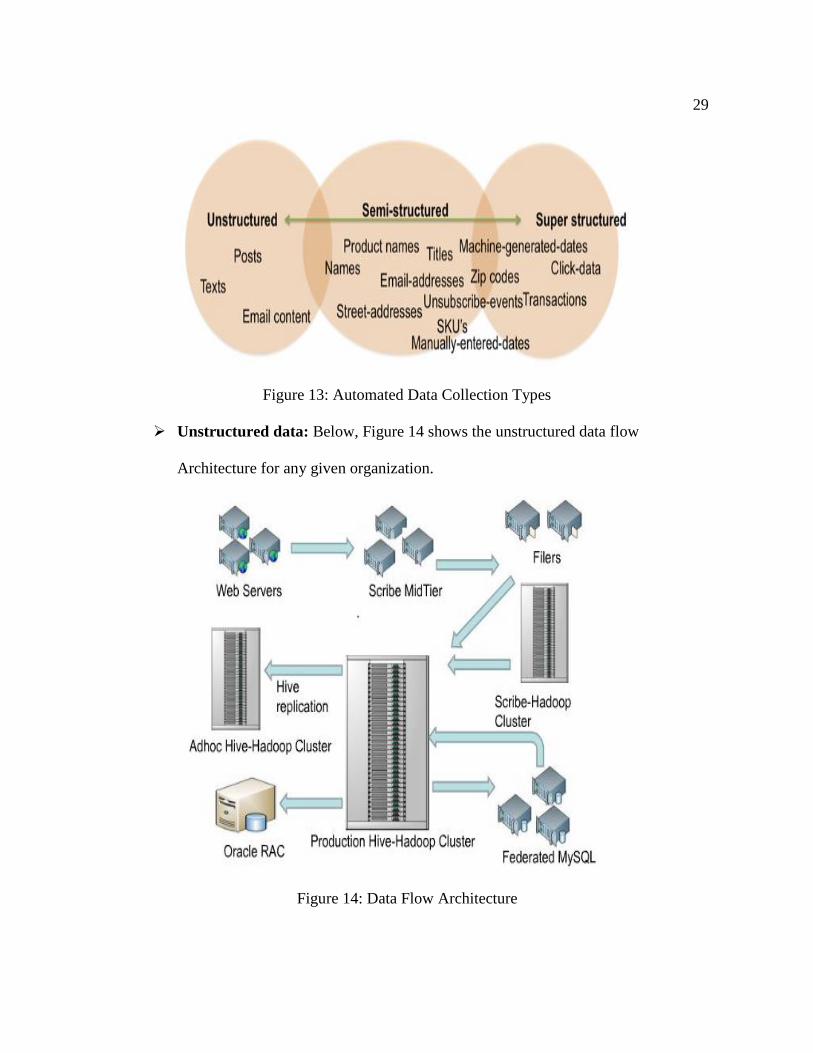
Unstructured data: Below, Figure 14 shows the unstructured data flow
Architecture for any given organization.
Figure 14: Data Flow Architecture
30
The data that does not have any format associated to it for examples image file, audio
files, and video files.
Especially with aircrafts while they are flying they keep transmitting data to the air
traffic control, which is located at the airport. The air traffic control uses this data to track and
monitor the status and process of the flight on the real time basis. Since multiple aircrafts are
would be transmitting this data simultaneously a huge volume of data is accumulated within a
short span of time. As a reason the data gathered is considered as a challenging task to store
and process this data using the traditional approach. Hence we can term this huge volume of
data as big data (Apache, 2009).
Social networking sites like Facebook, Twitter, YouTube generates huge volume of
data, as the number of users keep growing on these sites storing and processing of this data
becoming a challenging task. Since this data holds a lot of valuable information this data
needs to be processed in a short period of time (Serge & Nice, 2013).
The unstructured data from the web, social media and from other public channels and
the structured data that runs the transactions, client information and others, thus together we
can notice that the content from both unstructured data and structured data with hidden values.
Social data includes unstructured data from websites, social medians such as
Facebook, twitter, LinkedIn, etc.; and other social media content as well. And the enterprise
data includes structured enterprise contents which include and that runs businesses such as
Client, trade financial transactions and all other. Together both of these form our Big Data,
which has Unstructured/structured data content with hidden values.

31
Summary
This chapter discussed about the Hadoop implementation in the project with its
features and advantages listed and also literature related to methodology. The next chapter
will explain about the methodology used to the conduct the project research in detail.
32
Chapter 3: Methodology
Introduction
This chapter discusses the methodology used to conduct the project; the data
collection process and various tools are listed. The time line involved to conduct the entire
project is also specified.
Design of the Study
A tactical organized approach is a key for any quality-based ventures. Define-
Measure-Analyze-Improve-Control methodology was an appropriate route for the successful
implementation of this Hadoop framework. Following steps was followed throughout the
implementation:
Define: In this initial stage definition, statistics and critical information were already
illustrated within project charter document. Definition of the customers, the substantial
process productivities, the goals of the process subject to DMAIC, project targets and project
scope were documented too.
Objective: The main objective of this step includes:
It outlines the project requirements.
The scope of the project.
Customer needs are in parallel with the project goals.
Budget allocated to the project.
Development team takes the position as the project begins.
Measure: In this stage the appropriateness was assessed for the planned metrics.
Quality data is always critical to the DMAIC process. Huge volume of data that is being
33
generated will be stored in HDFS. An evaluation of the data with respect to defined metrics
will be determined for accuracy. A customized higher-level process flow baseline was
designed.
Objective: The main objective of this step includes:
Collect reliable data in order to compare feature goals/results.
To design and implement a detailed map for the business process.
And to enhance possible areas of performance.
Analyze: In this stage defects were detected, validated and selected for eliminating the
root cause. The huge volume of data that was being generated and processed by using MAP
REDUCE to extract the useful information. All possible causes of the problem are listed and
prioritized to follow resolution step. Itemized methodology maps will be made to help
pinpoint where root cause resides.
Objective: The main objective of this step includes:
To analyze the root cause for any defects or failures.
An analysis of the gathered data shows the areas which needs to be improved.
Improving the areas that may require attention.
Improve: In this stage creative arrangements were produced equally focusing on the
basic, simple and easier solutions. Test arrangements will be planned utilizing Plan-Do-
Check-Act (PDCA) cycle. PDCA results endeavor to suspect any avoidable risks connected
with the "improvement" utilizing Failure Mode and Effects Analysis (FMEA). A detailed
implementation plan will be designed and deployed.
34
Objective: The main objective of this step includes
Make a dry run and implement the changes required.
Finalizing the result.
Preforming feedback for the implementation and make some minor changes.
Control: In this stage the achievements were to be sustained. Documentation for
monitoring the process was produced and a proper response plan for any possible disaster will
be arranged.
Objective: The main objective of this step includes:
Develop metrics that helps to understand the success.
Make some strategies for continuing improvement.
New changes can be implemented along the ongoing process.
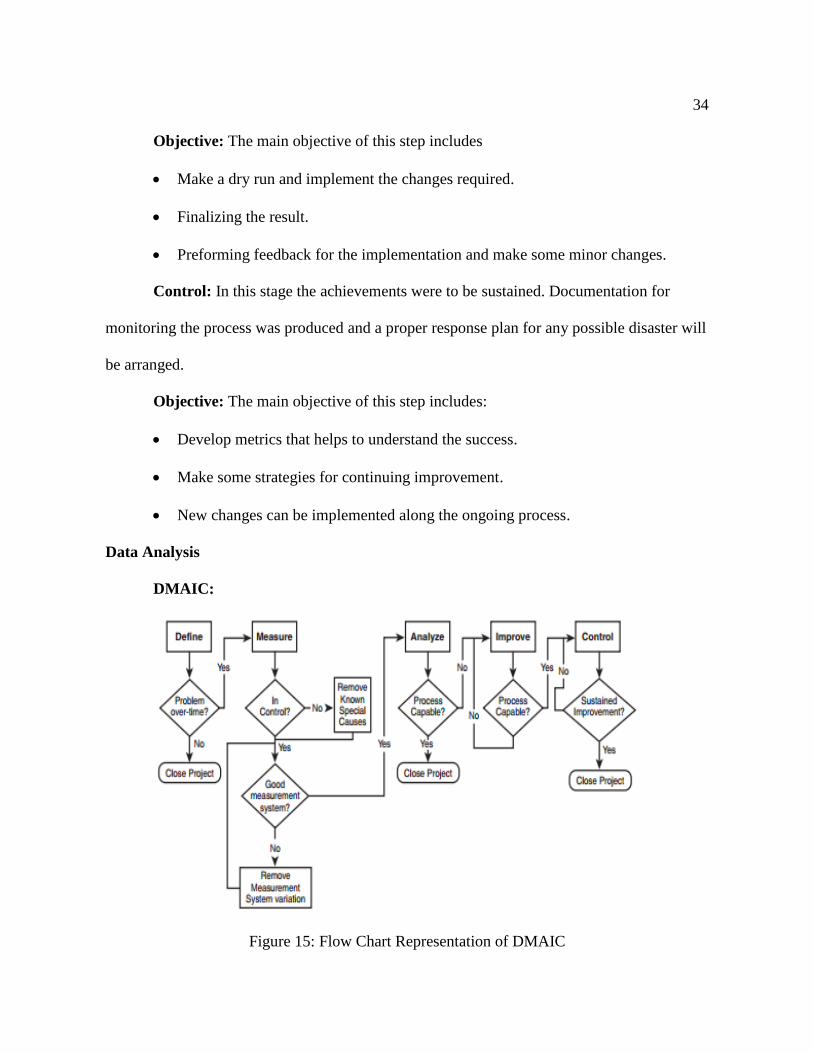
Data Analysis
DMAIC:
Figure 15: Flow Chart Representation of DMAIC
35
Extraction of the data from sources and load them in the form of schemas were done,
which involves intense data modeling. After the loading of data into unique tables they were
connected to each other relatively for the perfect flow of data. The huge volume of data that
generated was stored and processed by (Six Sigma, 2012):
HDFS
MAP REDUCE
HIVE
PIG
SQOOP
HBASE
YARN
Mahout
Cascading
Oozie
Avro
HBase
Twitter storm
Related technologies
For successful implementation of any project this is the most common and well known
methodology for any problem solving approach. This approach was applied to all the steady-
state, product based and service offering data. Variation or change has been the common
36
enemy to all the chosen process. Variations included defects, failures, excess amount of time
or any deviation from the required goal.
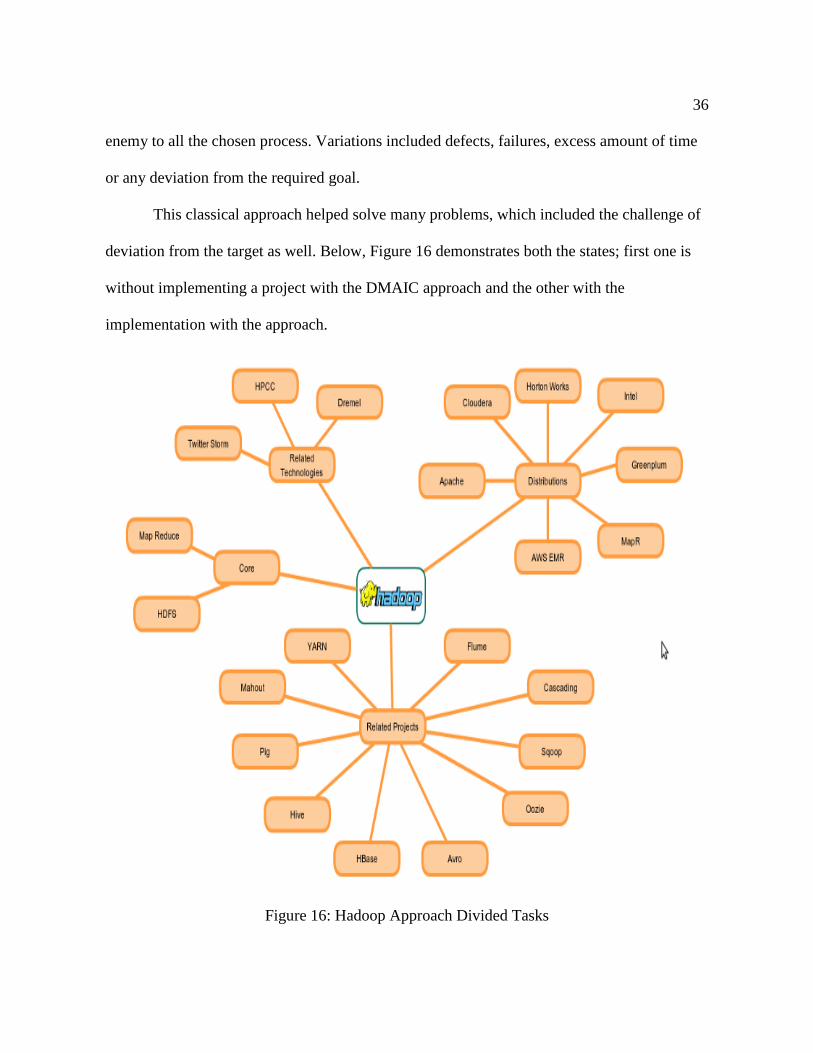
This classical approach helped solve many problems, which included the challenge of
deviation from the target as well. Below, Figure 16 demonstrates both the states; first one is
without implementing a project with the DMAIC approach and the other with the
implementation with the approach.
Figure 16: Hadoop Approach Divided Tasks
37
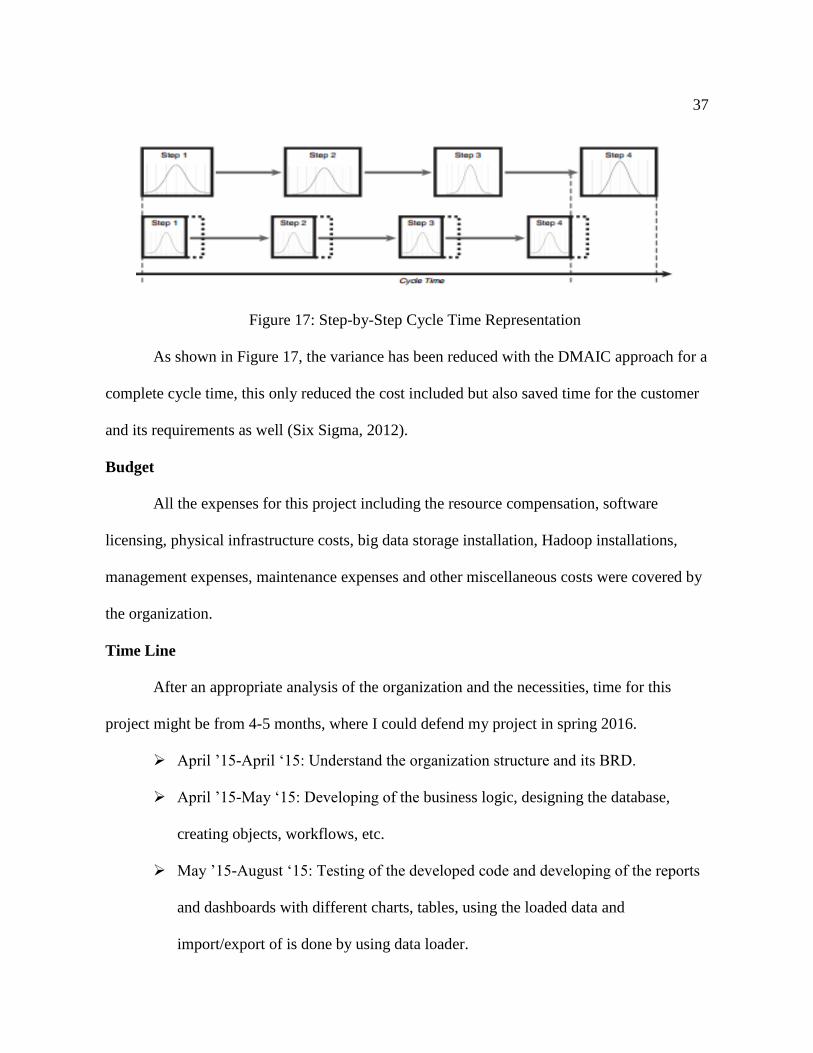
Figure 17: Step-by-Step Cycle Time Representation
As shown in Figure 17, the variance has been reduced with the DMAIC approach for a
complete cycle time, this only reduced the cost included but also saved time for the customer
and its requirements as well (Six Sigma, 2012).
Budget
All the expenses for this project including the resource compensation, software
licensing, physical infrastructure costs, big data storage installation, Hadoop installations,
management expenses, maintenance expenses and other miscellaneous costs were covered by
the organization.
Time Line
After an appropriate analysis of the organization and the necessities, time for this
project might be from 4-5 months, where I could defend my project in spring 2016.
April ’15-April ‘15: Understand the organization structure and its BRD.
April ’15-May ‘15: Developing of the business logic, designing the database,
creating objects, workflows, etc.
May ’15-August ‘15: Testing of the developed code and developing of the reports
and dashboards with different charts, tables, using the loaded data and
import/export of is done by using data loader.
38
January ’16-Febrauary’16: Documentation of the whole project.
March ’16: Final Defense.
Summary
This section of the study on methodology is completed by presenting the brief
description of the various processes and the steps involved in the methodology. The
comprehensive report on the collective techniques present in it and the strategy along with the
method are detailed in the above contents. In the next chapter of the report, the gathered
insights and the information would be analyzed and concluded.
39
Chapter 4: Data Presentation and Analysis
Introduction
This chapter illustrates on presentation and analysis of data for this project. It explains
in detail about data processing and process flow.
Data Presentation
Data processing in real time: The data processed in this project is completely
unstructured data from a sensory system and mapping system that downloads the data from
the server every second and has over a million customers accessing it. Over a traditional
system this would have taken a longer waiting time, which always resulted in delay and may
lead to miss information for the user’s end. This could have happened for many other reasons
either the server maybe busy or any kind of technical glitches caused by virus etc. It was a
disadvantage to use a traditional system, because huge amount of data requests received each
and every day where the system gets updated and there will not be any much of space left
after processing Tera bytes of data. With this type of unstructured data a traditional system
using relationship database tools could not handle the load from the servers and it has crashed
resulting in the loss of valuable data.
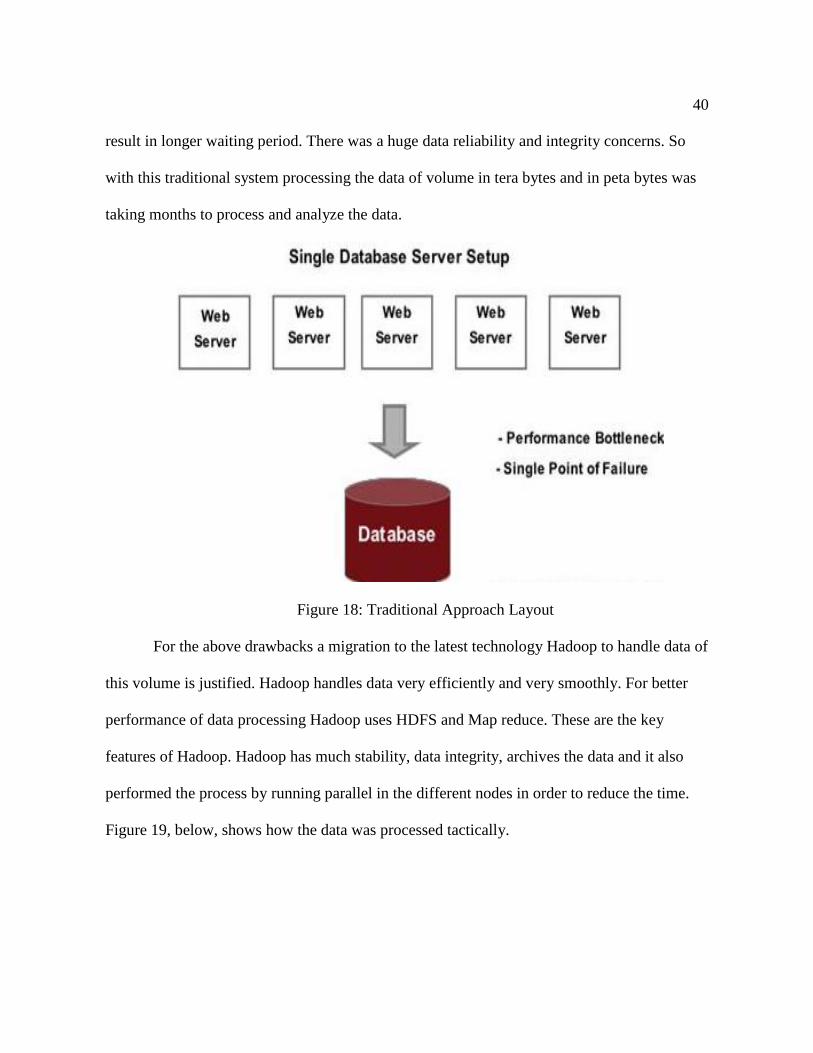
The diagram below, Figure 18, illustrates the traditional approach of several web
servers that is linked to a single database which cannot prevent any loss of data, security/data
Integrity and most importantly loss of time. The traditional database has a single database
server setup, which has many drawbacks. Drawbacks include no replication if the data that is
once the data is lost while a process is running there will be no backup of the data which can
be archived and it uses a single server to process the data and to analyze the data, which will
40
result in longer waiting period. There was a huge data reliability and integrity concerns. So
with this traditional system processing the data of volume in tera bytes and in peta bytes was
taking months to process and analyze the data.
Figure 18: Traditional Approach Layout
For the above drawbacks a migration to the latest technology Hadoop to handle data of
this volume is justified. Hadoop handles data very efficiently and very smoothly. For better
performance of data processing Hadoop uses HDFS and Map reduce. These are the key
features of Hadoop. Hadoop has much stability, data integrity, archives the data and it also
performed the process by running parallel in the different nodes in order to reduce the time.
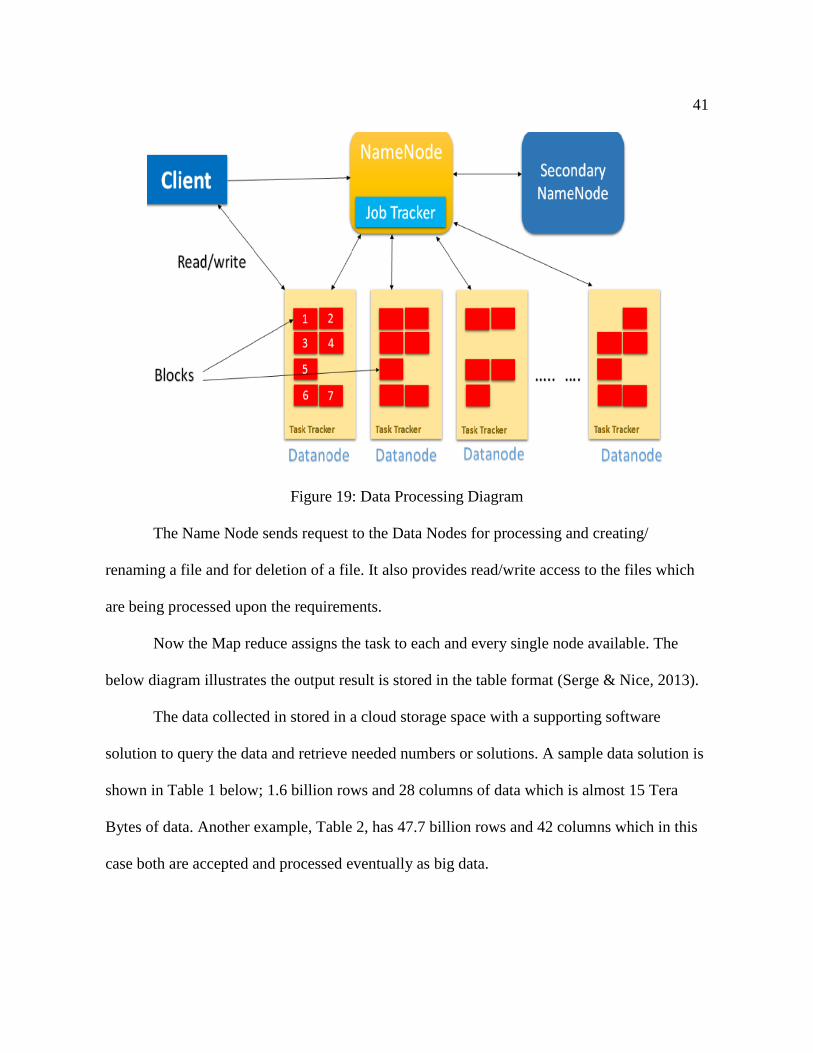
Figure 19, below, shows how the data was processed tactically.
41
Figure 19: Data Processing Diagram
The Name Node sends request to the Data Nodes for processing and creating/
renaming a file and for deletion of a file. It also provides read/write access to the files which
are being processed upon the requirements.
Now the Map reduce assigns the task to each and every single node available. The
below diagram illustrates the output result is stored in the table format (Serge & Nice, 2013).
The data collected in stored in a cloud storage space with a supporting software
solution to query the data and retrieve needed numbers or solutions. A sample data solution is
shown in Table 1 below; 1.6 billion rows and 28 columns of data which is almost 15 Tera
Bytes of data. Another example, Table 2, has 47.7 billion rows and 42 columns which in this
case both are accepted and processed eventually as big data.

42
Table 1: Sample Resultant Data
.
43
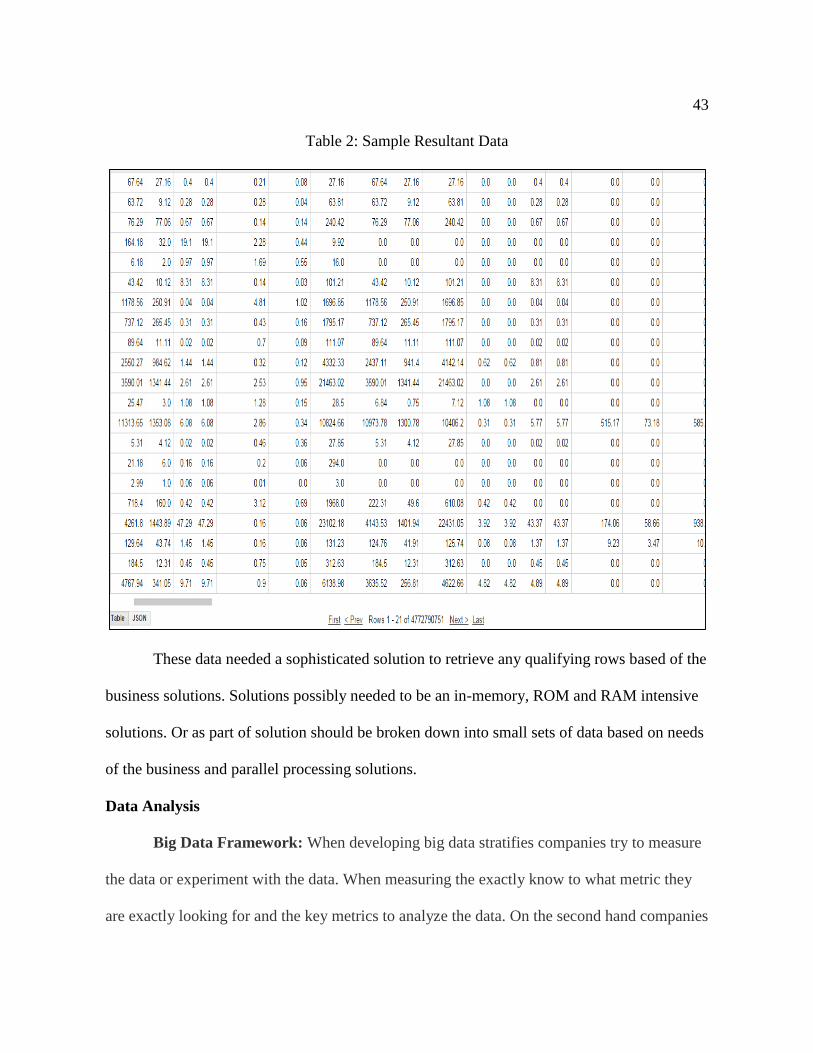
Table 2: Sample Resultant Data
These data needed a sophisticated solution to retrieve any qualifying rows based of the
business solutions. Solutions possibly needed to be an in-memory, ROM and RAM intensive
solutions. Or as part of solution should be broken down into small sets of data based on needs
of the business and parallel processing solutions.
Data Analysis
Big Data Framework: When developing big data stratifies companies try to measure
the data or experiment with the data. When measuring the exactly know to what metric they
are exactly looking for and the key metrics to analyze the data. On the second hand companies
44
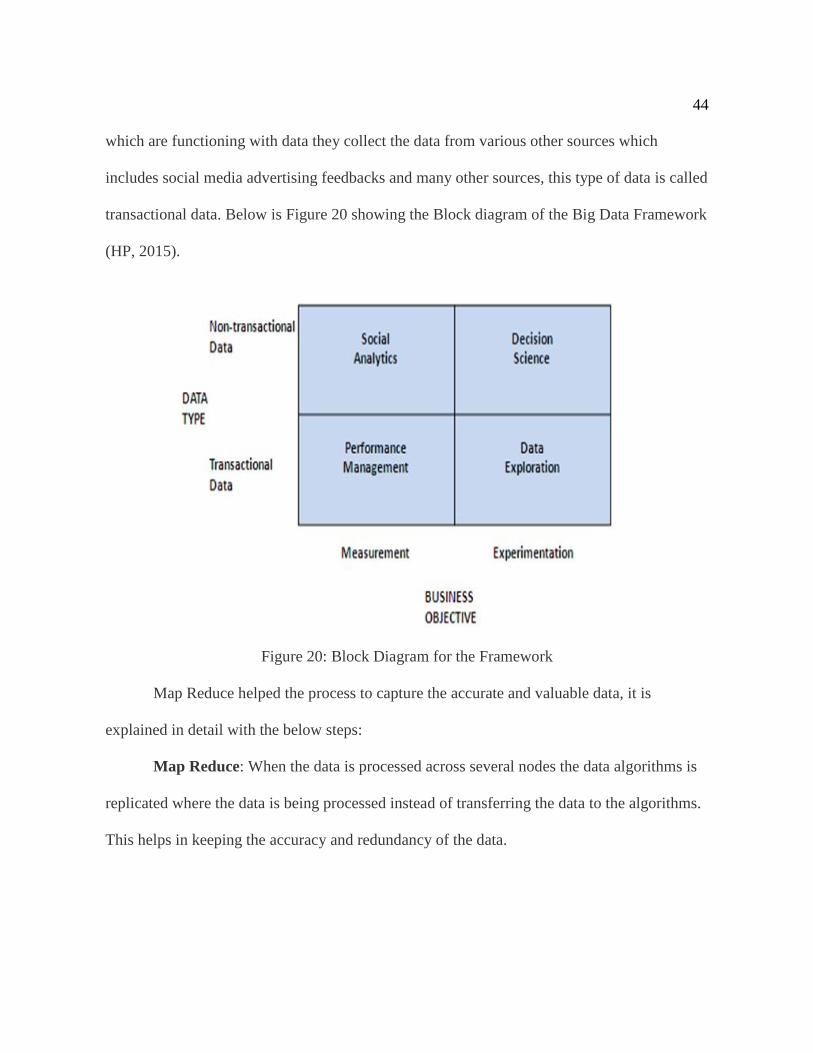
which are functioning with data they collect the data from various other sources which
includes social media advertising feedbacks and many other sources, this type of data is called
transactional data. Below is Figure 20 showing the Block diagram of the Big Data Framework
(HP, 2015).
Figure 20: Block Diagram for the Framework
Map Reduce helped the process to capture the accurate and valuable data, it is
explained in detail with the below steps:
Map Reduce: When the data is processed across several nodes the data algorithms is
replicated where the data is being processed instead of transferring the data to the algorithms.
This helps in keeping the accuracy and redundancy of the data.
45
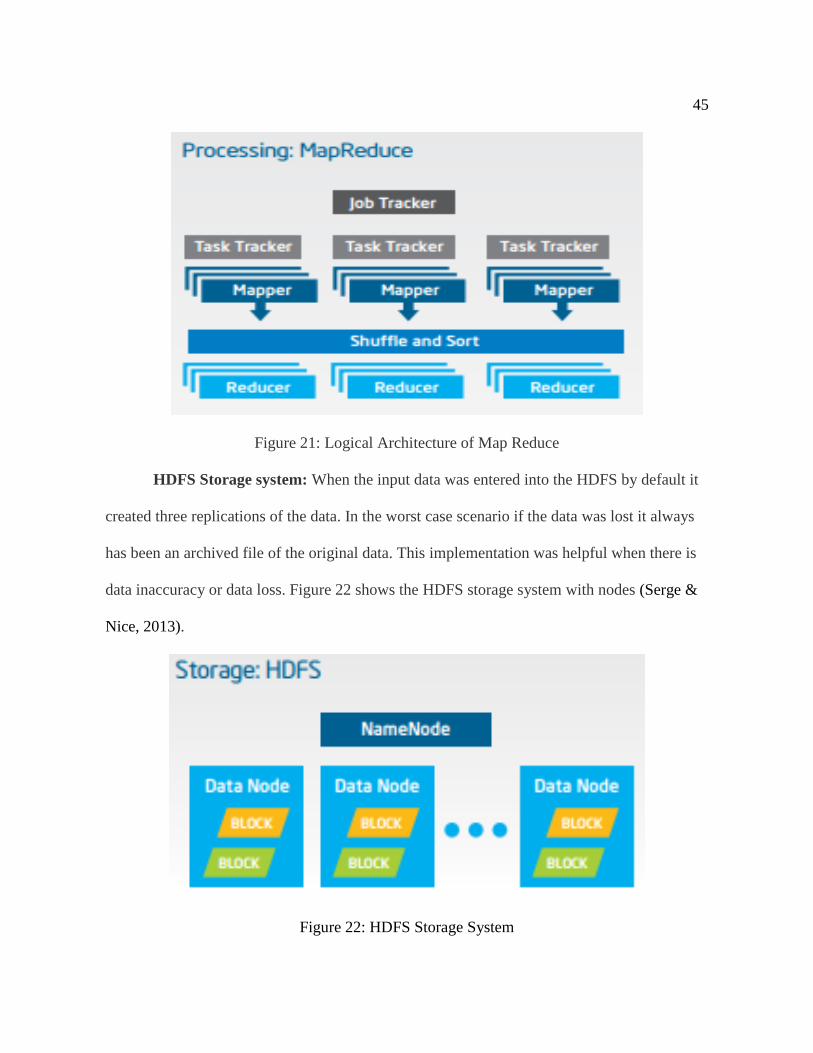
Figure 21: Logical Architecture of Map Reduce
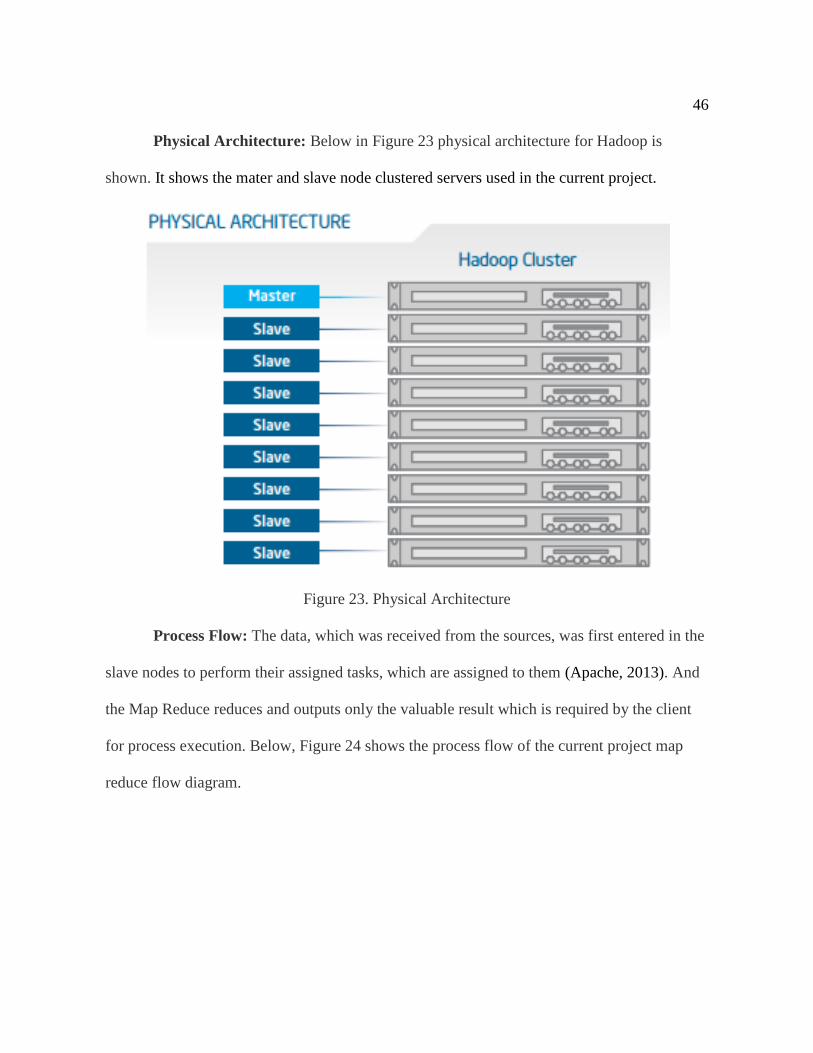
HDFS Storage system: When the input data was entered into the HDFS by default it
created three replications of the data. In the worst case scenario if the data was lost it always
has been an archived file of the original data. This implementation was helpful when there is
data inaccuracy or data loss. Figure 22 shows the HDFS storage system with nodes (Serge &
Nice, 2013).
Figure 22: HDFS Storage System
46
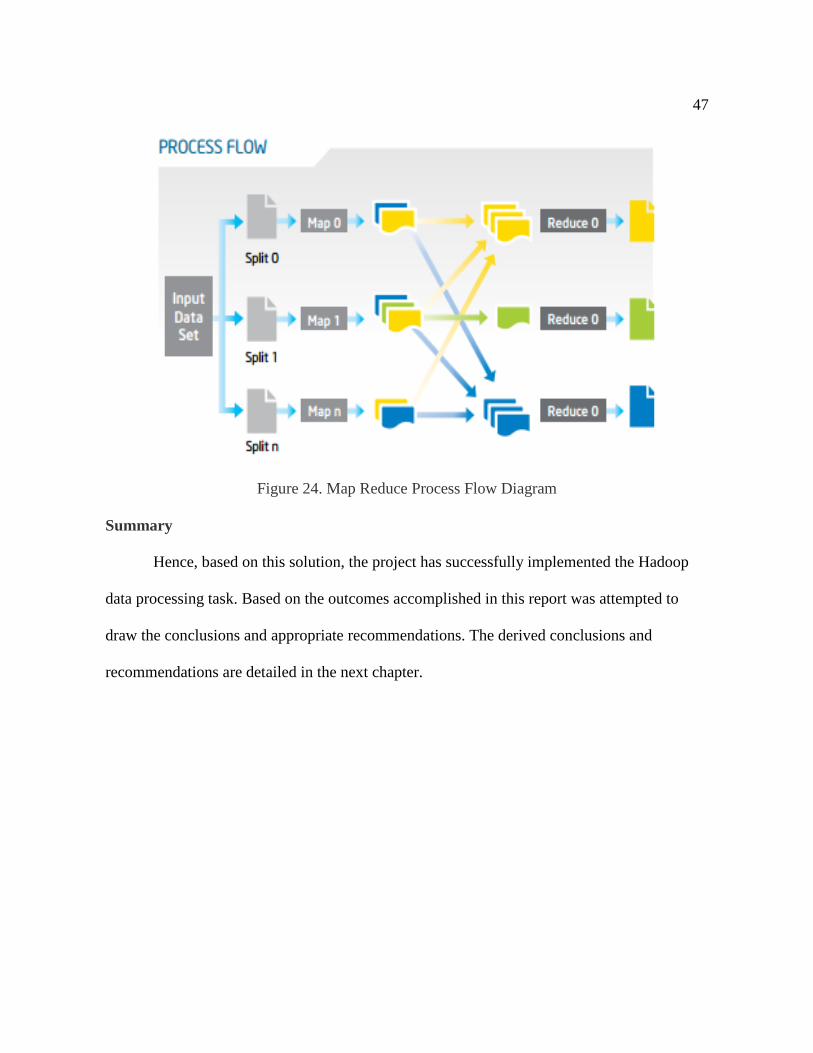
Physical Architecture: Below in Figure 23 physical architecture for Hadoop is
shown. It shows the mater and slave node clustered servers used in the current project.
Figure 23. Physical Architecture
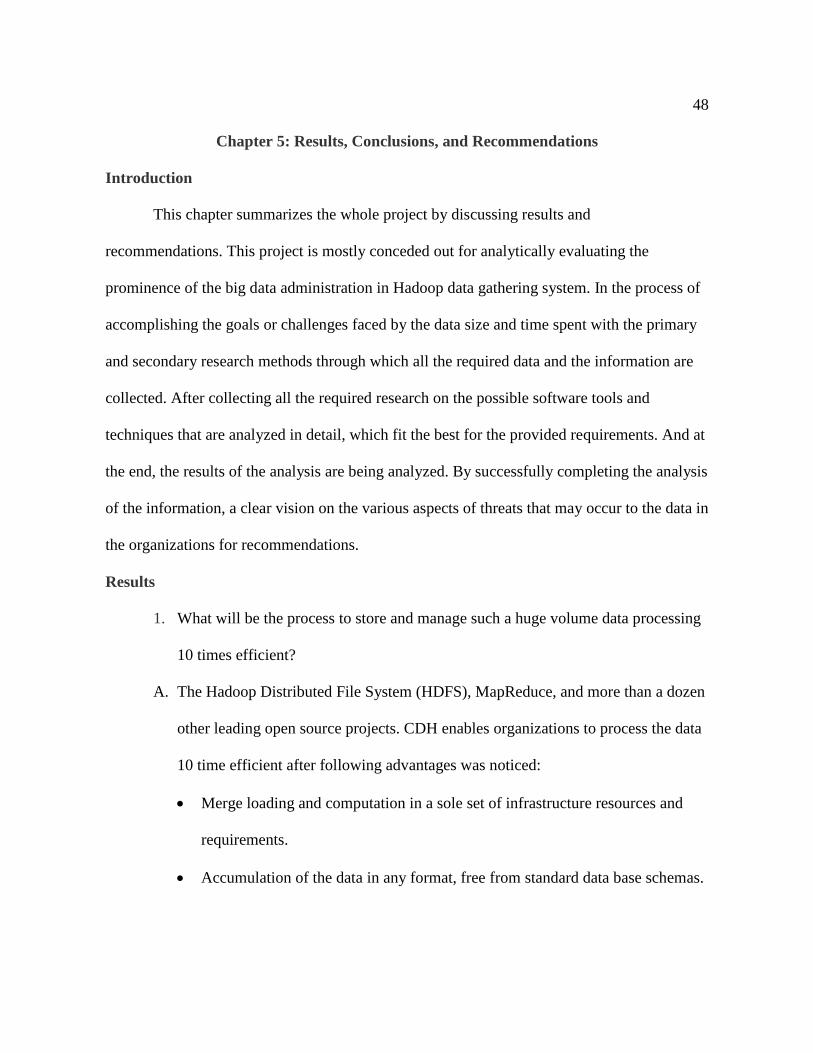
Process Flow: The data, which was received from the sources, was first entered in the
slave nodes to perform their assigned tasks, which are assigned to them (Apache, 2013). And
the Map Reduce reduces and outputs only the valuable result which is required by the client
for process execution. Below, Figure 24 shows the process flow of the current project map
reduce flow diagram.
47
Figure 24. Map Reduce Process Flow Diagram
Summary
Hence, based on this solution, the project has successfully implemented the Hadoop
data processing task. Based on the outcomes accomplished in this report was attempted to
draw the conclusions and appropriate recommendations. The derived conclusions and
recommendations are detailed in the next chapter.
48
Chapter 5: Results, Conclusions, and Recommendations
Introduction
This chapter summarizes the whole project by discussing results and
recommendations. This project is mostly conceded out for analytically evaluating the
prominence of the big data administration in Hadoop data gathering system. In the process of
accomplishing the goals or challenges faced by the data size and time spent with the primary
and secondary research methods through which all the required data and the information are
collected. After collecting all the required research on the possible software tools and
techniques that are analyzed in detail, which fit the best for the provided requirements. And at
the end, the results of the analysis are being analyzed. By successfully completing the analysis
of the information, a clear vision on the various aspects of threats that may occur to the data in
the organizations for recommendations.
Results
1. What will be the process to store and manage such a huge volume data processing
10 times efficient?
A. The Hadoop Distributed File System (HDFS), MapReduce, and more than a dozen
other leading open source projects. CDH enables organizations to process the data
10 time efficient after following advantages was noticed:
Merge loading and computation in a sole set of infrastructure resources and
requirements.
Accumulation of the data in any format, free from standard data base schemas.
49
The supple computational structures to a single set of the data, containing
parallel processing, SQL, interactive exploration and machine learning.
Incorporating the system with current data base management system.
Transform and load data in to real time to the consumers and any software
interfaces.
2. What will the architecture of processed and extracted valuable information be to
retrieve and store huge volume of data within a given time frame?
A. MapReduce assisted programmers resolve data-parallel complications for which
the huge data set was partitioned into small sets of processes and handled
individually. It was also a significant development since it consents conventional
programmers, not just the ones highly skilled with high performing calculation,
ETL processes to use parallel processing paradigms without any compound
particulars of intra-cluster nodes connected, task administration, and error
management.
The process and architecture also implemented the simplified solution all the
complications for the organization. The system and architecture splits the input big data into
multiple data sets, each of which was consigned a map assignment that can transform the data
in parallel.
Google big Query is the best tool to retrieve data faster that is based on cloud
computing systems. Which is really faster and easy to use with commonly used traditional
SQL knowledge to tackle and extract data.
50
Conclusion
In conclusion, the implementation of Hadoop has made the process flow of data and
application faster and in reduction of cost and time. It provides rich content of data on which
anyone can quickly build and modify easily. Hadoop methodology benefits both user and
clients as well. By using Hadoop complexity and data insecurity can be reduced to the
maximum. Hadoop as an open source has a fast growing projects of both users and
developers.
Recommendations
The successful implementation of the project has resolved the organization problems.
But the organization necessarily needed few recommendations for an effective maintenance
listed below.
1) The project of data which needs to be parallel processed has to be figured out by
understanding which ones are inter dependent. There are many jobs which needs a
pre-processing before any major transformation.
2) The tool communicating with the processed data is recommended by have in
memory applications. To handle huge data sizes the applications are efficient to
communicate when it is in memory.
3) Also for handling the huge data sizes a better Random Access Memory (RAM)
and Read Only Memory (ROM) is recommended to be higher and should always
monitor the increasing data sizes and increase the RAM and ROM sizes
accordingly. As the performances of the data is directly proportionate to the RAM
and ROM sizes.

51
With the current architectural setup, organization answers the project questions raised
before the project initiated. Also resolves the issues faced with the old fashioned ETL
processes. The organization when following the above recommendations and periodically
monitoring the processes of the system is expected to function effectively and efficiently.
52
References
Abouzeid, A., Bajda-Pawlikowski, K., Abadi, D. J., Silberschatz, A., & Rasin, A. (2009).
HadoopDB: An architectural hybrid of Mapreduce and DBMS technologies for
analytical workloads.
Apache. (2009). Hadoop. Retrieved from http://hadoop.apache.org/.
Apache Software Foundation. (2013). NameNode and DataNodes. Retrieved from
https://hadoop.apache.org/docs/r1.2.1/hdfs_design.html#NameNode+and+DataNodes.
Baldeschwieler, E. (2012). Thinking about the HDFS vs. other storage technologies.
Retrieved from http://hortonworks.com/blog/thinking-about-the-hdfs-vs-other-storage-
technologies/.
Beyer, M. (2011, July 13). Gartner says solving ‘big data’ challenge involves more than just
managing volumes of data. Retrieved from http://www.gartner.com/newsroom/
id/1731916.
Dean, J., & Ghemawat, S. (2008a). MapReduce: A flexible data processing tool. Retrieved
from http://dl.acm.org/citation.cfm?doid=1629175.1629198.
Dean, J., & Ghemawat, S. (2008b). MapReduce: Simplified data processing on large clusters.
Retrieved from https://static.googleusercontent.com/media/research.google.com/en/us/
archive/mapreduce-osdi04.pdf.
HP. (2014). HP big data reference architecture with Hortonworks data platform for Apache
Hadoop. Retrieved from https://hortonworks.com/wp-content/uploads/2013/10/Big-
Data-Reference-Architecture_4AA5-6136ENW.pdf.

53
HP. (2015). HP big data reference architecture: A modern approach. Retrieved from
http://h20195.www2.hp.com/V2/getpdf.aspx/4AA5-6141ENW.pdf.
Serge, B., & Nice, S. (2013). Introduction to Hadoop, MapReduce and HDFS for big data
applications. Retrieved from http://www.snia.org/sites/default/education/tutorials/
2013/fall/BigData/SergeBazhievsky_Introduction_to_Hadoop_MapReduce_v2.pdf.
Six Sigma. (2012). Define-measure-analyze-improve-control (DMAIC). Retrieved from
https://goleansixsigma.com/wp-content/uploads/2012/02/DMAIC-The-5-Phases-of-
Lean-Six-Sigma-www.GoLeanSixSigma.com_.pdf.
White, T. (2015, March). Hadoop: The definitive guide (4th ed.). O’Reilly Media, Inc.