Process NMR Applications in the Refinery Utilization, Closed Loop...
58
Process NMR Associates Process NMR Applications in the Refinery Utilization, Closed Loop Control, and Value Added Statements Presented By John Edwards, PhD Process NMR Associates, LLC Danbury, Connecticut June 7, 2002 Delaware ACS Process Analytical Topical Group/SAS
Transcript of Process NMR Applications in the Refinery Utilization, Closed Loop...

Process NMR Associates
Process NMR Applications in the RefineryUtilization,
Closed Loop Control, and Value Added Statements
Presented ByJohn Edwards, PhD
Process NMR Associates, LLCDanbury, Connecticut
June 7, 2002Delaware ACS Process Analytical Topical Group/SAS

Process NMR Associates
Company: Process NMR Associates, LLC
Founded : 1997
Personnel: 2 Ph.D. Chemists
Background: Analytical and Process Spectroscopy in Petroleum and Petrochemical (Texaco Inc.)
Facilities: 2 Invensys 58 MHz Process MRA Units300 MHz NMR (Liquids)200 MHz NMR (Solids)
Business: Application Development for Invensys Process MRAAnalytical NMR Services for Commercial and AcademicCustomers

Process NMR Associates
Lab and On-Line InstallationsLab Installations
Planned Installations
Equilon, LATosco Trainer
BRC
Aramco FPCC
PDVSA Reliance
Motiva, Port ArthurFina, Port ArthurEquistar, CorpusValero, Corpus Pertamina
BP BASF
Petrochina
AGIP
On-Line Installation - Foods
Invensys Process NMR Installations
Shell
Tnuva
4/29/02
ORLERG
PNAInvensys
Process NMR Associates
Presentation Overview
• NMR Basics – Briefly
• Advantages/Disadvantages as a Process Spectroscopy
• Applications1. Reformer Unit Control2. Crude Distillation Unit Control and Optimization3. Naphtha Steam Cracking Control and Optimization
• Application Snippets
Aromaticity – FCC, Base Oil ManufactureStyrene-Butadiene RubbersAromatics
• Conclusion
Process NMR Associates

Process NMR Associates

Process NMR Associates
Process NMR Associates

Process NMR Associates
Why Shim?NMR Spectroscopy NMR Imaging (MRI)
N SH2O
H2OH2O
Bad Shim Inhomogeneous Field
FT
N SH2O
H2OH2O
Good Shim Homogeneous Field
FT
Bad Shim or 3 Different H-Types?
H2O Should Give OneResonance if Shim is Good
Example : H2O in Line Example : H2O in Human Body
H2O
H2OH2ON S
Head
Field LinesWith Different
Bo
FTComputer ObtainsSpatial Location of H2O in Head
Computer GeneratesImage Based onWater Location
In MRI Large Shimsare Utilized toDistort the MagneticField in a Known Manner in Order to Make the H2O Peak Position Spatially Dependent
Why Shim?NMR Spectroscopy NMR Imaging (MRI)
N SH2O
H2OH2ONN SSH2O
H2OH2O
Bad Shim Inhomogeneous Field
FT
N SH2O
H2OH2ONN SSH2O
H2OH2O
Good Shim Homogeneous Field
FT
Bad Shim or 3 Different H-Types?
H2O Should Give OneResonance if Shim is Good
Example : H2O in Line Example : H2O in Human Body
H2O
H2OH2ON S
Head
Field LinesWith Different
Bo
FTComputer ObtainsSpatial Location of H2O in Head
Computer GeneratesImage Based onWater Location
In MRI Large Shimsare Utilized toDistort the MagneticField in a Known Manner in Order to Make the H2O Peak Position Spatially Dependent

Process NMR Associates

Process NMR Associates
NMR Innovations Developed to Bring NMR On-Line
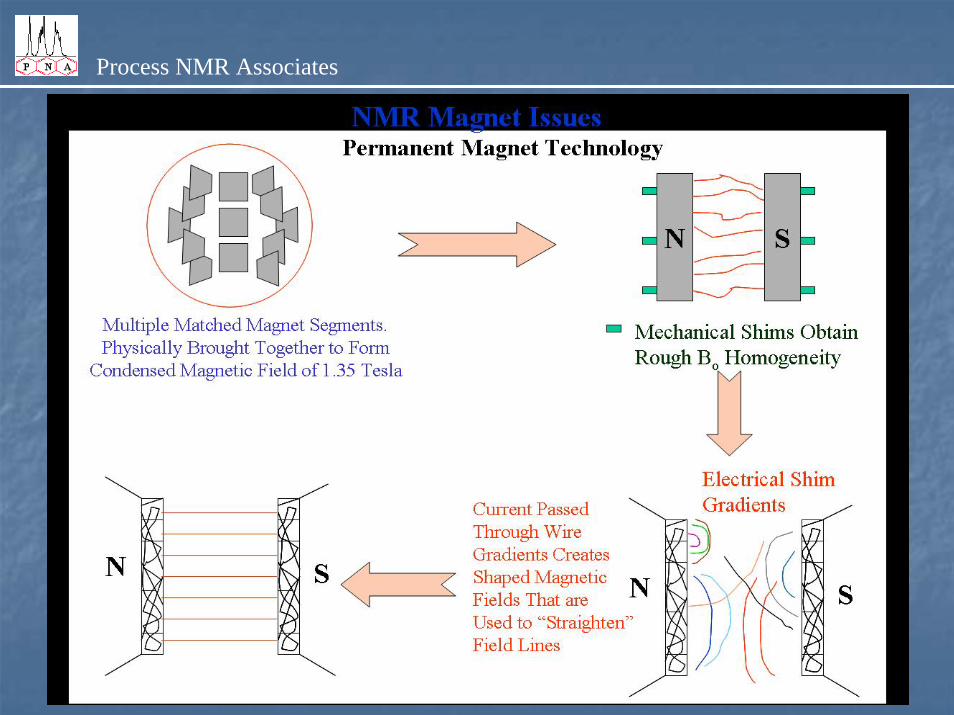
• Permanent Magnet Stability and Design
• Shimming Protocols
• Flow-Through Probe Technology
• Post Processing Developments
Robust auto-phasing routines
Frequency Domain Averaging
Post-processing monitoring of each constituent spectrumfor heavy stream analyses where sediment/rust may be present.
Process NMR Associates
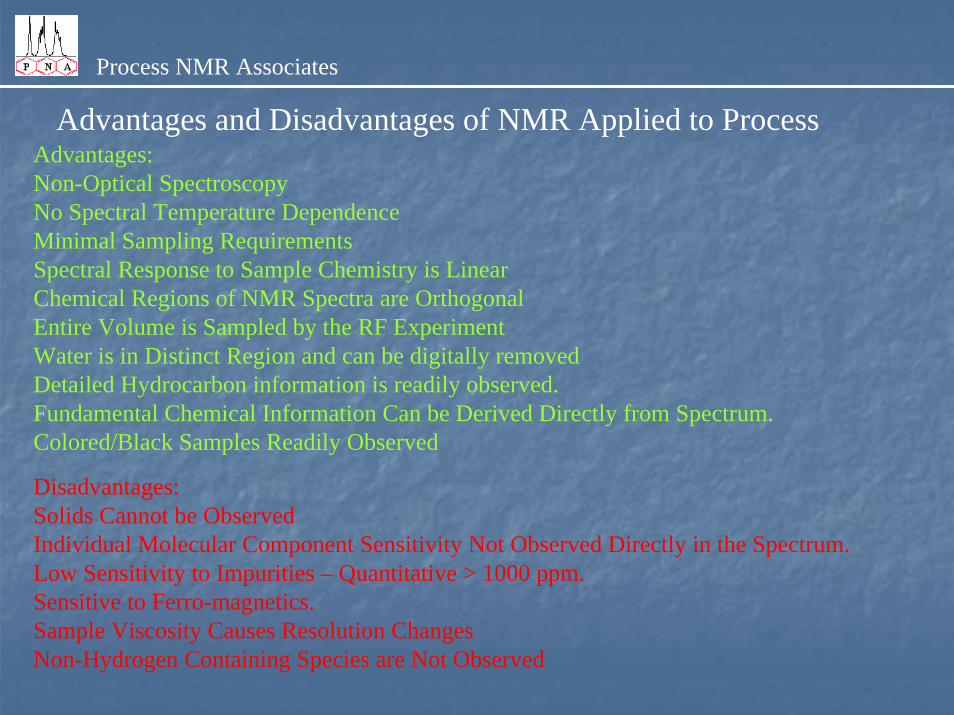
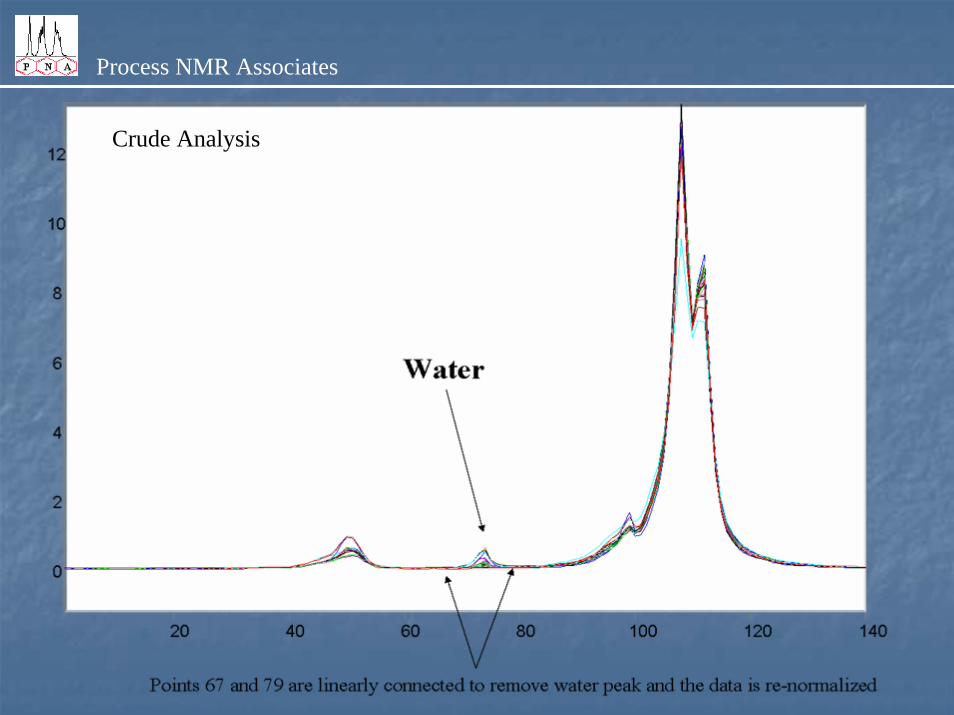
Advantages and Disadvantages of NMR Applied to ProcessAdvantages:Non-Optical SpectroscopyNo Spectral Temperature DependenceMinimal Sampling RequirementsSpectral Response to Sample Chemistry is LinearChemical Regions of NMR Spectra are OrthogonalEntire Volume is Sampled by the RF ExperimentWater is in Distinct Region and can be digitally removedDetailed Hydrocarbon information is readily observed.Fundamental Chemical Information Can be Derived Directly from Spectrum.Colored/Black Samples Readily Observed
Disadvantages:Solids Cannot be ObservedIndividual Molecular Component Sensitivity Not Observed Directly in the Spectrum.Low Sensitivity to Impurities – Quantitative > 1000 ppm.Sensitive to Ferro-magnetics.Sample Viscosity Causes Resolution ChangesNon-Hydrogen Containing Species are Not Observed
Process NMR Associates
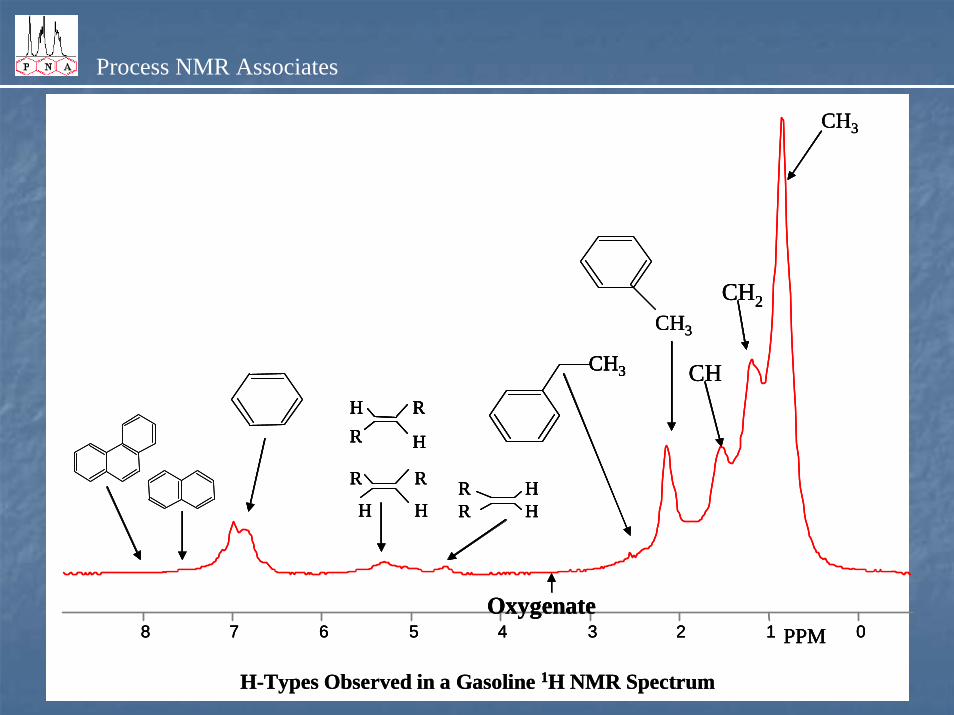
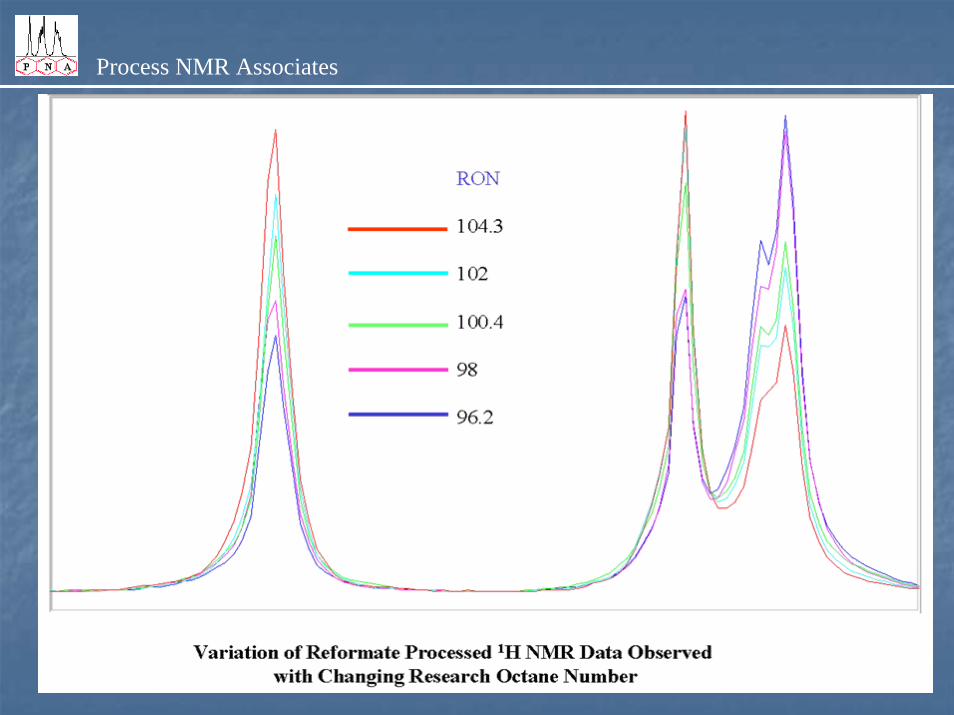
H-Types Observed in a Gasoline 1H NMR Spectrum
8 7 6 5 4 3 2 1 0
CH
RR
HH
R
H
R
H
R
H
HR
CH2CH3
CH3
CH3
PPMOxygenate
H-Types Observed in a Gasoline 1H NMR Spectrum
8 7 6 5 4 3 2 1 0
CH
RR
HH
R
H
R
H
R
H
HR
CH2CH3
CH3
CH3
PPMOxygenate
8 7 6 5 4 3 2 1 0
CH
RR
HH
RR
HH
R
H
R
H
R
H
HR
R
H
R
H
R
H
HR
R
H
HR
CH2CH3
CH3CH3
CH3
PPMOxygenate
Process NMR Associates
H2O

Process NMR Associates
Process NMR Associates
Application: Closed Loop Reformer Control
Reformer Capacity: 34,000 Barrels per Day
Control Strategy: Control on MON and Benzene Content
NMR Analysis: 2 Minute Analysis
NMR PLS Outputs: RONMONBenzeneTotal Aromatics
Value Added: Maximize Benzene Content of Reformate at 1 Wt%Conservatively 4 cents per Barrel (Can Be Much More)
Performance : NMR Available 98%+ For Past YearModels Unchanged for 2 YearsValue Gained From Control $10,000 - $35,000 / Week

Process NMR Associates
Process NMR Associates
Process NMR Associates

Process NMR Associates
Process NMR Associates
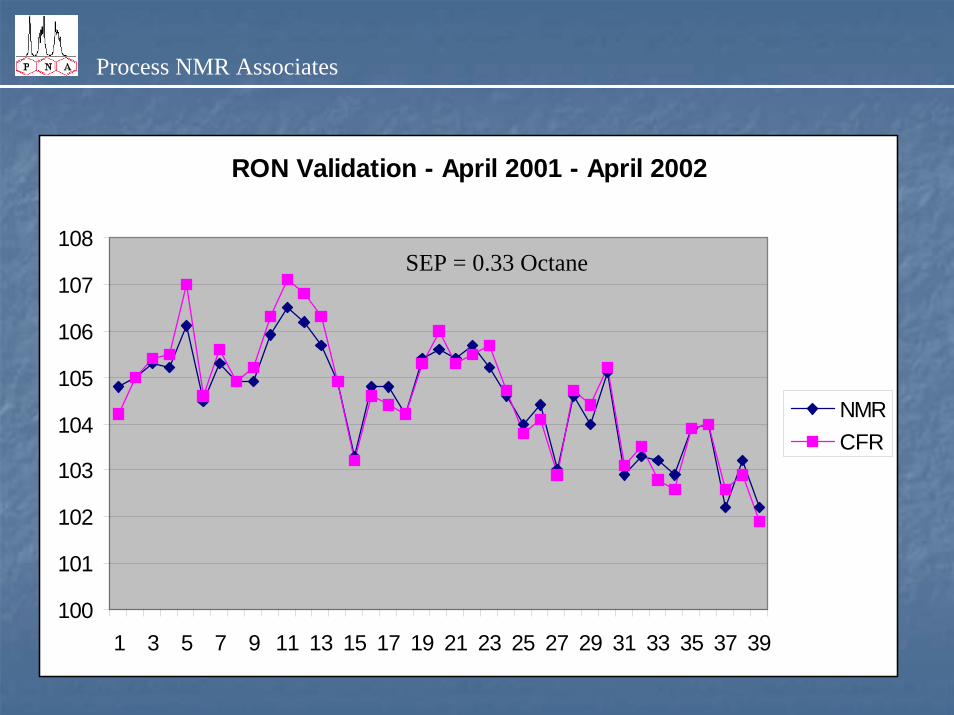
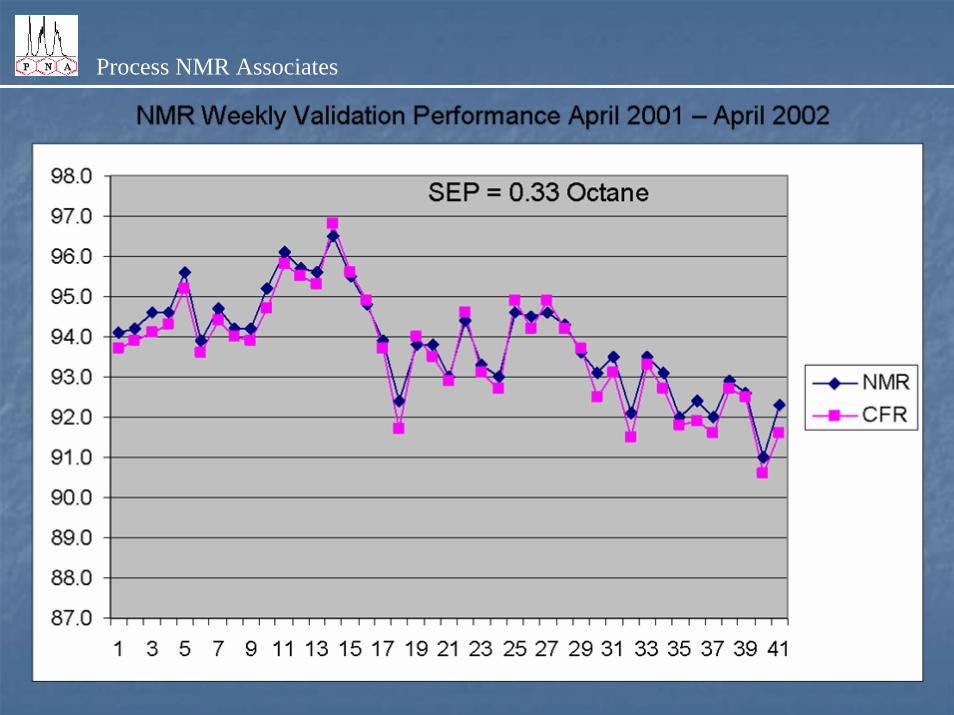
RON Validation - April 2001 - April 2002
100
101
102
103
104
105
106
107
108
1 3 5 7 9 11 13 15 17 19 21 23 25 27 29 31 33 35 37 39
NMRCFR
SEP = 0.33 Octane
Process NMR Associates

Process NMR Associates

Process NMR Associates

Process NMR Associates
Application: Crude Distillation Unit Optimization and Control
Crude Unit Capacity: 180,000 Barrels per Day
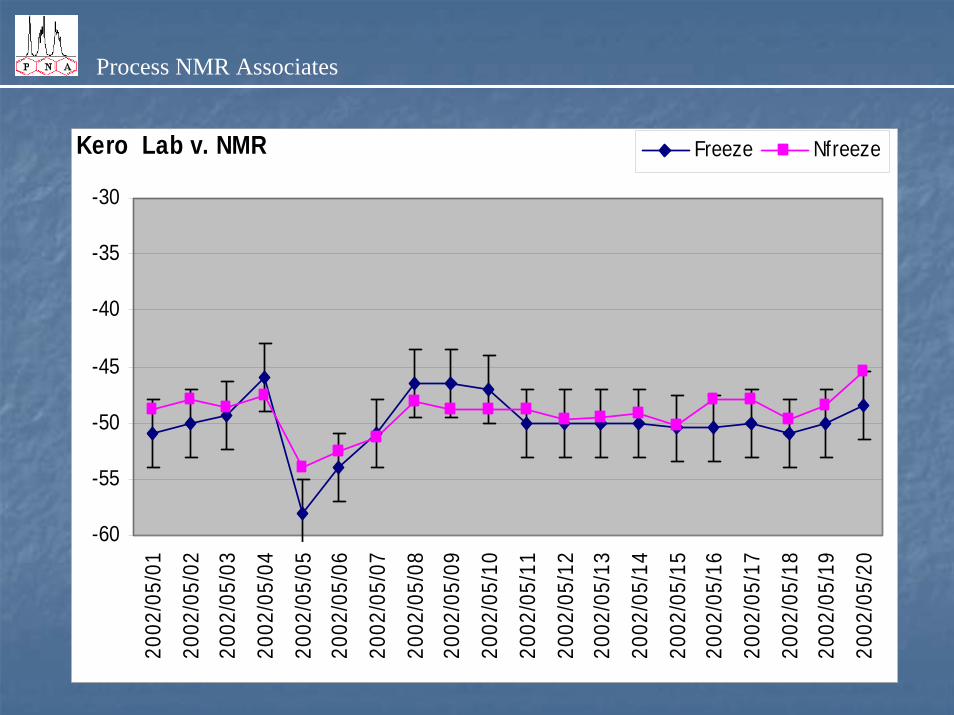
Control Strategy: Control on Kero Freeze PointCrude Tower Optimization
NMR Analysis: 15 Minute CycleNMR Results into ROMEO CDU Optimization Package
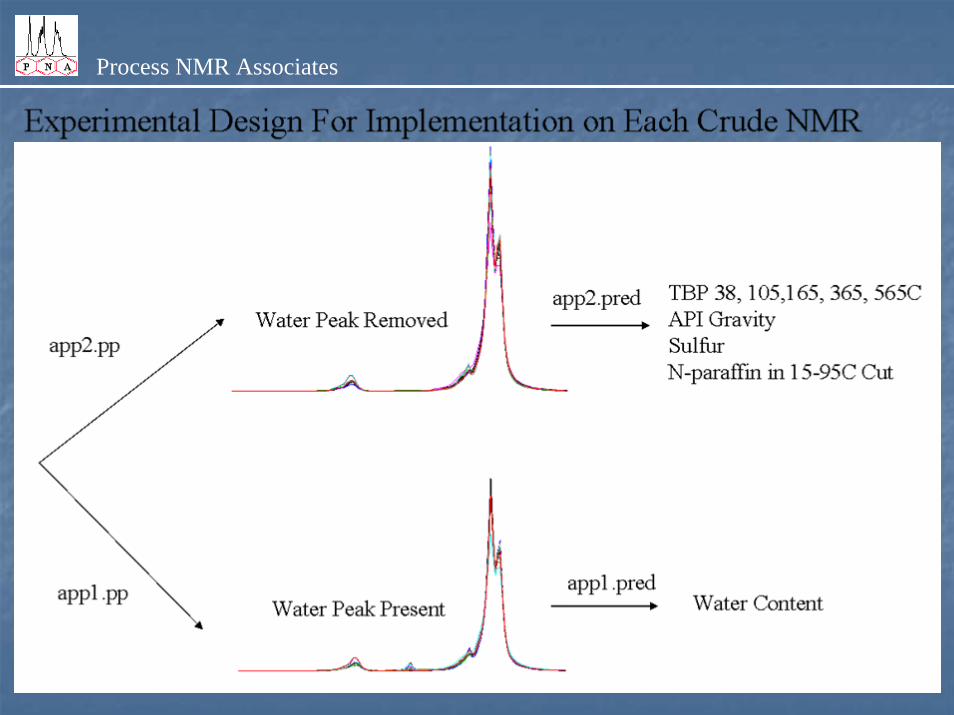
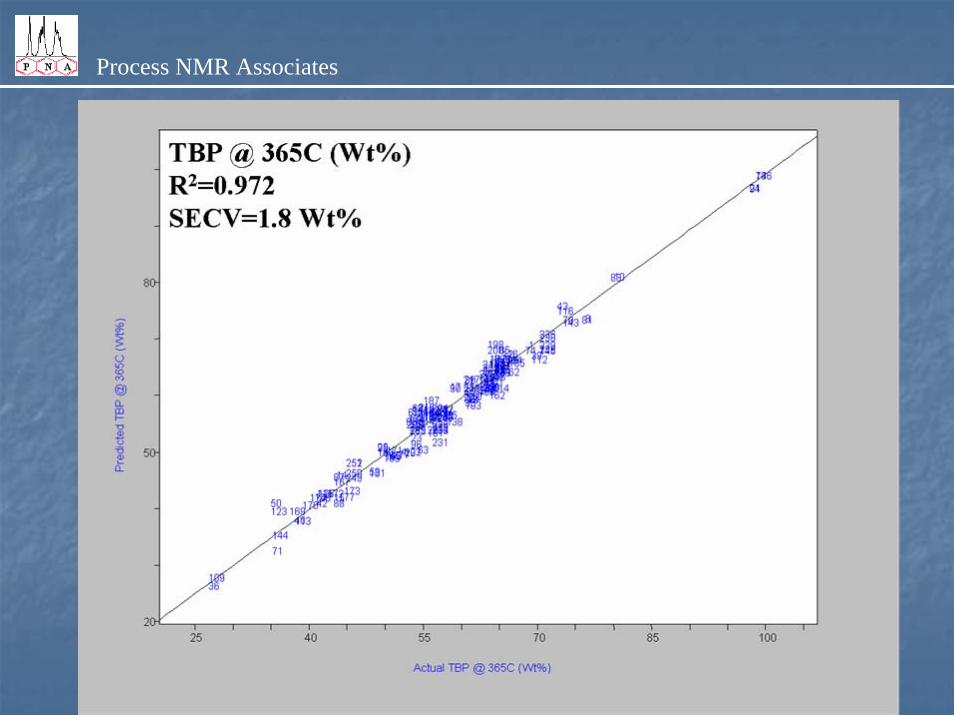
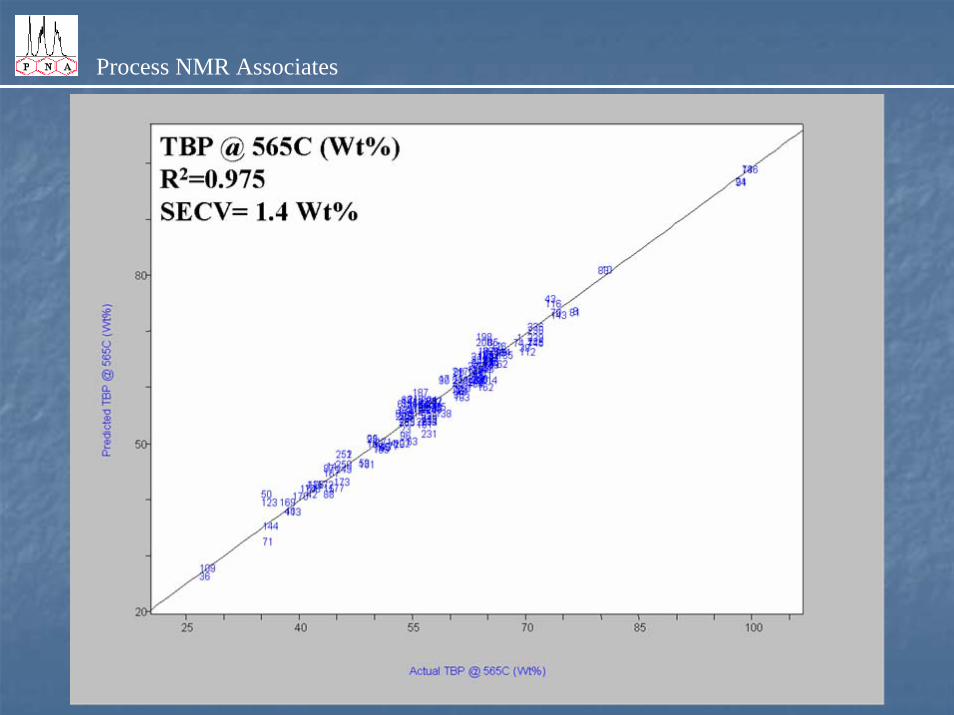
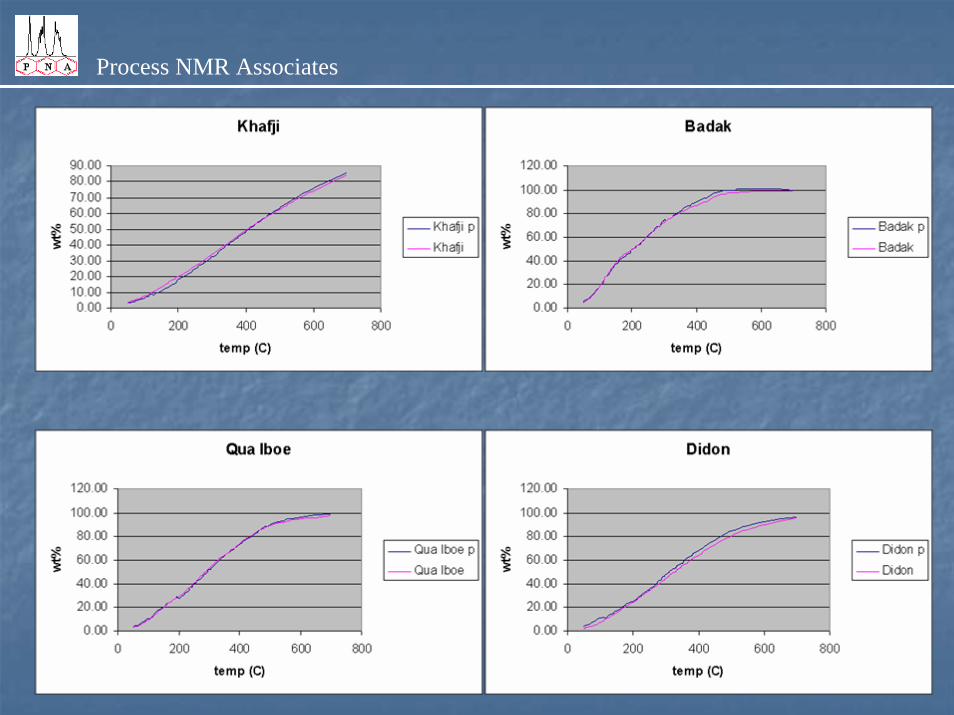
NMR PLS Outputs: Naphtha – T10, T50, T90, EP Kero – Freeze, FlashCrude – API, Sulfur, TBP (38, 105, 165, 365, 565C)
Value Added: Kero - Approach Freeze Point Limit – Worth $600K/YearCDU Optimization- Conservatively 4 cents per Barrel
Performance : NMR Available 98% Except for February

Process NMR Associates
SSC &
MRA

Process NMR Associates
Crude Fast Loop Crude Fast Loop HeaterHeater
Process NMR Associates
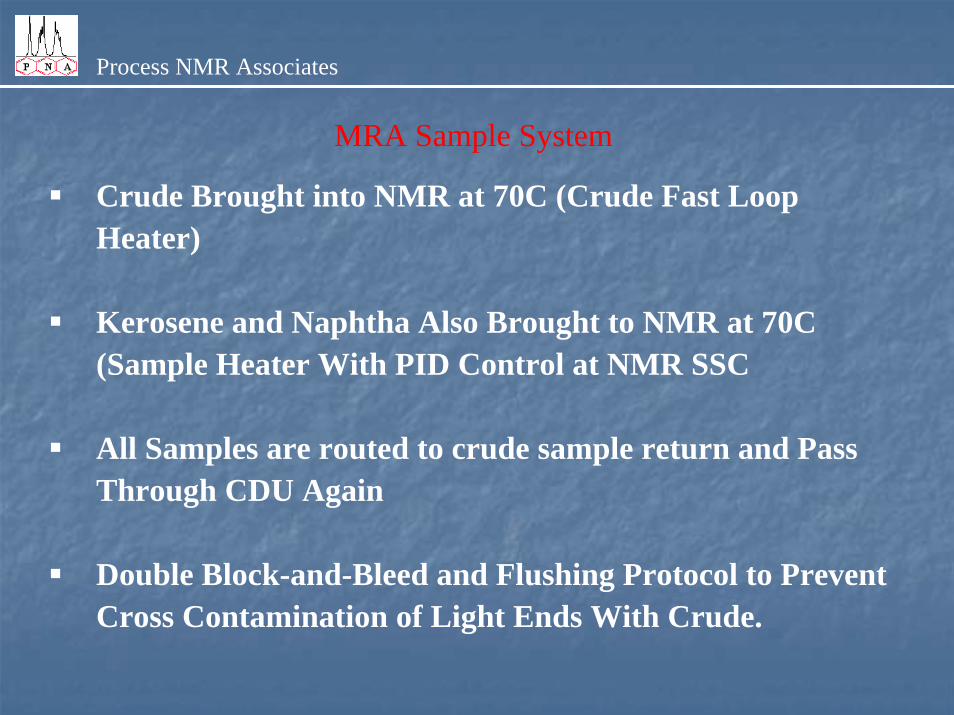
MRA Sample System
Crude Brought into NMR at 70C (Crude Fast Loop Heater)
Kerosene and Naphtha Also Brought to NMR at 70C(Sample Heater With PID Control at NMR SSC
All Samples are routed to crude sample return and Pass Through CDU Again
Double Block-and-Bleed and Flushing Protocol to Prevent Cross Contamination of Light Ends With Crude.
Process NMR Associates
-60
-55
-50
-45
-40
-35
-30
2002
/05/
01
2002
/05/
0220
02/0
5/03
2002
/05/
04
2002
/05/
0520
02/0
5/06
2002
/05/
07
2002
/05/
0820
02/0
5/09
2002
/05/
10
2002
/05/
11
2002
/05/
1220
02/0
5/13
2002
/05/
14
2002
/05/
1520
02/0
5/16
2002
/05/
17
2002
/05/
1820
02/0
5/19
2002
/05/
20
Freeze NfreezeKero Lab v. NMR
Process NMR Associates
Crude Analysis
Process NMR Associates
Process NMR Associates
Process NMR Associates
Process NMR Associates
Process NMR Associates
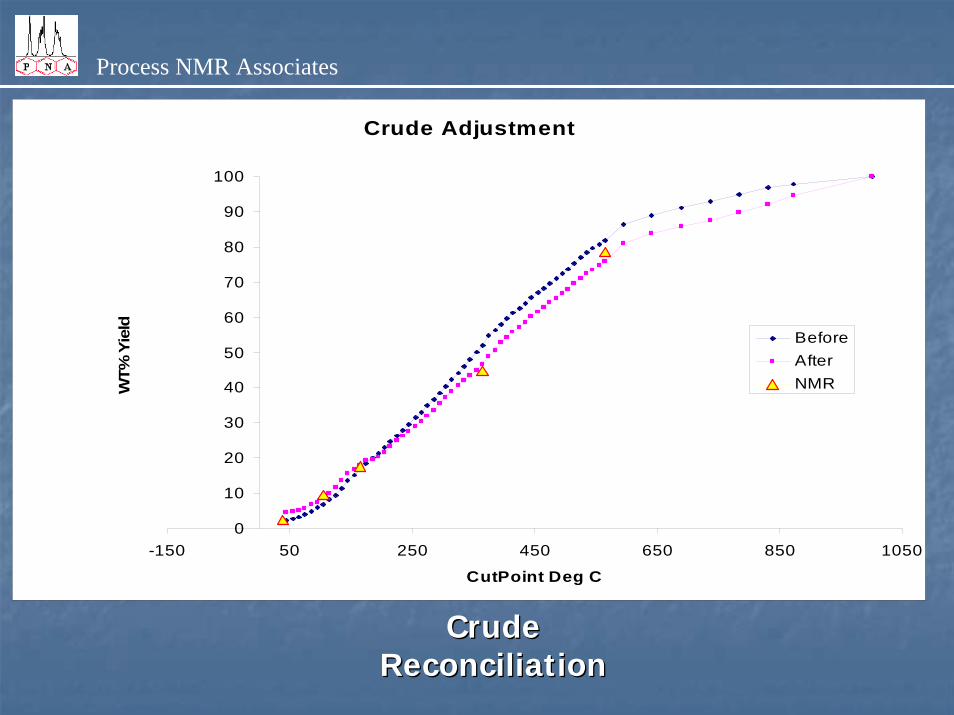
Crude Adjustment
0
10
20
30
40
50
60
70
80
90
100
-150 50 250 450 650 850 1050
CutPoint Deg C
WT%
Yie
ld
BeforeAfterNMR
Crude Crude ReconciliationReconciliation

Process NMR Associates
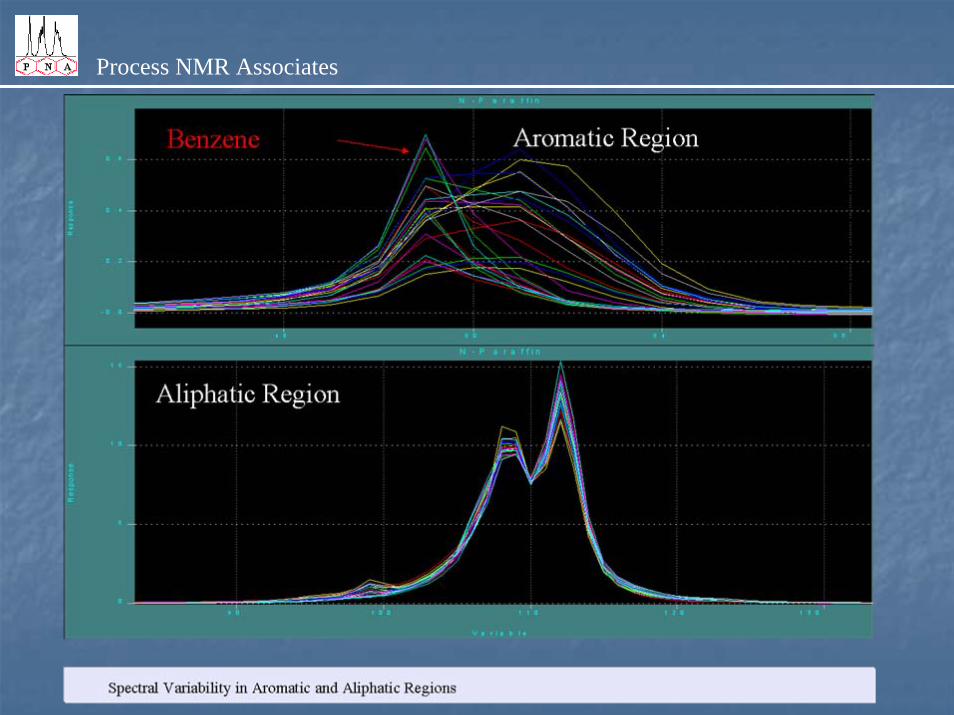
Application: Steam Cracking Optimization
Cracker Facility Capacity: 600,000 Tonnes per Year
Control Strategy: Feed Forward Detailed Hydrocarbon Analysis to SPYROOptimization Package
NMR Analysis: 3-4 Minute Cycle (Single Stream)16 Minute Cycle (4 Feed Streams)
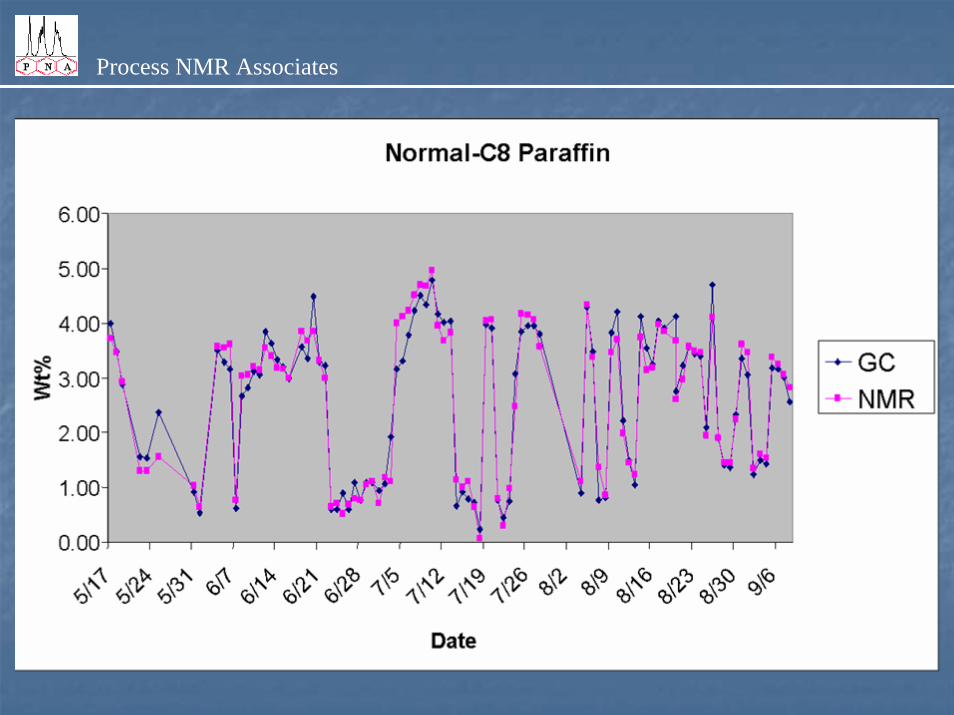
NMR PLS Outputs: Naphtha – Detailed PIONAc4-c10 n-paraffin, i-paraffin, aromatics, naphthenes
Value Added: Unit Optimization - $150K /year 4 Units Now Being Optimized ($600K/year)
Performance : NMR Available 98%+ Since August 2000Models Updated in a Limited Manner
Process NMR Associates
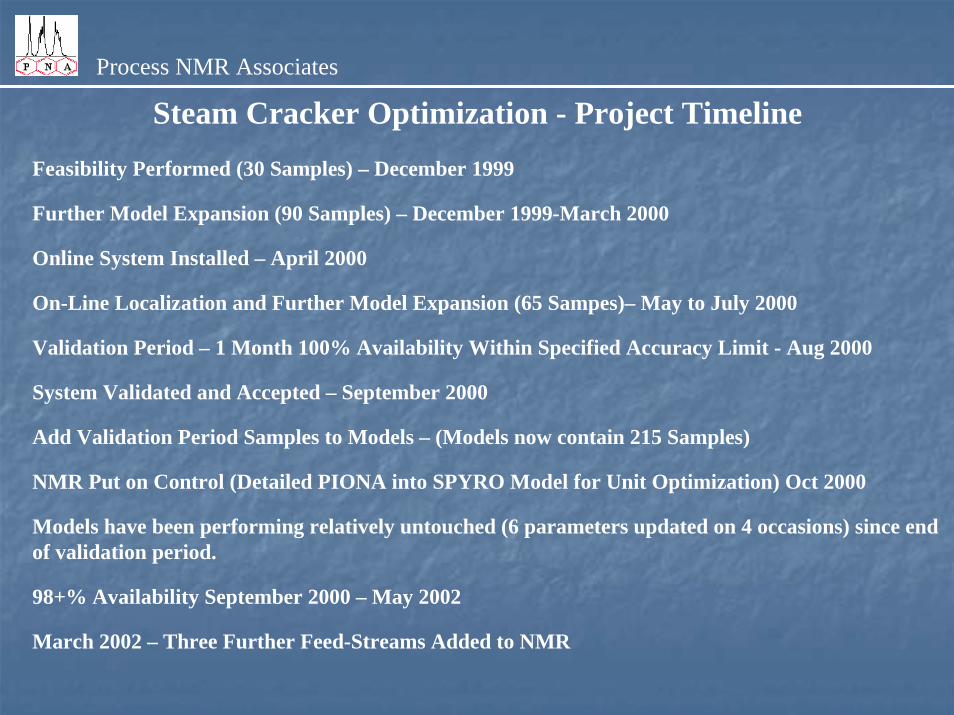
Steam Cracker Optimization - Project Timeline Feasibility Performed (30 Samples) – December 1999
Further Model Expansion (90 Samples) – December 1999-March 2000
Online System Installed – April 2000
On-Line Localization and Further Model Expansion (65 Sampes)– May to July 2000
Validation Period – 1 Month 100% Availability Within Specified Accuracy Limit - Aug 2000
System Validated and Accepted – September 2000
Add Validation Period Samples to Models – (Models now contain 215 Samples)
NMR Put on Control (Detailed PIONA into SPYRO Model for Unit Optimization) Oct 2000
Models have been performing relatively untouched (6 parameters updated on 4 occasions) since end of validation period.
98+% Availability September 2000 – May 2002
March 2002 – Three Further Feed-Streams Added to NMR

Process NMR Associates
Process NMR Associates
Process NMR Associates

Process NMR Associates
Process NMR Associates
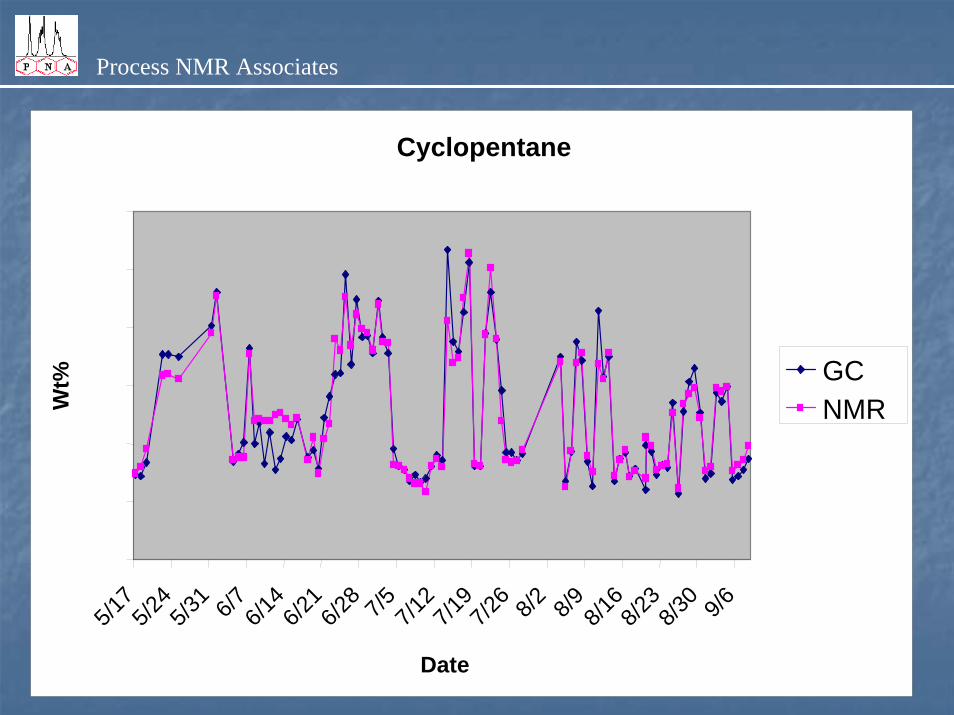
Cyclopentane
5/17
5/24
5/31 6/7 6/14
6/21
6/28 7/5 7/12
7/19
7/26 8/2 8/9 8/16
8/23
8/30 9/6
Date
Wt% GC
NMR

Process NMR Associates
Process NMR Associates
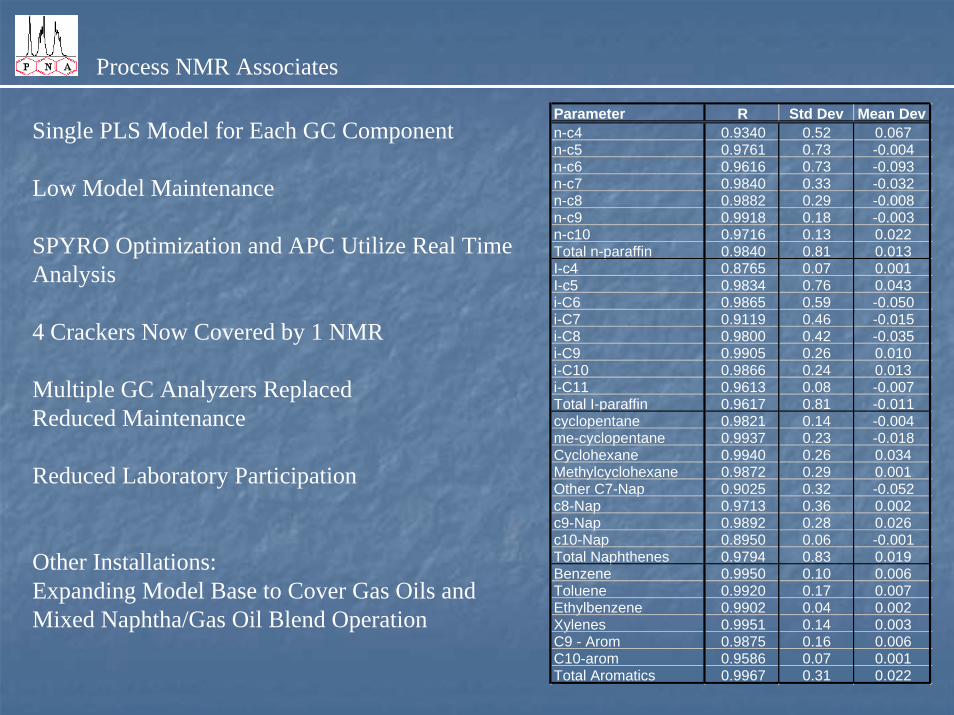
Parameter R Std Dev Mean Devn-c4 0.9340 0.52 0.067n-c5 0.9761 0.73 -0.004n-c6 0.9616 0.73 -0.093n-c7 0.9840 0.33 -0.032n-c8 0.9882 0.29 -0.008n-c9 0.9918 0.18 -0.003n-c10 0.9716 0.13 0.022Total n-paraffin 0.9840 0.81 0.013I-c4 0.8765 0.07 0.001I-c5 0.9834 0.76 0.043i-C6 0.9865 0.59 -0.050i-C7 0.9119 0.46 -0.015i-C8 0.9800 0.42 -0.035i-C9 0.9905 0.26 0.010i-C10 0.9866 0.24 0.013i-C11 0.9613 0.08 -0.007Total I-paraffin 0.9617 0.81 -0.011cyclopentane 0.9821 0.14 -0.004me-cyclopentane 0.9937 0.23 -0.018Cyclohexane 0.9940 0.26 0.034Methylcyclohexane 0.9872 0.29 0.001Other C7-Nap 0.9025 0.32 -0.052c8-Nap 0.9713 0.36 0.002c9-Nap 0.9892 0.28 0.026c10-Nap 0.8950 0.06 -0.001Total Naphthenes 0.9794 0.83 0.019Benzene 0.9950 0.10 0.006Toluene 0.9920 0.17 0.007Ethylbenzene 0.9902 0.04 0.002Xylenes 0.9951 0.14 0.003C9 - Arom 0.9875 0.16 0.006C10-arom 0.9586 0.07 0.001Total Aromatics 0.9967 0.31 0.022
Single PLS Model for Each GC Component
Low Model Maintenance
SPYRO Optimization and APC Utilize Real Time Analysis
4 Crackers Now Covered by 1 NMR
Multiple GC Analyzers Replaced Reduced Maintenance
Reduced Laboratory Participation
Other Installations:Expanding Model Base to Cover Gas Oils andMixed Naphtha/Gas Oil Blend Operation
Process NMR Associates
Application Snippets

Process NMR Associates
05
101520253035404550
1.4000 1.4500 1.5000 1.5500 1.6000Refractive Index
Car
bon
Aro
mat
icity
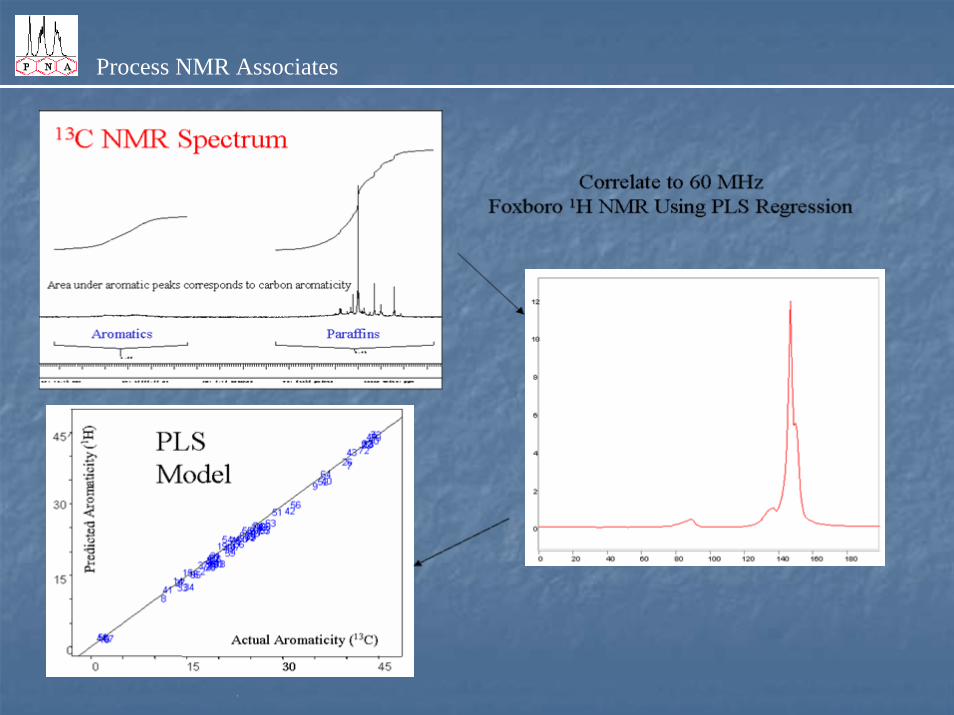
Correlation Between Carbon Aromaticity and Refractive Index
Why Measure Refractive Index When NMR Allows the Carbon Aromaticity to be Obtained Directly?
FCC, RCC, Hydrotreating, Base Oil Manufacture
Process NMR Associates
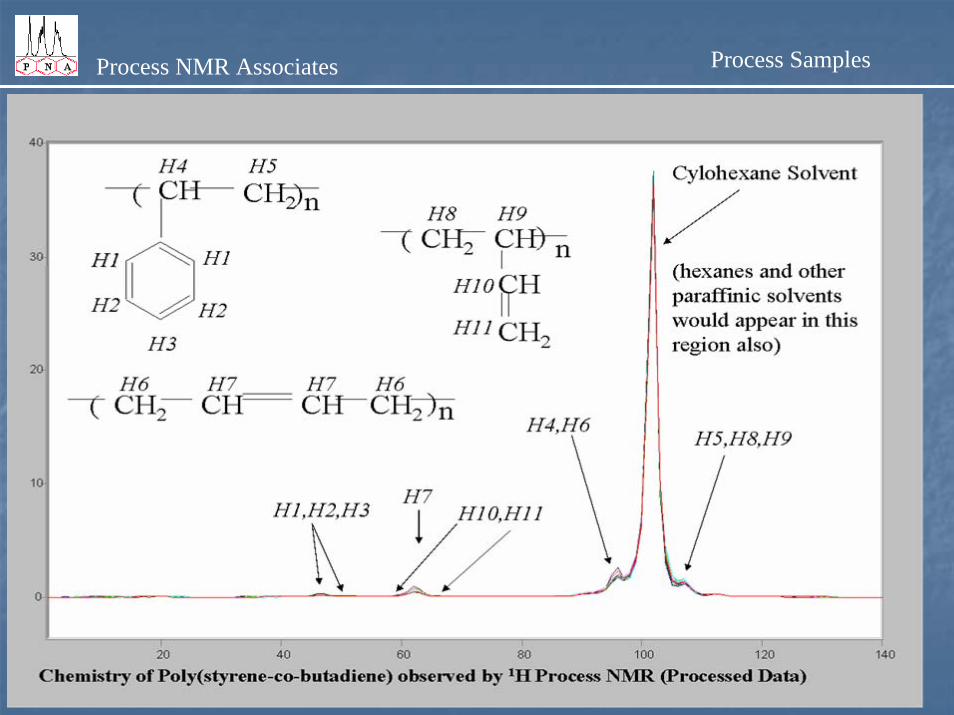
Process NMR Associates Process Samples

Process NMR Associates Monomer Ratios

Process NMR Associates Selective Vinylidene Synthesis
Process NMR Associates
Process NMR Associates

Process NMR Associates

Process NMR Associates

Process NMR Associates

Process NMR Associates
Process NMR Associates
ConclusionHigh Resolution FT-NMR has
Left the Research Laboratory…. and is Arriving in a Process
Near You!
See Further Information at http://www.process-nmr.com
Process NMR Associates
Acknowledgements
Paul Giammatteo – PNA
Tal Cohen – Foxboro NMR Israel
Tony Van Poyenbroeck – Cardoen Technology, Belgium
Invensys
Our NMR Customers