PROCESS DESIGN AND INTEGRATION OF SHALE GAS TO METHANOL … · METHANOL An Undergraduate Research...
44
PROCESS DESIGN AND INTEGRATION OF SHALE GAS TO METHANOL An Undergraduate Research Scholars Thesis by VICTORIA M. EHLINGER Submitted to Honors and Undergraduate Research Texas A&M University In partial fulfillment of the requirements for the designation as UNDERGRADUATE RESEARCH SCHOLAR Approved by Research Advisor: Dr. Mahmoud El-Halwagi May 2013 Major: Chemical Engineering
Transcript of PROCESS DESIGN AND INTEGRATION OF SHALE GAS TO METHANOL … · METHANOL An Undergraduate Research...

PROCESS DESIGN AND INTEGRATION OF SHALE GAS TO
METHANOL
An Undergraduate Research Scholars Thesis
by
VICTORIA M. EHLINGER
Submitted to Honors and Undergraduate Research
Texas A&M University
In partial fulfillment of the requirements for the designation as
UNDERGRADUATE RESEARCH SCHOLAR
Approved by Research Advisor: Dr. Mahmoud El-Halwagi
May 2013
Major: Chemical Engineering

1
TABLE OF CONTENTS
Page
TABLE OF CONTENTS ................................................................................................................ 1
ABSTRACT .................................................................................................................................... 2
DEDICATION ................................................................................................................................ 4
ACKNOWLEDGEMENTS ............................................................................................................ 5
NOMENCLATURE ....................................................................................................................... 6
CHAPTERS
I INTRODUCTION ............................................................................................................... 7
The emerging shale gas industry in the United States ........................................................ 8 Natural gas processing ...................................................................................................... 10
Synthesis gas generation ................................................................................................... 13 Methanol production ......................................................................................................... 14
II METHODS........................................................................................................................ 16
III RESULTS ......................................................................................................................... 19
Economic ........................................................................................................................... 19 Energy Integration ............................................................................................................. 21
Environmental ................................................................................................................... 23
IV CONCLUSIONS ............................................................................................................... 26
REFERENCES ............................................................................................................................. 28
APPENDIX A ............................................................................................................................... 30
APPENDIX B ............................................................................................................................... 33
APPENDIX C ............................................................................................................................... 39
APPENDIX D ............................................................................................................................... 42
2
ABSTRACT
Process Design and Integration of Shale Gas to Methanol. (May 2013)
Victoria M. Ehlinger
Artie McFerrin Department of Chemical Engineering
Texas A&M University
Research Advisor: Dr. Mahmoud El-Halwagi
Artie McFerrin Department of Chemical Engineering
Recent breakthroughs in horizontal drilling and hydraulic fracturing technology have made huge
reservoirs of previously untapped shale gas and shale oil formations available for use. These
new resources have already made a significant impact on the United States chemical industry and
present many opportunities for new capital investments and industry growth. As in conventional
natural gas, shale gas contains primarily methane, but some formations contain significant
amounts of higher molecular weight hydrocarbons and inorganic gases such as nitrogen and
carbon dioxide. These differences present several technical challenges to incorporating shale gas
with current infrastructure designed to be used with natural gas. However, each shale presents
opportunities to develop novel chemical processes that optimize its composition in order to more
efficiently and profitably produce valuable chemical products.
This paper is aimed at process synthesis, analysis, and integration of different processing
pathways for the production of methanol from shale gas. The composition of the shale gas
feedstock is assumed to come from the Barnett Shale Play located near Fort Worth, Texas, which
is currently the most active shale gas play in the US. Process simulation and published data
were used to construct a base-case scenario in Aspen Plus. The impact of different processing
3
pathways was analyzed. Key performance indicators were assessed. These include overall
process targets for mass and energy, economic performance, and environmental impact. Finally,
the impact of several factors (e.g., feedstock composition, design and operating variables) is
studied through a sensitivity analysis.
The results show a profitable process above a methanol selling price of approximately $1.50/gal.
The sensitivity analysis shows that the ROI depends much more heavily on the selling price of
methanol than on the operating costs. Energy integration leads to a savings of $30.1 million per
year, or an increase in ROI of 2% points. This also helps offset some of the cost required for the
oxygen necessary for syngas generation through partial oxidation. For a sample shale gas
composition with high levels of impurities, preprocessing costs require a price differential of
$0.73/MMBtu from natural gas. The process is also environmentally desirable because shale
gas does not lead to higher GHG emissions than conventional natural gas. More water is
required for hydraulic fracturing, but some of these concerns can be abated through conservation
techniques and regulation.

4
DEDICATION
To my family and friends,
For encouraging me to pursue undergraduate research and supporting me through the
entire process.

5
ACKNOWLEDGEMENTS
Thanks to Dr. Mahmoud El-Halwagi for assistance with the process analysis, energy integration,
and cost estimation, Kerron Gabriel for assistance with process design and simulation set up, and
Mohamed Noureldin for assistance with process design.

6
NOMENCLATURE
C2 – ethane
C3 – propane
DEA – diethanolamine
GHG – greenhouse gas
kWh – kilowatt hour
LPG – liquefied petroleum gas
MDEA – methyldiethanolamine
MEA – monoethanolamine
MeOH – methanol
MMscf – million standard cubic feet
MMBtu – million Btu (British thermal unit)
NGL – natural gas liquids
ROI – return on investment
WGS – water-gas shift
7
CHAPTER I
INTRODUCTION
In order to meet the energy demands of the twenty-first century, engineers and scientists are
working to develop new methods of discovering, extracting, and refining fossil fuels including
oil, coal, and natural gas. While the development of alternative energy technologies continues
and the use of renewable energy sources increases, fossil fuels still fulfill the majority of the
United States’ energy needs: approximately 85%, with natural gas supplying about 22% of the
total [1].
Natural gas is an odorless, colorless mixture of light hydrocarbons and other gases. The primary
component is methane, with the remaining fraction consisting of a mixture of heavier
hydrocarbons including ethane and propane. Crude natural gas may also contain other light
gases such as nitrogen, helium, and water in small concentrations. Table 1 shows the variability
of natural gas concentration and composition due to variations from individual wells.
In light of concerns about environmental pollution and greenhouse gas emissions, consumption
of natural gas as a fuel source has grown due to its clean burning nature and high energy
content. The main byproducts of combustion of natural gas are carbon dioxide and water,
according to the chemical reaction below.
CH4 + 2O2 → CO2 + 2H2O (1)

8
Additional byproducts include carbon monoxide, sulfur dioxide, nitrogen oxides, and
hydrocarbons; however, these chemicals are present in much lower concentrations in natural gas
than in other fossil fuels.
Table 1. Chemical Composition of Conventional Natural Gas [2]
Components Formula Typical
(mol %)
Extreme
(mol %)
Methane CH₄ 80-95 50-95
Ethane C₂H₆ 2-5 2-20
Propane C₃H₈ 1-3 1-12
Butane C₄H₁₀ 0-1 0-4
C5 Alkanes and
higher hydrocarbons C₅ + 0-1 0-1
Carbon Dioxide CO₂ 1-5 0-99
Nitrogen N₂ 1-5 0-70
Hydrogen Sulfide H₂S 0-2 0-6
Oxygen O₂ 0 0-0.2
Helium He 0-0.1 0-1
Other inert gases traces
Natural gas has an additional advantage over other fossil fuels due to its large domestic
availability, which addresses political and economic concerns over dependence on foreign oil
supplies. In the United States, 84% of the natural gas consumed is produced in the country and
97% is produced in North America [1]. As energy needs continue to rise, natural gas will remain
an important resource in the American economy. Natural gas is a key resource for many diverse
sectors of the economy, including industrial chemicals and fuels, power generation,
transportation fuels, and residential heating.
The emerging shale gas industry in the United States
As the demand for natural gas continues to rise, new sources and techniques for extracting
natural gas are being developed. Unconventional production, which includes but is not limited to

9
shale gas production, now accounts for 46% of the total U.S. production of natural gas [1]. Shale
gas production in the United States has been growing consistently over the past decade and
Figure 6 shows that shale gas is projected to increase over the next twenty-five years to become
the primary source of natural gas produced in the United States. Shale gas includes natural gas
sources from low-permeability shale, a sedimentary rock that consists primarily of consolidated
clay-sized particles [1]. The low natural permeability of shale has been the limiting factor to the
production of shale gas resources because only small volumes of gas flow naturally to a wellbore
[1]. However, breakthroughs in modern drilling technology have made it possible to increase
gas flow from the shale formation and make development of shale reservoirs economical.
Figure 1. Projections of U.S. Shale Gas Production [3]
The primary difference between modern shale gas development and conventional natural gas
development is the extensive use of modern drilling techniques such as horizontal wells and
hydraulic fracturing. Drilling of shale gas wells includes both traditional vertical wells as well
as horizontal wells. Horizontal well drilling has been an increasingly utilized technique because

10
it provides exposure to greater volume of a formation: a single well pad with horizontal wells can
access the same reservoir volume as sixteen vertical wells [1]. As a result, fewer drill pads are
necessary which also reduces the infrastructure necessary to develop a well. While helping to
optimize product recovery and profit, these techniques can also help to reduce the overall
environmental impact of gas recovery and production. The hydraulic fracturing technique is also
used to increase the well’s exposure to natural gas in a rock formation. This is achieved by
injection of a fluid under high pressure into the formation, which relieves the internal stresses
and causes cracks to form in the rock. Fracturing fluids are typically composed of a mixture of
water and sand with chemical additives.
Like in conventional natural gas, the largest fraction of shale gas consists of methane. However,
some shale gas formations contain significant amounts of higher molecular weight hydrocarbons,
including ethane and propane, as well as other inorganic gases such as nitrogen and carbon
dioxide. Compounds in shale gas may not be present in natural gas or may be present only in
negligible amounts. These differences present several technical challenges to incorporating the
use of shale gas with current infrastructure designed to be used with conventional natural gas.
However, each shale gas basin presents many opportunities to develop novel chemical processes
that optimize its composition in order to more efficiently and profitably produce valuable
chemical products.
Natural gas processing
Once the crude natural gas has been extracted from underground reservoirs, it must be processed
to remove impurities resulting from the drilling process or from the well itself before the gas can

11
be used in an industrial or commercial application. Although no national standards exist, each
pipeline has strict specifications for heat content, removal of particulate matter, and maximum
concentrations of contaminants such as nitrogen, carbon dioxide, and hydrogen sulfide, and
natural gas liquids. Some of the most common impurities found in natural gas are listed below in
Table 2.
Table 2. Common Impurities In Natural Gas [4]
Name/Description Formula
Hydrogen Sulfide H₂S
Carbon Dioxide CO₂ Water Vapor H₂O
Sulfur Dioxide SO₂ Nitrogen Oxides NO, NO₂ Volatile Organic Compounds (VOCs)
Volatile Chlorine Compounds HCl, Cl₂ Volatile Fluorine Compounds HF, SiF₄ Basic Nitrogen Compounds
Carbon Monoxide CO
Carbonyl Sulfide COS
Carbon Disulfide CS₂ Organic Sulfur Compounds
Hydrogen Cyanide HCN
Processing of natural gas involves three main steps: removal of impurities, dehydration, and
separation into light and heavy fractions. In order to prepare the crude gas for processing, acid-
forming components such as carbon dioxide and hydrogen sulfide must be removed. Next,
dehydration is central to the purification process in order to prevent condensation inside
pipelines during transport. Similarly, some pipeline standards do not allow for high nitrogen
content, so nitrogen is typically removed via a cryogenic separation process and discharged to
the atmosphere. Additionally, drilling process water must be treated due to soluble contaminants

12
from the gas and particulate matter (i.e. dirt and sand) which infiltrate the water during the
drilling process. Figure 2 summarizes the major steps in processing crude natural gas.
Figure 2. Natural Gas Purification Process [5]
The primary acid forming components in natural gas are carbon dioxide (CO₂) and hydrogen
sulfide (H₂S). Many techniques have been developed to remove these components either
together or with selectivity for one component. One technique that serves to remove both
components is absorption with an alkanolamine, such as monoethanolamine (MEA),
diethanolamine (DEA), or methyldiethanolamine (MDEA).
Monoethanolamine (MEA)
Diethanolamine (DEA)
Methyldiethanolamine (MDEA)
Figure 3. Alkanolamines for Acid-Gas Removal
In the alkanolamine molecules, the hydroxyl group serves to reduce vapor pressure and increase
water solubility while the amino group reacts with the acidic gases. Additionally, acid-gas
components can be removed from natural gas with physical solvents, catalytic reactions, or other
absorbents including ammonium salts and water.

13
Water vapor can be removed through adsorption in glycol solution or adsorption on solid
desiccants such as silica and alumina. Water can also be used as an absorbent to remove other
impurities including major contaminants like ammonia, hydrogen cyanide, sulfur dioxide, and
carbon dioxide.
Once impurities are removed from natural gas feedstocks, the hydrocarbons are separated into
light and heavy fractions through cooling and partial condensation in a heat exchanger. Modern
plants use cryogenic separation to separate propane and butane, also known as liquefied
petroleum gas (LPG). In this process, crude gas is cooled and partially condensed under high
pressure in a heat exchanger, then expanded, heated and sent to a separation column where the
bottoms products consist of the C3 plus products. The light hydrocarbons (ethane and methane)
are recycled from the top of the column. Ethane is separated in a similar manner as the LPG
process, but with a lower temperature profile.
Synthesis gas generation
Natural gas serves as an important raw material for the production of many industrial chemicals.
One of the most important derivatives of natural gas is synthesis gas, a mixture of carbon
monoxide, hydrogen, and nitrogen gases. Synthesis gas is the primary feedstock for the
manufacture of several essential commodity chemicals including methanol and ammonia.
Purification of crude natural gas is necessary for the production of synthesis gas because
components such as sulfur and chlorides poison the nickel catalyst used to generate synthesis
gas. Common methods for the generation of synthesis gas include steam reforming, partial

14
oxidation, and autothermal reforming. In steam reforming, the primary component of natural
gas, methane, reacts with water according to the following endothermal reaction:
CH₄ + H₂O = CO + 3H₂ ΔHr = 206 kJ/mol (2)
For partial oxidation, methane is reacted with oxygen from air according to the following
exothermal reaction:
CH₄ + ½O₂ = CO + 2H₂ ΔHr = -36 kJ/mol (3)
Oxygen present in excess or insufficient amounts will result in the formation of byproducts
carbon dioxide and coke (solid carbon). Autothermal reforming combines the previous two
techniques by using the energy generated from partial oxidation of hydrocarbons to drive the
endothermic reaction in steam reforming.
Methanol production
Methanol, also known as methyl alcohol or wood alcohol, is a clear, colorless, flammable liquid
with the chemical formula CH3OH. Methanol is among one of the ten most important organic
chemicals because it plays a crucial role as a reactant in the manufacture of many other basic
chemical compounds. Approximately forty percent of methanol produced goes into
formaldehyde production, which occurs by oxidizing methanol in the presence of a copper
catalyst resulting in dehydrogenation. Acetic acid can also be produced by reacting methanol
with carbon monoxide.
Methanol is typically produced on an industrial scale using a catalytic reaction of synthesis gas at
high pressure. In order to produce methanol, first syngas must be generated from the primary
feed source using one of the methods discussed in the previous section. Typically, synthesis gas

15
is generated from natural gas but current research is developing syngas generation methods
utilizing gasification of biomass and gasification of coal. The product stream includes hydrogen
and carbon monoxide gas as well as a small amount of unreacted methane, nitrogen, and carbon
dioxide.
Equilibrium for methanol formation is favored by low temperatures and high pressures, so the
reactor feed conditions are typically 50-100 atm and 230-260 °C [6]. The reaction takes place
over a CuO/ZnO/Al2O3 catalyst. Methanol synthesis actually occurs as a combination of two
reactions in the syngas mixture: the first involving carbon dioxide and hydrogen and the second
involving carbon monoxide and water generated in the system. The overall reaction shows a net
exothermal conversion of carbon monoxide and hydrogen gases, the primary components of
syngas, to liquid methanol.
CO (g) + H2O (g) = H2 (g) + CO2 (g) ΔH298
= -41 kJ/mol (4)
CO2 (g) + 3H2 (g) = CH3OH (l) + H2O (g) ΔH298
= -50 kJ/mol (5)
CO (g) + 2H2 (g) = CH3OH (l) ΔH298
= -91 kJ/mol (6)
During this process, some side reactions occur which form impurities including dimethyl ether,
methyl formate, and butanol, which must be removed during the final purification of the process.

16
CHAPTER II
METHODS
Differences in shale gas composition present both challenges and opportunities for innovation in
the chemical industry. In this text, the production of methanol from synthesis gas will serve as a
sample industrial process to explore some of these possibilities.
Process simulation using ASPEN Plus and published data were used to simulate at 5,000 ton per
day methanol plant as the base case. The complete process flow diagrams can be found in
Appendix A. The front end of the process, which includes synthesis gas generation through
partial oxidation, was modeled using data from Buping, et al. (2010) [7]. For this analysis, the
partial oxidation process was selected for the simulation of syngas generation because the
reaction is exothermic and does not yield excess hydrogen. The maximum yield for synthesis
gas generation occurs when the components are present in a stoichiometric ratio, 2:1. Partial
oxidation leads to a CO/H2 ratio very close to the optimum, about 1.8. However, cost
optimization among the three syngas generation processes requires a much more complex
analysis which is beyond the scope of this text. The reader may refer to Noureldin et al. (2012)
for more information on these design considerations [8]. The methanol reactor was modeled
using temperature and pressure conditions cited above and primary chemical reactions and side
reactions using the RGIBBS thermodynamic equilibrium model of ASPEN Plus simulation.

17
In order to perform the analysis, information was gathered from various sources in order to
estimate captial cost and operating costs. Cost of utilities, raw materials, and labor were
extracted from literature coupled with simulation results [9-11].
Shale gas preprocessing cost and profit from NGL separation was estimated from literature
values and flow rates from the simulator. The preprocessing cost was then used to determine a
price differential between natural gas and shale gas. The chemical composition of shale gas
represented using values from gas produced from the Barnett Shale play, located in northeast
Texas near the Fort Worth area [1]. The area was first developed in the 1980’s and was
nicknamed the “Grandfather Shale,” because it served as the development ground for the modern
techniques that made shale gas production economical in the United States. It continues to be
the most active shale gas play in the United States, which is why this location was selected as the
feed for this study [1]. Values for composition of various wells from the Barnett Shale are
shown in Table 3.
Table 3. Barnett Shale Gas Composition [12]
Well C1 C2 C3 CO₂ N₂
1 80.3 8.1 2.3 1.4 7.9
2 81.2 11.8 5.2 0.3 1.5
3 91.8 4.4 0.4 2.3 1.1
4 93.7 2.6 0.0 2.7 1.0
Avg 86.8 6.7 2.0 1.7 2.9
These data show the wide variability of possible chemical compositions of shale gas formations.
While some areas of the Barnett Shale Play are fairly consistent with conventional natural gas
sources, others contain much higher concentrations of hydrocarbons, carbon dioxide and

18
nitrogen. Data from Well 1 was used in the simulation in order to analyze the scenario with the
highest deviation from conventional natural gas composition.

19
CHAPTER III
RESULTS
Economic
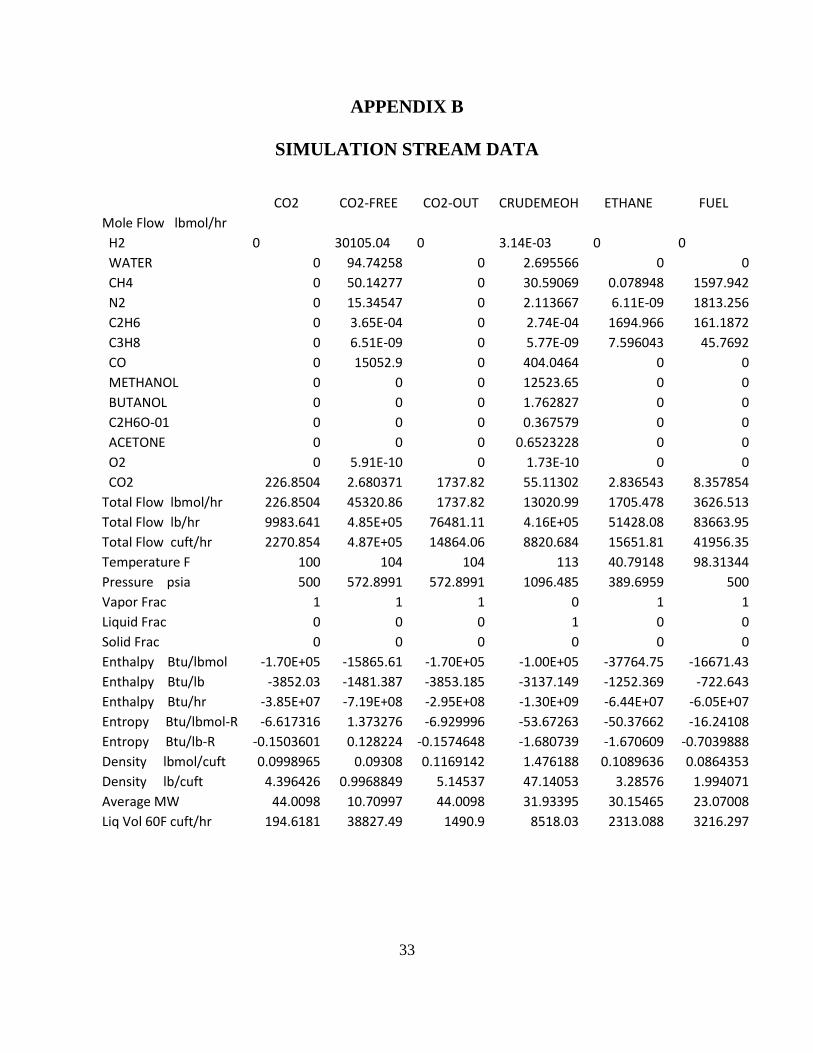
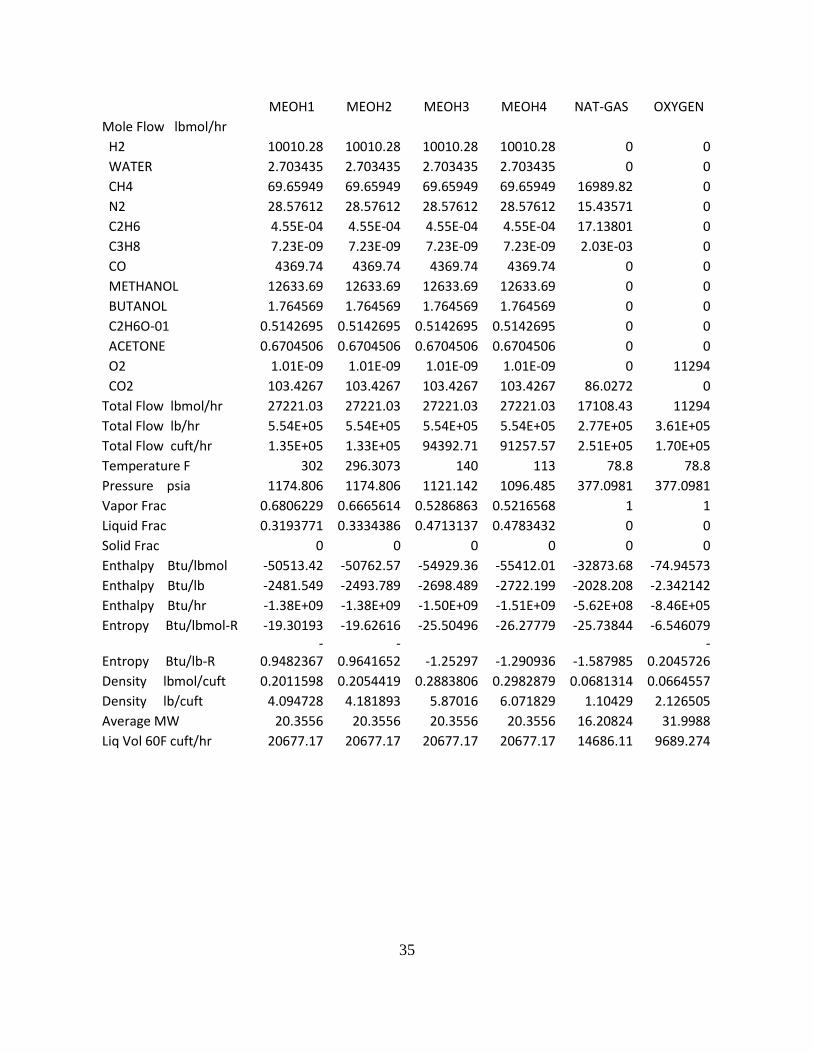
Detailed stream data from the process simulation can be found in Appendix B. A basis of 7,920
operating hours per year is used. Stream data along with cost estimations were used to generate
the following cost and sales estimations.
Table 4. Cost and Sales Estimation
A sensitivity analysis was performed to evaluate the ability of the process to withstand changes
in feedstock and product values. Figure 4 shows the ROI against methanol price ranging from
$1.00 - $4.00 per gallon and natural gas price ranging from $2.00 to $6.00 per MMBtu.
MM $
Fixed Capital Investment
1,300.00 [13]
Operating Costs Flow Rate Unit Cost ($) Cost (MM$/y) Raw Materials Natural Gas 155.8 MMscf/d 3.50 /Mscf [14] 179.95
Oxygen 361394 lb/hr 0.05 /lb [15] 143.11
Utilities Heating 179.95 MMBtu/hr 4.00 /MMBtu 1.43
Cooling 1829.78 MMBtu/hr 1.50 /MMBtu 21.74
Power 14746 kWh 0.05 kWh 0.24
Waste Treatment 94963 lb/hr 0.53 /tonne 0.18
Labor
3.80
Sales Flow Rate Unit Price ($)
Annual Sales ($MM/y)
Methanol 5000 TPD 2.00 0.30
/gal or /lb
1000.00

20
Figure 4. Sensitivity Analysis
Analysis of the inlet gas stream was used to estimate the preprocessing cost for shale gas. For
each calculation, 100% removal was assumed. The primary cost factors included were acid gas
removal and nitrogen gas removal. Additionally, some of the total cost is offset through
separation of the natural gas liquids (NGLs): ethane and propane. The final cost was then used
to determine a price differential between shale gas from the wellhead in comparison with
pipeline quality natural gas. Results are shown in Table 5 and Table 6.
0.00
0.10
0.20
0.30
0.40
0.50
0.60
0.70
0.80
0.90
1.00 1.50 2.00 2.50 3.00 3.50 4.00
RO
I
MeOH Price ($/gal)
Sensitivity Analysis
$2.00/MMBtu
$4.00/MMBtu
$6.00/MMBtu

21
Table 5. Preprocessing Cost Estimation
Flow Rate
Unit Cost ($)
$ 10^6 Annual
Acid Gas Removal 23148 lbmol/hr 0.37 /Mscf feed [16] 25.95
N2 Removal 23148 lbmol/hr 1.30 /Mscf feed [17] 90.45
C2 Credit 1874.988 lbmol/hr 0.22 /gal [18] 35.85
C3 Credit 532.404 lbmol/hr 0.97 /gal [19] 42.92
Total 37.63
Table 6. Shale Gas Price Differential
Unit Cost ($/kscf) Total Cost (MM$/y)
Natural Gas 3.50 179.95
Shale Gas 2.77 142.32
δ 0.73 37.63
Energy Integration
The operating cost can be reduced through the use of heat integration and cogeneration. The data
for the hot and cold streams are given in Table 7.
Table 7. Heat Exchanger Data
Heat exchanger Supply Temperature (oF)
Target Temperature (oF)
Heat Duty (MMBtu/hr)
O2-Heat 79 392 25.98
WGS-Heat 104 572 153.98
Heat-Rec 2319 104 966.30
Cool 614 104 174.04
MeOH Cool 464 302 144.63
Recycle Cool 1 296 140 113.42
Recycle Cool 2 140 113 13.14
The O2-Heat exchanger takes the inlet flow of oxygen gas and heats it to 200°C before entering
the POX reactor. The Heat-Rec exchanger cools the syngas mixture from the POX reactor down
to 40°C and compresses the mixture to 39.5 bar. Condensed liquids are separated from the gas
22
stream in the flash column and then the gas stream is heated again in the WGS-Heat exchanger
to 300°C before entering the WGS reactor. The products from this reactor are then sent to the
Cool exchanger where they are again cooled to 40°C. Unit MeOH Cool takes the products from
the methanol reactor and cools them down to 150°C and expands them to 81 bar. Units Recycle
Cool 1 and Recycle Cool 2 continue to step down the temperature and pressure to 60°C and 77.3
bar, then 45°C and 75.6 bar before the crude methanol product is separated from the recycle
stream in a final flash column.
By carrying out heat integration through thermal pinch analysis, the targets for minimum heating
and cooling utilities are reduced to 0 and 1,649.83 MM Btu/hr. The cooling utility can be further
reduced and electric power can be produced using cogeneration. Excess heat is extracted from
the hot streams to produce steam which is let down through turbines. Using combined heat and
power targeting, the cooling utility is reduced to 620 MMBtu/hr and the cogenerated electric
power is 90.54 MW [20]. Since the total power demand of the process is 14.55 MW, then the net
power generation of the process is 75.99 MW. This corresponds to an annual value of $30.1
MM/yr. The following sensitivity analysis shown in Figure 5, which accounts for the savings
due to energy integration, shows a corresponding increase in ROI of approximately 2.0
percentage points. Detailed Calculations for the Energy Integration Analysis can be found in
Appendix D.

23
Figure 5. Sensitivity Analysis after Energy Integration
Environmental
Water is an important resource in multiple aspects of shale gas production, including drilling
mud and hydraulic fracturing fluid. Approximately 2-4 million gallons of water are required per
well for hydraulic fracturing [21]. This water is typically acquired from sources such as
groundwater, surface water, flowback/produced water reuses, treated municipal wastewater, and
0.00
0.10
0.20
0.30
0.40
0.50
0.60
0.70
0.80
0.90
1.00 1.50 2.00 2.50 3.00 3.50 4.00
RO
I
MeOH Price ($/gal)
Sensitivity Analysis
$2.00/MMBtu
$4.00/MMBtu
$6.00/MMBtu

24
acid mine drainage, with groundwater being the most typical as it is generally available close to
production wells [3].
As hydraulic fracturing technology has developed over the previous decade, the demand for
water resources in shale gas production has increased. Consequently, water conservation efforts
have also increased due competing interests of energy production with agricultural and health
needs. Although water use for shale gas production is relatively minor (<1%) when compared to
irrigation (56%) and municipal (26%) water use in Texas, it presents a greater strain in small
areas with limited water resources [22]. Additionally, municipal water use is projected to stay
relatively constant while shale gas water is projected to increase greatly over the next 30-40
years [22]. Some limits are already in place due to over abstraction of groundwater in the past
for irrigation limits, and many other water conservation methods are being developed for shale
gas production [22]. For instance, water from drilling mud, flowback, and produced water can
be reused using purification techniques such as filtration, chemical precipitation, reverse
osmosis, and evaporation/distillation. Additional benefits of recycling include reducing costs of
water acquisition and flowback treatment and disposal. However, the benefits of this approach
are limited as recycling and reuse depend on the amount of injected water, and the amount that
returns to the surface is only a fraction of the initial amount, about 30%-70% [21]. Current
researchers are exploring the possibility of replacing fracturing fluid with gases such as propane,
nitrogen or carbon dioxide. Additionally, some operators have started exploring brackish
groundwater, however this option involves risk of contamination during transport and increased
potential of well corrosion [22].

25
Although natural gas burns much cleaner than other fossil fuels, it has been debated whether
methane emissions during natural gas production and transportation amount to greater total
greenhouse gas emissions. Upstream sources of fugitive emissions are relatively small (2.8%)
compared to emissions from the power station, pipeline, and common elements [21]. In one
study performed by Burnham and Han, results show that shale gas life cycle emissions
statistically indistinguishable from conventional natural gas, 23% lower than gasoline, and 33%
lower than coal [23]. Another study performed by Stephenson, Valle, and Riera-Palou found
that unconventional gas emissions are about 1.8-2.4% higher than conventional gas base case,
agreeing with the results from Burnham and Han [21].

26
CHAPTER IV
CONCLUSIONS
The results of the simulation and cost estimation demonstrate that production of methanol from
shale gas would be profitable and a desirable business investment above a methanol selling price
of approximately $1.50/gal. This corresponds with an ROI of at least 20% or a payback period
shorter than five years. The sensitivity analysis shows that the process operating cost depend
primarily on the raw natural gas feedstock. However, the ROI depends much more heavily on
the selling price of methanol than on the operating costs. Energy Integration accounts for a cost
savings of $30.1 million per year and corresponds to an increase in ROI of approximately 2%
points. The choice of partial oxidation for synthesis gas generation adds an addition cost for
oxygen as a raw material, but some of this cost can be offset through energy integration.
Further analysis led to a cost estimation for the preprocessing of shale gas required to reach
pipeline standards, which is necessary for delivery of the raw material to the proposed plant site.
Because shale gas can have a chemical composition much different than natural gas, these
preprocessing costs may lead to a price differential between shale gas and conventional gas. In
the scenario analyzed, the preprocessing costs were dominated by nitrogen removal, with some
of the costs being offset from the sale of natural gas liquids (C2 and C3). However, these
preprocessing costs require that the shale gas from the wellhead be sold at a lower price than
pipeline-quality natural gas. This case shows a clear price differential at $0.73/MMBtu, but
other sources of shale gas with fewer impurities would have a narrower price differential.
27
For an environmental prospective, the greenhouse gas emissions for shale gas preprocessing are
statistically indistinguishable from those for conventional natural gas. In comparison to other
sources of fossil fuels such as petroleum and coal, natural gas has much lower emissions;
therefore, shale gas as a raw feedstock provides the same benefit of helping to reduce carbon
emissions. Additionally, drilling for shale gas requires water intensive techniques including
hydraulic fracturing. This water usage presents some concerns in domestic and semi-arid regions
where availability of fresh water is more restricted. Water conservation techniques can be used
to reduce water usage and environmental regulation may set limits on water usage in the future,
as has been done with water for irrigation.

28
REFERENCES
1. Nash, K.M., Shale gas development. Energy science, engineering and technology. 2010,
New York: Nova Science Publishers. ix, 174 p.
2. H ring, H.-W., Industrial gases processing. 2008, Weinheim: Wiley-VCH Verlag GmbH
& Co. KGaA. xiv, 296 p.
3. Gray, J., Marcellus Shale Gas Wastewater Reuse And Recyle, in AIChE/A&WMA Joint
Workshop2012: Pittsburgh, PA. p. 31.
4. Kohl, A.L. and R. Nielsen, Gas purification. 5th ed. 1997, Houston, Tex.: Gulf Pub. viii,
1395 p.
5. Goellner, J.F., Expanding the Shale Gas Infrastructure. Chemical Engineering Progress,
2012. 108(8): p. 49-+.
6. Cheng, W.-H. and H.H. Kung, Methanol Production and Use. Chemical Industries. 1994:
Marcel Dekker.
7. Bao, B., M.M. El-Halwagi, and N.O. Elbashir, Simulation, integration, and economic
analysis of gas-to-liquid processes. Fuel Processing Technology, 2010. 91(7): p. 703-
713.
8. Noureldin, M.M.B., et al. Process design and integration of XTL plants. in ACS National
Meeting. 2012. San Diego.
9. El-Halwagi, M.M., Sustainable design through process integration : fundamentals and
applications to industrial pollution prevention, resource conservation, and profitability
enhancement. 2012, Amsterdam ; Boston: Butterworth-Heinemann. xi, 422 p.
10. Peters, M.S., K.D. Timmerhaus, and R.E. West, Plant design and economics for chemical
engineers. 5th ed. McGraw-Hill chemical engineering series. 2003, New York: McGraw-
Hill. xvii, 988 p.
11. cited 2013; Available from: www.icis.com.
12. Bullin, K. and P. Krouskop, Composition variety complicates processing plans for US
Shale Gas, 2008, Bryan Research and Engineering Inc.: Bryan, Texas.
13. Sider, A. Louisiana group plans to build largest methanol plant in North America.
Hydrocarbon Processing, 2013. 92(3).
14. Administration, U.S.E.I., Natural Gas Weekly Update, 2013.
15. Bowers, A. and W.W. Eckenfelder, Industrial Wastewater and Best Available Treatment
Technologies. 2003: DEStech Publications, Inc.
16. Bhide, B.D., A. Voskericyan, and S.A. Stern, Hybrid processes for the removal of acid
gases from natural gas. Journal of Membrane Science, 1998. 140(1): p. 27-49.
17. Lokhandwala, K.A., et al., Nitrogen Removal From Natural Gas Using Membranes,
U.S.D.o. Energy, Editor.
18. Clark, B. US spot ethane prices set all-time low on cracker outages, supply. 2013.
19. Weekly Heating Oil and Propane Prices (October - March). 2013; Available from:
http://www.eia.gov/dnav/pet/pet_pri_wfr_dcus_nus_w.htm.
20. El-Halwagi, M.M., D. Harell, and H.D. Spriggs, Targeting Cogeneration and Waste
Utilization through Process Integration. Applied Energy, 2009. 86(6): p. 880-887.
21. Stephenson, T., J.E. Valle, and X. Riera-Palou, Modeling the Relative GHG Emissions of
Conventional and Shale Gas Production. Environmental Science & Technology, 2011.
45(24): p. 10757-10764.

29
22. Nicot, J.P. and B.R. Scanlon, Water Use for Shale-Gas Production in Texas, US.
Environmental Science & Technology, 2012. 46(6): p. 3580-3586.
23. Burnham, A., et al., Life-Cycle Greenhouse Gas Emissions of Shale Gas, Natural Gas,
Coal, and Petroleum (vol 46, pg 619, 2012). Environmental Science & Technology,
2012. 46(13): p. 7430-7430.
24. Tranier, J.P., N. Perrin, and R. Dubettier, Air separation units for cola power plants.
Carbon Capture Journal, 2011(June).

30
APPENDIX A
PROCESS FLOW DIAGRAMS
Overall Process
First oxygen gas is heated to 200°C. The heated oxygen and natural gas are fed to the POX
reactor where the raw materials react at 20 bar in order to form hydrogen gas and carbon
monoxide in approximately a 1.8:1 ratio. In the HEAT-REC exchanger the products are cooled
to 40°C and pressurized to 39.5 bar. In order to adjust the ratio to the stoichiometric value of
2.0, the gas mixture is sent through a flash column and then to the WGS reactor at 300°C where
a water-gas shift reaction occurs.
CO + H2O ↔ CO2 + H2 ΔHr = 41.1 kJ/mol (7)
Next, the products from the WGS reactor are cooled back down to 40°C and sent to a flash
column where the liquid water separates from the syngas. The next unit removes carbon dioxide

31
from the water-gas shift reaction. Next, the gas is compressed to 75 atm and sent to the
MEOHRXR where it reacts at 240°C to form methanol vapor. The products from this reaction
are then sent through a recycle loop with heat exchangers and compressors in order to maximize
conversion of the feedstock. The crude methanol product is separated from the recycle stream in
a flash column. The recycle ratio is set at 0.5.
Gas Separation
Before the shale gas feedstock can be sent via pipeline to the methanol plant, it must first
undergo several preprocessing steps in order to remove contaminants that are limited by pipeline
standards. The process diagram above shows that the gas is first sent through a carbon dioxide
removal unit and then through a nitrogen gas separation unit (details show in following diagram).
Next the gas is sent through a heat exchanger and a series of distillation columns in order to
remove the NGLs. The first cryogenic column has 15 stages and removes methane from the

32
higher boiling hydrocarbons. In the second cryogenic column, ethane and propane are separated
through 23 stages and purified in order to be sold for a profit. Both columns have a molar reflux
ratio of 1.5.
Nitrogen Separation
The progress diagram above shows the natural gas inlet stream entering at the left into a
separation unit. The gas is then split into a nitrogen-rich and nitrogen-free stream. Each stream
goes through another separation step and the nitrogen gas is released to the atmosphere while the
process gas is sent to a heat exchanger before it enters the demethanizer and deethanizer
columns.
33
APPENDIX B
SIMULATION STREAM DATA
CO2 CO2-FREE CO2-OUT CRUDEMEOH ETHANE FUEL
Mole Flow lbmol/hr
H2 0 30105.04 0 3.14E-03 0 0
WATER 0 94.74258 0 2.695566 0 0
CH4 0 50.14277 0 30.59069 0.078948 1597.942
N2 0 15.34547 0 2.113667 6.11E-09 1813.256
C2H6 0 3.65E-04 0 2.74E-04 1694.966 161.1872
C3H8 0 6.51E-09 0 5.77E-09 7.596043 45.7692
CO 0 15052.9 0 404.0464 0 0
METHANOL 0 0 0 12523.65 0 0
BUTANOL 0 0 0 1.762827 0 0
C2H6O-01 0 0 0 0.367579 0 0
ACETONE 0 0 0 0.6523228 0 0
O2 0 5.91E-10 0 1.73E-10 0 0
CO2 226.8504 2.680371 1737.82 55.11302 2.836543 8.357854
Total Flow lbmol/hr 226.8504 45320.86 1737.82 13020.99 1705.478 3626.513
Total Flow lb/hr 9983.641 4.85E+05 76481.11 4.16E+05 51428.08 83663.95
Total Flow cuft/hr 2270.854 4.87E+05 14864.06 8820.684 15651.81 41956.35
Temperature F 100 104 104 113 40.79148 98.31344
Pressure psia 500 572.8991 572.8991 1096.485 389.6959 500
Vapor Frac 1 1 1 0 1 1
Liquid Frac 0 0 0 1 0 0
Solid Frac 0 0 0 0 0 0
Enthalpy Btu/lbmol -1.70E+05 -15865.61 -1.70E+05 -1.00E+05 -37764.75 -16671.43
Enthalpy Btu/lb -3852.03 -1481.387 -3853.185 -3137.149 -1252.369 -722.643
Enthalpy Btu/hr -3.85E+07 -7.19E+08 -2.95E+08 -1.30E+09 -6.44E+07 -6.05E+07
Entropy Btu/lbmol-R -6.617316 1.373276 -6.929996 -53.67263 -50.37662 -16.24108
Entropy Btu/lb-R -0.1503601 0.128224 -0.1574648 -1.680739 -1.670609 -0.7039888
Density lbmol/cuft 0.0998965 0.09308 0.1169142 1.476188 0.1089636 0.0864353
Density lb/cuft 4.396426 0.9968849 5.14537 47.14053 3.28576 1.994071
Average MW 44.0098 10.70997 44.0098 31.93395 30.15465 23.07008
Liq Vol 60F cuft/hr 194.6181 38827.49 1490.9 8518.03 2313.088 3216.297

34
HEAT O2 HP-STEAM LIQ1 LIQ2 LIQ3
Mole Flow lbmol/hr
H2 0 0 5.00E-04 5.49E-06 3.41E-06
WATER 0 983.1172 4658.411 50.12463 22.50542
CH4 0 0 2.758614 0.0293126 0.017671
N2 0 0 0.0892899 9.50E-04 5.79E-04
C2H6 0 0 4.28E-05 4.54E-07 2.65E-07
C3H8 0 0 1.98E-09 2.10E-11 1.25E-11
CO 0 0 120.4079 1.205964 0.732065
METHANOL 0 0 0 0 0
BUTANOL 0 0 0 0 0
C2H6O-01 0 0 0 0 0
ACETONE 0 0 0 0 0
O2 11294 0 8.87E-12 9.43E-14 0
CO2 0 0 139.0785 3.107723 2.98E-03
Total Flow lbmol/hr 11294 983.1172 4920.746 54.46859 23.25872
Total Flow lb/hr 3.61E+05 17711.13 93462.82 1074.056 426.3779
Total Flow cuft/hr 2.74E+05 15196.14 1537.793 17.45731 7.135988
Temperature F 392 481.4268 104 104 104
Pressure psia 377.0981 572.8991 572.8991 572.8991 794.6365
Vapor Frac 1 1 0 0 0
Liquid Frac 0 0 1 1 1
Solid Frac 0 0 0 0 0
Enthalpy Btu/lbmol 2225.072 -1.01E+05 -1.23E+05 -1.25E+05 -1.20E+05
Enthalpy Btu/lb 69.53609 -5621.948 -6456.023 -6331.834 -6548.123
Enthalpy Btu/hr 2.51E+07 -9.96E+07 -6.03E+08 -6.80E+06 -2.79E+06
Entropy Btu/lbmol-R -3.181569 -13.71614 -36.97206 -37.24206 -36.49904
Entropy Btu/lb-R -
0.0994277 -
0.7613615 -1.94655 -1.888656 -1.991006
Density lbmol/cuft 0.0411957 0.0646951 3.199875 3.120103 3.259356
Density lb/cuft 1.318213 1.165502 60.77723 61.52473 59.75038
Average MW 31.9988 18.01528 18.99363 19.71881 18.33196
Liq Vol 60F cuft/hr 9689.274 284.2519 1571.962 18.21944 7.153334
35
MEOH1 MEOH2 MEOH3 MEOH4 NAT-GAS OXYGEN
Mole Flow lbmol/hr
H2 10010.28 10010.28 10010.28 10010.28 0 0
WATER 2.703435 2.703435 2.703435 2.703435 0 0
CH4 69.65949 69.65949 69.65949 69.65949 16989.82 0
N2 28.57612 28.57612 28.57612 28.57612 15.43571 0
C2H6 4.55E-04 4.55E-04 4.55E-04 4.55E-04 17.13801 0
C3H8 7.23E-09 7.23E-09 7.23E-09 7.23E-09 2.03E-03 0
CO 4369.74 4369.74 4369.74 4369.74 0 0
METHANOL 12633.69 12633.69 12633.69 12633.69 0 0
BUTANOL 1.764569 1.764569 1.764569 1.764569 0 0
C2H6O-01 0.5142695 0.5142695 0.5142695 0.5142695 0 0
ACETONE 0.6704506 0.6704506 0.6704506 0.6704506 0 0
O2 1.01E-09 1.01E-09 1.01E-09 1.01E-09 0 11294
CO2 103.4267 103.4267 103.4267 103.4267 86.0272 0
Total Flow lbmol/hr 27221.03 27221.03 27221.03 27221.03 17108.43 11294
Total Flow lb/hr 5.54E+05 5.54E+05 5.54E+05 5.54E+05 2.77E+05 3.61E+05
Total Flow cuft/hr 1.35E+05 1.33E+05 94392.71 91257.57 2.51E+05 1.70E+05
Temperature F 302 296.3073 140 113 78.8 78.8
Pressure psia 1174.806 1174.806 1121.142 1096.485 377.0981 377.0981
Vapor Frac 0.6806229 0.6665614 0.5286863 0.5216568 1 1
Liquid Frac 0.3193771 0.3334386 0.4713137 0.4783432 0 0
Solid Frac 0 0 0 0 0 0
Enthalpy Btu/lbmol -50513.42 -50762.57 -54929.36 -55412.01 -32873.68 -74.94573
Enthalpy Btu/lb -2481.549 -2493.789 -2698.489 -2722.199 -2028.208 -2.342142
Enthalpy Btu/hr -1.38E+09 -1.38E+09 -1.50E+09 -1.51E+09 -5.62E+08 -8.46E+05
Entropy Btu/lbmol-R -19.30193 -19.62616 -25.50496 -26.27779 -25.73844 -6.546079
Entropy Btu/lb-R -
0.9482367 -
0.9641652 -1.25297 -1.290936 -1.587985 -
0.2045726
Density lbmol/cuft 0.2011598 0.2054419 0.2883806 0.2982879 0.0681314 0.0664557
Density lb/cuft 4.094728 4.181893 5.87016 6.071829 1.10429 2.126505
Average MW 20.3556 20.3556 20.3556 20.3556 16.20824 31.9988
Liq Vol 60F cuft/hr 20677.17 20677.17 20677.17 20677.17 14686.11 9689.274

36
PRODUCTS PROPANE RECYC1 RECYC2 SGRECYC SHALEGAS
Mole Flow lbmol/hr
H2 10010.28 0 5005.139 5005.159 5005.159 0
WATER 2.703435 0 3.93E-03 3.93E-03 3.93E-03 0
CH4 69.65949 2.17E-11 19.5344 19.53438 19.53438 18587.84
N2 28.57612 8.79E-23 13.23123 13.23123 13.23123 1828.692
C2H6 4.55E-04 1.696676 9.03E-05 9.03E-05 9.03E-05 1874.988
C3H8 7.23E-09 479.0367 7.32E-10 7.33E-10 7.33E-10 532.404
CO 4369.74 0 1982.847 1982.753 1982.753 0
METHANOL 12633.69 0 55.02155 55.02163 55.02163 0
BUTANOL 1.764569 0 8.71E-04 8.71E-04 8.71E-04 0
C2H6O-01 0.5142695 0 0.0733452 0.073345 0.073345 0
ACETONE 0.6704506 0 9.06E-03 9.06E-03 9.06E-03 0
O2 1.01E-09 0 4.17E-10 4.16E-10 4.16E-10 0
CO2 103.4267 6.64E-07 24.15683 24.15685 24.15685 324.072
Total Flow lbmol/hr 27221.03 480.7334 7100.017 7099.943 7099.943 23148
Total Flow lb/hr 5.54E+05 21174.87 69144.32 69141.72 69141.72 4.44E+05
Total Flow cuft/hr 2.32E+05 847.739 41218.44 41096.4 50591.79 2.60E+05
Temperature F 464 160.2282 113 114.1885 248 100
Pressure psia 1102.196 391.8959 1096.485 1102.196 1102.196 500
Vapor Frac 1 0 1 1 1 1
Liquid Frac 0 1 0 0 0 0
Solid Frac 0 0 0 0 0 0
Enthalpy Btu/lbmol -45200.09 -49024.06 -14359.7 -14349.84 -13394.6 -32102.44
Enthalpy Btu/lb -2220.523 -1112.994 -1474.512 -1473.539 -1375.45 -1675.37
Enthalpy Btu/hr -1.23E+09 -2.36E+07 -1.02E+08 -1.02E+08 -9.51E+07 -7.43E+08
Entropy Btu/lbmol-R -12.66708 -76.45461 -1.157561 -1.153378 0.343989 -25.81403
Entropy Btu/lb-R -
0.6222896 -1.73575 -0.118863 -
0.1184367 0.035323 -1.347189
Density lbmol/cuft 0.1173209 0.5670772 0.1722534 0.1727631 0.140338 0.0889486
Density lb/cuft 2.388137 24.97806 1.677509 1.682428 1.366659 1.704381
Average MW 20.3556 44.04701 9.738614 9.738349 9.738349 19.1614
Liq Vol 60F cuft/hr 20677.17 670.9974 6079.568 6079.505 6079.505 21081.11
37
SG1 SG2 SG3 SG4 SYNGAS1 SYNGAS2
Mole Flow lbmol/hr
H2 29171.35 29171.35 29171.35 29171.35 35110.2 30105.04
WATER 4753.854 4753.854 95.44336 95.44336 72.24109 72.23716
CH4 52.9307 52.9307 50.17209 50.17209 69.65949 50.1251
N2 15.43571 15.43571 15.34642 15.34642 28.57612 15.34489
C2H6 4.08E-04 4.08E-04 3.65E-04 3.65E-04 4.55E-04 3.65E-04
C3H8 8.51E-09 8.51E-09 6.53E-09 6.53E-09 7.23E-09 6.50E-09
CO 16108.21 16108.21 15987.8 15987.8 17034.92 15052.17
METHANOL 0 0 0 0 55.02163 0
BUTANOL 0 0 0 0 8.71E-04 0
C2H6O-01 0 0 0 0 0.073345 0
ACETONE 0 0 0 0 9.06E-03 0
O2 6.00E-10 6.00E-10 5.91E-10 5.91E-10 1.01E-09 5.91E-10
CO2 948.9932 948.9932 809.9148 809.9148 26.83424 2.677387
Total Flow lbmol/hr 51050.77 51050.77 46130.03 46130.03 52397.54 45297.6
Total Flow lb/hr 6.39E+05 6.39E+05 5.45E+05 5.45E+05 5.54E+05 4.85E+05
Total Flow cuft/hr 4.21E+06 4.96E+05 4.95E+05 9.04E+05 3.08E+05 2.57E+05
Temperature F 2319.394 104 104 572 122.7678 104
Pressure psia 362.5943 572.8991 572.8991 572.8991 1102.196 1102.196
Vapor Frac 1 0.9036108 1 1 1 0.9996128
Liquid Frac 0 0.0963892 0 0 0 3.87E-04
Solid Frac 0 0 0 0 0 0
Enthalpy Btu/lbmol -10524.56 -29452.83 -19514.23 -16176.22 -15499.86 -15829.84
Enthalpy Btu/lb -841.2304 -2354.171 -1651.034 -1368.616 -1465.717 -1478.588
Enthalpy Btu/hr -5.37E+08 -1.50E+09 -9.00E+08 -7.46E+08 -8.12E+08 -7.17E+08
Entropy Btu/lbmol-R 13.72227 -1.877333 1.866263 6.174613 0.1023631 0.0285566
Entropy Btu/lb-R 1.096824 -
0.1500556 0.1578983 0.5224136 9.68E-03 2.67E-03
Density lbmol/cuft 0.012112 0.1028673 0.0932409 0.0510302 0.1702405 0.175956
Density lb/cuft 0.1515331 1.286964 1.102052 0.6031468 1.800281 1.883795
Average MW 12.51091 12.51091 11.8194 11.8194 10.57493 10.70606
Liq Vol 60F cuft/hr 41093.26 41093.26 39521.29 39521.29 44899.85 38820.34

38
TO-FUEL WGS SG3 WGS SG1 WGS SG2 WATER VAP
Mole Flow lbmol/hr
H2 5005.139 30105.04 30105.04 30105.04 5.09E-04 10010.28
WATER 3.93E-03 94.74258 144.8672 144.8672 4731.041 7.87E-03
CH4 19.5344 50.14277 50.17209 50.17209 2.805598 39.06879
N2 13.23123 15.34547 15.34642 15.34642 0.0908186 26.46245
C2H6 9.03E-05 3.65E-04 3.65E-04 3.65E-04 4.36E-05 1.81E-04
C3H8 7.32E-10 6.51E-09 6.53E-09 6.53E-09 2.02E-09 1.46E-09
CO 1982.847 15052.9 15054.11 15054.11 122.3459 3965.694
METHANOL 55.02155 0 0 0 0 110.0431
BUTANOL 8.71E-04 0 0 0 0 1.74E-03
C2H6O-01 0.0733452 0 0 0 0 0.1466906
ACETONE 9.06E-03 0 0 0 0 0.0181278
O2 4.17E-10 5.91E-10 5.91E-10 5.91E-10 8.96E-12 8.34E-10
CO2 24.15683 1740.5 1743.608 1743.608 142.1892 48.31366
Total Flow lbmol/hr 7100.017 47058.68 47113.14 47113.14 4998.473 14200.03
Total Flow lb/hr 69144.32 5.62E+05 5.63E+05 5.63E+05 94963.26 1.38E+05
Total Flow cuft/hr 41218.44 5.04E+05 9.60E+05 5.04E+05 1562.399 82436.88
Temperature F 113 104 613.8253 104 104.0196 113
Pressure psia 1096.485 572.8991 572.8991 572.8991 572.8991 1096.485
Vapor Frac 1 1 1 0.9988439 0 1
Liquid Frac 0 0 0 1.16E-03 1 0
Solid Frac 0 0 0 0 0 0
Enthalpy Btu/lbmol -14359.7 -21526.84 -17952.2 -21646.3 -1.23E+05 -14359.7
Enthalpy Btu/lb -1474.512 -1802.965 -1502.441 -1811.605 -6455.032 -1474.512
Enthalpy Btu/hr -1.02E+08 -1.01E+09 -8.46E+08 -1.02E+09 -6.13E+08 -2.04E+08
Entropy Btu/lbmol-R -1.157561 1.397678 6.026266 1.353006 -36.97216 -1.157561
Entropy Btu/lb-R -0.118863 0.1170615 0.5043455 0.1132347 -1.946062 -0.118863
Density lbmol/cuft 0.1722534 0.0933167 0.0490685 0.0934214 3.199229 0.1722534
Density lb/cuft 1.677509 1.114173 0.5863047 1.116264 60.7804 1.677509
Average MW 9.738614 11.93969 11.94869 11.94869 18.99845 9.738614
Liq Vol 60F cuft/hr 6079.568 40318.39 40336.61 40336.61 1597.335 12159.14

39
APPENDIX C
CALCULATIONS
Abbreviations:
FCI = Fixed Capital Investment
WCI = Working Capital Investment
TCI = Total Capital Investment
AOC = Annual Operating Cost
AATP = Annual After-Tax Profit
AFC = Annualized Fixed Cost
ROI = Return on Investment
Capital Cost: $1.3 Billion
Operating Costs:
Raw Materials
Natural Gas:
Oxygen:
[24]
Utilities
Heating:
Cooling:
Compressor Power:
Waste Water Treatment:
Labor:
Sales:

40
Process Analysis:
FCI = $1.3 billion
WCI = 0.15*FCI
TCI = FCI + WCI
AFC = (FCI – Salvage value)/Recovery Period
Salvage Value = 0.10*FCI
Recovery Period = 10 years
AATP = (Sales – AFC – AOC)*(1-Tax Rate) + AFC
Tax Rate = 30%
ROI = AATP/TCI
Preprocessing Costs:
Acid Gas Removal:
Nitrogen Removal:
C2 Credit:
C3 Credit:
Total Preprocessing Cost:

41
Cost Differential:
42
APPENDIX D
DETAILED CALCULATIONS FOR THE COMBINED HEAT AND
POWER INTEGRATION
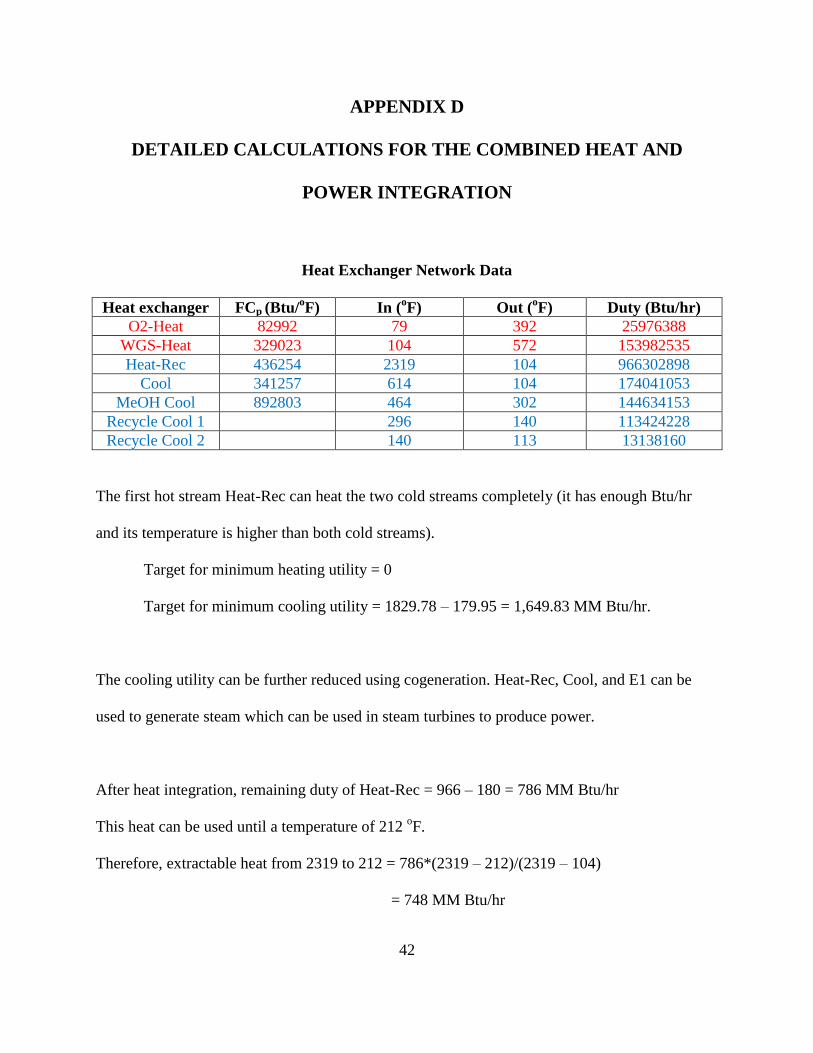
Heat Exchanger Network Data
Heat exchanger FCp (Btu/oF) In (
oF) Out (
oF) Duty (Btu/hr)
O2-Heat 82992 79 392 25976388
WGS-Heat 329023 104 572 153982535
Heat-Rec 436254 2319 104 966302898
Cool 341257 614 104 174041053
MeOH Cool 892803 464 302 144634153
Recycle Cool 1 296 140 113424228
Recycle Cool 2 140 113 13138160
The first hot stream Heat-Rec can heat the two cold streams completely (it has enough Btu/hr
and its temperature is higher than both cold streams).
Target for minimum heating utility = 0
Target for minimum cooling utility = 1829.78 – 179.95 = 1,649.83 MM Btu/hr.
The cooling utility can be further reduced using cogeneration. Heat-Rec, Cool, and E1 can be
used to generate steam which can be used in steam turbines to produce power.
After heat integration, remaining duty of Heat-Rec = 966 – 180 = 786 MM Btu/hr
This heat can be used until a temperature of 212 oF.
Therefore, extractable heat from 2319 to 212 = 786*(2319 – 212)/(2319 – 104)
= 748 MM Btu/hr

43
Similarly, extractable heat from Cool = 174*(614 – 212)/(614 – 104) = 137 MM Btu/hr.
For E1, all of its heat is extractable because its outlet temperature is high enough (302 oF).
Therefore, total extractable heat to be used in generating steam = 748 + 137 + 145 = 1,030 MM
Btu/hr.
Target for minimum cooling after steam generation/cogeneration = 1,650 – 1,030
= 620 MM Btu/hr
1 MM Btu = 1.055*106 kJ = 1.055*10
6 kWs = 1.055*10
6 /3600 = 293 kWh
Assuming that 30% of steam enthalpy will be converted to electric power:
Produced power = 0.3*1,030 = 309 MM Btu/hr = 309*293 = 90,537 kWh/hr = 90,537
kW = 90,537*7920 hr/yr = 717 MM kWh/yr
Assuming a value of $0.05/kWh:
Annual vale of electric energy = 717*106*0.05 = = $35.9 MM/yr
Produced power = 90,537 KW
Compressor details
Compressor Power requirement
COMP 14528.7
CIRC 17.7
Total power demand = 14,529 + 18 = 14,547 kW
Net power generation = 90,537 – 14,547 = 75,990 kW
Annual value of net power generation = 75,990 kW*7920 hr/yr*$0.05/kWh
= $30.1 MM/y