Process analytical technology (PAT) needs and … analytical technology (PAT) ... we will focus on...
100
ESPOO 2006 VTT WORKING PAPERS 60 Process analytical technology (PAT) needs and applications in the bioprocess industry Review Markku Knskoski, Marika Kurkinen, Niklas von Weymarn & Pentti Niemel VTT Peter Neubauer & Esko Juuso University of Oulu Tero Eerikinen Helsinki University of Technology Seppo Turunen, Sirkka Aho & Pirkko Suhonen Medipolis GMP Oy
Transcript of Process analytical technology (PAT) needs and … analytical technology (PAT) ... we will focus on...
ESPOO 2006 VTT WORKING PAPERS 60
Process analytical technology (PAT) needs and applications
in the bioprocess industry Review
Markku Känsäkoski, Marika Kurkinen, Niklas von Weymarn & Pentti Niemelä
VTT
Peter Neubauer & Esko Juuso University of Oulu
Tero Eerikäinen Helsinki University of Technology
Seppo Turunen, Sirkka Aho & Pirkko Suhonen Medipolis GMP Oy

ISBN 951�38�6612�2 (URL: http://www.vtt.fi/publications/index.jsp) ISSN 1459�7683 (URL: http://www.vtt.fi/publications/index.jsp) Copyright © VTT 2006
JULKAISIJA � UTGIVARE � PUBLISHER
VTT, Vuorimiehentie 3, PL 1000, 02044 VTT puh. vaihde 020 722 111, faksi 020 722 4374
VTT, Bergsmansvägen 3, PB 1000, 02044 VTT tel. växel 020 722 111, fax 020 722 4374
VTT Technical Research Centre of Finland, Vuorimiehentie 3, P.O.Box 1000, FI-02044 VTT, Finland phone internat. +358 20 722 111, fax +358 20 722 4374
VTT, Kaitoväylä 1, PL 1100, 90571 OULU puh. vaihde 020 722 111, faksi 020 722 2320
VTT, Kaitoväylä 1, PB 1100, 90571 ULEÅBORG tel. växel 020 722 111, fax 020 722 2320
VTT Technical Research Centre of Finland, Kaitoväylä 1, P.O. Box 1100, FI-90571 OULU, Finland phone internat. +358 20 722 111, fax +358 20 722 2320
Technical editing Anni Kääriäinen

Published by
Series title, number and report code of publication
VTT Working Papers 60 VTT�WORK�60
Author(s) Känsäkoski, Markku, Kurkinen, Marika, von Weymarn, Niklas, Niemelä, Pentti, Neubauer, Peter, Juuso, Esko, Eerikäinen, Tero, Turunen, Seppo, Aho, Sirkka & Suhonen, Pirkko Title
Process analytical technology (PAT) needs and applications in the bioprocess industry Review Abstract Process analytical technologies have been applied to manufacturing processes (pulp and paper, chemical and petroleum) for decades. Recently, the US Food and Drug Administration (FDA) has, however, re-defined the phrase and implemented it into an initiative focusing on improving several aspects of the pharmaceutical industry. The European Agency for the Evaluation of Medicinal Products (EMEA), has also been active and formed a PAT team in 2003. The PAT initiative was initially intended for traditional pharmaceutical manufacturers, but the FDA�s PAT guidance now clearly states that it applies to all manufacturers of human and veterinary drug products, as well as biologics regulated by the FDA�s Center for Drug Evaluation and Research (CDER) and the Center for Veterinary Medicine (CVM). Basically, PAT involves a fundamental shift from testing the quality of the finished drug product, to building quality into products by testing at several intermediate steps. It specifically requires that quantifiable, causal, and predictive relationships be established amongst raw materials, the manufacturing process, and final product quality. It is believed that PAT may not bring dramatic changes overnight, but years from now, it may be seen as an initiative that helped foster a period of innovation, efficiency, and expansion for the biopharmaceutical industry. In this report, the impact and potential effects of PAT on the biotechnological production of pharmaceuticals is assessed. Hence, we define BioPAT as process analytical technologies applied throughout development, scale-up and commercial scale bioprocess-based production of drug substances. In this report, we will focus on what PAT means in practice for the biotechnological manufacture of pharmaceuticals. Besides a regulatory examination, the monitoring methods and technologies available are thoroughly surveyed. These facts are then reflected against the needs for monitoring in bioprocess-based pharmaceutical production.
Keywords process industry, process analytical technologies, applications, bioprocess industry, pharmaceutical industry, drugs, regulations, analytical measurements, biomanufacturing
ISBN 951�38�6612�2 (URL: http://www.vtt.fi/publications/index.jsp)
Series title and ISSN Project number VTT Working Papers 1459�7683 (URL: http://www.vtt.fi/publications/index.jsp)
Date Language Pages October 2006 English 99 p.
Name of project Commissioned by
Contact Publisher VTT Technical Research Centre of Finland P.O. Box 1100, FI-90571 OULU, Finland Phone internat. +358 20 722 111 Fax +358 20 722 2320
VTT Technical Research Centre of Finland P.O. Box 1000, FI-02044 VTT, Finland Phone internat. +358 20 722 4404 Fax +358 20 722 4374


5
Executive summary Process analytical technologies have been applied to manufacturing processes (pulp and paper, chemicals and petroleum) for decades. Recently, the US Food and Drug Administration (FDA) has, however, re-defined the phrase and implemented it into an initiative focusing on improving several aspects of the pharmaceutical industry. The first document in support of this action, the process analytical technology (PAT) initiative, was launched by the FDA in 2002, followed up by the PAT guidance in September, 2004. The FDA�s European counterpart, the European Agency for the Evaluation of Medicinal Products (EMEA), has also been active and formed a PAT team in 2003. The PAT initiative was initially intended for traditional pharmaceutical manufacturers, but the FDA�s PAT guidance now clearly states that it applies to all manufacturers of human and veterinary drug products, as well as biologics regulated by the FDA�s Center for Drug Evaluation and Research (CDER) and the Center for Veterinary Medicine (CVM).
Basically, PAT involves a fundamental shift from testing the quality of the finished drug product, to building quality into products by testing at several intermediate steps. The former quality assurance strategy often leads to, for example, lot release delays or even recalls. The latter PAT strategy relies on a good understanding of the whole manufacturing process � from development to final formulation. It specifically requires that quantifiable, causal, and predictive relationships be established amongst raw materials, the manufacturing process, and final product quality (Winchester, 2005). It is believed that PAT may not bring dramatic changes overnight, but years from now, it may be seen as an initiative that helped foster a period of innovation, efficiency, and expansion for the biopharmaceutical industry.
In this report, the impact and potential effects of PAT on the biotechnological production of pharmaceuticals is assessed. Hence, we define BioPAT as process analytical technologies applied throughout development, scale-up and commercial scale bioprocess-based production of drug substances (including manufacturing of intermediates, APIs, and final drug products). In this report, we will focus on what PAT means in practice for the biotechnological manufacture of pharmaceuticals. Besides a regulatory examination, the monitoring methods and technologies available are thoroughly surveyed. These facts are then reflected against the needs for monitoring in bioprocess-based pharmaceutical production.
The quality of raw materials and excipients for biotechnological manufacturing of pharmaceuticals is set by regulatory requirements and suitable specifications, test methods and acceptance criteria have been developed. Appropriate test methods successfully meeting the acceptance criteria can prevent costly production problems and

6
diminish quality variations. Safety testing is amongst the important steps. Currently there are only few tests available and they are mainly for a single target. However, new fast, sensitive, complex but less time consuming methods based on the advantages of modern molecular biology, biochemistry and bio- and chemical analytics are needed. New lab-on-chip methods would be very useful, providing a comprehensive description of the quality of the production strain or the culture media, for example.
Bioprocess monitoring (fermentation monitoring) and control is still in its very infancy. Generally only �basic� measurements, like physical (temperature, weight, pressure, conductivity, gas and liquid flow, foam level, stirrer speed and power) and chemical measurements (pH, pO2, redox, outgas O2 and CO2) are performed in situ. Practically no sophisticated analytical measurements are performed in situ. The application of on- or at-line analytical methods, such as near infrared (NIR) for glucose or cell density measurement, or flow injection analysis (FIA) have been more exception than a rule.
In pharmaceutical manufacturing the down-stream processing (DSP) is usually the most expensive phase. It is thus a very interesting area for PAT implementation. The DSP unit operations are also often easier to understand than the very complex biological phenomena taking place in fermentation and cell cultures, which in turn decreases the complexity of the necessary measurement and control entities.
Various analytical technologies have been applied for fermentation monitoring, but mostly only for research purposes. NIR and infrared (IR) spectroscopy are potential for quantitative chemical analysis in bioprocesses because of the strength of the absorption bands (NIR) and the selectivity of IR spectroscopy. Both techniques can be applied for process monitoring in situ or at-line. Strong absorption due to water can be a problem in some cases, but can be overcome with careful spectrometer and calibration development. Raman spectroscopy is a complimentary technology for infrared. It is less sensitive for water interference, but generally also a less sensitive method. The potential of these technologies has not yet been applied in bioprocess monitoring even though they are already �industrial standards� in other manufacturing process monitoring applications. The use of fluorescence and fluorescent proteins (e.g. GFP) to monitor substrate, product, and side-product concentrations are highly promising technologies. Currently available GFP variants can e.g. be used to monitor intracellular and intraorganelle properties like pH. Two-dimensional fluorescence spectroscopy has been applied to measure on-line, e.g. glucose, ethanol, biomass and antibiotic concentrations, as well as succinate and nitrate. Biosensors are excellent analytical tools for various measurement needs, e.g. enzymatic measurement of glucose, sucrose, and lactate or various immunoassays. But currently their use is limited to ex situ or at least requires sampling, which could be solved with a method like FIA. The typical drawbacks of biosensors as direct in situ sensors are low dynamic range, lack of ability to survive

7
sterilization and limited lifetime. Changes in the gene expression profile are the first signs of adaptation of microbes to changing conditions or to potential process disturbances. Tools, which are suitable for high-throughput expression monitoring of process-relevant genes are under development. Good examples of this kind of technologies are TRAC (�transcriptional profiling with the aid of affinity capture�) and eMicroLisa that are already in commercialization phase.
Soft sensors are virtual sensors, typically intelligent computer programs capable of state estimation and prediction, and they can thus be helpful when dealing with bioprocesses characterized by uncertainties and complexity. Soft sensors make existing measurements more efficient or provide previously unavailable data with software systems that process the measurement signals, for example, based on other, more accessible analytes/existing measurements, laboratory analyses and a priori expert knowledge. Soft sensors are especially useful in data fusion, where measurements of different characteristics and dynamics are combined.
The production of biologicals involves processes and materials, which themselves have inherently high variability and show a sensitive response to small changes in physical and chemical parameters. So far, to guarantee (or to try to guarantee) consistent product quality, the principle aim has been to control, i.e., repeat, a process very stringently, but the impact of many factors along the multistep process line and their mutual interconnectivity makes it difficult to have low batch-to-batch variation. Therefore, better understanding of the bioprocess, and better in situ monitoring tools are required, which are pre-requisites for feed-back control and consistent quality. There are specific needs for rapid measurement in cell banking (e.g. genotypic studies, phenotypic characterization, safety detection), preparation phases (e.g. media composition, contamination), during fermentation (e.g. cell density, cellular activity, contamination control, product formation kinetics) and DSP (e.g. impurities, contamination, intermediate product stability, product quality, column lifetime).
It is necessary to develop various tools, which are specific to certain process phase, production organism, or end product, but there is a more general demand for tools to control and optimize bioprocess manufacturing; fermentation models and simulation tools in combination with metabolic flux analysis, at- or on-line analytical measurements, control strategies for dynamic bioprocesses, and supervisory software tools.
As a conclusion, there are various needs and subjects in the field of bioprocess manufacturing and control that should be further developed. Here we propose two complementary approaches to accelerate the progress and to help create a holistic view of bioprocess. This interdisciplinary approach requires firstly enhanced implementation of PAT (as its widest mean) into existing bioprocesses, and secondly development of

8
scale-down equipment (minibioreactors, sampling and measurement devices, etc.) as a tool for constructing new models and incorporating these into standard bioprocess development. We anticipate that in future the combination of these two methods will help to understand the bioprocess itself and will lead to significantly better quality and productivity in bioprocesses.

9
Acknowledgements This review project reported here is based on the experience and knowledge generated in various research and development projects at VTT Technical Research Centre of Finland, University of Oulu, Helsinki University of Technology and Medipolis GMP. We are very grateful for our colleagues for their support and help during this project. Especially, we wish to thank Jari Rautio (TRAC), Ismo Mattila (MIMS) and Kirsi-Marja Oksman-Caldentey (plant cells), all from VTT Technical Research Centre of Finland, for their help and contribution to this report. We wish to thank Bioforum Oulu for the financial support, which made it possible to write this review. Finally we would like to thank Kati Takaluoma for her help in completing this project.

10
Contents
Executive summary ...........................................................................................................5
Acknowledgements ...........................................................................................................9
Abbreviation list ..............................................................................................................12
1. Introduction................................................................................................................16
2. Regulatory framework and future activities ..............................................................21 2.1 FDA ..................................................................................................................21
2.1.1 Regulatory framework .........................................................................21 2.1.2 Cooperation with international regulatory partners .............................22 2.1.3 Future activities....................................................................................23
2.2 EMEA...............................................................................................................24
3. Biomanufacturing of pharmaceuticals .......................................................................25 3.1 Raw materials, excipients and other preparatory steps ....................................25
3.1.1 Regulatory requirements and general principles for qualification of raw materials and excipients .......................................................................25
3.1.2 Qualifying and testing of raw materials and excipients .......................26 3.1.3 Preparation of media and sterilization..................................................28 3.1.4 Strains, cell-lines and cell banks ..........................................................29 3.1.5 Pre-cultures ..........................................................................................31
3.2 Bioprocesses .....................................................................................................32 3.2.1 Microbial processes..............................................................................35 3.2.2 Animal cell processes...........................................................................38 3.2.3 Other processes ....................................................................................39 3.2.4 Process modes ......................................................................................40
3.3 Downstream processes .....................................................................................42 3.3.1 Cell harvest and disruption...................................................................42 3.3.2 Concentration .......................................................................................44 3.3.3 Final purification..................................................................................45 3.3.4 Formulation and packaging..................................................................46 3.3.5 Production processes for and purification of inclusion bodies ............47
4. Analytical measurement technologies and their applications in bioprocess measurement and control.................................................................................................49
4.1 Sampling technologies .....................................................................................49 4.2 Optical analyzers ..............................................................................................53

11
4.2.1 Near infrared spectroscopy (NIRS)......................................................53 4.2.2 Infrared and Raman spectroscopy........................................................56 4.2.3 Applications of green fluorescent protein ............................................60 4.2.4 2-D fluorescence spectroscopy ............................................................61
4.3 Biosensors ........................................................................................................61 4.4 Gene expression and proteomics ......................................................................64
4.4.1 Rapid and multiplexed mRNA expression analysis of microbial cultivations ...........................................................................................64
4.5 Mass spectrometry............................................................................................66 4.5.1 Membrane Inlet Mass Spectrometry (MIMS)......................................66
4.6 Dielectric spectroscopy ....................................................................................66 4.7 Machine vision and real-time imaging.............................................................67 4.8 Soft sensors.......................................................................................................68 4.9 Dynamic modeling and simulation...................................................................70 4.10 Requirements for on-line and in situ analyzers ................................................72
5. Process monitoring needs ..........................................................................................73
6. Conclusions................................................................................................................76 6.1 Proposals ..........................................................................................................78
6.1.1 Enhanced implementation of PAT into existing bioprocesses.............78 6.1.2 Development of the scale-down equipment approach .........................79
References .......................................................................................................................80
Useful reading .................................................................................................................99

12
Abbreviation list 2-D Two-Dimensional
µSI Microfluidic Sequential Injection
ANN Artificial Neural Network
AOX1 Alcohol Oxidase 1
API Active Pharmaceutical Ingredient
ATP Adenosine Triphosphate
ATR Attenuated Total Reflection
BHK Baby Hamster Kidney Cell
BI-LOV Bead-Injection Lab-on-Valve
BioPAT Process Analytical Technologies Applied in Bioprocesses
BST Bovine Somatropin
CBER Center for Biologics Evaluation and Research, FDA, USA
CDER Center for Drug Evaluation and Research, FDA, USA
CE Capillary Electrophoresis
CFA Continuous Flow Analysis
CFR Code of Federal Regulations
CFU Colony Forming Units
cGMP Current Good Manufacturing Practice
CPMP Committee for Proprietary Medicinal Products
CHO Chinese Hamster Ovary Cell
CVM Center for Veterinary Medicine, FDA, USA
DNA Deoxyribonucleic Acid
DO Dissolved Oxygen
DOT Dissolved Oxygen Tension
DSP Downstream Processing
ELISA Enzyme-Linked Immunosorbent Assay
EMEA European Agency for the Evaluation of Medicinal Products
EWG Expert Working Group
FDA Food and Drug Administration, USA

13
FFNN Feed Forward Neural Network
FIA Flow Injection Analysis
FPLC Fast Protein Liquid Chromatography
FRET Förster Resonance Energy Transfer
FTIR Fourier Transform Infrared
FT-Raman Fourier Transform Raman
GC Gas Chromatography
GFP Green Fluorescent Protein
GLP Good Laboratory Practice
GMP Good Manufacturing Practice
HIC Hydrophobic Interaction Chromatography
HPLC High Pressure Liquid Chromatography
IB Inclusion Body
ICH International Conference on Harmonization of the Technical Requirements for Registration of Pharmaceuticals
IgG Immunoglobulin G
IR Infrared
KOH Potassium Hydroxide
LCOF Liquid Core Optical Fiber
LE Linguistic Equation
LOV Lab-on-Valve
MCB Master Cell Bank
MEL Mannosyl Erythritol Lipid
MHLW Japanese Ministry of Health, Labor and Welfare
MIMS Membrane Inlet Mass Spectrometry
MIR Mid Infrared
mRNA Messenger RNA
MS Mass Spectrometry
NaOH Sodium Hydroxide
NIR Near Infrared
NIRS Near Infrared Spectroscopy

14
NMR Nuclear Magnetic Resonance
NN Neural Network
NWP Nominal Water Permeability
OLGA On-Line General Analyzer
ORA Office of Regulatory Affairs
OTR Oxygen Transfer Rate
PAGE Polyacrylamide Gel Electrophoresis
PAT Process Analytical Technologies
PCA Principle Component Analysis
PCR Polymerase Chain Reaction
PHB Polyhydroxybutyrate
PLS Partial Least Squares
pCO2 Partial Pressure of Dissolved Carbon Dioxide
pO2 Partial Pressure of Dissolved Oxygen (also DO or DOT)
ppm Part per Million
ppt Part per Trillion
QCM Quartz Crystal Microbalance
RAPD Random amplified polymorphic DNA
RF Radio Frequency
RNA Ribonucleic Acid
SEC Standard Error of Calibration
SEP Standard Error of Prediction
SIA Sequential Injection Analysis
SLR Simple Linear Regression
SME Small and Medium Sized Enterprise
SMLR Stepwise Multiple Linear Regression
SOM Self-Organizing Maps
SPR Surface Plasmon Resonance
STR Stirred Tank Reactor
TFF Tangential Flow Filtration

15
TLC Thin Layer Chromatography
TMP Transmembrane Pressure
TRAC Transcriptional Profiling with the Aid of Affinity Capture
TRF Time Resolved Fluorescence
USP-NF United States Pharmacopoeia-National Formulary
VICH International Cooperation on Harmonization of the Technical Requirements for Registration of Veterinary Medicinal Products
WCB Working Cell Bank
WIP Work in Progress
16
1. Introduction The global pharmaceutical market is currently estimated at about $500 billion (Anonymous, 2005a). In 2003, almost 50 percent of the global market value was generated in North America, whilst about 25 percent was generated in the EU. Japan was the third largest pharmaceutical market generating about 10 percent of the global market value. In 2004, the 10 biggest pharmaceutical companies were estimated to generate 41 percent of the total market value (Anonymous, 2005b). This number is, however, decreasing � in 2000 the equivalent percentage was 56 percent. For a few years now, the global market value growth has remained at the untypical, single-digit level (Anonymous, 2005b). The major drivers behind this development are believed to be the many patent expiries, weak pipelines and increasingly challenged public image (Jarvis, 2005). In the US, the pharmaceutical market value growth is expected to remain mediocre through 2007 (van Arnum, 2005).
From a company activity perspective, the pharmaceutical industry can be divided into the following four general phases:
1. R&D (target identification, discovery of active pharmaceutical ingredients (APIs), pre-clinical and clinical)
2. Manufacture of the API for either clinical trials or for the commercial final drug product
3. Manufacture of the final drug product (hereafter called �Formulation�)
4. Marketing & sales of the drug.
It has been estimated (Cini & Schneider, 2004) that manufacturing consumes on average about 25 percent of the turnover by pharmaceutical companies. 15�20 percent of the turnover is typically channeled into R&D (Anonymous, 2005c).
The pharmaceutical companies can roughly be divided into the following three categories:
a) Big pharma � i.e. companies that handle all four phases presented above and are able to bring new products to the market alone
b) Small and Medium Sized Enterprises (SME) � i.e. companies that work in collaboration with other pharmaceutical companies or focus only on a small segment of a certain phase (incl. service companies like phase 1/2 contract manufacturers and companies that organize clinical trials)
c) Manufacturers and marketers of generic pharmaceuticals (to date manu-factured only by chemical synthesis).

17
For this report phase 2, �Manufacture of the API�, is of most interest. In phase 2, four methods of manufacture are generally used:
a) Extraction or purification from natural sources (e.g. plant, human and animal-derived products)
b) Chemical synthesis
c) Fermentation and cell culture, i.e. utilizing the metabolism of microbial, animal or plant whole cells (manufacture utilizing, e.g., plants, transgenic animals, tissues are also under development)
d) Biotransformation, i.e. enzyme catalysis.
The typical steps of fermentation-, cell culture- or biotransformation-based manufacturing processes are shown in Figure 1.
Preparations
-raw material treatment-sterilization
Manufacture of the API
-fermentation-cell culture, or-biotransformation
Recovery andpurification of API
Formulation of final drug product
Figure 1. Biotechnological manufacturing of pharmaceuticals.
The APIs manufactured by chemical synthesis or biotransformation are chemical molecules � often referred to as small molecules. On the other hand, APIs manufactured by extraction, fermentation or cell culture are usually either small molecules or biological molecules � or so-called biologics (i.e. recombinant proteins, blood products, genes, cells and tissue). The materials added to the APIs in the formulation step to make the final marketed drug product are usually chemicals.
Small molecule drugs are historically the most important class used for treatment of human diseases. Biologics are, however, gaining importance fast. In 2003 and 2004, about 35 percent and 40 percent, respectively, of all new drug products (new molecular entities) approved by the Food and Drug Administration (FDA) for marketing in the US

18
were biologics (Little, 2004). In 2002, it was estimated that of all human drugs for sale in the US about one quarter were already small molecules or biologics manufactured by biotechnological means, i.e. by fermentation or cell culture (Berry, 2002). In comparison, within the EU up to about 35 percent of all human drugs approved for marketing since 1995 were so-called biopharmaceuticals, i.e. recombinant therapeutic proteins and monoclonal antibody or nucleic acid-based products used as therapeutics (Walsh, 2003). The importance of biopharmaceuticals and biotechnology-derived small molecule drugs will evidently grow in the future, as a significant part of all drug candidates currently in clinical trials in the USA and EU are developed or discovered by biotechnology companies (Berry, 2002, Little, 2004). Of the biotechnological drug candidates in development in the US, the majority fall into the product categories of monoclonal antibodies and vaccines (Anonymous, 2005d). In turn, the most important therapeutic categories are cancer and related conditions, as well as infectious diseases. (Note: in some cases the manufacture of an API involves a combination of several different manufacturing methods, e.g. biotransformation and chemical synthesis.)
Rejected manufacturing batches, rework, and lengthy investigations increase the pharmaceutical manufacturing costs by as much as 10 percent (Cini & Schneider, 2004). For a pharmaceutical company with a $1 billion in annual turnover, every 1 percent reduction in manufacturing cost (assumed to be 25 percent of turnover) translates into savings of $2.5 million a year. Why is so little done to develop the manufacturing processes and to achieve these savings? The answer is simple: the current regulations controlling drug manufacturing in most countries require that whenever major changes are made to manufacturing processes, the processes have to be re-validated. In some cases the changes even have to be pre-approved by the authorities, thus causing significant costs and time hold-ups. As a consequence of these change control requirements and the way manufacturers have traditionally validated their processes, it is not usually allowed to make real-time changes to process parameters in the pharmaceutical industry (i.e. make process parameter changes based on rapid analysis results during the run).
The FDA and European Agency for the Evaluation of Medicinal Products (EMEA), however, want to change the situation. In August 2002, the FDA launched the Process Analytical Technology (PAT) initiative, which it says is �a framework for allowing regulatory processes to more readily adopt state-of-the art technological advances in drug development, production and quality assurance�.
In September 2004, the FDA published the �Guidance for Industry PAT � A Framework for Innovative Pharmaceutical Development, Manufacturing, and Quality Assurance�, which has empowered the industry to apply process analytics to pharmaceutical manufacturing processes (Anonymous, 2004a). Even though PAT is currently well

19
established terminology in the pharmaceutical industry, there are still different opinions on its impact on industry and its implementation is therefore still on its way. The main factor causing slow implementation is probably uncertainty about the regulatory consequences. Even though the guidance itself doesn�t give the exact answer to the question of how to apply PAT, it nonetheless shows the direction. EMEA has also undertaken similar initiatives, resulting in the establishment of the EMEA PAT team in 2003.
What then, does PAT mean? The FDA has described the term �Process Analytical Technologies (PAT)� as �a system for designing and controlling manufacturing through timely measurements (i.e. during processing) of critical quality and performance attributes for raw and in-process materials and also processes with the goal of ensuring final product quality�. The PAT initiative focuses on building quality into the product and manufacturing processes, as well as continuous process improvement (Anonymous, 2004a).
Process monitoring or measurement is one of the key issues when applying PAT to improve processing efficiency and guarantee end-product quality. Several definitions for process monitoring methods have been used. For clarity in this report we use those definitions stated in FDA guidance for different measurements strategies as following:
• At-line: Measurement where the sample is removed, isolated from, and analyzed in close proximity to the process stream.
• On-line: Measurement where the sample is diverted from the manufacturing process, and may be returned to the process stream.
• In-line: Measurement where the sample is not removed from the process stream, and can be invasive or non-invasive.
Who should apply PAT? The FDA�s guidance addresses new and abbreviated new (human and veterinary) drug application products and specified biologics regulated by Center for Drug Evaluation and Research, FDA, USA (CDER) and Center for Veterinary Medicine, FDA, USA (CVM), as well as non-application drug products. Within this scope, the guidance is applicable to all manufacturers of drug substances, drug products, and specified biologics (including intermediate and drug product components) over the life cycle of the products (references to 21 CFR [Code of Federal Regulations] part 211 are merely examples of related regulation). Within the context of this guidance, the term manufacturers includes human drug, veterinary drug, and specified biologic sponsors and applicants (21 CFR 99.3(f)).
20
The potential benefits to industry include the following:
• better understanding of processes
• batch-to-batch reproducibility
• fewer batch failures
• regulatory relief
• increased operating efficiency
• cycle time reduction
• close coupling of batch steps to produce semi-continuous operations
• the ability to use of larger scale processing equipment
• greater utilization of production equipment
• minimized storage space required for Work in Progress (WIP)
• reduced risk of processing errors
• reduced risk of product contamination, byproducts and product modification
• minimized variability using on-line measurements.
We define �BioPAT� as process analytical technologies applied throughout development, scale-up and commercial scale bioprocess-based production of drug substances (including manufacturing of intermediates, APIs and the final drug products). In this report, we will focus on what PAT means in practice for the biotechnological manufacture of pharmaceuticals.
The aim of this study is to:
• get a technological insight of the status of the Process Analytical Technology (PAT) Initiative with regards to pharmaceutical bioprocesses
• study the regulatory framework and future activities in Europe and the USA
• survey the needs for monitoring bioprocesses for pharmaceutical production
• survey the monitoring methods and technologies available
• find key players for collaboration in Finland and globally (both research and industrial)
• find key ongoing projects.
Moreover, the aim of this study is to analyze the situation in BioPAT and propose actions, build up a consortium for future actions and also to find funding possibilities.

21
2. Regulatory framework and future activities
2.1 FDA
2.1.1 Regulatory framework
In August 2002, the FDA announced a significant new initiative, the Pharmaceutical Current Good Manufacturing Practices (cGMPs-initiative) for the 21st Century, to enhance and modernize the regulation of pharmaceutical manufacturing and product quality. The initiative was intended to modernize the FDA�s regulations for pharmaceutical quality for veterinary and human drugs.
Early in the initiative, a number of multidisciplinary working groups were formed, comprising FDA experts from various areas of scientific and regulatory practices. As a result of the work of these groups the FDA has assessed current practices, as well as available new tools for enhancing manufacturing science, and created a new framework for the regulatory oversight of manufacturing.
One aspect of this new framework is implementation of a new risk based quality assessment system, which should reduce the need to submit manufacturing supplements and increase first-cycle approval of new drug applications. The system should also encourage manufacturers to implement new technologies, such as PAT, and facilitate continuous manufacturing improvements via implementation of an effective quality system.
To help and encourage pharmaceutical manufacturers to implement new process analytical technologies in 2004 the FDA published the �Guidance for Industry PAT � A Framework for Innovative Pharmaceutical Development, Manufacturing, and Quality Assurance�. The guidance was developed through a collaborative effort involving CDER, CVM, and the Office of Regulatory Affairs (ORA).
The goal of PAT according to the guidance is to enhance understanding and control of the manufacturing process, which is consistent with current drug quality systems: quality cannot be tested into products; it should be built-in or should be by design. Consequently, the tools and principles described in the guidance should be used to gain process understanding and can also be used to meet the regulatory requirements for validating and controlling manufacturing.
In the PAT framework, these tools can be categorized according to the following:
• multivariate tools for design, data acquisition and analysis • process analyzers

22
• process control tools • continuous improvement and knowledge management tools.
Ideally, PAT principles and tools should be introduced during the development phase. The advantage of using these principles and tools during development is that a better understanding of the biomanufacturing process can be used to create opportunities to improve the mechanistic basis for establishing regulatory specifications.
2.1.2 Cooperation with international regulatory partners
As international cooperation has been one of guiding principles of the cGMP initiative that was announced in 2002, the FDA�s international strategy to improve the quality of pharmaceutical products includes enhancement of relevant international harmonization activities and increased sharing of regulatory information with counterpart authorities in different countries:
• CDER and Center for Biologics Evaluation and Research, FDA, USA (CBER) actively collaborate with other regulatory authorities via The International Conference on Harmonization of the Technical Requirements for Registration of Pharmaceuticals (ICH).
• CVM is a participant in a separate International Cooperation on Harmonization of the Technical Requirements for Registration of Veterinary Medicinal Products (VICH).
• CVM also attends ICH meetings to facilitate FDA harmonization for human and animal pharmaceutical products.
ICH has agreed to work on a harmonized plan to develop a pharmaceutical quality system based on an integrated approach to risk management and science. ICH has established two Expert Working Groups (EWGs):
• The first (ICH Q8 EWG) is developing guidance describing the suggested contents for the Pharmaceutical Development section of a regulatory submission. The PAT concept and principles are included in the guidance.
• The second working group (ICH Q9 EWG) is trying to define the principles by which risk management will be integrated into decisions by regulators and industry regarding quality, including cGMP compliance.
While Q8 and Q9 continue to progress, ICH will begin to pursue Q10, a document that will cover life-cycle management for process and system control.
23
2.1.3 Future activities
According to the FDA the PAT process has been successful in bringing a systems perspective and team approach to facilitate innovation. The PAT team has approved one application that included a joint team inspection and has recently completed a preoperational visit for a major application. Several PAT proposals have been received, and it is expected that many of these will be received as applications in the near future. The PAT framework is supported by the ASTM International Technical Committee E55: Pharmaceutical Applications of Process Analytical Technology. Furthermore the definition of PAT, as well as other concepts, is being incorporated into the ICH Q8 guidance (Pharmaceutical Development).
The next steps in the PAT process include:
• Workshops will be held in the three ICH regions (USA, Europe, Japan).
• The PAT process will be incorporated into FDA�s own quality system.
• The FDA will continue to participate in the ASTM E55 Committee to support development of standards consistent with the PAT framework.
• The FDA will help to strengthen the emerging support structure in scientific societies and associations.
• CBER (as an observer) and a Pharmaceutical Inspectorate member from Team-Biologics will join the PAT Steering Committee.
• The second PAT team will be selected (to include Office of Biotechnology, Compliance and ORA Team-Biologics cGMP Inspection staff).
• Teambuilding, training, and certification of the second team will begin.
• Invitations will be extended to Health Canada, the Japanese Ministry of Health, Labor and Welfare (MHLW) and EMEA to participate in the second training program.
• Sharing lessons learned and training materials with Health Canada, MHLW and EMEA.
• The PAT team will continue its education and training.
• The PAT team and Team-Biologics will collaborate to identify best practices and lessons learned; recommendations will be sought on how to develop a team approach between Product Specialists and the Pharmaceutical Inspectorate.
24
2.2 EMEA
In order to support the PAT activities in the EU, an EMEA PAT team was created in November 2003. The EMEA PAT team has the aim of reviewing the implications of PAT and ensuring that the European regulatory framework and authorities are prepared for and adequately equipped to conduct thorough and effective evaluations of PAT-based submissions. (Anonymous, 2005g.)
The general objective of the team is to build up a forum for dialogue and understanding between the Quality Working Party and Ad Hoc Group of GMP (Good Manufacturing Practice) Inspection Services. In this way, they will prepare a harmonized approach in Europe for assessment of applications and inspections of systems/facilities, including new approaches to manufacturing and control of active substances, medicinal products, packaging material etc.
Some of the more specific objectives of the team are as follows:
• agree definitions of PAT
• review the legal and procedural implications of PAT for the EU regulatory system
• review and comment on documents produced by other organizations
• review related international procedures and approaches
• develop a procedure for assessment of PAT related applications involving a coordinated approach by assessors and inspectors.
The EMEA PAT team believes that the current regulatory framework in Europe is open to the implementation of PAT in marketing authorization applications. Reference is made to the existing guidance on Development of Pharmaceutics (CPMP/QWP/054/98), the Note for Guidance on Parametric Release (CPMP/QWP/3015/99) and Annex 17 to the EU GMP Guide. In addition, the ICH Guideline on Pharmaceutical Development (ICH Q8), which is now under consultation, also includes provisions on the use of PAT applications.
However, in order to clarify the EMEA PAT team�s position on a number of issues raised by the Industry, a �Questions and Answers� document will be published shortly. The PAT team will regularly update this document to reflect new developments and to include accumulated experience.

25
3. Biomanufacturing of pharmaceuticals
3.1 Raw materials, excipients and other preparatory steps
3.1.1 Regulatory requirements and general principles for qualification of raw materials and excipients
GMP regulations and good business practices require that pharmaceutical raw materials (and also their suppliers) have to be qualified both initially and periodically.
Accordingly, manufacturers of API�s and finished pharmaceutical dosage forms have to establish the identity, purity and quality of raw materials and excipients with the use of suitable specifications, test methods and acceptance criteria. (Anonymous, 1998, 2001,
2003a, 2005f, Shadle, 2004). Similar requirements can be found in the US Code of Federal Regulations, ICH guidance documents, European GMP regulations, and also within ISO.
Raw material testing ensures that the raw materials used in pharmaceutical products are suitable for their intended use. Conducting raw material analysis using appropriate test methods and successfully meeting the acceptance criteria can prevent costly production problems and diminish quality variations (Kupp, 2003).
Patient safety is a key reason for these requirements, dating back to several unfortunate events within the pharmaceutical and food industries, and regulatory requirements in the pharmaceutical industry have evolved over time to reduce the probability, or risk, of such events (Shadle, 2004).
Legally, a pharmaceutical firm takes on full responsibility for the quality of the raw materials it purchases and uses in a GMP manufacturing process. Consequently, it is in the business interest of a firm to exercise reasonable oversight of suppliers and test laboratories, and to characterize raw materials appropriately. Some of the most important actions a firm takes to reduce risk include setting specifications that define and control the raw materials, testing to verify identity and quality, and establishing systems to prevent the use of unsuitable materials (Shadle, 2004).
Raw material qualification should be carefully defined in GMP procedures and placed under strict change control. Raw materials deemed �critical� require testing of more supplier lots for more attributes, and extensive supplier evaluation, before qualification is achieved. The critical status of a raw material is related directly to its intended use in the process and to the potential risk created by a quality deficit in the raw material that may adversely impact the product�s identity, purity, potency, toxicity, or efficacy (Anonymous, 1999a, 1999b, Shadle, 2004). A raw material may be critical to one

26
process but not to another. Each firm must identify which materials are critical and justify the choices made and the additional oversight required.
3.1.2 Qualifying and testing of raw materials and excipients
At the moment pharmacopoeial and formulary monographs such as the US Pharmacopoeia-National Formulary (USP-NF), the European Pharmacopoeia and the Japanese Pharmacopoeia provide standardized test methods for the most common and widely used materials. The primary function of pharmacopoeial monographs is to establish minimum standards that set the identity, purity and quality requirements for raw materials.
Manufacturers take various approaches to raw materials testing compliance. Some qualify a raw materials supplier by performing an initial detailed vendor audit followed by an annual qualification consisting of full pharmacopoeial monograph testing on three lots of material. If the qualification lots test successfully, then subsequent material shipments will require only monograph identification testing. However, companies that take a more conservative approach to raw material release require full monograph testing for each lot of supplied material (Kupp, 2003).
The most common pharmacopoeial raw material tests include titrations (purity assays), loss of drying (moisture content, organic volatile impurities), Karl Fisher titration (moisture content), infrared (IR) spectrophotometry (identification), high pressure liquid chromatography (HPLC) (assay, impurities), gas chromatography (GC) (assay, impurities) and thin layer chromatography (TLC) (identity, impurities). (Kupp, 2003.)
To expand the number and variety of raw materials and excipients that can be tested, additional instrumentation can be used, including (Kupp, 2003):
• flame atomic absorption spectrophotometers
• graphite furnace atomic absorption spectrophotometers
• elemental analyzers
• differential scanning calorimeters
• thermogravimetric analyzers.
Besides standard pharmacopoeial tests other and even more meaningful functional tests should also be considered when setting acceptance criteria for materials. Such functional test methods could include, for example, optical microscopy, specific surface area, particle size distribution and density (bulk and tapped). Meaningful functionality tests can assist formulation scientists in the selection of excipients during product development and would help ensure consistent manufacture of the product (Kupp, 2003).

27
The raw materials used may also lead to microbiological contamination. Therefore, the control of bioburden, endotoxins and viral contamination, particularly in the case of biological materials of animal origin, is of special regulatory concern. Emerging pathogens, increased detection capabilities and evidence of cross-species infectivity lead to special scrutiny with regard to animal-origin materials. The utilization of animal-origin raw materials is not absolutely precluded at the moment by regulatory agencies, but rather, their use imposes the need for specific risk assessment. As one example of this, the Committee for Proprietary Medicinal Products (CPMP), which is part of the EMEA, has published a guidance for use of bovine serum in the manufacture of medicinal products (Anonymous, 2003b). The Note for Guidance establishes the general control requirements for utilization of bovine serum in the manufacture of a human biological medicinal product (Hansen, 2003).
The risk of viral contamination is a feature common to all biotechnology products derived from cell lines. Such contamination could have serious clinical consequences and can arise from the contamination of the source cell lines themselves (cell substrates) or from adventitious introduction of a virus during production. To date, however, biotechnology products derived from cell lines have not been implicated in the transmission of viruses. Nevertheless, it is expected that the safety of these products with regard to viral contamination can be reasonably assured only by the application of a virus testing program and assessment of the virus removal and inactivation achieved by the manufacturing process, as outlined below. Three principal, complementary approaches have evolved to control the potential viral contamination of biotechnology products (Anonymous, 1997a):
• selecting and testing cell lines and other raw materials, including media components, for the absence of undesirable viruses, which may be infectious and/or pathogenic for humans
• assessing the capacity of the production processes to clear infectious viruses
• testing the product at appropriate steps of production for absence of contaminating infectious viruses.
Inactivation processes need to be proven effective, and validated. Proper validation will include both DNA and RNA viruses, as well as single- and double-stranded configurations. The coatings of virus exteriors � enveloped or nonenveloped � have been shown to behave differently to inactivation treatments; thus, inclusion of each type of virus is required (Hansen, 2003). A comprehensive virus validation will adhere to the CPMP�s Note for Guidance on Virus Validation Studies: the Design, Contribution and Interpretation of Studies Validating the Inactivation and Removal of Virus (Anonymous, 1996).
28
3.1.3 Preparation of media and sterilization
From a regulatory point of view, critical parameters in media preparation can be considered to be control and monitoring of quality, identity (see Chapters 3.1.1 and 3.1.2) and amount (e.g. calibrated balances) of raw materials used and physical parameters (e.g. pH, temperature, mixing speeds, mixing times etc.).
Of special regulatory concern is the sterility of the medium prepared. Most frequently media are sterilized by heat or filtration even though other methods exist and can be used (e.g. microwave sterilization). In the pharmaceutical industry the sterilization methods used should typically be validated before production and release of the product for clinical trials to prove the consistency and the effectiveness of the method selected. A detailed review of regulatory expectations and guidelines (Anonymous, 2003c, 2004b) concerning validation of sterilization methods in the pharmaceutical industry is beyond the scope of this document.
The heat sterilization of media can be performed in situ (e.g. in fermenters or tanks) or if necessary in separate containers using autoclaves and added aseptically into fermenters thereafter. At the moment regulatory authorities expect that in either case physical measurements (e.g. temperature, pressure), physical indicators (e.g. Bowie Dick in autoclaves) and microbiological indicators (e.g. Bacillus stearothermophilus strips or ampoules) are used during the validation phase to prove the effectiveness of the sterilization process. During validation it should be demonstrated using multiple measurement and indication points that sterilization conditions are reached throughout the sterilization vessel and the contents of the vessel (e.g. media in a fermenter or load in an autoclave chamber). As for heat sterilization in autoclaves there are further requirements concerning heat distribution both in empty and loaded chambers (Anonymous, 2003c, 2004b).
Sterilization by filtration is usually performed using 0.2 or 0.1 µm rated sterilizing grade filters. Especially in the aseptic production of final dosage forms, microbiological challenge testing, extractables, compatibility (e.g. physical suitability, chemical resistance, and adsorption) and integrity testing should be considered. These tests are not all necessarily applicable to medium preparation and filtration during the manufacturing of active pharmaceutical ingredients but at least integrity testing of the filter plating after filtration should be considered (Anonymous, 2003c, 2004b).
An important and sometimes underestimated point, especially during the development of bioprocesses, is the effect of sterilization on the concentration of ingredients, and their possible chemical modification; especially during heat sterilization of complex additives. Small variations in the amount of added water, the sterilization time and, for
29
example, the pH, may result in comparatively large effects on growth during fermentation by their influence on the effective concentration of glucose, ammonia, amino acids (e.g. tryptophan) and vitamins. Major process variations may be related to such variations.
3.1.4 Strains, cell-lines and cell banks
The use of living cells or organisms in the production of biopharmaceutical products represents a potential contamination risk. Without proper control they could potentially introduce infectious, tumorigenic or other possibly harmful agents to the production process. Therefore, the global regulatory agencies require that cells used in the manufacture of biopharmaceutical products must be banked and characterized to ensure the highest possible standards.
Characterization and safety testing of cell substrates are the first steps in ensuring the safety of biopharmaceutical products. The objective of characterization is to confirm the identity and purity of the cell substrate. The cell line is then tested for safety to ensure that it is free of adventitious agents, which could potentially contaminate the biopharmaceutical product. All the tests required to prove the suitability of the cell line must be performed to good laboratory practice (GLP) or GMP standards using validated test procedures and according to the international guidelines (Anonymous, 1993, 1995, 1997a, 1997b).
The detailed procedures for the treatment of strains/cell-lines for bioprocesses largely guarantee the continuous success of a biomanufacturing organization. The appropriate reception, storage and regular control of the cultures, in general, is highly laborious and time intensive.
The test regime used for cell line characterization and safety testing depends upon the specific production system, e.g. a prokaryotic or eukaryotic cell line. The following provides one example of test regimes for the characterization of prokaryotic and eukaryotic cell lines:
Prokaryotic Cell Lines
• Identity of the organism (growth analysis on selective media, biochemical characterization, random amplified polymorphic DNA (RAPD) analysis)
• Identity of the plasmid (plasmid preparation and quantification, restriction enzyme pattern, sequencing the coding region)

30
• General testing (determination of plasmid insertion, determination of plasmid copy number)
• Purity (microbiology, absence of bacteriophages)
• Genetic stability (selection of identity tests).
Eukaryotic Cell lines
• Identity (isoenzyme pattern analysis, DNA sequencing, Southern blot analysis)
• Purity testing (sterility, mycoplasma, in vitro and in vivo assays for adventitious viruses, assays for retroviruses, assays for specific viruses, transmission electron microscopy, reverse transcriptase activity).
There are normally two cell banks that are produced, the Master Cell Bank (MCB) and the Working Cell Bank (WCB). Aside from deciding on the appropriate conditions to develop/build and propagate the MCBs and WCBs, and guaranteeing their activity during long term storage under appropriate conditions, without unforeseen disturbances, this work also includes the decision about which parameters are measured with which methods. At this stage, certain previously defined parameters are regularly controlled, mostly connected to the viability, productivity, and contamination status.
Safety testing is a most important step, which not only affects the individual process, but, by inappropriate control (especially but not exclusively of new strains) may jeopardize and interrupt the activities of whole facilities for long periods of time. Currently there are few tests available and they are mainly for a single target. However, new fast, sensitive, complex and less time consuming methods based on the advantages of modern molecular biological and biochemical analytical testing have a promising future. As the analysis is multifactorial, new lab-on-chip methods would be very useful in this step of the process, providing a comprehensive description of a new production strain in terms of its genetic basis, contamination status and viability, and also for each single stock culture at the time of withdrawal to the inoculum. As a method that could cover the testing of a large number of possible risk factors (e.g. contaminants) and parameters, the application of commercially available DNA- and protein arrays would here be very advantageous.
Each cell bank requires a different testing regime. In addition to testing of the cell banks, the Post-Production or End-of-Production Cells, as well as bulk harvests, require specific tests to be performed.
31
Typical characterization and qualifying tests for MCBs/WCBs are the following:
• genotypic characterization by DNA fingerprinting
• phenotypic characterization (nutrient requirements, isoenzyme analysis, growth behavior, morphology)
• reproducible production of desired product
• molecular characterization of vector/cloned fragment (restriction enzyme mapping, sequence analysis)
• assays to detect viral contamination
• reverse transcriptase assays to detect retroviruses
• a sterility test and mycoplasma test to detect other microbial contaminants.
3.1.5 Pre-cultures
Pre-cultivation is the first cultivation step. In contrast to the steps involved in cultivation, which are performed under controlled and well-documented conditions, pre-cultivation, which is mostly performed in real batch cultures, mostly as shake flask cultures, is still a mysterious step. During the cultivations environmental parameters such as pH and oxygen steadily change, substrates decrease and toxic side products accumulate. Normally information is obtained neither about the state of the culture at the end of the pre-cultivation, nor about the viability and variations in the productivity caused by this cultivation step. The only analysis that is sometimes performed is plating of the final culture, and the result is usually not available before the process has been finished.
The major problem is that currently no practical and easy-to-use systems, which allow controlled cultivation, are available on the market at this stage. Also, in many cases the effect of variations in the pre-culture conditions, e.g. relatively small variations in the time of the culture or the effect of disturbances from short incubator stoppages, are neglected. In many cases it is simply not recognized that changes in the process arise from this process phase, although it is generally known.
Therefore there is an important need to develop on-line monitoring and validation tools for this step, which later may be completed by control tools. It is important that these tools should by themselves be easily to validate, be low cost and adaptable to the large variety of widely applied pre-cultivation practices and equipment.

32
One activity in this direction is the wireless SENBIT monitoring and control system currently being developed by the Bioprocess Engineering Laboratory of the University of Oulu (Vasala et al., 2006). This system, being independent of the applied incubator systems, allows the analysis of pO2 (partial pressure of dissolved oxygen, also DO) and pH with standard process electrodes in shake flasks and will be further completed with a process control toolbox (available as prototype).
3.2 Bioprocesses
The bioprocess, generally associated with cultivation in appropriate bioreactors (fermenters), includes the cultivation of the living biocatalyst to a high density and (usually) consecutive production of the target product. In contrast to the pre-cultivation steps discussed above, this step can be reliably controlled. Current bioreactors are equipped with a number of physical (temperature, weight, pressure, gas and liquid flow, foam level, stirrer speed and power) and chemical sensors (pH, pO2, redox, outgas O2 and CO2) and also allow most parameters to be controlled by a preset regime, or the values of other parameters (see Figure 2). In general, most of these parameters have been measurable for decades and there has been little development, with exception of advances in the stability of electrode measurements. The measurement of other on-line parameters such as cell density and medium parameters is, although usually possible, not standard.
Figure 2. Commonly measured and controlled parameters of bioreactors (Sonnleitner, 2000).
33
In the following section the generally measured parameters and their importance for the bioprocess are described.
Temperature is of critical importance in biological processes, variation of even 1ºC may have a big effect on reactions. This makes accurate and stable temperature control very important. Resistance thermometers are quite common measurement devices, and thermoelements are also used. Temperature is usually controlled using water jackets around the bioreactor or water piping inside it. External heat exchangers can also be used (these require an extra pump). From a cleaning perspective, the water jacket system is usually preferred.
Optimal cell growth and productivity are heavily dependent on the correct pH. As the cells� metabolism typically acidifies the growth medium and metabolic side products may accumulate, the control of pH is also commonly arranged. In bioreactors pH is typically measured with glass electrodes as they are steam-sterilizable but suffer from low mechanical stability. Nowadays gel glass electrodes are becoming more common than liquid glass electrodes. Optical sensors based on, for example, absorbance or fluorescence from pH sensitive dyes have also been developed but their applicability is still limited by the typically narrow operating range and their poor long-term stability (sensor drift).
pH control is often related to the addition of ammonia nitrogen, which is generally added as ammonia base as a 10 to 28% solution. Using ammonia feeding based on pH control, the ammonium concentration in the reactor can be kept approximately constant, below the toxic level of about 3 to 5 g per liter (for Escherichia coli), thus avoiding this limitation as well. This type of regulation works well with phosphate buffered mineral salt media, because, stoichiometrically one H+ ion is released into the growth medium for each ammonia molecule consumed. In cases with complex media, however, it may often be advantageous to replace some of the ammonia feeding with other bases, such as potassium hydroxide (KOH) and sodium hydroxide (NaOH). In cell cultures the control of pH is mostly connected to addition of gaseous carbon dioxide, which is pulse added to the reactor and often delivered like other gases using silicone tube systems. Bicarbonate addition is also commonly used for pH control of cell cultures. In high cell density fermentations pH control can be also connected to the addition of complete medium (the pH-stat principle).
Gases, such as O2 and CO2, and their concentrations are important parameters affecting both growth and biosynthesis. Oxygen may often be the limiting factor for cell growth (aerobic cells use oxygen as an electron acceptor). Carbon dioxide is a product mainly formed in cell respiration, but also as a result of other metabolic activity. CO2 influences both intracellular and extracellular pH.
34
Oxygen and carbon dioxide in the exhaust gas is usually measured with gas flow meters combined with either mass spectrometry (MS) or infrared absorption measurement. Infrared oxygen analyzers are sold by, for example, Monicon, Datex, and Godart, whilst Omnistar is a market leader in MS instruments. Magellan Instruments has an instrument that measures both carbon dioxide by infrared absorption, and oxygen electrochemically. Carbon dioxide can also be measured by acoustic methods (Innova).
Dissolved oxygen (pO2, DO or DOT) is commonly measured electrochemically using in situ polarographic or galvanic sensors. Polarographic sensors use an external voltage, while galvanic sensors do not require external voltage. The common in situ measurement of dissolved carbon dioxide (pCO2) is essentially a pH measurement performed inside a diffusion-selective sensor. Fluorescence-based in situ optical sensors have also been developed for both dissolved oxygen and carbon dioxide (e.g., PreSens by Precision Sensing, 8500 by YSI and InSite). The PreSens instrument is also available for shake flasks and microtiter plates.
Cell mass is usually measured optically by light absorbance (optical density or turbidity) or alternatively by wet or dry weight. Most commonly a sample is taken from the bioreactor and the optical density is measured with a spectrophotometer. The result cannot be directly correlated to number of cells or cell mass. Plating (amount of colony forming units, CFU, as a result) and microscopy cell counts are also possible, though these methods consume more time and labor. Flow cytometry and electronic counting, as with a Coulter counter, are alternative, accurate measuring methods.
On-line-sensors to follow the cell density have been developed by many suppliers. They are either sampling based, for which sample collecting modules have been developed, and the analysis is then performed by a flow injection analysis (FIA)-like technique, most often spectrophotometrically. In situ sensors are more and more widely used. However, most of them lack the linearity over the wide range of cell densities typically achieved at the end of the cultures, and thus they cannot measure higher cell densities. An exception was a laser cell density monitor (laser turbidometer LA-300, ASR, Tokyo, see Konstantinov et al., 2004), which however had a high price (>10000 �) due to the expensive laser technology. However, electrical methods based on impedance (Biomass monitor 220®, Aber Instruments), capacitance, or permittivity can also be used in high density cultivations, but are vulnerable to changes in the cultivation broth and eventually show low sensitivity at high cell densities. Soft sensors may be used to predict cell mass from parameters like pH, temperature or oxygen balance. Schweder and Neubauer (2005) list the on-line analysis methods for cell mass monitoring as in Table 1.

35
Table 1. Methods for on-line analysis of biomass during bioprocesses (adapted from Schweder & Neubauer, 2005).
Direct Electrical Capacitance, impedance
Optical Fluorescence Light absorbance Light scattering Real-time imaging
Acoustic resonance densitometry Nuclear magnetic resonance spectroscopy
Indirect Oxygen uptake rate
Carbon dioxide evolution rate ATP-production rate NAD sensor Fluorescence Heat production Calorimetry Stirrer power input Redox level pH value/base addition GFP Fluorescence
GFP, green fluorescent protein; NAD, nicotinic acid adenine dinucleotide; ATP, adenosine triphosphate.
Foaming is a typical phenomenon in bioprocesses. The formation of foam is recognized with level sensors (via measurement of conductivity or capacitance, or optical methods) and controlled with different anti-foaming agents. This is however problematic, because the anti-foaming agent results in difficulties in downstream processing (DSP) and it also disturbs other measurements (e.g., dissolved oxygen in the liquid).
In addition, on-line methanol sensors have been developed to control, for example, the feeding of the toxic inducer/substrate methanol (Raven Biotech Inc./Canada, Frings Alcosens/DE). The methanol concentration in the outlet air stream can also be measured (Innova/DK). This, however, requires extended pre-calibration.
3.2.1 Microbial processes
Microbial processes have been implemented in industry for more than 100 years with a minimum of sensor systems. Until the present day, the majority of processes have only used the most common sensors, such as pH, dissolved oxygen and temperature Pt sensors.
Microbial processes in industry are mostly conducted as fed-batch processes to reach a high volume to time yield. Traditional processes for production of low value products (acids, ethanol, single cell protein, antibiotics, vitamins, technical enzymes) are typically performed on crude complex growth media. However, the specific quality

36
demands of most high value products, e.g. the proteins in the pharmaceutical/medical sector (red biotechnology), have challenged the development of processes based on mineral salt media, which may eventually contain defined additives. Generally, from the point of view of process control, such processes on mineral salt medium have been easier to control at high cell densities, because metabolic control can be more easily obtained by the addition of only one carbon source. However, in many cases productivity and product quality may be negatively influenced (e.g., incorporation of modified amino acids, unwanted posttranslational modifications) and need specific consideration (sensitive analytical methods are needed).
Currently many processes are based on the production of target proteins using E. coli as a heterologous host system. (For a review of the production of heterologous pharmaceutical proteins in Escherichia coli see, e.g., Neubauer & Winter, 2001, Fahnert et al., 2004.) The process performance here is mostly based on mineral salt medium processes where yeast extract or other amino acid substrates can be added. Generally the processes are performed as glucose limited fed-batch and reach a cell density of between 20 and 80 g/l cell dry weight. Generally, the process is started as a batch or directly as a fed-batch and induction is performed by either a chemical inducer or temperature at above 10 g/l in the fed-batch phase. The product is either accumulated within 3�6 hours (cytoplasmic accumulation or inclusion body) or (mostly) at low temperature over 12�20 hours for products with slow folding rates or if transport of the product to the periplasm is needed. In the latter case, chemical additives might positively influence product accumulation, which, however, has to be optimized in long, labour intensive screening studies (for conditions see Fahnert et al., 2004, Fahnert, 2004).
A challenge to controlling targets during recombinant protein production with E. coli systems is the proper addition of the carbon substrate after induction. Under these conditions severe disturbances of carbon flows in the cell can often occur and the feed rate then has to be adjusted according to the maximum uptake rate of the carbon substrate to avoid high accumulation of acetate (Lin et al., 2001, Neubauer et al., 2003). During the scaling up of a process to the industrial scale improper mixing due to limited power input can provoke unwanted influences and process variations. This is a challenge to reliable product quality that must be addressed in the future, as it has been recently shown that cells react very sensitively to such oscillations (Lin & Neubauer, 2000, Enfors et al., 2001). Although scale-down systems have been developed, which allow an approximation of the large scale effects in a laboratory environment, surprisingly these systems have not yet been applied regularly to process optimization by industry (for such strategies see Neubauer et al., 1995a, 1995b, Lin & Neubauer, 2000, Enfors et al., 2001).

37
A specific problem is encountered in processes that are based on addition of complex carbon sources during the cultivation. Hence, the exact carbon going in to the reactor and up-taken by the cells is very hard to measure or calculate. Such a situation can result in intracellular feed-back regulation, futile cycles and/or repression of other metabolic pathways. Additionally, at high cell densities the accumulation of some amino acids to toxic levels, by either intracellular synthesis or imbalanced supply of amino acids, may also provoke inhibition of growth and production (Han, 2002). Therefore, applicable fast on-line methods, which would allow complex analysis of (critical) amino acids would be very valuable tools in process development and could even be used for process control.
The examples that are discussed here regarding E. coli processes are also relevant to the cultivation of other bacteria, yeasts and fungi. In the following paragraphs some specific aspects of other processes are discussed.
Industrial processes utilizing Bacillus species are mainly conducted for the production of industrial enzymes (for a recent review on proteases see Gupta et al., 2002) and smaller compounds, such as riboflavin by DSM, and they are mostly performed with complex media. A detailed physiological analysis seems of great interest for Bacillus processes because many of the interesting products are produced in the early stationary phase, which is related to sporulation. In production processes non-spore-forming mutants are often used, however they are critical from the point of view of continued viability. Recently a number of studies for the comprehensive analysis of Bacillus physiology have been performed in Bacillus processes that are a good example of the potential value of comprehensive transcriptomic and proteomic techniques (see e.g. Hecker & Volker, 2004, Schweder & Hecker, 2004, Voigt et al., 2004).
Yeast cultivations generally take longer than E. coli -based processes. An example of fairly complicated fed-batch processes for recombinant protein production is those applying the yeast Pichia pastoris. Recombinant protein expression with this microorganism is often controlled by the strong alcohol oxidase 1 (AOX1) promoter, which is induced by a shift of the carbon source from glucose or glycerol to methanol. A number of studies have been recently published with the aim of optimizing this process, which normally lasts 4 to 6 days. Control of the physiology in this process is very important, as small disturbances can be detrimental to production, either by starvation and consequently low production and proteolysis, or by toxification with methanol. The use of glucose/glycerol limited fed-batch, the introduction of a pre-adaptation phase to methanol, the use of other inducible promoters, such as a nitrogen regulated formaldehyde-DH promoter, or the use of temperature-limited fed-batch are some examples for interesting process strategies to increase the stability and productivity of Pichia fermentations (Jahic et al., 2003a, 2003b, Zhang et al., 2003, Trentmann et al., 2004, Zhang et al., 2004, Resina et al., 2004).

38
Processes with fungi and Streptomyces species, although they have been used in industry for a couple of decades, are still problematic from the control point of view. Inoculum quality has a major impact on the process, the media used are complex and the welfare of the process depends on the feeding profiles. Control of the feeding profiles mainly involves the addition of more compounds (e.g., for the production of antibiotics such as cephalosporin), a process, which has to be kept up over a period of at least one week. These problems have driven forward the use of on-line sensors and mathematical control approaches (Tartakovsky et al., 1996, Tran-Minh, 1996, Nandakumar et al., 2000, Morgan et al., 2001, Tunnemann et al., 2001, Vaidyanathan et al., 2001a, Bicciato et al., 2002).
3.2.2 Animal cell processes
The increased market for recombinant proteins, and the limited capabilities of microbial cells to express more complicated proteins correctly, has resulted in the development of a multitude of animal cell expression systems. Notably, to date almost all recombinant proteins accepted for human therapeutic use are manufactured either utilizing the microbial hosts E. coli and S. cerevisiae, or the animal cell hosts CHO (Chinese hamster ovary cell), BHK (baby hamster kidney cell) and hybridoma cells. The popularity of other hosts systems is, however, also growing rapidly and many are already in clinical trials. In particular, host systems based on the yeast P. pastoris, insect cell lines and other mammalian cell lines (even human) are gaining popularity. The production of recombinant proteins in plants, plant cells, insects and animals is discussed in the next chapter.
In most animal cell-based host systems the recombinant protein is secreted out of the cell. As a rule, the growth media used in animal cell cultures are very complex and thus purifying the product protein from the complex background of other proteins can be very tedious. An additional problem arises when using the baculovirus expression systems developed for insect cell expression (i.e. the recombinant protein gene is transferred into the host cell within a virus and is expressed as a part of the viral machinery). The removal of viruses will evidently complicate the purification process even further. However, new stable insect cell lines have been developed, in which no viruses are required.
Animal cell cultures are usually performed submerged. In many cases traditional stirred tank reactors (STRs) are suitable for the culture. The reactors used for commercial animal cell-based manufacture vary in scale from a few liters to over 10,000 liters. The biggest technical differences between the animal cell STRs and the STRs used in microbial fermentations are the gassing system (in order to avoid bubble formation in
39
animal cell cultures a semi-permeable silicone tube with a valve on exit, which results in higher internal pressure, is used) and agitation (slowly rotating blades compared to Rushton-type impellers). On a smaller scale, spinner flasks and roller bottles are commonly used, even for commercial manufacture. Some animal cell lines require a solid surface to grow on and in these cases different solid, inert carrier materials are added to the growth medium.
The hollow fiber bioreactor systems used for production of monoclonal antibodies with hybridoma cells are completely different from the STRs (used mainly for in vitro diagnostic monoclonal antibodies). The hollow fiber system is typically run in a continuous mode, i.e. fresh medium is constantly pumped into the system, while spent medium containing the product is removed at the same rate. The STR systems can also be run in continuous modes. With animal cells they are usually called perfusion cultures. In a typical perfusion culture the cells are kept in the reactor using a microporous filter basket attached to the agitation axes. In contrast to microbial fermentations, the pH control in animal cell cultures is usually achieved by addition of bicarbonate or gaseous carbon dioxide. In many animal cell cultures the gas phase also differs from the air, which is typically used in microbial fermentations (the carbon dioxide concentration is typically much higher in animal cell cultures).
The measurements taken in animal cell cultures are the same as with microbial fermentations, except for the following additions/differences:
• More emphasis is put on gas mixtures and their control.
• In batch and fed-batch cultures it is especially important that certain toxic metabolites are followed.
• The animal cell amount is usually measured using microscopy and cell count.
• Undesired protein constituents, and detection of viral DNA and retroviral RNA are of special importance.
3.2.3 Other processes
Besides microbes and animal cell lines, plants and plant cells, for example, as well as whole insects and animals, are also used for manufacture of biologics (mainly recombinant proteins). However, plants (including plant cells, tissues and organs) are also a rich source of commercially important small molecules, such as, for example, paclitaxel (the API in the anti-cancer drug Taxol®), morphine (the principal analgesic drug for cancer-related pains), diosgenine (the steroid used for the majority of hormone drugs) and L-Dopa (for treatment of Parkinson�s disease).

40
Of the host systems mentioned at the beginning of this chapter only plant cells and plant tissues/organs (e.g., shoots and roots) are discussed in detail in this report. Plants cell and tissues are cultured both submerged and on solid surfaces. For submerged cultures a range of different reactor systems have been tested, including, for example, the STR, airlift, bubble column, and temporary immersion system bioreactors. The reactor volumes can be up to 75 m3.
Plant cells, like many animal cell lines, are very sensitive to shear stress and mechanical mixing is therefore usually not an option. The oxygen transfer rates required by plant cells and tissues are, however, much lower than in microbial fermentations and thus aeration is sufficient for mixing. Sedimentation and clumping can be a problem and should be avoided. Wave type and mist reactors have also been studied for plant cell cultures (i.e. the former is a closed, disposable plastic bag on a shaker and in the latter the medium is sprayed on the culture). Moreover, the product is usually intracellular and the medium complex.
The culture of plant cells and tissues has a long tradition in Japan and Southeast-Asia (e.g., South Korea), where these are used in, for example, shikonin and ginseng. UniCrop Oy in Viikki is developing plant cell-based technology for the production of recombinant proteins. VTT and a Belgium co-operator recently founded SoluCel, a company focused on the metabolic engineering of plant cells for production of small molecules. Moreover, Novatreat Oy, based in Turku, is working on an example of therapeutic production in animals � they produce antibodies utilizing cows. In their process, the colostrum milk of immunized cows is collected and then purified into a therapeutic milk concentrate.
The at-line/on-line process measurements performed in plant cell and tissue cultures are basically the same as described in the previous chapters. The measurements performed off-line and during DSP are usually also the same as for the other host systems and are thoroughly described in other chapters of this report. Off-line viscosity is commonly measured in plant cell and tissue cultures. Conductivity is an at-line/on-line process measurement typical for plant cell and tissue cultures (to monitor indirectly the growth and use of medium components).
3.2.4 Process modes
The process modes are batch, fed-batch and continuous. The fed-batch technology is the most widely used technology in industrial bioprocesses, although a few processes are continuous (e.g., the Novo yeast process for human insulin). The low acceptance and use of continuous processes is mainly due to the evolution of biological systems in

41
continuous systems, which are not necessarily bad for the process, but are questionable from the process reliability point of view. Furthermore, continuous processes with constant release of culture broth are generally difficult to handle under the normal working conditions in industry (5 day weeks, the need for extra tanks), with the normally batch-wise procedure of downstream processing, and from the product quality validation point of view. Aside from fed-batch, repeated fed-batch processes (meaning starting a new cultivation after only partial emptying of the reactor) are considered to obtain higher volume/time yields.
Fed-batch processes are mostly performed with a pre-calculated feed-rate or with close-loop control of the feed by one parameter that is measured on-line (the latter is not much used in pharmaceutical processes but increasing interest from industry has been observed). Close-loop control has been realized in industry based on the measurement of pH (pH-stat), pO2 (pO2- or DO-stat), outgas calculation (rO2, rCO2, RQ), and measurement of on-line glucose. Particularly on a large scale with limited mixing, focusing on one control parameter may be critical, insufficient and may not allow proper control. As a result, the combination of complex analytical evaluation of standard analytical parameters with artificial neural networks (ANN) (e.g., see: http://www.iw.uni-halle.de/bio/german/forschung/research/modellierung.html) has successfully been used to improve the reliability of a number of industrial bioprocesses. However, surprisingly industry is still only cautiously interested. It may be expected that the regulatory principles that are standard in other technological disciplines and industries will, in the future, also be used to control most bioprocesses in this industry.
Large scale effects. The fed-batch technology is mostly applied on an industrial scale. However, the scale up of such processes to an industrial scale of more than 10 to 100 m³ is problematic. This is mainly due to the high volumetric metabolic rates at high cell density and the technically limited power input for mixing. Consequently gradients occur, for example, with substrates, pH, oxygen, CO2, and temperature. This list can be greatly extended if complex media are used in the process.
During the last few years a number of studies have focused on the evaluation of such large-scale effects. It has become clear that cultured organisms can respond on the time scale of seconds by overflow metabolism, stress response regulators, messenger RNA (mRNA) and even protein synthesis. Gradients in large scale reactors mostly lower the specific biomass yield of the carbon substrate and they often decrease the amount of a recombinant product by affecting the synthesis and proteolysis rates. On the other hand, the stress of such gradients can positively affect the viability: for example, the culturability of cells in a large-scale process decreases with a lower rate than on the laboratory scale.

42
There are few tools for simulating large-scale effects in laboratory reactors, such as cycled feed and two compartment reactor systems. The combination of a stirred-tank-reactor with an aerobic plug-flow reactor, in particular, seems quite realistic when simulated on the large scale (see, e.g., Bylund et al., 2000, Enfors et al., 2001, Neubauer et al., 1995a, 1995b, Xu et al., 1999). Using such tools, it has become evident that bad mixing causes the greatest process impact on the feeding points, which therefore should be located in a well-mixed zone in the reactor.
3.3 Downstream processes
API manufacturing methods can be divided into four categories, namely extraction, chemical synthesis, fermentation & cell culture, and biotransformation. In this report the focus is on biotechnological manufacturing methods. From a DSP perspective, the methods for purifying small molecules are very alike regardless of the methods by which the molecule was produced. The biggest differences between biotechnological and chemical production of small molecules, from a DSP perspective, are the methods used in combination with bioprocesses to separate the products from the cells, as well as the differences in product solution background (they are more complex when they are manufactured biotechnologically). Notably, the same differences apply to DSP methods used for purification of biologics � i.e. similar methods are used irrespective of whether the manufacturing method is extraction, fermentation or cell culture. Thus, in this report DSP methods will be presented as unit operations and the different unit operations will be viewed from the angle of whether or not small molecules or biologics are purified.
In pharmaceutical manufacturing the DSP (�Recovery & purification of API� and �Formulation of end-product� in Figure 1) is usually the most expensive phase. It is thus a very interesting area for PAT implementation. The DSP unit operations are also often easier to understand than the very complex biological phenomena taking place in fermentation and cell cultures, which in turn decreases the complexity of the necessary measurement and control entities.
3.3.1 Cell harvest and disruption
In processes involving cells there are typically two alternatives for the starting point of DSP depending on whether the product is located inside or outside the cells (note: sometimes the cells themselves can be the product, e.g., traditional vaccines). In both cases the cells are first harvested/separated either using centrifugation or filtration. In some processes gravitation is also used for this purpose. When biologics (namely proteins) remain inside the cell, insoluble aggregates called inclusion bodies can

43
sometimes be formed, which complicate the DSP (see the separate section on inclusion body DSP).
In centrifugation (or separation on an industrial scale) the cells are separated from the bulk liquid as a result of strong centrifugal forces. The time spent separating the cells (residence time) is dependent on the capacity of the centrifuge/separator compared to the final culture volume in the bioreactor. Principally all cell types can be separated by centrifugation, although with different efficiencies. The critical parameters are the residence time and temperature, as well as pH changes and proteolysis due to cell lysis and stress. The centrifugal force and residence time, as well as the pH, temperature and flow rate of the inflow and outflow are typically measured. The only feedback control that is typically applied in centrifugation is the control of the discharge interval based on cell turbidity in inflow (continuous separator).
Harvest/separation of cells can also be achieved by filtration using different microporous materials. Depending on the material, the microporous filters are either of the surface (multilayer filters of glass or polymeric microfibers) or the membrane type (geometrically regular porous matrices). These are operated either on dead-ended or tangential flow (cross-flow). Systems applying dead-ended flow are typically surface filters, and for cell separation purposes drum and filter-press-type filter systems are commonly used. Dead-ended flow surface filters are also commonly used for liquid sterilization at various stages of the DSP. Dead-ended flow surface filters are usually used for separation of filamentous organisms and cell fragments.
Tangential flow filtration (TFF) is usually performed with membrane filters, which vary in shape (tube, hollow fiber, flat plate or spiral wound), filter size, material (polymers, ceramic or metallic) and cut-off. For harvesting intact cells either microfilters (usually 0.2 or 0.45 µm) or very large ultrafilters (cut-off 1,000 kDa) are used. Membrane filters with tangential flow are commonly used for separation of unicellular organisms (see the Concentration section below).
Besides micro- and ultrafilters, reverse osmosis and nanofilters are also used in pharmaceutical DSP. These membranes are so tight that that they can be used to separate salts and small molecules with molecular masses typically lower than 1.5 kDa from water or other solvents. Moreover, virus removal is performed with membranes in the range of 100 kDa � 0.05 µm.
The parameters that are measured during filtration processes are residence time, temperature, pH, flow rates (inflow and permeate) and pressures (inflow, retentate and permeate). Cell lysis and other stress-mediated responses of the cells (e.g., proteolysis and formation of harmful side-products) are risk factors in filtration. Before starting the
44
process and after it, the nominal water permeability (NWP) is calculated, whilst during the run the transmembrane pressure (TMP), pressure drop (∆p) and permeate flow rate are monitored to avoid membrane clogging and to minimize the run time. In membrane filtration processes the tangential flow can be controlled to maintain either a constant cross-flow rate or a constant pressure drop. On the other hand, the applied pressure can be controlled to maintain a constant retentate pressure, TMP, liquid flux through the membrane or protein concentration at the membrane surface. In drum filtration the cake thickness is sometimes controlled by broth inflow rate and rotation rate.
If the product is inside the cells, the cells must next be disrupted to release the product. In some cases treatment of the cell membrane can be enough to release the product into the medium (e.g., osmotic shocks and organic solvents). Natural cell death and drying are also applicable in some instances (e.g., if the product is very stable). With biologics cell disruption can be a very critical DSP step, because it usually involves heat generation, which denatures the product. Disruption methods include enzymatic treatment (mild, but expensive), chemical treatment (no heat, but denatures the biologics), sonication (effective, but not applicable on the large scale), and mechanical methods such as high-pressure homogenization utilizing pressure drops and grinding with bead mills (both are usually applicable on the large scale, but these processes generate heat). Because the cells are still in contact with the product during this process step, all the same dangers that apply to filtration are also relevant here. The residence time, T, pH, flow rates, cell concentration, pressure (homogenization) and impeller speed (bead mills) are measured. The cell disruption is usually followed under the microscope. Thus, in cell disruption, feedback control only happens manually. Often, enzymatic disruption methods are combined with another disruption method.
Two-phase extraction is a useful unit operation both for biologics and small molecules. If the product is intracellular (inside the cell), harvested cells are sometimes pumped directly into an extraction liquid, where they undergo lysis caused by the organic solvents. This method is most suitable for small molecule products. Two-phase extraction, when applied correctly, also works as a concentration method. Very few things are measured in an extraction process (temperature and pH) and the set-points are usually decided before the process.
3.3.2 Concentration
When the product solution is free from solid material, and, especially with biologics, when the biological activity of the product solution is relatively stable, the solution is usually first concentrated. If the product is a small molecule, evaporation, precipitation, extraction or crystallization can be used. If the product is a biological compound,
45
tangential flow membrane filtration, precipitation or crystallization are usually used. Note that precipitation and crystallization are also efficient purification methods. In evaporation, flow rates (in, concentrate and distillate), temperatures (steam and solution) and pressures (steam and solution) are measured. Evaporation is usually controlled so that the set-point product concentration level is achieved. Precipitation is usually performed by adding the precipitant in an increasing gradient and fractions of the precipitate are then regularly collected. The residence time, temperature, pH and addition of precipitant are usually measured. Crystallization is either achieved by first concentrating and then cooling the concentrate, or by addition of components that lower the solubility of the product. The former applies more to small molecules, as efficient crystallization usually requires oversaturated solutions, which can only be achieved by heating. Initial product concentration, temperature and pH are important during crystallization. The crystallization rate might in some processes be controlled (with temperature, mixing or seed crystals) in order to achieve the correct crystal size, shape and polymorphic form. Tangential flow membrane filtration (ultrafiltration) applies similar membranes as mentioned above, but the cut-off is in the 1�1,000 kDa range. The same parameters are measured and controlled as mentioned above. Diafiltration (for buffer exchange) is usually done with tangential flow membrane filters. If the concentrate is diafiltrated into water, the permeate conductivity is measured to follow the removal of salts. The dialfiltration is stopped when the conductivity goes under the threshold value.
3.3.3 Final purification
Pharmaceutical biomolecules (i.e. small molecules or biologics) should be free of contaminating host-cell proteins, viruses, nucleic acids, enzymes, and endotoxins. Chromatography techniques are widely used for final purification of pharmaceuticals due to their versatility, capacity and resolution, although several chromatography steps must still be used to achieve the required purity. For example, Protein A columns are widely used for the purification of immunoglobulin G (IgG) antibodies (affinity chromatography), but in order to reach pharmaceutical grade, other methods, such as ion-exchange and hydrophobic interaction chromatography (HIC), must be used to remove residual contaminating molecules.
A way to improve the resolution of chromatographic methods is to use smaller resin beads, but this leads to a decrease in the flow rate. To increase the flow rate the pressure can be increased, however, both the media and the hardware have specific pressure limitations. Compromises have to be made between high resolution and high product throughput. In addition to traditional column chromatography, membrane chromatography (Warner & Nochumson, 2002) and expanded bed systems are also used

46
in industrial processes. Other available chromatographic-type final purification methods include adsorption, gel filtration and active carbon filtration. In chromatography the pH, temperature, pressure and flow rates, as well as eluent conductivity, refractive index and light absorption are measured. Important parameters that are monitored include load, yield, product concentration and purity.
In electrodialysis charged molecules are separated in an electric field through semi-permeable charged membranes, i.e. anionic molecules pass through positively charged membranes and cationic molecules through negatively charged membranes. Electrodialysis is utilized in, for example, salt removal, protein concentration and purification of organic acids.
3.3.4 Formulation and packaging
The formulation methods utilized depend foremost on the application of the final product. Other influencing factors include, for example, the purification and stability requirements, as well as API stability (temperature, pressure, etc.). Generally, the final formulation is either liquid (concentrates) or solid (powder, tablets, etc.).
Lyophilization or freeze-drying is often used to stabilize various pharmaceutical products, including virus vaccines, protein and peptide formulations, liposomes, and small molecule drug formulations. The lyophilization process consists of three stages: freezing, primary drying, and secondary drying. During the freezing stage the formulation is cooled. Pure crystalline ice forms from the liquid, resulting in concentration of the remainder of the liquid to a more viscous state that inhibits further crystallization. The highly concentrated and viscous solution finally solidifies, yielding an amorphous, crystalline, or combined amorphous�crystalline phase. In the primary drying phase the ice formed during freezing is removed by sublimation under vacuum in a pressurized and temperature controlled chamber. Throughout this stage, the product is maintained in the solid state in order to dry the product with retention of the structure established in the freezing step. During secondary drying the remaining bound water is removed by desorption until the desired residual moisture is achieved. Fast freezing or excessive dehydration may lead to bioproduct inactivation. In order to retain the activity in the lyophilized formulation, excipients such as buffers, bulking agents, stabilizers and tonicity modifiers may be added (Bedu-Addo, 2004). During the lyophilization stages, parameters such as pressure, temperature, load, water content, oxygen and moisture may be measured.
Spray-drying is a traditional drying method, where the temperature is usually kept under 70 °C. Other traditional drying equipment includes fluidized bed, belt, drum and
47
static oven drying. Solid drug products are usually also homogenized. Here grinding and high pressure homogenization is often used.
3.3.5 Production processes for and purification of inclusion bodies
Traditionally fermentation processes for pharmaceutical proteins aim to produce the target product in the correct three-dimensional functional structure. However, due to the complexity of many target proteins, the lack of eukaryotic-like folding components in the prokaryotic host systems often preferred, and increased knowledge about the folding of proteins, many processes today consider the in vitro refolding of an aggregated protein product obtained during the fermentation process as an attractive alternative (for recent reviews see: Cabrita & Bottomley, 2004, Fahnert et al., 2004, Middelberg, 2002, Panda, 2003, Tsumoto et al., 2003). The advantages of the production of inclusion bodies (IBs) with successive refolding are:
a. the relatively straight forward fermentation process optimization for a high amount of product in standard host/vector systems at high cell densities
b. the simple procedure for obtaining highly pure product protein in a few steps, without the need for expensive affinity purification techniques or consideration of the impact of the purification procedure on the three-dimensional structure of the product
c. the possibility for straight forward and even high-throughput screening approaches with a manageable number of parameters during the development of a refolding strategy (Vincentelli et al., 2004), where the unfolded product is transformed into its native three-dimensional structure.
Although these benefits have led to the development of IB processes as a real alternative for production of recombinant proteins, there are many proteins for which the yield is low. This is especially true for the refolding of proteins with disulfide bonds, and refolding complex proteins with more subunits is still an art.
A disadvantage of refolding processes is often the large volume of the refolding vessels needed, as the substrate is highly diluted to avoid aggregation. However, a number of new technologies have been developed to make the process more efficient, such as pulse dilution (stepwise) renaturation or stepwise dialysis technologies (Mark et al., 2002, Sinacola & Robinson, 2002, Tsumoto et al., 1998, Winter et al., 2002) and column-base (matrix based) refolding (reviewed in Fahnert et al., 2004, Lilie et al., 1998).
There is increasing evidence that small variations in the fermentation process may have a significant influence on the IB quality. Impact factors are the integration into IBs of
48
other cell proteins (especially proteases, chaperones, membrane proteins), product fragments, product variants with modified amino acids, other cell compounds (DNA, membranes), and the impact of the kind and content of secondary structures have also been recently discussed.
In relation to PAT, monitoring of the following stages and parameters might be useful:
(i) In fermentation: content, kinetics, and quality of the growth of inclusion bodies, monitoring of parameters which may influence the quality of inclusion bodies� cell stress responses, metabolic load. FT-IR has been used for quality analysis of inclusion bodies in vivo (Ami et al., 2005, 2006); new chip based analytical techniques for cellular mRNAs and proteins might be interesting, as well as soft sensors (see below), hybrid systems, ANN which are based on the number of documented on-line parameters.
(ii) In the purification and resolubilization of IBs: monitoring (and control) of disruption efficiency, the purification procedure (for non-product components) and the efficiency of solubilization.
(iii) In the refolding process: on-line monitoring of aggregates, and correctly folded product for controlling the process with a view to reducing aggregation and improving the refolding yield
Furthermore, monitoring methods could speed up process development and optimization especially for the in vitro part, including sensors that are applicable to high throughput screening for optimal refolding conditions.
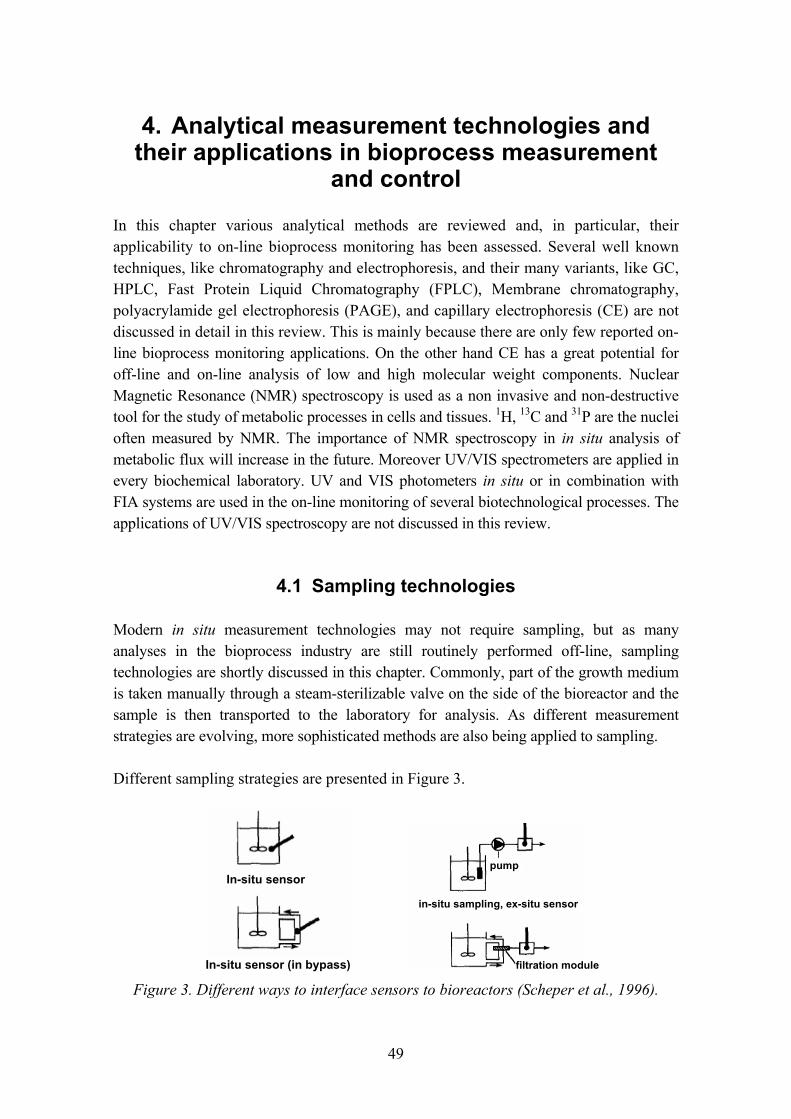
49
4. Analytical measurement technologies and their applications in bioprocess measurement
and control
In this chapter various analytical methods are reviewed and, in particular, their applicability to on-line bioprocess monitoring has been assessed. Several well known techniques, like chromatography and electrophoresis, and their many variants, like GC, HPLC, Fast Protein Liquid Chromatography (FPLC), Membrane chromatography, polyacrylamide gel electrophoresis (PAGE), and capillary electrophoresis (CE) are not discussed in detail in this review. This is mainly because there are only few reported on-line bioprocess monitoring applications. On the other hand CE has a great potential for off-line and on-line analysis of low and high molecular weight components. Nuclear Magnetic Resonance (NMR) spectroscopy is used as a non invasive and non-destructive tool for the study of metabolic processes in cells and tissues. 1H, 13C and 31P are the nuclei often measured by NMR. The importance of NMR spectroscopy in in situ analysis of metabolic flux will increase in the future. Moreover UV/VIS spectrometers are applied in every biochemical laboratory. UV and VIS photometers in situ or in combination with FIA systems are used in the on-line monitoring of several biotechnological processes. The applications of UV/VIS spectroscopy are not discussed in this review.
4.1 Sampling technologies
Modern in situ measurement technologies may not require sampling, but as many analyses in the bioprocess industry are still routinely performed off-line, sampling technologies are shortly discussed in this chapter. Commonly, part of the growth medium is taken manually through a steam-sterilizable valve on the side of the bioreactor and the sample is then transported to the laboratory for analysis. As different measurement strategies are evolving, more sophisticated methods are also being applied to sampling.
Different sampling strategies are presented in Figure 3.
Figure 3. Different ways to interface sensors to bioreactors (Scheper et al., 1996).
In-situ sensor pump
in-situ sampling, ex-situ sensor
In-situ sensor (in bypass) filtration module
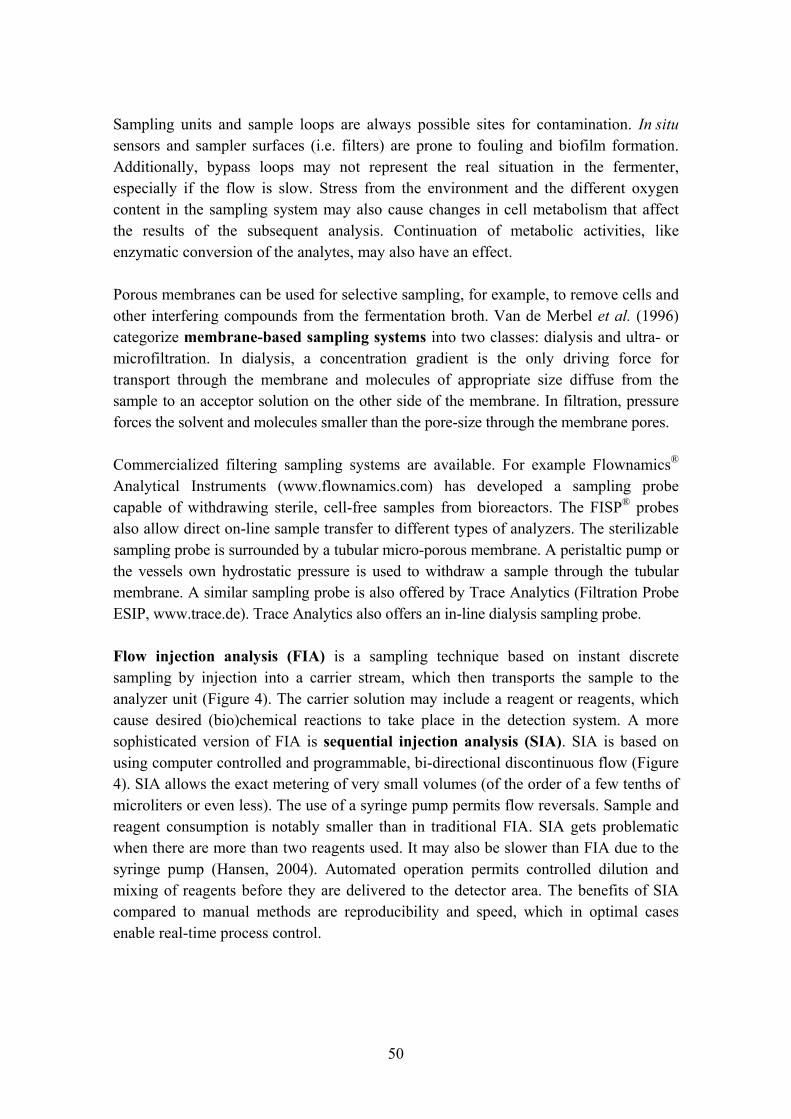
50
Sampling units and sample loops are always possible sites for contamination. In situ sensors and sampler surfaces (i.e. filters) are prone to fouling and biofilm formation. Additionally, bypass loops may not represent the real situation in the fermenter, especially if the flow is slow. Stress from the environment and the different oxygen content in the sampling system may also cause changes in cell metabolism that affect the results of the subsequent analysis. Continuation of metabolic activities, like enzymatic conversion of the analytes, may also have an effect.
Porous membranes can be used for selective sampling, for example, to remove cells and other interfering compounds from the fermentation broth. Van de Merbel et al. (1996) categorize membrane-based sampling systems into two classes: dialysis and ultra- or microfiltration. In dialysis, a concentration gradient is the only driving force for transport through the membrane and molecules of appropriate size diffuse from the sample to an acceptor solution on the other side of the membrane. In filtration, pressure forces the solvent and molecules smaller than the pore-size through the membrane pores.
Commercialized filtering sampling systems are available. For example Flownamics® Analytical Instruments (www.flownamics.com) has developed a sampling probe capable of withdrawing sterile, cell-free samples from bioreactors. The FISP® probes also allow direct on-line sample transfer to different types of analyzers. The sterilizable sampling probe is surrounded by a tubular micro-porous membrane. A peristaltic pump or the vessels own hydrostatic pressure is used to withdraw a sample through the tubular membrane. A similar sampling probe is also offered by Trace Analytics (Filtration Probe ESIP, www.trace.de). Trace Analytics also offers an in-line dialysis sampling probe.
Flow injection analysis (FIA) is a sampling technique based on instant discrete sampling by injection into a carrier stream, which then transports the sample to the analyzer unit (Figure 4). The carrier solution may include a reagent or reagents, which cause desired (bio)chemical reactions to take place in the detection system. A more sophisticated version of FIA is sequential injection analysis (SIA). SIA is based on using computer controlled and programmable, bi-directional discontinuous flow (Figure 4). SIA allows the exact metering of very small volumes (of the order of a few tenths of microliters or even less). The use of a syringe pump permits flow reversals. Sample and reagent consumption is notably smaller than in traditional FIA. SIA gets problematic when there are more than two reagents used. It may also be slower than FIA due to the syringe pump (Hansen, 2004). Automated operation permits controlled dilution and mixing of reagents before they are delivered to the detector area. The benefits of SIA compared to manual methods are reproducibility and speed, which in optimal cases enable real-time process control.

51
FIA has been used, for example, in conjunction with flow cytometry (Kacmar et al., 2004). Flow injection techniques have also been utilized in biosensor applications (Bracewell et al., 2002). Vojinović et al. (2005) have developed a FIA integrated bi-enzymatic micro-analytical bioreactor for measurement of glucose in fermentations. The bioreactor consists of a column with glucose oxidase and horseradish peroxidase immobilized on porous glass beads and it is connected to a spectrophotometer for the measurement of colorimetric reactions. This system has been used off-line but automation of the sampling procedure is possible. A glucose monitoring biosensor application has also been developed by Kumar et al. (2001). This on-line system also measures L-lactate using immobilized glucose oxidase and L-lactate oxidase with an amperometric detection system integrated with automated FIA. Sensolytics (www.sensolytics.com) has commercialized a SIA-based On-Line General Analyser (OLGA). At the moment glucose, sucrose, lactate, ethanol, glutamate and glutamine biosensors are available for OLGA. The liquid handling system can be attached to control, for example, feeding pumps, and can handle up to 30 10�100 µl samples per hour. A module for cross-flow filtration of the samples is available.
The third generation of injection analysis, the so called lab-on-valve (LOV), contains analysis equipment that is usually integrated (Figure 4). The major new feature compared to SIA is an integrated microconduit that is designed to perform all the necessary unit operations required for a given assay. It may contain facilities such as mixing points for the analyte and reagents, appropriate column reactors packed, for instance, with immobilized enzymes, or small beads furnished with active groups, such as ion-exchangers or antibodies, and even detection facilities, such as optical fibers (Hansen, 2004). Beads can also be manipulated within the LOV in exactly the same manner as liquids (bead injection lab-on-valve, BI-LOV). The LOV has been used in conjunction with capillary electrophoresis (Wu et al., 2003), in immunoassays (Carroll et al., 2003) as well as enzyme assays (Chen & Ruzicka, 2004, Schultz et al., 2002). Wu et al. (2001) used an integrated lab-on-valve manifold in a microfluidic sequential injection format (µSI) combined with a detection cell with fiber optic cables to monitor ammonia, glycerol, glucose, and free iron during fermentation. They used commercial reagents and assay kits designed for spectrophotometric analysis and were able to reduce the chemical consumption manyfold. Commercial instruments for SIA and LOV are produced, for example, by the American company FIAlab Instruments (www.flowinjection.com).
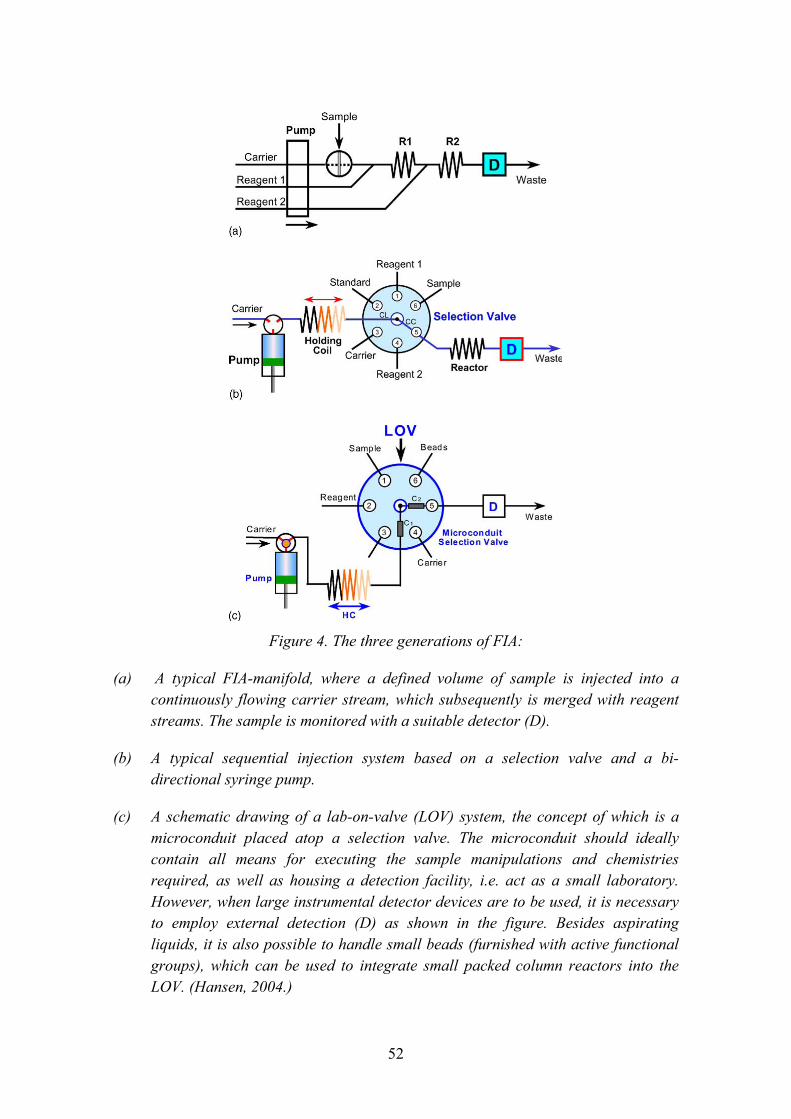
52
Figure 4. The three generations of FIA:
(a) A typical FIA-manifold, where a defined volume of sample is injected into a continuously flowing carrier stream, which subsequently is merged with reagent streams. The sample is monitored with a suitable detector (D).
(b) A typical sequential injection system based on a selection valve and a bi-directional syringe pump.
(c) A schematic drawing of a lab-on-valve (LOV) system, the concept of which is a microconduit placed atop a selection valve. The microconduit should ideally contain all means for executing the sample manipulations and chemistries required, as well as housing a detection facility, i.e. act as a small laboratory. However, when large instrumental detector devices are to be used, it is necessary to employ external detection (D) as shown in the figure. Besides aspirating liquids, it is also possible to handle small beads (furnished with active functional groups), which can be used to integrate small packed column reactors into the LOV. (Hansen, 2004.)
53
4.2 Optical analyzers
4.2.1 Near infrared spectroscopy (NIRS)
The use of optical spectroscopic methods for quantitative composition measurements in process control is increasing rapidly. Near infrared (NIR) spectroscopy has great potential for quantitative chemical analysis in industrial process use because of the strength of the absorption bands in this region. NIR spectroscopy provides a penetration depth from fractions of millimeter in the upper NIR region to centimeters in the lower end around 1000 nm. Many biologically important bonds (aliphatic C�H, aromatic or alkene C�H, amine N�H and O�H) absorb in the NIR range, at 2.0 to 2.5 µm (Marose et al., 1999).
Vaidyanathan et al. (2001a, 2003) have studied NIRS� applicability in estimating mycelial biomass during bioprocessing using the filamentous microorganisms Streptomyces fradiae and Penicillium chrysogenum (Vaidyanathan et al., 2001b, 2001c). They acquired NIR spectra at-line in a 1 mm transmission quartz cuvette over the wavelength range 400�2500 nm. For calibration of biomass in P. chrysogenum bioprocess samples Vaidyanathan et al. (2001c) used stepwise multiple linear regression (SMLR) and partial least squares (PLS) regression. Spectra were first derivatized to the second order. The wavelength range used for calibration was 1600�1800 nm. The three wavelengths used in SMLR were 1724, 1642 and 1684 nm, where 1724 nm is located near the absorption band of the C-H stretch�s first overtone, CH2 (the band position was reported to be 1725 nm by Osborne et al., 1993). Standard error of prediction (SEP) was 1.1 g/l and 0.74 g/l respectively. The concentration range of external validation set was 0.9�16.4 g/l.
Vaidyanathan et al. (2001c) have also developed NIR calibration models for total sugars and ammonium. The SEP for external validation set for total sugars was 4.5 g/l using simple linear regression (SLR) at the wavelength 2270 nm, and 2.5 g/l using PLS in the wavelength range of 2100�2350 nm. The concentration range was 3.2�77.2 g/l. The SEP for ammonium was 0.2 g/l using SMLR at two wavelengths (2152 nm and 2180 nm) and 0.2 g/l using PLS, too. The concentration range was 0.16�1.95 g/l. Vaidyanathan et al. (2001b) have also developed calibration models for penicillin and extracellular protein. Due to the complexity of the matrix (it was a Penicillium chrysogenum bioprocess) and relatively low concentrations, the direct at-line determination from broth samples didn�t correlate well. But from filtrate samples, the SEP for external validation set for penicillin was <18 g/l and 33 g/l for extracellular protein. The PLS calibration in the wavelength range of 1660�1800 nm was used for the penicillin calibration model.
54
Crowley et al. (2005) have developed calibration models for key process analytes, including biomass, glycerol and methanol, in a complex fed-batch very high cell density P. pastoris production process. They acquired NIR spectra at-line both in a 0.5 mm transmission quartz cuvette and a 4 mm reflectance quartz cuvette over the wavelength range of 400�2500 nm. The SEP for external validation samples for biomass was 1.4 g/l (concentration range 0�80g/l) using SLR at 944 nm (the C-H stretch�s third overtone, CH2 has an absorption band at 938 nm [Osborne et al., 1993]). The SEP for external validation samples for glycerol was 2 g/l and 0.24 g/l for methanol. The concentration ranges were 0�62 g/l and 0�10 g/l respectively. The model developed from reflectance spectra gave a slightly lower SEP for methanol of 0.22 g/l. From transmission spectra they were not able to develop a robust calibration for the heterogeneous protein product, but from reflectance spectra the SEP for the product was 0.06 g/l and the concentration range was 0.25�1.1 g/l.
Macaloney et al. (1997) used at-line NIRS to measure biomass, glycerol, ammonium and acetate concentrations from whole broth samples from a recombinant E. coli fed-batch. Arnold et al. (2002) have investigated both at-line and in situ NIRS for a complex, fed-batch industrial E. coli (RV308/PHKY531) process, expressing the growth hormone bovine somatropin (BST). This process undergoes a series of temperature changes and is vigorously agitated and aerated. At-line measurements were performed in a transmission cuvette with a pathlength of 0.5 mm. The SEP for external validation set for biomass was 1.5 g/l using PLS over a wavelength range of 2050�2350 nm. On-line measurements were performed using an immersion (transmission) probe submerged in the bioreactor with pathlengths of 0.5 mm, 1 mm, or 2 mm. The SEP for external validation set for biomass was 1.4 g/l using PLS over a wavelength range of 1600�1800 nm.
Navratil et al. (2005) have studied the ability of NIR spectroscopy to simultaneously generate real-time multi-parameter analysis data for biomass, acetate and glucose during both laboratory and industrial Vibrio cholerae fed-batch cultivation. Prediction models for biomass, glucose and acetate using NIR spectroscopy were developed based on spectral identification and PLS regression resulting in high correlation to reference data (the SEP for biomass, glucose and acetate were 0.20 g/l, 0.26 g/l and 0.28 g/l respectively).
Arnold et al. (2003b) have investigated the use of in situ NIRS as a tool for monitoring four key analytes (glucose, lactate, glutamine, and ammonia) in a CHO-K1 animal cell culture in a fed-batch process involving temperature change. An immersion (transmission) probe with a 1.2 mm pathlength was submerged in the bioreactor. The number of factors used in the calibration models developed were quite high (around 10, depending on the analyte) compared to other reported NIR models for microbial
55
systems (Macaloney et al., 1997, Vaidyanathan et al., 2001c). The SEPs for external validation for glucose, lactate, and ammonia was well below 5% of the concentration range, and they were 0.072 g/l, 0.014 g/l, and 0.036 mM, respectively. For glutamine the calibration model for external validation was not robust compared to the other three analytes. The SEP was 0.308 mM, which was about 7% of the total concentration range.
Harthun et al. (1997) have analyzed human antithrombin III in CHO culture supernatants by NIRS. The achieved SEP was less than 0.5 mg/l. Harthun et al. (1998) have also simultaneously measured the main metabolites in animal cell cultures.
The yeast Kurtzumanomyces sp. I-11 produces mannosyl erythritol lipid (MEL) from soybean oil. MEL is a biosurfactant, and is classified as a glycolipid. Nakamichi et al. (2002) have developed NIR calibration to measure MEL and soybean oil. The SEP of validation set for MEL was below 0.5 g/l. After derivatization to the second order the MLR calibrations used had two wavelength pairs, which gave very similar results. The wavelength pairs were 1436 nm and 1892 nm, and 2040 nm and 1312 nm. The SEP of validation set for soybean oil was below 0.7 g/l. The wavelength pairs used in this calibration were 1766 nm and 982 nm, and 2178 nm and 2090 nm.
NIR has proven to be a potential tool for monitoring fermentation processes. In Table 2 is a list of commercial organisms used to evaluate the potential of NIR spectroscopy in fermentation analysis is presented. NIR gives a good representation of conditions with minimized sampling and sample pre-treatment requirements. This fundamental advantage, together with the availability of high performance, technically mature and reasonably priced optical and optoelectronic components for the NIR region and the development of multivariate data analysis methods (chemometrics) for the treatment of overlapping chemical and physical (scattering) information, has been the major factor in the success of NIR in industrial applications. This development has made it possible to apply NIR spectroscopy to measuring the concentration of certain organic species, even in complex media. NIR can be applied to bioprocesses in various ways; in-line; on-line; at-line; and off-line. For in situ measurements probes can be steam sterilized. Arnold et al. (2002) have disclosed a few potential difficulties for in situ measurements; poor transmission from fiber optic probes above 2100 nm (2100 nm � 2500 nm is an interesting band region for NIR absorptions where more selective measurements can be made); referencing during processing; gas phase effects (bubbles) and temperature changes (both have effects on measured spectra); probe fouling; and vibrational effects caused by agitation. The narrow optical path lengths (for transmittance) combined with the fluid dynamics of both the broth media and the bioreactors can also sometimes make the NIR analysis strategy difficult to implement (Arnold et al., 2003a). In addition, the process calibration can be rather laborious, especially if PLS or ANN calibration models are used. The difficulties in in situ NIR measurements vary from process to process.

56
Industrial fermentation processes use a single, specially constructed or selected, strain of a bacterium, yeast, fungus, or animal or plant cell. For example, in Chinese hamster ovary animal cell processes the transition from an at-line to an in-line analysis proved more straightforward compared to the E. coli process because of the relatively low cell densities, the gentle agitation, and the absence of bubbles or gas slugs (Arnold et al., 2003b).
Table 2. Industrial organisms used to evaluate the potential of NIR spectroscopy for fermentation analysis.
Organism Supplier Product Analytes Ref.
Escherichia coli (unicellular)
Eli Lilly and Company (www.lilly.com)
recombinant protein, Bovine somatotropin (BST)
biomass, substrates, acetate (by-product), product
Macaloney et al., 1997, Arnold et al., 2002
Streptomyces fradiae (filamentous)
Eli Lilly and Company
Tylosin biomass, substrates, product
Vaidyanathan et al., 2001a, Vaidyanathan et al., 2001b
Pichia pastoris (unicellular)
British Biotechnology, plc (www.britbio.com)
Human protein biomass, substrates, product
Crowley et al., 2005
Penicillium chrysogenum (filamentous)
SmithKline Beecham Pharmaceuticals
Penicillin G biomass, substrates, product,
Vaidyanathan et al., 2001b
CHO-K1, (animal cell line)
British Biotechnology, plc
Human protein biomass, substrates, product
Arnold et al., 2003b,
Vibrio cholerae
SBL Vaccin AB cholera toxin biomass, glucose, acetate, product
Navratil et al., 2005
4.2.2 Infrared and Raman spectroscopy
When monitoring fermentation processes, only parameters such as pH, temperature and dissolved oxygen are usually measured in situ, and the measurement of substrate and product compounds is based on repetitive sampling of the culture broth and on analysis of the samples by methods such as HPLC and FIA. Infrared and Raman spectroscopy have also been used in these �semi-on-line� measurement systems.

57
Possibilities for using infrared and Raman techniques in fermentation monitoring are considered here. Special emphasis is put on in situ methods, because it is not favorable to take a large number of samples, particularly from a sensitive batch process, and because the greatest advantages from these techniques can be obtained in in situ applications, which are more difficult, or even impossible to obtain with many competing techniques.
Fourier Transform Infrared (FTIR) spectroscopy. Although NIR spectroscopy has been vigorously applied to various industrial processes, the number of publications concerning the on-line measurement of water-based samples, such as in fermentation processes, is rather limited. In water applications only transmission measurement can be used, because the sample is not reflective, and the high absorption of water limits the optical path to an order of 1 mm. In most papers sampling and off-line measurement is used in transmission cells, and only two groups have tested a fiber-optic probe in which the ends of two fibers are inserted into the bioreactor and separated from each other by a small gap (Lewis et al., 2000, Arnold et al., 2002).
Usually, better results can be obtained in the Mid Infrared (MIR) spectral region as, for example, Sivakesava et al. (2001a) have shown. Spectral bands in the MIR region are stronger and more distinct, but water absorption is also stronger, which limits the optical path to an order of 10 µm. An alternative to a narrow transmission cell is an attenuated total reflection (ATR) cell, in which the beam reflects inside the ATR crystal and penetrates only on the order of 1 µm into the sample side at the sample/crystal interface. An ATR probe serves as a one-sided measurement probe in liquid measurements and its optical path can be increased using multiple reflections.
In recent years several groups have used the FTIR-ATR method for in situ monitoring of fermentation processes (Doak & Phillips, 1999, Pollard et al., 2001, Rhiel et al., 2002, Kornmann et al., 2003, 2004). Most of them have used the DiComp probe from ASI Applied Systems (Mettler-Toledo), which is especially designed for insertion through the standard 25 mm side port in bioreactors. The probe is constructed of stainless steel (Φ = 5/8 in. x 7.25 in.), has a six-reflection diamond/ZnSe bilayer ATR element (Φ = 6 mm) at its tip and can withstand the sterilization process.
The FTIR-ATR measurement system has shown itself to be stable, unaffected by reactor operation conditions such as agitation, airflow and backpressure, but sensitive to temperature variations (Pollard et al., 2001). The high water absorption is dependent on temperature, which is seen as base-line instability in the sample spectrum. Surface contamination of the ATR crystal is known to be a common problem in the ATR-method. No indication of contamination problems, however, was found in the reports,
58
even though some of the tests periods were as long as 0.5 years (Doak & Phillips, 1999) and 2.3 years (Rhiel et al., 2002).
Both substrate and product compounds were measured in the tests and the calibration errors obtained were dependent on the process and calibration method used, but remained mainly between 0.1 and 1 g/l, for example, glucose (0.1 and 0.26 g/l), fructose (0.1 and 0.23 g/l), lactic acid (0.08 g/l), acetic acid (0.36 and 0.75 g/l) and ethanol (0.04 and 1.16 g/l).
If a sample is taken out of the fermenter, several kinds of pre-treatment can be performed on the sample. The sample can be filtered, its temperature can be stabilized and frequent measurement of a reference sample (e.g., clean water) can eliminate some instabilities in the measurement system.
Raman spectroscopy. There are only very few papers on Raman spectroscopy applied to fermentation monitoring, although Raman has many advantages in this kind of application. Water is transparent at the measurement wavelengths and its Raman spectrum is weak. Raman bands are narrow and usually more distinct than even those of the corresponding MIR spectra. Measurement is one-sided and can be performed through a glass window. The major hindrance to the use of Raman spectroscopy is the fluorescent background from excited cellular material.
Sivakesava et al. (2001b) have used an Fourier transform Raman (FT-Raman) spectrometer in off-line measurements. The whole sample was measured without any pre-treatment and the fluorescent background was low due to the long excitation wavelength (1.064 µm) used in FT-Raman. The calibration errors (standard error of calibration, SEC) obtained for glucose and ethanol were 6.8 g/l and 3.3 g/l, respectively. These are roughly three times the values obtained with the FTIR-ATR method, but the factors needed in PLS calibration numbered only 2 compared to the 8 used in the corresponding FTIR calibration.
Shaw et al. (1999) have used CCD-Raman spectroscopy and filtered the sample in a recycle loop. The lower excitation wavelength of 780 nm tended to increase the fluorescent background, which was considerably reduced by the filtering. The calibration errors (SEC) obtained for glucose and ethanol were 4.8 g/l and 3.9 g/l, respectively. These values are only of the same order as those obtained with FT-Raman (Sivakesava et al., 2001b), although CCD-Raman instruments are known to be much more sensitive. The explanation is the very low laser power (2�3 mW at sample) used in the tests, compared to the 1.2 W of the FT-Raman instrument.

59
Cannizzarro et al. (2003) are the only group, which has used in situ CCD-Raman spectroscopy for fermentation monitoring. The instrument was equipped with a fiber-optic probe, the excitation wavelength was 785 nm and the laser power at the sample was 70 mW. The end products were carotenoids, mostly astaxanthin, which has a very strong Raman spectrum. Although the carotenoids were formed inside the yeast cells, the calibration error was only 2.3 mg/l. The concentration of the glucose substrate was measured with the FTIR-ATR method.
It seems obvious that the ability to measure a specific compound in a fermentation broth is highly dependent on the ratio of its Raman intensity to that of the fluorescent background of the sample. Although many drug compounds have a very strong Raman spectrum, it is advantageous to remove cells from the measurement beam if extracellular products as well as substrate compounds and salts are measured. This might also be possible with in situ measurements if a special chamber at the end of the Raman probe is used. If the walls of the chamber are made from filter membrane, only dissolved compounds can enter the chamber. Disposable filter chambers can be used in batch processes.
If the sample is taken out of the fermenter, a liquid core optical fiber (LCOF) can be used as a measurement cell for filtered samples (Altkorn et al., 1999, Pelletier & Altkorn, 2000). The refractive index of amorphous Teflon (Teflon-AF) is lower than that of water and a hollow fiber filled with water (sample) serves as an optical waveguide. LCOF cells need a smaller sample volume than normal vials and the signal obtained is higher, depending on laser wavelength and the length of the capillary, which is limited by water absorption. Furthermore, the fluorescence background can be reduced in LCOF cells (Pelletier & Altkorn, 2000).
Photoacoustic spectroscopy. The only continuous outflow from the batch-type fermentation process is the off-gas. The components that are usually measured are CO2, O2 and ethanol (hydrocarbons). For example, the 1313 Fermentation Monitor (Innova, Denmark) uses photoacoustic IR spectroscopy for CO2 and hydrocarbons and magnetoacoustic spectroscopy for O2 (in the same cell). A big advantage of the photoacoustic techniques (compared to transmission measurement) is the small measurement cell, which allows a small dryer to be used to remove moisture from the sample gas before the analysis.
Recently, Kauppinen et al. (2004) have developed an optical cantilever microphone, which is 100 times more sensitive than the commercial microphones used in photoacoustic spectrometers. It remains to be clarified, however, if the development of volatile products in fermentation processes can be analyzed directly from the off-gas using an FTIR spectrometer equipped with this new microphone.

60
Summary. It seems obvious that both infrared and Raman techniques can be used in in situ monitoring of fermentation processes. Results are, however, dependent on the application, as they always are with spectroscopic methods. Infrared and Raman methods are also suitable for use with sampling systems, and they can also find applications in downstream processes (not considered here). The results are probably better than with in situ measurements, but many competing methods (which can be more sensitive or selective) can be used with sampling systems. The advantages of infrared and Raman techniques are, however, the short measurement time and minimal need for sample preparation.
4.2.3 Applications of green fluorescent protein
The use of green fluorescent protein (GFP) in bioprocesses has been proposed for many purposes, such as GFP fluorescence monitoring to determine product concentration (Cha et al., 2004, Reischer et al., 2004, Albano et al., 1998). In addition, Li et al. (2002) found that GFP-fusion allowed real-time in situ visualization of the localization pattern dynamics and trafficking of the fusion partner. GFP-fusion protein has also been used as a model product in a study on the effects of different process parameters on product formation (Wang et al., 2003).
The GFP signal correlates to the product expression, but regardless of high signal levels the product may still be unstable. It has also been shown that GFP may need up to 2 h from transcription to functional fluorescing protein (March et al., 2003), therefore early process stages may be difficult to monitor. GFP fluorescence measurement from fermentation broths is somewhat difficult as there is a strong fluorescent background from various media components. To resolve this problem, Kostov et al. (2000) developed an all solid-state GFP sensor for both off-line and on-line measurements. The sensor is light-tolerant and works with standard glass cuvettes under room-light illumination.
GFP variants that react in response to changes in the environment have been developed. Llopis et al. (1998) report the use of GFP to monitor intraorganelle pH with pH-dependent GFP mutants. Redox changes may be followed with reduction-oxidation-sensitive GFPs (Hanson et al., 2004). By linking GFP to particular stress or environment sensitive gene promoters, changes in parameters such as oxygen, temperature and nutrient availability and stress have been indicated (March et al., 2003, Reischer et al., 2004). The use of GFP and all its variants may also open up new measurement possibilities for bioprocesses.

61
4.2.4 2-D fluorescence spectroscopy
The two-dimensional (2-D) fluorescence spectroscopy technique uses a wide range of excitation and emission wavelengths. Fluorescence sensors are fiber optic measuring instruments, which are very well suited for in situ measurements because they are non-invasive. DELTA (www.delta.dk) has commercialized an on-line 2D fluorescence measuring system for process monitoring based on multichannel fluorescence detection. This BioView® system can be used in biotechnology, in the pharmaceutical and chemical industry, food production and environmental monitoring for detection of specific trace compounds and the state of microorganisms and their chemical environment, without interfering with the sample.
2-D fluorescence spectroscopy has been investigated for more than 15 years for different applications in biotechnology, such as biomass concentration determination (Konstantinov et al., 1994), bioreactor characterization (Scheper & Schügerl, 1986), metabolic studies (Gschwend et al., 1983) and particularly bioprocess monitoring (Marose et al., 1998). Skibsted et al. (2001) have made quantitative determinations of succinate (R2=0.97), protein (R2=0.94), optical density (R2=1.0) and nitrate (R2=0.98) in Pseudomonas fluorescens cultivations based on fluorescence spectra. The authors commented that they had only a limited data set available but the results indicated that the sensor could indirectly determine non-fluorescent compounds, i.e. nitrate and succinate, which is probably due to the stoichiometric relationship between fluorescent cellular components and non-fluorescent compounds.
4.3 Biosensors
Biosensors (chemical and biosensors) are defined as measurement devices, which utilize chemical or biological reactions to detect and quantify a specific analyte or event (Schultz & Taylor, 1996). Biosensors consist of an analyte specific receptor and a transducer, which converts the change in the receptor into an electrical signal (Figure 5). Biosensors can be used directly to monitor the bioprocess, or they can be integrated in continuous flow analysis (CFA) or FIA systems used for on-line process monitoring and control.
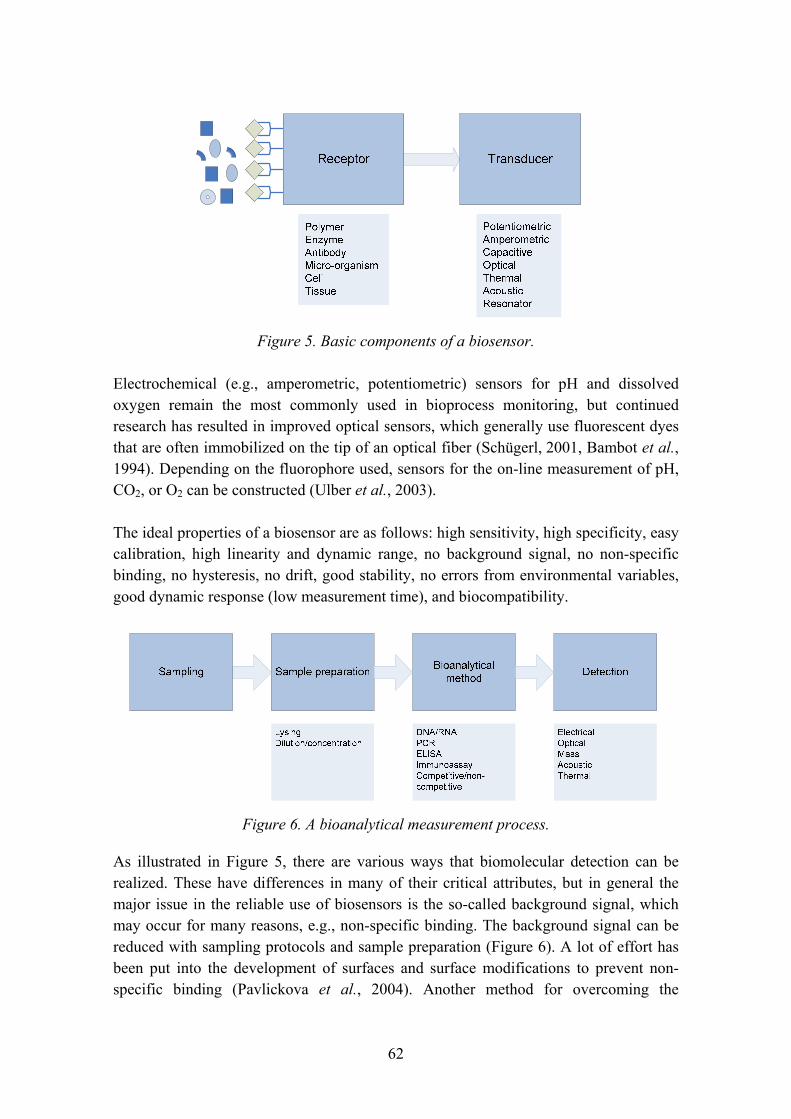
62
Figure 5. Basic components of a biosensor.
Electrochemical (e.g., amperometric, potentiometric) sensors for pH and dissolved oxygen remain the most commonly used in bioprocess monitoring, but continued research has resulted in improved optical sensors, which generally use fluorescent dyes that are often immobilized on the tip of an optical fiber (Schügerl, 2001, Bambot et al., 1994). Depending on the fluorophore used, sensors for the on-line measurement of pH, CO2, or O2 can be constructed (Ulber et al., 2003).
The ideal properties of a biosensor are as follows: high sensitivity, high specificity, easy calibration, high linearity and dynamic range, no background signal, no non-specific binding, no hysteresis, no drift, good stability, no errors from environmental variables, good dynamic response (low measurement time), and biocompatibility.
Figure 6. A bioanalytical measurement process.
As illustrated in Figure 5, there are various ways that biomolecular detection can be realized. These have differences in many of their critical attributes, but in general the major issue in the reliable use of biosensors is the so-called background signal, which may occur for many reasons, e.g., non-specific binding. The background signal can be reduced with sampling protocols and sample preparation (Figure 6). A lot of effort has been put into the development of surfaces and surface modifications to prevent non-specific binding (Pavlickova et al., 2004). Another method for overcoming the

63
background signal problem is, for example, the use of competition assays. This method has long been applied to the problem of detecting protein�ligand binding reactions when a suitable binding-induced distance change can be identified (Fan et al., 2005). FRET (Förster resonance energy transfer) is one technology that can identify this binding, with a significantly reduced background signal. FRET works by bringing two fluorescent molecules together in close proximity so that the emission of one fluorophore is coupled to the excitation of the other. The efficiency of this phenomenon falls off with the sixth power of distance and therefore a signal is produced only in bound components and the fluorescence signal background is reduced.
In 1976, Clemens et al. incorporated an electrochemical glucose biosensor in a bedside artificial pancreas, which was later marketed by Miles (Elkhart) as the Biostator. Since then, blood glucose self-testing devices and strips have become the major application for biosensors. Another significant step in commercial biosensors was the development of a sensor based on surface plasmon resonance, SPR (Liedberg et al., 1983). They described the use of SPR to monitor affinity reactions in real time. The BIAcore (Pharmacia, Sweden), launched in 1990, is based on this technology and newly launched T100 meets the regulatory demands for working in a GLP and GMP environment1. In 2003, nearly a thousand (1000) SPR articles were published (Rich & Myszka, 2005). It is remarkable though that only 4% of the articles published in 2003 described the use of SPR to determine analyte concentrations. Most often SPR was used to measure kinetic rate constants.
Enzyme-linked immunosorbent assay (ELISA) is a conventional way to realize biomolecular recognition. Unfortunately, it is labor intensive and slow (typically it takes hours to complete). Therefore it is not suitable for rapid process control applications. Below is a short comparison of some potential technologies available for biomolecular recognition. Technologies like time resolved fluorescence (TRF) and electrochemiluminescence are very sensitive, but simultaneous measurement of several analytes is hard to realize. The sample handling can also be demanding. On the other hand, microarray technologies allow simultaneous measurement of tens or hundreds of analytes, but with a loss of sensitivity and/or accuracy. It is also important to keep in mind that the target analyte can have a significant impact on the usability of the technology. For example, in technologies that are based on the detection of mass change (SPR, quartz crystal microbalance (QCM), etc), the lower limit of detection is highly dependent on the size of target analyte. On contrast, in assays where the analyte is labeled (fluorescence, radioactive), analyte size is not that important. DNA and RNA assays are not so dependent on the original target concentration, because with polymerase chain reaction (PCR) technologies the analyte amount can be amplified, although this takes time, of course. In protein detection the antibodies used have a
1 Genetic Engineering News, Vol. 25, No.9, May 1, 2005, p. 24.

64
significant impact on the specificity and sensitivity of the assay. Labeling of the target analyte (or competitive analyte) is not always desirable and the binding has may have to be measured directly. This reduces the use of reagents and eases the sample preparation. The specificity of an assay can be increased by using two antibodies for detection. Special applications have been developed, in which a small molecule analyte (morphine) first binds to an antibody and, even though the analyte is nearly fully inside the three dimensional structure of the antibody, the secondary antibody then specifically detects this immunocomplex (Pulli et al., 2005).
Thermal biosensors are based on measuring the heat formed or absorbed during a chemical reaction. According to Ramanathan and Danielsson (2001) enzyme thermistors have been used for off-line monitoring of, for example, penicillin, lactate, sucrose and glucose in fermentation processes. Rank et al. (1995) monitored ethanol, acetaldehyde and glycerol on-line with a split-flow modified enzyme thermistor.
Optical biosensing can also be used to directly monitor GFP production throughout cell growth on-line in real time (Randers-Eichhorn et al., 1997) or in order to monitor intracellular ATP during fermentation (Funabashi et al., 1999).
The performance of bioanalytical measurement (Figure 6) is as good as the weakest link in the process. In bioprocess measurements the weakest link is typically sampling and sample handling. Biosensors are being increasingly used as detectors in FIA systems. The typical drawbacks of biosensors as direct in situ sensors, namely low dynamic range, lack of ability to survive sterilization, limited lifetime, etc., are no longer valid ex situ because the analyzer interfaces the biosensor, which can be changed at any time and FIA can provide samples at optimal dilution (Sonnleitner, 2000).
Baker et al. (2002) have compared various analytical technologies, namely electrochemiluminescence, optical biosensors, rapid chromatography and nephelometry. They have analyzed the advantages of each technology for measuring both small and large recombinant therapeutic proteins, and they also made comparisons with a conventional ELISA technique.
4.4 Gene expression and proteomics
4.4.1 Rapid and multiplexed mRNA expression analysis of microbial cultivations
Changes in the genomic expression profile are the first signs of adaptation of microbes to changing conditions or to potential process disturbances. However, tools suitable for

65
high-throughput expression monitoring of process-relevant genes are scarce. TRAC (�transcriptional profiling with the aid of affinity capture�) is a novel technique developed at VTT that enables rapid transcriptional profiling of microbial cultivations (Söderlund et al., 2003). This method allows fast gene expression analysis for sets of mRNAs by solution hybridization with a pool of target-specific oligonucleotide probes of distinct sizes that are identified and quantified by capillary electrophoresis. The assay procedure has been semi-automated for simultaneous treatment of 96 samples using a magnetic bead particle processor. To further enhance the robustness of the method it was set up to work with crude cell lysates. TRAC has been shown to produce results highly consistent with mRNA quantification by Northern hybridization. Computational methods have been applied to the design of target-specific oligonucleotide probes and to assigning them to the minimum number of pools (Kivioja et al., 2002). The whole assay procedure can be performed in 2�3 hours, implying its usefulness for high-throughput analysis of a limited set of mRNAs, e.g., in gene expression monitoring of bioprocesses.
The TRAC assay has been applied to monitoring the levels of a set of mRNAs in the filamentous fungus Trichoderma reesei under controlled fermenter conditions. The chosen gene markers are involved in various cellular pathways including unfolded protein response, protection against various stress conditions, oxygen and nutrient limitation responses, protein synthesis and growth. TRAC has been used to monitor the various physiological responses of the fungus in different phases of batch and fed-batch cultures. The data obtained shows the potential of the method for use in optimization of such production processes. Furthermore, TRAC has been found to be a useful tool in evaluation of the stability of gene expression levels during the steady state phase of chemostat cultures, and it was used to select the most suitable samples for further transcriptomic and proteomic analysis.
Alternatively, a sandwich hybridization technique for the quantitative analysis of key RNAs has been developed, which uses either a fluorescence (Rautio et al., 2003) or an electrochemical readout (Gabig-Ciminska et al., 2004a). Similar to the TRAC method, this technology can be automated and performed in only 2�3 hours, although without the high throughput possibilities of TRAC.
This analytical platform has been recently applied to the sensitive analysis of environmental pathogens (Gabig-Ciminska et al., 2004b, Leskelä et al., 2005) and to bacterial and phage contaminants in bioprocesses (Gabig-Ciminska et al., 2004c). It has also been applied to the quantitative response of RNAs during processes involving Saccharomyces cerevisiae (Rautio et al., 2003), E. coli (Soini et al., 2005), Bacillus licheniformis and Pichia pastoris.

66
4.5 Mass spectrometry
Mass spectrometry (MS) has long been used to monitor simple organic compounds (O2, CO2, ethanol, butanol, etc.), but due to the complexity of the preparation of samples for MS it is not generally applied in on-line analysis, with the exception of Membrane Inlet Mass Spectrometry (MIMS), which will be discussed in more detailed here.
4.5.1 Membrane Inlet Mass Spectrometry (MIMS)
This technique can be useful in quantifying dissolved gases and volatile organic compounds directly from a solution. MIMS involves the use of a polymer membrane to introduce a sample directly to a mass spectrometer. Compounds that can diffuse freely through this membrane enter the vacuum side of the mass spectrometer, where they are ionized and analyzed according to the mass to charge ratio. Compounds with molecular weights of up to 300 can be analyzed with this technique. Highly hydrophobic compounds can be detected in the parts per trillion (ppt) range, whereas polar compounds (alcohols, ketones, esters) have 1�3 orders of magnitude higher detection limits, i.e. approaching the parts per million (ppm) range. In both cases the detection capabilities are quite remarkable.
The idea of using a polymer membrane to separate a liquid sample and the vacuum of a mass spectrometer was first introduced by Hoch and Kok (1963) in a study on photosynthesis. Subsequently, the technique was adapted for bioprocess monitoring (Reuss et al., 1975). More recently, microporous membranes were introduced to measure volatile compounds dissolved in organic solvents (Lauritsen et al., 1992a), and polar organic compounds in the aqueous phase (Lauritsen et al., 1992b). A recent study shows the applicability of MIMS to the analysis of aroma compounds in continuous beer fermentation processes (Tarkiainen et al., 2005).
4.6 Dielectric spectroscopy
The method is based on the measurement of charge separations induced across the (intact) cell membrane by an applied radio frequency (RF) electric field. Dielectric spectroscopy (or culture capacitance measurement) is used as an on-line, non-invasive method for biomass estimation and responds mainly to living cells (Matanguihan et al., 1994, Markx & Kell, 1995). The Biomass Monitor (Aber Instruments, UK) uses RF impedance and is based on the passive electrical (dielectric) properties of biological materials. It detects only those cells with intact plasma membranes and so gives values that correlate with viable biomass. Cells with intact plasma membranes can be
67
considered to act as tiny capacitors under the influence of an electric field. The nonconducting nature of the plasma membrane allows a buildup of charge. The resulting capacitance can be measured; it is dependent on the cell type and is proportional to the concentration of viable cells present.
Zeiser et al. (1999) used on-line relative permittivity (The Biomass Monitor from Aber Instruments) measurements to monitor a batch culture of Sf-9 insect cells, in which the batch was infected with a baculovirus expressing β-galactosidase. They found that viable cell density and volume essentially accounted for all the variation in permittivity in both non-infected and synchronously infected cultures, indicating that the permittivity of a cell suspension is sensitive only to changes in the viable cell population.
Gerckel et al. (1993) applied dielectric spectroscopy to measuring the biomass and size of mammalian cells. They measured the capacitance of suspensions of CHO and HeLa cells (0.5�3×10⁶ cells/ml) between 0.2 and 10 MHz. As frequencies decrease, there is a continuous increase in the capacitance of both the cell suspension and the spent growth medium free of cells. They found that the intensity of the signal varied linearly with the biomass and cell size. At low frequencies, such as those used in the study (0.25 MHz), where sensitivity is the highest, concentrations as low as 0.5×10⁶ cells/ml could be accurately measured.
The observed difficulties in using the signal dielectric spectrometer as a pure biomass concentration sensor, i.e. deviations from the simple correlation with cell density, were attributed to dependencies on the physiological state (Matanguihan et al., 1994), and Woodward and Kell (1991) could discriminate between different populations in yeast cultures.
4.7 Machine vision and real-time imaging
Machine vision has been mainly used in the bioprocess industry for the calculation of cell number. Joeris et al. (2002) have developed an in situ microscopy method to acquire images of mammalian cells directly in the reactor. The system uses a CCD-camera and digital image processing software, which is able to estimate cell density, cell size distribution and to give information of the degree of cell-aggregation.

68
4.8 Soft sensors
Soft sensor, software sensor and virtual sensor are common names for software where several measurements are processed together. Soft sensors are typically intelligent computer programs capable of state estimation and prediction, and they can thus be helpful when dealing with bioprocesses characterized by uncertainties and complexity (Eerikäinen et al., 1993). Soft sensors are used to make existing measurements more efficient or to provide previously unavailable measurements with software systems that process the measurement signals, for example, based on other, existing measurements, laboratory analyses and a priori expert knowledge. Soft sensors are especially useful in data fusion, where measurements of different characteristics and dynamics are combined. A soft sensor incorporates dozens or even hundreds of measurements to perform the task in question.
Soft sensors are generally used, for example, in process control applications and detection of faults (Anonymous, 2005e). Diagnostic process analysis is closely related to software sensors, process trend analysis, risk analysis and detection of sensor failures (Juuso, 1997). Software sensors can expand the application areas of existing measurements in processes where a lack of appropriate online measurements for some important variables is a serious problem. Intelligent methodologies can also handle nonlinear multivariable systems in a flexible way (Juuso, 2004a), and the monitoring of operating conditions is a good alternative for adaptive control strategies (Juuso, 2004b).
Soft sensors have also found applications in the measurement and control of biotechnological production processes, where inferential estimations of bioprocess state variables have been calculated using easily monitored on-line secondary variables. In the supervision of biotechnological processes certain variables must be maintained within exceptionally strict limits due to their high sensitivity to abnormal changes in operation conditions.
Examples of soft sensors in the field of biotechnological processes include an ANN system, which was employed as a soft sensor to predict the cell concentration in a batch fermentation (Linko et al., 1994, Lennox et al., 2001). In another example, cell and glucose concentration soft sensors were created for fed-batch fermentation using PLS regression and a feed forward neural network (FFNN) coupled to principle component analysis (PCA) (Hagedorn et al., 2003). In this study, fluorescent data were used to model the kinetics of the fermentation. Data from three fermentations were combined to form a training set for model calibration, and the data from a fourth fermentation was then used as the testing set.
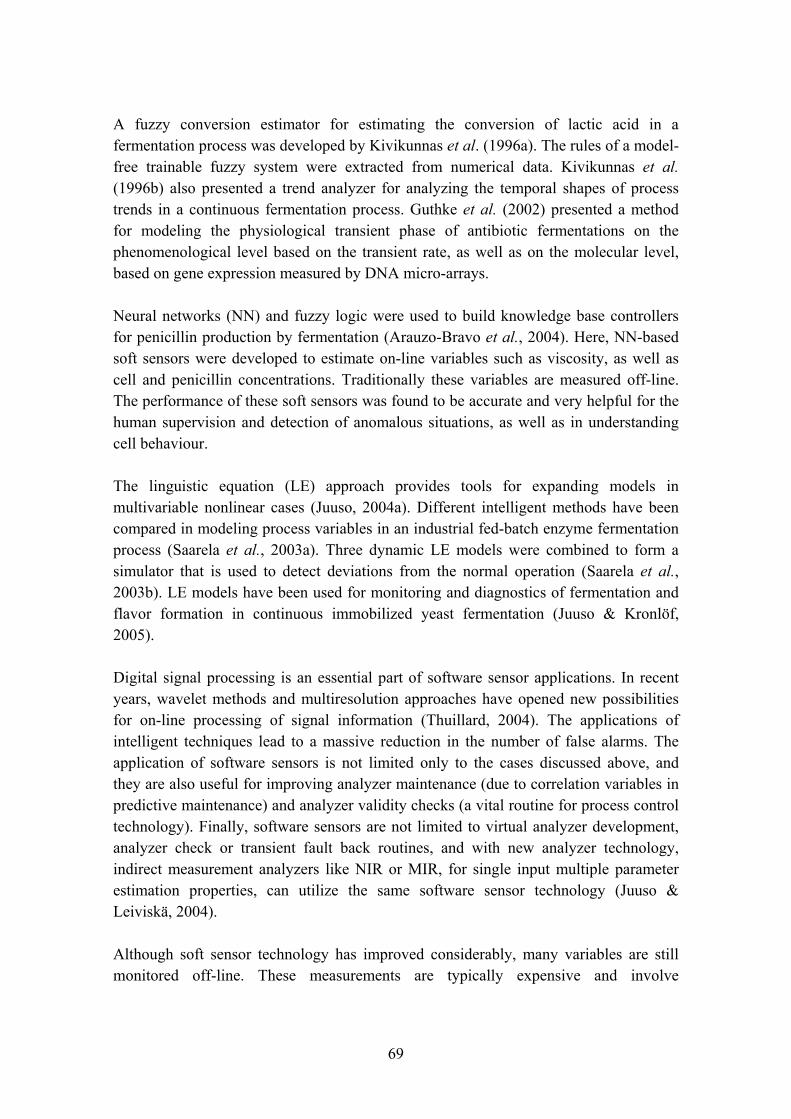
69
A fuzzy conversion estimator for estimating the conversion of lactic acid in a fermentation process was developed by Kivikunnas et al. (1996a). The rules of a model-free trainable fuzzy system were extracted from numerical data. Kivikunnas et al. (1996b) also presented a trend analyzer for analyzing the temporal shapes of process trends in a continuous fermentation process. Guthke et al. (2002) presented a method for modeling the physiological transient phase of antibiotic fermentations on the phenomenological level based on the transient rate, as well as on the molecular level, based on gene expression measured by DNA micro-arrays.
Neural networks (NN) and fuzzy logic were used to build knowledge base controllers for penicillin production by fermentation (Arauzo-Bravo et al., 2004). Here, NN-based soft sensors were developed to estimate on-line variables such as viscosity, as well as cell and penicillin concentrations. Traditionally these variables are measured off-line. The performance of these soft sensors was found to be accurate and very helpful for the human supervision and detection of anomalous situations, as well as in understanding cell behaviour.
The linguistic equation (LE) approach provides tools for expanding models in multivariable nonlinear cases (Juuso, 2004a). Different intelligent methods have been compared in modeling process variables in an industrial fed-batch enzyme fermentation process (Saarela et al., 2003a). Three dynamic LE models were combined to form a simulator that is used to detect deviations from the normal operation (Saarela et al., 2003b). LE models have been used for monitoring and diagnostics of fermentation and flavor formation in continuous immobilized yeast fermentation (Juuso & Kronlöf, 2005).
Digital signal processing is an essential part of software sensor applications. In recent years, wavelet methods and multiresolution approaches have opened new possibilities for on-line processing of signal information (Thuillard, 2004). The applications of intelligent techniques lead to a massive reduction in the number of false alarms. The application of software sensors is not limited only to the cases discussed above, and they are also useful for improving analyzer maintenance (due to correlation variables in predictive maintenance) and analyzer validity checks (a vital routine for process control technology). Finally, software sensors are not limited to virtual analyzer development, analyzer check or transient fault back routines, and with new analyzer technology, indirect measurement analyzers like NIR or MIR, for single input multiple parameter estimation properties, can utilize the same software sensor technology (Juuso & Leiviskä, 2004).
Although soft sensor technology has improved considerably, many variables are still monitored off-line. These measurements are typically expensive and involve
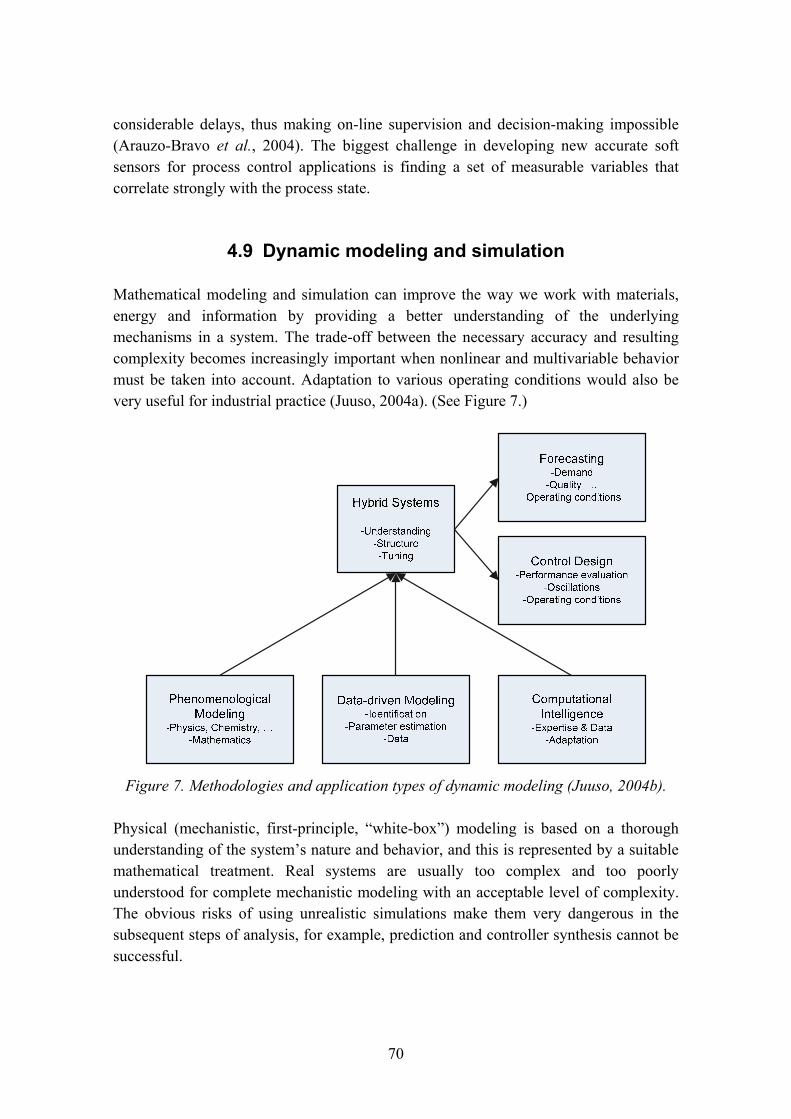
70
considerable delays, thus making on-line supervision and decision-making impossible (Arauzo-Bravo et al., 2004). The biggest challenge in developing new accurate soft sensors for process control applications is finding a set of measurable variables that correlate strongly with the process state.
4.9 Dynamic modeling and simulation
Mathematical modeling and simulation can improve the way we work with materials, energy and information by providing a better understanding of the underlying mechanisms in a system. The trade-off between the necessary accuracy and resulting complexity becomes increasingly important when nonlinear and multivariable behavior must be taken into account. Adaptation to various operating conditions would also be very useful for industrial practice (Juuso, 2004a). (See Figure 7.)
Figure 7. Methodologies and application types of dynamic modeling (Juuso, 2004b).
Physical (mechanistic, first-principle, �white-box�) modeling is based on a thorough understanding of the system�s nature and behavior, and this is represented by a suitable mathematical treatment. Real systems are usually too complex and too poorly understood for complete mechanistic modeling with an acceptable level of complexity. The obvious risks of using unrealistic simulations make them very dangerous in the subsequent steps of analysis, for example, prediction and controller synthesis cannot be successful.

71
Data-driven modeling approaches are based on general function approximations (�black-box� structures), which should capture correctly the dynamics and nonlinearity of the system. The identification procedure, which consists of estimating the parameters of the model, is quite straightforward and easy if appropriate data is available. The structure and parameters of these models do not necessarily have any physical or chemical significance, and therefore, these models cannot be adapted to different operating conditions.
Computational intelligence can provide additional tools since humans can handle complex tasks including significant uncertainty on the basis of imprecise and qualitative knowledge. Intelligent methods are based on techniques motivated by biological systems and human intelligence, such as natural language, rules, semantic networks and qualitative models. Most of these techniques have already been introduced in conventional expert systems. Practical techniques for handling uncertainties and qualitative information have also been developed using fuzzy modeling. Very complex nonlinear models can be constructed with fuzzy set systems. Data-driven modeling can also use ideas originating from neural networks, data analysis and conventional system identification. Building fuzzy models from prior knowledge involves various knowledge acquisition techniques originating from conventional expert systems.
A mixed approach, using both rigorous first principle simulation and black box modeling in an integrated environment, seems to be a clear choice for complex systems. Batch processes have additional requirements for forecasting quality over quite a long period of time. (Juuso & Leiviskä, 2004.)
Modeling can be based on data and knowledge based methods (Guthke et al., 2003) and piecewise-linear differential equations (de Jong 2003). Kramer et al. (2002) developed a universal software tool for biotechnical process monitoring. This tool combines classical modeling and process control methods with intelligent techniques in a shared user interface. Stress response was investigated and dynamic models were constructed for dynamic model structure optimization by Schmidt-Heck et al. (2004). A limited set of differentially expressed genes were selected and clustered with fuzzy c-means clustering, and the clustering results were interpreted in terms of dynamic models. A novel heuristic algorithm identifies the appropriate model structure by growing and pruning the interaction network. Heikkinen et al. (2004) used Self-Organizing Maps (SOM) and Sammon�s mapping in the classification of states and process phenomena in the activated sludge treatment plant at Stora Enso�s pulp mill in Oulu.
Different intelligent methods were compared in the modeling of process variables in an industrial fed-batch enzyme fermentation process (Saarela et al., 2003a). Three dynamic LE models were combined to form a simulator that can predict the dissolved oxygen

72
(pO2 or DO) concentration; the concentration of carbon dioxide in the exhaust gas, and the oxygen transfer rate (OTR). These models are used to detect deviations from normal operation (Saarela et al., 2003b).
4.10 Requirements for on-line and in situ analyzers
Typical requirements for on-line and in situ process analyzers and sensors are:
• stable operation over a long period of time and over a large temperature range
• rugged and compact instrument construction
• easy calibration and calibration transfer
• easy use and maintenance
• safe and reliable operation
• simple, quick and reliable checking and correction of any instrument response drift
• real-time diagnostics and analysis
• short stabilization time to full accuracy after power switch-on.
Sonnleitner (2000) has listed special requirements for in situ monitoring of biotechnological processes:
• the probe has to withstand sterilization procedures
• no interference with the sterile barrier
• insensitivity to protein adsorption and surface growth
• resistance to degradation or enzymatic break down.

73
5. Process monitoring needs
Unlike traditional medicinal products, which are produced using chemical and physical techniques capable of a high degree of consistency, the production of biological medicinal products involves biological processes and materials, which themselves have inherently high variability and show a sensitive response to small changes in physical and chemical parameters (e.g. pH, temperature, oxygen, size distribution of particles, buffer concentration, mixing, ion concentration, buffer capacity). The impact of many factors along the multistep process line and their mutual interconnectivity make it difficult to relate a specific factor to batch-to-batch variation.
So far, to guarantee consistent product quality, the principle aim has been to control a process very stringently, i.e. to repeat a process exactly in the same way. This approach excludes, for example, feed-back control strategies, which have been commonly used in other technological branches.
However, long-term experience with bioprocesses has revealed their range of variability. This, along with the increasing understanding of the parameters that influence the quality and action of biomedical products, due to advances in cell biology, the biophysical sciences and especially in analytical techniques, brings this traditional view of biopharmaceutical process performance into question. Rather than trying to constantly repeat an exact protocol, it seems more appropriate to focus on the product itself and guarantee its quality and quantity according to predefined parameters throughout the whole process.
This means that process variability is allowed if it can be ensured that the product quality is not affected. Consequently, as variability of bioprocesses is acknowledged, in principle process feed-back control is also possible.
Furthermore, in biopharmaceutical production processes the purification process has traditionally been considered as the most critical part of the manufacturing process, in terms of effect on product quality and consistency.
However, recent research, especially in the area of bioprocess cell physiology, has revealed a close interconnectivity between up-stream (e.g., fermentation) and down-stream procedures. Small changes in the fermentation process can, for example, affect product modification so that the product separates differently, product variants appear, which disturb the purification, or unwanted compounds are separated with a different efficiency.

74
This illustrates that the new view of focusing on product quality throughout a whole process, demands the application of monitoring methods, not only for the product but for environmental and other parameters as well. Additionally, the opportunity to control a process sheds new light on the question of which parameters are key and provide the relevant information.
Regulatory guidelines are very general in nature, as with process monitoring, and typically do not specify in detail which parameters should be monitored during different manufacturing steps. Guidelines usually state in general terms that critical parameters should be controlled and monitored but leave the responsibility for identifying these critical parameters and steps to the manufacturer. Regulatory guidelines expect that these critical parameters are evaluated case by case and identified during the development phase of the product.
Generally speaking physical parameters (e.g. pH, temperature, pressure, agitation speeds, flow rates etc), and the amount, quality and composition of materials used in processes can be considered as being critical parameters. Some of the most important specific regulatory concerns in the different production steps are as follows:
Cell Banking (simple analytical methods to determine and validate the quality of cell banks based on multi-position gene or protein arrays. Lab-on-chip systems would also be very useful and have a bright future, although they are currently not commercially available):
• genotypic studies (e.g., Southern blotting, copy number analysis, DNA fingerprinting).
• phenotypic characterization (e.g., isoenzyme analysis for mammalian cells or nutrient requirements/antibiotic resistance for prokaryotic cells)
• absence of bacterial or fungal contamination (absence of bacteriophages in prokaryotic cell banks, negative results for mycoplasma in mammalian cell banks
• viral safety (cell banks of mammalian cells and cells of animal origin)
• genetic stability.
Preparations:
• media/component composition, activity, contamination state
• reactor/instrument characterization (currently well established).

75
Fermentation:
• proper physical conditions, monitoring of the cell growth process (e.g., cell density)
• contamination control (interesting solution: (Gabig-Ciminska et al., 2004c)
• monitoring of the product and product formation kinetics (also transport, location, product quality, product purity)
• dynamic monitoring of cellular activities, responses, fate.
Down Stream (purification):
• the capability of the purification process to remove process-related impurities such as cell substrates (e.g., host cell proteins, host cell DNA), cell culture (e.g., inducers, antibiotics, media components, oxidizing or reducing agents, cyanogen bromide, guanidine, inorganic salts, column leachables)
• the consistency of removal of product-related impurities (e.g., precursors, degradation products)
• the consistency of viral removal and viral inactivating steps when appropriate
• the lifetime of purification columns should be justified (e.g., data should be provided to demonstrate that re-use of columns has no effect on product quality, removal of key impurities, or ligand leakage, and that the column regeneration/sanitization procedures are effective)
• demonstration of intermediate product stability to justify any holding points in the process
• monitoring of bioburden and endotoxin levels, consistent product quality, purity and yield.
On-line monitoring techniques have been developed for a number of biotechnological products, such as organic acids, polyhydroxybutyrate (PHB), and antibiotics. However, on-line monitoring of recombinant products has only been described in a few studies where the product was fused to a reporter gene (Benito et al., 1993, Clemmitt et al., 1999) or peptide (Ignatova & Gierasch, 2004). Techniques, which have been proposed for monitoring expression and/or quality of products are FTIR (Ami et al., 2003) and flow cytometry (Lewis et al., 2004, Patkar et al., 2002).
On-line methods for recombinant protein production, which are adaptable to any protein product would be very useful and may be a matter for further studies. In relation to this, the application of FIA techniques with mRNA or protein based chip methods (e.g., Gabig-Ciminska et al., 2004b) may have application potential.

76
6. Conclusions Compared to the chemical and pulp & paper industries bioprocess monitoring and control is still in its infancy. Practically no sophisticated analytical measurements are performed in situ. Generally only �basic� measurements, like physical (temperature, weight, pressure, conductivity, gas and liquid flow, foam level, stirrer speed and power) and chemical measurements (pH, pO2, redox, outgas O2 and CO2) are performed in situ. The application of on-line sensors; such as for glucose or cell density; or the applications of FIA at-line analytical systems has been more the exception than the rule. So far, to guarantee consistent product quality, the principle aim has been to control processes very stringently, i.e. to repeat processes exactly in the same way. This approach is a far from optimized process control strategy. It does not take into account the variability of raw materials or intermediate products and their influence on the process itself or the final product (see Figure 8) Therefore, unexpected and undesirable quality and productivity problems may arise. There are probably several reasons why sophisticated analytical measurements have not been applied commonly in bioprocess monitoring and control, but the lack of process understanding is one key factor for rejecting analytical measurements so far. Unfortunately this has led to a situation where a very important tool for understanding bioprocesses has not been in use, namely analytical measurements.
Pharmaceutical (or API) production by bioprocesses is a special case, where analytical tools and their use in process control has only recently become acceptable, when the US FDA published the �Guidance for Industry PAT � A Framework for Innovative Pharmaceutical Development, Manufacturing, and Quality Assurance� in September 2004.
In this review, we have identified various monitoring needs in bioprocesses, as described in Chapter 5. These needs may be specific to certain process phases, production organisms, or end products, but there is a more general demand for tools to control and optimize bioprocesses manufacturing:
• fermentation models and simulation tools
• metabolic flux analysis/modeling tools
• analytical measurements
• at-line analysis combined with modeling capabilities
• in situ analytical measurements
• control strategies for dynamical bioprocesses
• supervisory software tools.
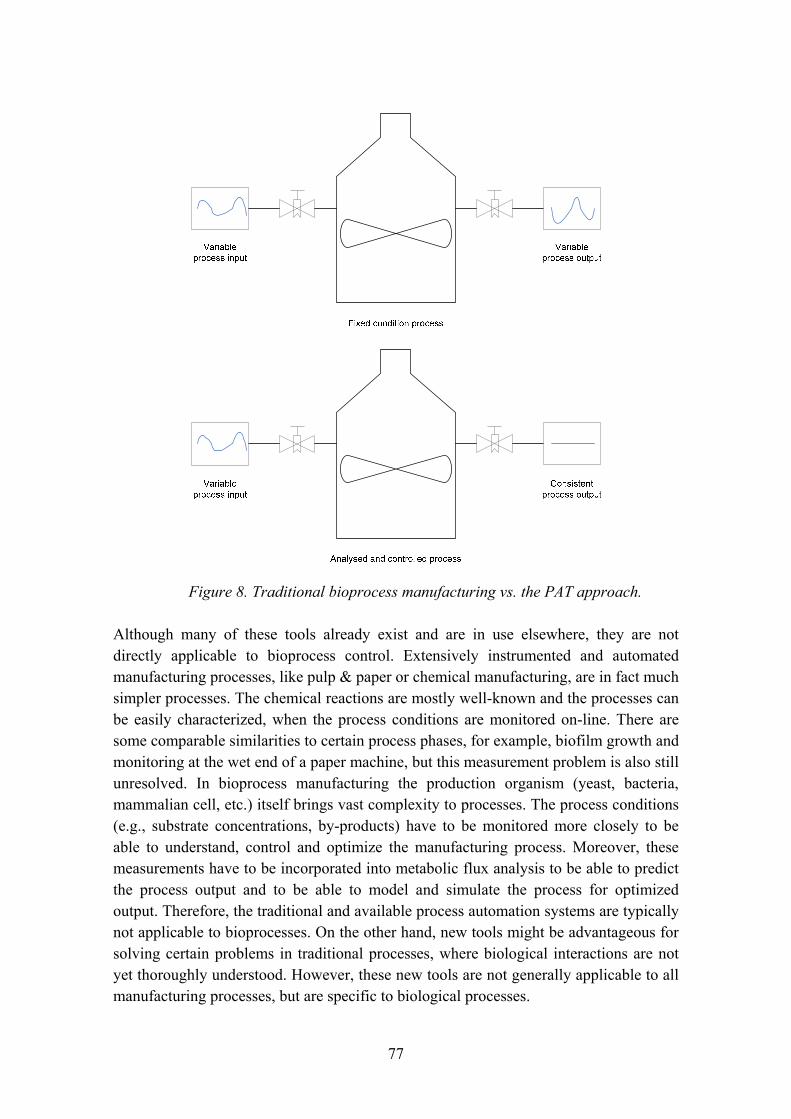
77
Figure 8. Traditional bioprocess manufacturing vs. the PAT approach.
Although many of these tools already exist and are in use elsewhere, they are not directly applicable to bioprocess control. Extensively instrumented and automated manufacturing processes, like pulp & paper or chemical manufacturing, are in fact much simpler processes. The chemical reactions are mostly well-known and the processes can be easily characterized, when the process conditions are monitored on-line. There are some comparable similarities to certain process phases, for example, biofilm growth and monitoring at the wet end of a paper machine, but this measurement problem is also still unresolved. In bioprocess manufacturing the production organism (yeast, bacteria, mammalian cell, etc.) itself brings vast complexity to processes. The process conditions (e.g., substrate concentrations, by-products) have to be monitored more closely to be able to understand, control and optimize the manufacturing process. Moreover, these measurements have to be incorporated into metabolic flux analysis to be able to predict the process output and to be able to model and simulate the process for optimized output. Therefore, the traditional and available process automation systems are typically not applicable to bioprocesses. On the other hand, new tools might be advantageous for solving certain problems in traditional processes, where biological interactions are not yet thoroughly understood. However, these new tools are not generally applicable to all manufacturing processes, but are specific to biological processes.

78
6.1 Proposals
In summary, there are various needs and subjects in the field of bioprocess manufacturing and bioprocess control that should be further developed. Here we propose two complementary approaches to accelerate the progress:
1. enhanced implementation of PAT into existing bioprocesses
2. development of scale-down equipment (minibioreactors, sampling and measurement devices, etc.) as a tool for constructing new models and incorporating these into standard bioprocess development.
These two issues are not separate. We anticipate that in future the combination of these two methods will lead to significantly better quality and productivity in bioprocesses.
6.1.1 Enhanced implementation of PAT into existing bioprocesses
The majority of this review has focused on the �fermentation-phase� of biotechnical manufacturing processes. This is mainly due to the need to understand this complex process phase better, but also due to the fact that the downstream process unit operations utilized in bioprocesses are, process-wise, fairly close to �traditional� chemical process unit operations. For downstream process monitoring commercial analytical tools are already available or can easily be introduced from analytical solutions developed for other manufacturing processes.
How could process analytical technologies be incorporated into existing bioprocesses? We propose an approach, which consists of the following steps (see also Figure 9):
1. construction of process models and tools for simulation, including metabolic flux analysis
2. using modern data processing technologies to mine information from historical process data
3. at-line and laboratory analytical development for raw material testing
4. development of fast sampling and incorporated at-line analytical methods for process monitoring
5. applying the afore-mentioned measurement data to process model development and verification, as well as to on-line process simulation
6. development of in situ analytics (developing new analyzers and applying existing analyzers).

79
TECHNOLOGY
TARGET ORIENTED
�Raw material� analysis
-DNA/RNA arrays-Chemical analysis
-microbial analysis ?...
Process measurements
-pH, temperature- Stirring speed
...
Soft sensors-SOM, ANN, PLS
! yeast, E. coli, mammalian,..! Applying existing process measurements
Modeling-understanding
-control
Process analytics-process connection-optical analyzers
-FIA, SIA -> biosensors
Sampling-substrate /cells-representative
sample
Laboratory analysis-standard lab .
methods vs. potential process analytics
EXPERT system?Process development?Processing equipment
development?
! Sourcing of commercial process analyzers! Development of process anlayzers and process connections
Figure 9. The advancement of process analytical technologies.
6.1.2 Development of the scale-down equipment approach
The �scale-down approach� will be used, for example, for strain/cell-line development and bioprocess optimization purposes, as well as for the development of control tools for full-scale processes. Moreover, the extensive measurement information from small-scale trials will be transferred as input data into full-scale bioprocess models and thus used to study and control critical process parameters (especially in regard to quality), and furthermore, to establish the optimum full-scale manufacturing parameters.
Strain and cell-line development together with PAT is a key issue for achieving better quality and productivity in bioprocesses. There is clearly a need to automate and accelerate this development and to combine the information obtained with full-scale bioprocess models.
80
References Albano, C.R., Randers-Eichhorn, L., Bentley, W.E. & Rao, G. (1998) Green fluorescent protein as a real time quantitative reporter of heterologous protein production. Biotechnology Progress, 14, 2, pp. 351�354.
Altkorn, R., Koev, I. & Pelletier, M.J. (1999) Raman Performance Characteristics of Teflon-AF 2400 Liquid-Core Optical-Fiber Sample Cells. Appl. Spectrosc., 53, pp. 1169�1176.
Ami, D., Bonecchi, L., Cali, S., Orsini, G., Tonon, G. & Doglia, S.M. (2003) FT-IR study of heterologous protein expression in recombinant Escherichia coli strains, Biochim. Biophys. Acta, Vol. 1624, No. 1�3, pp. 6�10.
Ami, D., Natalello, A., Gatti-Lafranconi, P., Lotti, M. & Doglia, S.M. (2005) Kinetics of inclusion body formation studied in intact cells by FT-IR spectroscopy. FEBS Lett., 579, 3433�3436.
Ami, D., Natalello, A., Taylor, G., Tonon, G. & Maria, D.S. (2006) Structural analysis of protein inclusion bodies by Fourier transform infrared microspectroscopy. Biochim. Biophys. Acta, 1764, pp. 793�799.
Anonymous (1993) FDA Points to Consider in the characterization of cell lines used to produce biologicals.
Anonymous (1995) ICH Q5B: Quality of Biotechnological Products: Analysis of the expression construct in cells used for production of r-DNA derived protein products.
Anonymous (1996) CPMP�s Note for Guidance on Virus Validation Studies: the Design, Contribution and Interpretation of Studies Validating the Inactivation and Removal of Viruses.
Anonymous (1997a) ICH Q5A: Viral Safety Evaluation of Biotechnology Products Derived from Cell Lines of Human or Animal Origin.
Anonymous (1997b) ICH Q5D: Quality of Biotechnological Products: Derivation and characterization of cell substrates used for production of biotechnological/biological products.
Anonymous (1998) Eudralex Volume 4 � Medicinal Products for Human and Veterinary Use: Good Manufacturing Practice.

81
Anonymous (1999a) ICH Q6A: Specifications: Test Procedures and Acceptance Criteria for New Drug Substances and New Drug Products: Chemical Substances.
Anonymous (1999b) ICH Q6B: Specifications: Test Procedures and Acceptance Criteria for Biotechnological/Biological Products.
Anonymous (2001) Eudralex Volume 4 � Medicinal Products for Human and Veterinary Use: Good Manufacturing Practice Annex 18: Good Manufacturing Practice for Active Pharmaceutical Ingredients.
Anonymous (2003a) Eudralex Volume 4 � Medicinal Products for Human and Veterinary Use: Good Manufacturing Practice Annex 13: Manufacture of Investigational Medicinal products.
Anonymous (2003b) CPMP Note for Guidance on the Use of Bovine Serum in the Manufacture of Human Biological Medicinal Products.
Anonymous (2003c) Eudralex Volume 4 � Medicinal Products for Human and Veterinary Use: Good Manufacturing Practice Annex 1: Manufacture of Sterile Medicinal Products.
Anonymous (2004a) Guidance for Industry PAT � A Framework for Innovative Pharmaceutical Development, Manufacturing, and Quality Assurance, FDA. http://www.fda.gov/cder/guidance/6419fnl.pdf (accessed 23.3.2005).
Anonymous (2004b) FDA Guidance for Industry Sterile Drug Products Produced by Aseptic Processing � Current Good Manufacturing Practice.
Anonymous (2005a) IMS World Review 2003. http://www.ims-global.com, 9.4.2005.
Anonymous (2005b) IMS Health highlights global pharma status. Chemical Marketing Reporter 267, March 21, 2005. 3 p.
Anonymous (2005c) An overdose of bad news � The drugs industry. The Economist 374, March 19, 2005. 89 p.
Anonymous (2005d) PhRMA Survey 2004: Medicines in development Biotechnology. http://www.phrma.org, 9.4.2005. 43 p.
Anonymous (2005e) http://www.control.hut.fi/Research/Sose/.
82
Anonymous (2005f) 21 CFR Part 211 Current Good Manufacturing Practice for Finished Pharmaceuticals. http://www.access.gpo.gov/nara/cfr/waisidx_05/21cfr211_05.html.
Anonymous (2005g) The European Medicines Agency Road Map to 2010: Preparing the Ground for the Future, EMEA. http://www.emea.eu.int/pdfs/general/direct/directory/3416303enF.pdf (accessed 23.3.2005).
Arauzo-Bravo, M.J., Cano-Izquierdo, J.M., Gomez-Sanchez, E., Lopez-Nieto, M.J., Dimitriadis, Y.A. & Lopez-Coronado, J. (2004) Automatization of a penicillin production process with soft sensors and an adaptive controller based on neuro fuzzy systems. Control Engineering Practice, 12, pp. 1073�1090.
Arnold, S.A., Gaensakoo, R., Harvey, L.M. & McNeil, B. (2002) Use of at-line and in situ near-infrared spectroscopy to monitor biomass in an industrial fed-batch Escherichia coli process. Biotechnol. Bioeng., 80, pp. 405�413.
Arnold, S.A., Harvey, L.M. et al. (2003a) Employing near-infrared spectroscopic methods of analysis for fermentation monitoring and control: Part 2, implementation strategies. BioPharm International, 16(1), pp. 47�49+70.
Arnold, S.A., Crowley, J. et al. (2003b) In situ near infrared spectroscopy to monitor key analytes in mammalian cell cultivation. Biotechnology and Bioengineering, 84(1), pp. 13�19.
van Arnum, P. (2005) US pharma majors face earnings slowdown. Chemical Marketing Reporter 267, March 21 (2005) 4.
Baker, K.N., Rendall, M.H. et al. (2002) Rapid monitoring of recombinant protein products: a comparison of current technologies. Trends in Biotechnology, 20(4), pp. 149�156.
Bambot, S.B., Holavanahali, R. et al. (1994) Phase fluorometric sterilizable optical oxygen sensor. Biotechnology and Bioengineering, 43(11), pp. 1139�1145.
Bedu-Addo, F.K. (2004) Understanding Lyophilization Formulation Development. Pharmaceutical Technology, Lyophilization 2004.
Benito, A., Valero, F., Lafuente, J., Vidal, M., Cairo, J., Sola, C. & Villaverde, A. (1993) Uses of beta-galactosidase tag in on-line monitoring production of fusion proteins and gene expression in Escherichia coli. Enzyme Microb. Technol., Vol. 15, No. 1, pp. 66�71.

83
Berry, S. (2002) Biotech meets the investors. Trends in biotechnology, 20, pp. 370�371.
Bicciato, S., Bagno, A., Solda, M., Manfredini, R. & Di Bello, C. (2002) Fermentation diagnosis by multivariate statistical analysis. Appl. Biochem. Biotechnol., Vol. 102�103, No. 1�6, pp. 49�62.
Bracewell, D.G., Gill, A. & Hoare, M. (2002) An In-line Flow Injection Optical Biosensor for Real-time Bioprocess Monitoring. Trans IChemE, Vol. 80, part C.
Bylund, F., Castan, A., Mikkola, R., Veide, A. & Larsson, G. (2000) Influence of scale-up on the quality of recombinant human growth hormone. Biotechnol. Bioengin., 69 (2), pp. 119�128.
Cabrita, L.D. & Bottomley, S.P. (2004) Protein expression and refolding � A practical guide to getting the most out of inclusion bodies. Biotechnol. Annu. Rev., Vol. 10, pp. 31�50.
Cannizzarro, C., Rhiel, M., Marison, I. & von Stockar, U. (2003) On-Line Monitoring of Phaffia rhodozyma Fed-Batch Process With In Situ Dispersive Raman Spectroscopy. Biotechnol. Bioeng., 83, pp. 668�680.
Carroll, A.D., Scampavia, L., Luo, D., Lernmark, Å. & Ruzicka, J. (2003) Bead injection ELISA for the determination of antibodies implicated in type 1 diabetes mellitus. Analyst, 128(9), pp. 1157�1162.
Cha, H.J., Dalal, N.G. & Bentley, W.E. (2004) In vivo monitoring of intracellular expression of human interleukin-2 using green fluorescent protein fusion partner in Pichia pastoris. Biotechnology Letters, Vol. 26, Issue 14, pp. 1157�1162.
Chen, Y. & Ruzicka, J. (2004) Accelerated micro-sequential injection in lab-on-valve format, applied to enzymatic assays. Analyst, 129(7), pp. 597�601.
Cini, P. & Schneider, R.E. (2004) The push for modern manufacturing, Pharmaceutical Executive, 24, 3, pp. 86�95.
Clemens, A.H., Chang, P.H. et al. (1976) Development of an automatic system of insulin infusion controlled by blood sugar, its system for the determination of glucose and control algorithms. Journees annuelles de diabetologie de l�Hotel-Dieu, pp. 269�278.
84
Clemmitt, R.H., Bruce, L.J. & Chase, H.A. (1999) On-line monitoring of the purification of GST-(His)6 from an unclarified Escherichia coli homogenate within an immobilised metal affinity expanded bed. Bioseparation., Vol. 8, No. 1�5, pp. 53�67.
Crowley, J., Arnold, S.A. et al. (2005) Monitoring a high cell density recombinant Pichia pastoris fed-batch bioprocess using transmission and reflectance near infrared spectroscopy. Enzyme and Microbial Technology, 36(5�6), pp. 621�628.
De Jong, H. (2003) Qualitative Modeling and Simulation of Genetic Regulatory Networks. European Symposium on Intelligent Technologies, Hybrid Systems and their implementation on Smart Adaptive Systems. July 10�11, 2003, Oulu, Finland.
Doak, D.L. & Phillips, J.A. (1999) In Situ Monitoring of an Escherichia coli Fermentation Using a Diamond Composition ATR Probe and Mid-Infrared Spectroscopy. Biotechnol. Prog., 15, pp. 529�539.
Eerikäinen, T., Linko, P., Linko, S., Siimes, T. & Zhu, Y.-H. (1993) Fuzzy and neural computing in food science and technology. Trends in Food Science and Technol., 4(8), pp. 237�242.
Enfors, S.O., Jahic, M., Rozkov, A., Xu, B., Hecker, M., Jurgen, B., Kruger, E., Schweder, T., Hamer, G., O�Beirne, D., Noisommit-Rizzi, N., Reuss, M., Boone, L., Hewitt, C., McFarlane, C., Nienow, A., Kovacs, T., Tragardh, C., Fuchs, L., Revstedt, J., Friberg, P.C., Hjertager, B., Blomsten, G., Skogman, H., Hjort, S., Hoeks, F., Lin, H. Y., Neubauer, P., van der Lans, R., Luyben, K., Vrabel, P. & Manelius, A. (2001) Physiological responses to mixing in large scale bioreactors. Journal of Biotechnology, Vol. 85, No. 2, pp. 175�185.
Fahnert, B. (2004) Folding-promoting agents in recombinant protein production. Methods Mol. Biol., Vol. 267, pp. 53�74.
Fahnert, B., Lilie, H. & Neubauer, P. (2004) Inclusion bodies: formation and utilization. Adv. Biochem. Eng. Biotechnol., Vol. 89, pp. 93�142.
Fan, C., Plaxco, K.W. et al. (2005) Biosensors based on binding-modulated donor-acceptor distances. Trends in Biotechnology, 23(4), pp. 186�192.
Funabashi, H., Imajo, T. et al. (1999) Bioluminescent monitoring of intracellular ATP during fermentation. Luminescence. The Journal of Biological and Chemical Luminescence 18th Symposium on Bioluminescence and Chemiluminescence, May 1999, 14(6), pp. 291�296.

85
Gabig-Ciminska, M., Andresen, H., Albers, J., Hintsche, R. & Enfors, S.O. (2004b) Identification of pathogenic microbial cells and spores by electrochemical detection on a biochip. Microb. Cell Fact., Vol. 3, No. 1, p. 2.
Gabig-Ciminska, M., Holmgren, A., Andresen, H., Bundvig, B.K., Wumpelmann, M., Albers, J., Hintsche, R., Breitenstein, A., Neubauer, P., Los, M., Czyz, A., Wegrzyn, G., Silfversparre, G., Jurgen, B., Schweder, T. & Enfors, S.O. (2004a) Electric chips for rapid detection and quantification of nucleic acids. Biosens. Bioelectron., Vol. 19, No. 6, pp. 537�546.
Gabig-Ciminska, M., Los, M., Holmgren, A., Albers, J., Czyz, A., Hintsche, R., Wegrzyn, G. & Enfors, S.O. (2004c) Detection of bacteriophage infection and prophage induction in bacterial cultures by means of electric DNA chips. Anal. Biochem., Vol. 324, No. 1, pp. 84�91.
Gerckel, I., Garcia, A. et al. (1993) Dielectric spectroscopy of mammalian cells. Cytotechnology (Historical Archive), 13(3), pp. 185�193.
Gschwend, K., Beyeler, W. et al. (1983) Detection Of Reactor Nonhomogeneities By Measuring Culture Fluorescence. Biotechnology and Bioengineering, 25(11), pp. 2789�2793.
Gupta, R., Beg, Q.K., Khan, S. & Chauhan, B. (2002) An overview on fermentation, downstream processing and properties of microbial alkaline proteases. Appl. Microbiol. Biotechnol., Vol. 60, No. 4, pp. 381�395.
Guthke, R., Scmidt-Heck, W., Matthaeus, F. & Pfaff, M. (2002) Gene Expression Based Hybrid Modelling of Metabolic Adaptation in Antibiotic Producing Streptomycetes. European Symposium on Intelligent Technologies, Hybrid Systems and their implementation on Smart Adaptive Systems. September 19�21, 2002, Albufeira, Algarve, Portugal. Pp. 627�640.
Guthke, R., Thies, F. & Moeller, U. (2003) Data- and knowledge driven dynamic modeling of the immune response to bacterial infection. European Symposium on Intelligent Technologies, Hybrid Systems and their implementation on Smart Adaptive Systems. July 10�11, 2003, Oulu, Finland. Pp. 363�369.
Hagedorn, A., Legge, R.L. & Budman, H. (2003) Spectrofluorometry As Estimating Tool In Fed-Batch Fermentations. Biotechnology and Bioengineering, 83, pp. 104�111.
Han, L. (2002) Physiology of Escherichia coli in Batch and Fed-batch Cultures with Special Emphasis on Amino Acid and Glucose Metabolism. Department of
86
Biotechnology, Royal Institute of Technology, Stockholm, Sweden. ISBN 91-7283-276-2.
Hansen, E.H. (2004) The impact of flow injection on modern chemical analysis: has it fulfilled our expectations? And where are we going? Talanta, 64, pp. 1076�1083.
Hansen, M.L. (2003) A Focus on Bovine Serum Quality and Safety: The EMEA�s Note for Guidance. http://www.jrhbio.com/pdf/JRH � Newsletter 2.pdf.
Hanson, G.T., Aggeler, R., Oglesbee, D., Cannon, M., Capaldi, R.A., Tsien, R.Y. & Remington, S.J. (2004) Investigating Mitochondrial Redox Potential with Redox sensitive Green Fluorescent Protein Indicators. J. Biol. Chem. Mar 26, 279(13), pp. 13044�13053
Harthun, S., Matischak, K. et al. (1997) Determination of recombinant protein in animal cell culture supernatant by near-infrared spectroscopy. Analytical Biochemistry, 251(1), pp. 73�78.
Harthun, S., Matischak, K. et al. (1998) Simultaneous prediction of human antithrombin III and main metabolites in animal cell culture processes by near-infrared spectroscopy. Biotechnology Techniques, 12(5), pp. 393�398.
Hecker, M. & Volker, U. (2004) Towards a comprehensive understanding of Bacillus subtilis cell physiology by physiological proteomics. Proteomics, Vol. 4, No. 12, pp. 3727�3750.
Heikkinen, M., Kolehmainen, M. & Hiltunen, Y. (2004) Classification of Process Phases Using Self-Organizing Maps and Sammon�s Mapping for Investigating Activated Sludge Treatment Plant in a Pulp Mill. In: European Symposium on Intelligent Technologies, Hybrid Systems and their implementation on Smart Adaptive Systems, Verlag Mainz, Aachen. Pp. 391�397.
Hoch, G. & Kok, B. (1963) A mass spectrometer inlet system for sampling gases dissolved in liquid phases. Archives in Biochemistry and Biophysics, 101, pp. 160�170.
Ignatova, Z. & Gierasch, L.M. (2004) Monitoring protein stability and aggregation in vivo by real-time fluorescent labeling. Proc. Natl. Acad. Sci. U.S.A, Vol. 101, No. 2, pp. 523�528.

87
Jahic, M., Gustavsson, M., Jansen, A.K., Martinelle, M. & Enfors, S.O. (2003a) Analysis and control of proteolysis of a fusion protein in Pichia pastoris fed-batch processes. J. Biotechnol., Vol. 102, No. 1, pp. 45�53.
Jahic, M., Wallberg, F., Bollok, M., Garcia, P. & Enfors, S.O. (2003b) Temperature limited fed-batch technique for control of proteolysis in Pichia pastoris bioreactor cultures. Microb.Cell Fact., Vol. 2, No. 1, p. 6.
Jarvis, L. (2005) Big pharma margins remain under pressure. Chemical Marketing Reporter 267, February 7 (2005) 14.
Joeris, K., Frerichs, J.-G., Konstantinov, K. & Scheper, T. (2002) In situ microscopy: online process monitoring of mammalian cell cultures. Cytotechnology, 38, pp. 129�13.
Juuso, E.K. (1997) Intelligent Methods in Diagnostical Process Analysis. Proceedings of the XIV IMEKO World Congress, New measurements � Challenges and Visions, Tampere, June 1�6, 1997 (J. Halttunen, ed.), Vol. VII. Pp. 1�6.
Juuso, E.K. (2004a) Integration of Intelligent Systems in Development of Smart Adaptive Systems. International Journal of Approximate Reasoning, Vol. 35, Issue 3, March 2004, pp. 307�337.
Juuso, E.K. (2004b) Modelling and simulation with intelligent methods. � White paper 115 of Sim-Serv � The World�s First Virtual Centre for Simulation. 17 p. https://www.sim-serv.com/pdf/whitepapers/whitepaper 115.pdf.
Juuso, E. & Leiviskä, K. (2004) Eunite Roadmap Contribution from IBA A: Intelligent Systems in Production Industries. http://www.eunite.org.
Juuso, E.K. & Kronlöf, J. (2005) Model-based monitoring of immobilized yeast fermentation using fuzzy logic and linguistic equations. 16th IFAC World Congress, July 4�8, 2005, Prague.
Kacmar, J., Zamamiri, A., Carlson, R., Abu-Absi, N.R. & Srienc, F. (2004) Single-cell variability in growing Saccharomyces cerevisiae cell populations measured with automated flow cytometry. Journal of Biotechnology, 109:3, pp. 239�254.
Kauppinen, J., Wilcken, K., Kauppinen, I. & Koskinen, V. (2004) High sensitivity in gas analysis with photoacoustic detection. Microchem. J., 76, pp. 151�159.
88
Kivikunnas, S., Bergonzini Corradini, M. & Juuso, E. (1996a) Fuzzy conversion estimation in fermentation control. In: L. Yliniemi, E. Juuso (eds.), Proceedings of TOOLMET�96 (Oulu, April 1�2, 1996), University of Oulu, Control Engineering Laboratory, Report A No 4. Pp. 177�186.
Kivikunnas, S., Ibatici, K. & Juuso, E. (1996b) Process trend analysis and fuzzy reasoning in fermentation control. In: B. G. Mertzios, P. Liatsis (eds.), Proceedings of IWISP�96 (Manchester, Nov. 4�7, 1996). Pp. 137�140.
Kivioja, T., Arvas, M., Kataja, K., Penttilä, M., Söderlund, H. & Ukkonen, E. (2002) Assigning probes into a small number of pools separable by electrophoresis. Bioinformatics, 18, pp. 199�206.
Konstantinov, K., Chuppa, S. et al. (1994) Real-time biomass-concentration monitoring in animal-cell cultures. Trends in Biotechnology, 12(8), pp. 324�333.
Konstantinov, K.B., Pambayun, R., Matanguihan, R., Yoshida, T., Perusicn, C.M. & Hu, W.S. (2004) On-line monitoring of hybridoma cell growth using a laser turbidity sensor. Biotechnol. Bioeng., 40(11), pp. 1337�1342.
Kornmann, H., Rhiel, M., Cannizzarro, C., Marison, I. & von Stockar, U. (2003) Methodology for Real-Time, Multianalyte Monitoring of Fermentations Using an In-Situ Mid-Infrared sensor. Biotechnol. Bioeng., 82, pp. 702�709.
Kornmann, H., Valentinotti, S., Duboc, P., Marison, I. & von Stockar, U. (2004) Monitoring and Control of Gluconacetobacter xylinus fed-batch cultures using in situ mid-IR spectroscopy. J. Biotechnol., 113, pp. 231�245.
Kostov, Y., Albano, C.R. & Rao, G. (2000) All solid-state GFP sensor. Biotechnology and Bioengineering, 70, 4, pp. 473�477.
Kramer, K.-D., Patzwahl, S., Nacke, T. & Frense, D. (2002) Computational Intelligence � Design Tool for Use in Biotechnological Process Monitoring. European Symposium on Intelligent Technologies, Hybrid Systems and their implementation on Smart Adaptive Systems. September 19�21, 2002, Albufeira, Algarve, Portugal. Pp. 198�205.
Kumar, M.A., Thakur, M.S., Senthuran, A., Karanth, N.G., Hatti-Kaul, R. & Mattiasson, B. (2001) An automated flow injection analysis system for on-line monitoring of glucose and L-lactate during lactic acid fermentation in a recycle bioreactor. World Journal of Microbiology & Biotechnology, 17, pp. 23�29.
89
Kupp, G.D. (2003) Challenges, Considerations, and Benefits of Raw Materials Testing. Pharmaceutical Technology, Feb 1, pp. 22�27.
Lauritsen, F.R., Kotiaho, T., Choudry, T.C. & Cooks, R.G. (1992a) Direct detection and identification of volatile organic compounds dissolved in organic solvents by reverse-phase membrane introduction mass spectrometry. Analytical Chemistry, 64, pp. 1205�1211.
Lauritsen, F.R., Choudry, T.C., Dejarme, L.E. & Cooks, R.G. (1992b) Microporous membrane introduction mass spectrometry with solvent chemical ionization and glow-discharge for the direct detection of volatile organic compounds in aqueous solution. Analytica Chimica Acta, 212, pp. 1�12.
Lennox, B., Montague, G.A., Hiden, H.G., Kornfeld, G. & Goulding, P.R. (2001) Process monitoring of an industrial fed-batch fermentation. Biotechnology and Bioengineering, 74, pp. 125�135.
Leskelä, T., Tilsala-Timisjärvi, A., Kusnetsov, J., Neubauer, P. & Breitenstein, A. (2005) Rapid and sensitive genus specific detection of Legionella by a 16S rRNA based sandwich hybridization assay. J. Microbiol. Methods 2005. Ref Type. (In Press.)
Lewis, C.B., McNichols, R.J., Gowda, A. & Cote, G.L. (2000) Investigation of Near-Infrared Spectroscopy for Periodic Determination of Glucose in Cell Culture Media in Situ. Appl. Spectrosc., 54, pp. 1453�1457.
Lewis, G., Taylor, I.W., Nienow, A.W. & Hewitt, C.J. (2004) The application of multi-parameter flow cytometry to the study of recombinant Escherichia coli batch fermentation processes. J. Ind. Microbiol. Biotechnol., Vol. 31, No. 7, pp. 311�322.
Li, J., Xu, H., Herber, W.K., Bentley, W.E. & Rao, G. (2002) Integrated bioprocessing in Saccharomyces cerevisiae using green fluorescent protein as a fusion partner. Biotechnology and Bioengineering, 79(6), pp. 682�693.
Liedberg, B., Nylander, C. & Lundstrm, I. (1983) Surface plasmon resonance for gas detection and biosensing. Sensors and Actuators, 4, pp. 299�304.
Lilie, H., Schwarz, E. & Rudolph, R. (1998) Advances in refolding of proteins produced in E. coli. Curr. Opin. Biotechnol., Vol. 9, No. 5, pp. 497�501.
Lin, H.Y. & Neubauer, P. (2000) Influence of controlled glucose oscillations on a fed-batch process of recombinant Escherichia coli. Journal of Biotechnology, Vol. 79, No. 1, pp. 27�37.
90
Lin, H.Y., Mathiszik, B., Xu, B., Enfors, S.O. & Neubauer, P. (2001) Determination of the maximum specific uptake capacities for glucose and oxygen in glucose-limited fed-batch cultivations of Escherichia coli. Biotechnology and Bioengineering, Vol. 73, No. 5, pp. 347�357.
Linko, P., Kosola, A., Siimes, T., Zhu, Y.-H. & Eerikäinen, T. (1994) Hybrid fuzzy neural bioprocess control. In: Proceedings of EUFIT �94 � Second European Congress on Intelligent Techniques and Soft Computing, Aachen, Germany, Sept. 20�23. Pp. 84�90.
Little, A.D. (2004) Optimisation de l�attractivité de la France pour la production biologique, a study for Leem (Les enteprises du medicament, France), 2004 (source for analysis: http://www.phrma.org).
Llopis, J., McCaffery, J.M., Miyawaki, A., Farquhar, M.G. & Tsien, R.Y. (1998) Measurement of cytosolic, mitochondrial, and Golgi pH in single living cells with green fluorescent proteins. PNAS Jun 09, 95(12), pp. 6803�6808.
Macaloney, G., Hall, J.W. et al. (1997) The utility and performance of near-infra red spectroscopy in simultaneous monitoring of multiple components in a high cell density recombinant Escherichia coli production process. Bioprocess Engineering, 17(3), p. 157.
March, J.C., Rao, G. & Bentley, W.E. (2003) Biotechnological applications of green fluorescent protein. Appl. Microbiol. Biotechnol., 62, pp. 303�315.
Marose, S., Lindemann, C. et al. (1998) Two-dimensional fluorescence spectroscopy: A new tool for on-line bioprocess monitoring. Biotechnology Progress, 14(1), pp. 63�74.
Marose, S., Lindemann, C. et al. (1999) Optical sensor systems for bioprocess monitoring. Trends in Biotechnology, 17(1), pp. 30�34.
Mark, B.A., Ebtinger, M., Vertes, A.A. & Middelberg, A.P. (2002) Effect of operating variables on the yield of recombinant trypsinogen for a pulse-fed dilution-refolding reactor. Biotechnology Bioengineering, Vol. 77, No. 4, pp. 435�444.
Markx, G.H. & Kell, D.B. (1995) The use of dielectric permittivity for the control of the biomass level during biotransformations of toxic substrates in continuous culture. Biotechnology Progress, 11(1), pp. 64�70.

91
Matanguihan, R.M., Konstantinov, K.B. et al. (1994) Dielectric measurement to monitor the growth and the physiological states of biological cells. Bioprocess Engineering, 11(6), pp. 213�222.
van de Merbel, N.C., Lingeman, H. & Brinkman, U.A Th. (1996) Sampling and analytical strategies in on-line bioprocess monitoring and control. Journal of Chromatography A, 725, pp. 13�27.
Middelberg, A.P. (2002) Preparative protein refolding. Trends Biotechnol., Vol. 20, No. 10, pp. 437�443.
Morgan, J., Joyce-Menekse, M.E., Rowlands, R.T., Gilbert, I.H. & Lloyd, D. (2001) Rapid and sensitive quantitation of antibiotics in fermentations by electrospray mass spectrometry. Rapid Commun. Mass. Spectrom., Vol. 15, No. 14, pp. 1229�1238.
Nakamichi, K., Suehara, K.-I. et al. (2002) Measurement of the concentrations of mannosyl erythritol lipid and soybean oil in the glycolipid fermentation process using near infrared spectroscopy. Journal of Near Infrared Spectroscopy, 10(1), pp. 53�61.
Nandakumar, R., Nandakumar, M.P. & Mattiasson, B. (2000) Quantification of nisin in flow-injection immunoassay systems. Biosens. Bioelectron., Vol. 15, No. 5�6, pp. 241�247.
Navratil, M., Norberg, A. et al. (2005) On-line multi-analyzer monitoring of biomass, glucose and acetate for growth rate control of a Vibrio cholerae fed-batch cultivation. Journal of Biotechnology, 115(1), pp. 67�79.
Neubauer, P., Ahman, M., Törnkvist, M., Larsson, G. & Enfors, S.-O. (1995a) Response of guanosine tetraphosphate to glucose fluctuations in fed-batch cultivations of Escherichia coli. J. Biotechnol., Vol. 43, No. 3, pp. 195�204.
Neubauer, P., Häggström, L. & Enfors, S.-O. (1995b) Influence of substrate oscillations on acetate formation and growth yield in E. coli glucose limited fed-batch fermentations. Biotechnology Bioengineering, Vol. 47, No. 2, pp. 139�146.
Neubauer, P. & Winter, J. (2001) Expression and fermentation strategies for recombinant protein production in Escherichia coli. In: O.-W. Merten et al. (eds.), Recombinant Protein Production with prokaryotic and eukaryotic cells. A comparative view on host physiology, Vol. 2. Dortrecht, The Netherlands: Kluwer Academic Publisher. Pp. 196�260.
92
Neubauer, P., Lin, H.Y. & Mathiszik, B. (2003) Metabolic load of recombinant protein production: Inhibition of cellular capacities for glucose uptake and respiration after induction of a heterologous gene in Escherichia coli. Biotechnology and Bioengineering, Vol. 83, No. 1, pp. 53�64.
Osborne, B., Fearn, T. & Hindle, P. (1993) Practical NIR spectroscopy with applications in food and beverage analysis. Harlow, UK: Longman Scientific & Technical.
Panda, A.K. (2003) Bioprocessing of therapeutic proteins from the inclusion bodies of Escherichia coli. Adv. Biochem. Eng. Biotechnol., Vol. 85, pp. 43�93.
Patkar, A., Vijayasankaran, N., Urry, D.W. & Srienc, F. (2002) Flow cytometry as a useful tool for process development: rapid evaluation of expression systems. J. Biotechnol., Vol. 93, No. 3, pp. 217�229.
Pavlickova, P., Schneider, E.M. et al. (2004) Advances in recombinant antibody microarrays. Clinica Chimica Acta, 343(1�2), pp. 17�35.
Pelletier, M.J. & Altkorn, R. (2000) Efficient Elimination of Fluorescence Background from Raman Spectra Collected in a Liquid Core Optical Fiber. Appl. Spectrosc., 54, pp. 1837�1841.
Pollard, D.J., Buccino, R., Connors, N.C., Kirschner, T.F., Olewinski, R.C., Saini, K. & Salmon, P.M. (2001) Real-time analyte monitoring of a fungal fermentation, at pilot scale, using in situ mid-infrared spectroscopy. Bioproc. Biosyst. Eng., 24, pp. 13�24.
Pulli, T., Söderlund, H. et al. (2005) One-step homogeneous immunoassay for small analytes. Analytical Chemistry, 77(8), pp. 2637�2642.
Ramanathan, K. & Danielsson, B. (2001) Principles and applications of thermal biosensors. Biosensors & Bioelectronics, 16, pp. 417�423.
Randers-Eichhorn, L., Albano, C.R. et al. (1997) On-line green fluorescent protein sensor with LED excitation. Biotechnology and Bioengineering, 55(6), pp. 921�926.
Rank, M., Gram, J., Stern Nielsen, K. & Danielsson, B. (1995) On-line monitoring of ethanol, acetaldehyde and glycerol during industrial fermentations with Saccharomyces cerevisiae. Applied Microbiology and Biotechnology, 42, pp. 6�813�817.

93
Rautio, J., Barken, K.B., Lahdenpera, J., Breitenstein, A., Molin, S. & Neubauer, P. (2003) Sandwich hybridisation assay for quantitative detection of yeast RNAs in crude cell lysates. Microb. Cell Fact., Vol. 2, No. 1, p. 4.
Reischer, H., Schotola, I., Striedner, G., Pötschacher, F. & Bayer, K. (2004) Evaluation of the GFP signal and its aptitude for novel on-line monitoring strategies of recombinant fermentation processes. Journal of Biotechnology, Vol. 108, Issue 2, pp. 115�125.
Resina, D., Serrano, A., Valero, F. & Ferrer, P. (2004) Expression of a Rhizopus oryzae lipase in Pichia pastoris under control of the nitrogen source-regulated formaldehyde dehydrogenase promoter. J. Biotechnol., Vol. 109, No. 1�2, pp. 103�113.
Reuss, M., Piehl, H. & Wagner, F. (1975) Application of mass spectrometry to the measurement of dissolved gases and volatile substances. European Journal for Applied Microbiology, 1, pp. 323�325.
Rhiel, M., Ducommun, P., Bolzonella, I., Marison, I. & von Stockar, U. (2002) Real-Time In Situ Monitoring of Freely Suspended and Immobilized Cell Cultures Based on Mid-Infrared Spectroscopic Measurements. Biotechnol. Bioeng., 77, pp. 174�185.
Rich, R.L. & Myszka, D.G. (2005) Survey of the year 2003 commercial optical biosensor literature. Journal of Molecular Recognition, 18(1), pp. 1�39.
Saarela, U., Leiviskä, K., Juuso, E. & Kosola, A. (2003a) Modelling of a fed-batch enzyme fermentation process. IFAC International Conference on Intelligent Control Systems and Signal Processing. Faro, Portugal, April 08�11, 2003.
Saarela, U., Leiviskä, K. & Juuso, E. (2003b) Modelling of a Fed-batch Fermentation Process. � Control Engineering Laboratory, Report A no. 21. Oulu: University of Oulu. 23 p.
Scheper, T. & Schügerl, K. (1986) Characterization of bioreactors by in situ fluorometry. Journal of Biotechnology, 3(4), pp. 221�229.
Scheper, T.H., Hilmer, J.M., Lammers, F., Müller, C. & Reinecke, M. (1996) Biosensors in bioprocess monitoring, Journal of Chromatography A, Vol. 725, Issue 1, pp. 3�12.
Schügerl, K. (2001) Progress in monitoring, modeling and control of bioprocesses during the last 20 years. Journal of Biotechnology, 85(2), pp. 149�173.

94
Schulz, C.M., Scampavia, L. & Ruzicka, J. (2002) Real-time monitoring of lactate extrusion and glucose consumption of cultured cells using a lab-on-valve system. Analyst, 127(12), pp. 1583�1588.
Schultz, J.S. & Taylor, R.F. (1996) Introduction to chemical and biological sensors. In: Taylor, R.F. & Schultz, J.S. (eds.), Handbook of Chemical and Biological Sensors. IOP Publishing. ISBN 0-7503-0323-9. Pp. 1�10.
Schmidt-Heck, W., Guthke, R., Toepfer, S., Reischer, H., Dürrschmid, K. & Bayer, K. (2004) Reverse engineering of the stress response during expression of a recombinant protein. In: Proceedings of the EUNITE 2004 European Symposium on Intelligent Technologies, Hybrid Systems and their Implementation on Smart Adaptive Systems, June 10�12, 2004, Aachen, Germany, Verlag Mainz, Wissenschaftsverlag, Aachen, 2004. Pp. 407�412.
Schweder, T. & Hecker, M. (2004) Monitoring of stress responses. Adv. Biochem. Eng Biotechnol., Vol. 89, pp. 47�71.
Schweder, T. & Neubauer, P. (2005) Bioprocess Analysis. Encyclopedia of Analytical Science volume 2e. Academic Press. Elsevier. Pp. 337�343.
Sinacola, J.R. & Robinson, A.S. (2002) Rapid refolding and polishing of single-chain antibodies from Escherichia coli inclusion bodies. Protein Expr. Purif., Vol. 26, No. 2, pp. 301�308.
Shadle, P.J. (Feb 1, 2004) Qualification of raw materials for biopharmaceutical use. http://www.biopharminternational.com/biopharm/article/articleDetail.jsp?id=86831.
Shaw, A.D., Kaderbhai, N., Jones, A., Woodward, A.M., Goodacre, R., Rowland, J.J. & Kell, D.B. (1999) Noninvasive, On-Line Monitoring of the Biotransformation by Yeast of Glucose to Ethanol Using Dispersive Raman Spectroscopy and Chemometrics. Appl. Spectrosc., 53, pp. 1419�1427.
Sivakesava, S., Irudayaraj, J. & Ali, D. (2001a) Simultaneous determination of multiple components in lactic acid fermentation using FT-MIR, NIR, and FT-Raman spectroscopic techniques. Process Biochem., 37, pp. 371�378.
Sivakesava, S., Irudayaraj, J. & Demirci, A. (2001b) Monitoring a bioprocess for ethanol production using FT-MIR and FT-Raman spectroscopy. J. Indust. Microbiol. Biot., 26, pp. 185�190.

95
Skibsted, E., Lindemann, C. et al. (2001) On-line bioprocess monitoring with a multi-wavelength fluorescence sensor using multivariate calibration. Journal of Biotechnology, 88(1), pp. 47�57.
Soini, J., Falschlehner, C., Mayer, C., Bohm, D., Weinel, S., Panula, J., Vasala, A. & Neubauer, P. (2005) Transient increase of ATP as a response to temperature up-shift in Escherichia coli. Microb. Cell Fact., Vol. 4, No. 1, p. 9.
Sonnleitner, B. (2000) Instrumentation of Biotechnical Processes. In: Advances in Biochemical Engineering/Biotechnology. Berlin: Springer-Verlag. Pp. 1�64.
Söderlund, H., Kataja, K., Saloheimo, M., Ilmen, M. & Takkinen, K. (2003) Method and test kit for quantitative and/or cooperative assessment of variations in polynucleotide amounts in cell or tissue samples. Finland FI20010041 / Int. pat. appl. No. PCT/FI02/00023.
Tarkiainen, V., Kotiaho, T., Mattila, I., Virkajärvi, I., Aristidou, A. & Ketola, R. (2005) On-line monitoring of continuous beer fermentation process using automatic membrane inlet mass spectrometric system. Talanta, 65, pp. 1254�1263.
Tartakovsky, B., Sheintuch, M., Hilmer, J.M. & Scheper, T. (1996) Application of scanning fluorometry for monitoring of a fermentation process. Biotechnol. Prog., Vol. 12, No. 1, pp. 126�131.
Thuillard, M. (2004) Adaptive multiresolution search: how to beat brute force. International Journal of Approximate Reasoning, Vol. 35, Issue 3 March 2004, pp. 223�238.
Tran-Minh, C. (1996) Biosensors in flow-injection systems for biomedical analysis, process and environmental monitoring. J. Mol. Recognit., Vol. 9, No. 5�6, pp. 658�663.
Trentmann, O., Khatri, N.K. & Hoffmann, F. (2004) Reduced oxygen supply increases process stability and product yield with recombinant Pichia pastoris. Biotechnol. Prog., Vol. 20, No. 6, pp. 1766�1775.
Tsumoto, K., Shinoki, K., Kondo, H., Uchikawa, M., Juji, T. & Kumagai, I. (1998) Highly efficient recovery of functional single-chain Fv fragments from inclusion bodies overexpressed in Escherichia coli by controlled introduction of oxidizing reagent � application to a human single-chain Fv fragment. J. Immunol. Methods, Vol. 219, No. 1�2, pp. 119�129.
96
Tsumoto, K., Ejima, D., Kumagai, I. & Arakawa, T. (2003) Practical considerations in refolding proteins from inclusion bodies. Protein Expr. Purif., Vol. 28, No. 1, pp. 1�8.
Tunnemann, R., Mehlmann, M., Sussmuth, R.D., Buhler, B., Pelzer, S., Wohlleben, W., Fiedler, H.P., Wiesmuller, K.H., Gauglitz, G. & Jung, G. (2001) Optical biosensors. Monitoring studies of glycopeptide antibiotic fermentation using white light interference. Anal. Chem., Vol. 73, No. 17, pp. 4313�4318.
Ulber, R., Frerichs, J.-G. et al. (2003) Optical sensor systems for bioprocess monitoring. Analytical and Bioanalytical Chemistry, 376(3), pp. 342�348.
Vaidyanathan, S., Arnold, S.A. et al. (2001a) Assessment of near-infrared spectral information for rapid monitoring of bioprocess quality. Biotechnology and Bioengineering, 74(5), pp. 376�388.
Vaidyanathan, S., Harvey, L.M. et al. (2001b) Deconvolution of near-infrared spectral information for monitoring mycelial biomass and other key analytes in a submerged fungal bioprocess. Analytica Chimica Acta, 428(1), pp. 41�59.
Vaidyanathan, S., Harvey, L.M. et al. (2001c) Assessment of the structure and predictive ability of models developed for monitoring key analytes in a submerged fungal bioprocess using near-infrared spectroscopy. Applied Spectroscopy, 55(4), pp. 444�453.
Vaidyanathan, S., White, S. et al. (2003) Influence of morphology on the near-infrared spectra of mycelial biomass and its implications in bioprocess monitoring. Biotechnology and Bioengineering, 82(6), pp. 715�724.
Vasala, A., Panula, J., Bollok, M., Illman, L., Hälsig, C., Neubauer, P. (2006) A new wireless system for decentralised measurement of physiological parameters from shake flasks. Microbial Cell Factories 5:8.
Vincentelli, R., Canaan, S., Campanacci, V., Valencia, C., Maurin, D., Frassinetti, F., Scappucini-Calvo, L., Bourne, Y., Cambillau, C. & Bignon, C. (2004) High-throughput automated refolding screening of inclusion bodies. Protein Sci., Vol. 13, No. 10, pp. 2782�2792.
Voigt, B., Schweder, T., Becher, D., Ehrenreich, A., Gottschalk, G., Feesche, J., Maurer, K. H. & Hecker, M. (2004) A proteomic view of cell physiology of Bacillus licheniformis. Proteomics, Vol. 4, No. 5, pp. 1465�1490.

97
Vojinović, V., Calado, C.R., Silva, A.I., Mateus, M., Cabral, J.M.S. & Fonseca, L.P. (2005) Micro-analytical GO/HRP bioreactor for glucose determination and bioprocess monitoring. Biosensors and Bioelectronics, 20, pp. 1955�1961.
Walsh, G. (2003) Pharmaceutical biotechnology products approved within the European Union. European Journal of Pharmaceutics and Biopharmaceutics, pp. 3�10.
Wang L., Ridgway, D., Gu, T. & Moo-Young, M. (2003) Effects of process parameters on heterologous protein production in Aspergilus niger fermentation. Journal of Chemical Technology and Biotechnology, 78(12), pp. 1259�1266.
Warner, T.M. & Nochumson, S. (2002) Innovations of Membrane Chromatography. Pharmaceutical Technology, September 2002.
Winchester, K. (2005) Process analytical technology: a framework for innovation, Bioprocessing Journal, May/June (2005), pp. 21�23
Winter, J., Lilie, H. & Rudolph, R. (2002) Renaturation of human proinsulin � a study on refolding and conversion to insulin. Anal. Biochem., Vol. 310, No. 2, pp. 148�155.
Woodward, A.M. & Kell, D.B. (1991) On the relationship between the nonlinear dielectric properties and respiratory activity of the obligately aerobic bacterium Micrococcus luteus. Bioelectrochemistry and Bioenergetics, 26(3), pp. 423�439.
Wu, C.-H., Scampavia, L., Ruzicka, J. & Zamost, B. (2001) Micro sequential injection: Fermentation monitoring of ammonia, glycerol, glucose, and free iron using the novel lab-on-valve system. Analyst, 126(3), pp. 291�297.
Wu, C.-H., Scampavia, L. & Ruzicka, J. (2003) Micro sequential injection: automated insulin derivatization and separation using a lab-on-valve capillary electrophoresis system. Analyst, 128(9), pp. 1123�1130.
Xu, B., Jahic, M., Blomsten, G. & Enfors, S.O. (1999) Glucose overflow metabolism and mixed-acid fermentation in aerobic large-scale fed-batch processes with Escherichia coli. Appl. Microbiol. Biotechnol., 51 (5), pp. 564�571.
Zhang, W., Hywood Potter, K.J., Plantz, B.A., Schlegel, V.L., Smith, L.A. & Meagher, M.M. (2003) Pichia pastoris fermentation with mixed-feeds of glycerol and methanol: growth kinetics and production improvement. J. Ind. Microbiol. Biotechnol., Vol. 30, No. 4, pp. 210�215.

98
Zhang, W., Liu, C.P., Inan, M. & Meagher, M.M. (2004) Optimization of cell density and dilution rate in Pichia pastoris continuous fermentations for production of recombinant proteins. J. Ind. Microbiol. Biotechnol., Vol. 31, No. 7, pp. 330�334.
Zeiser, A., Bédard, C. et al. (1999) On-line monitoring of the progress of infection in Sf-9 insect cell cultures using relative permittivity measurements. Biotechnology and Bioengineering, 63(1), pp. 122�126.

99
Useful reading A. Useful Standards
1. ASTM Standards
E2363-04: Standard Terminology related to PAT
D 3764 � 01: Standard Practice for Validation of Process Stream Analyzer Systems.
D 4855 � 97: Standard Practice for Comparing Test Methods.
D 6299 � 02: Standard Practice for Applying Statistical Quality Assurance Techniques to Evaluate Analytical Measurement System Performance.
E 456-02: Standard Terminology Relating to Quality and Statistics
E1325-02: Standard Terminology Relating to Design of Experiments.
2. Parenteral Drug Association
PDA. May/June 2000. Technical Report No. 33: Evaluation, Validation and Implementation of New Microbiological Testing Methods. PDA Journal of Pharmaceutical Science and Technology 54(3) Supplement TR33
3. EMEA
Guidance on Development of Pharmaceutics (CPMP/QWP/054/98)
Note for Guidance on Parametric Release (CPMP/QWP/3015/99)
4. European Commission
Annex 17 to the EU GMP Guide.
4. ICH
ICH Guideline on Pharmaceutical Development (ICH Q8)

ISBN 951�38�6612�2 (URL: http://www.vtt.fi/publications/index.jsp) ISSN 1459�7683 (URL: http://www.vtt.fi/publications/index.jsp)