Proceedings - Rochester Institute of...
15
Multi-Disciplinary Senior Design Conference Kate Gleason College of Engineering Rochester Institute of Technology Rochester, New York 14623 Project Number: P10010 MOTION TRACKING TECHNOLOGY EVALUATION Assis Ngolo / CE Brian Glod / CE Jahanavi Gauthaman / EE Cory Laudenslager / EE James Stern / ME David Monahan / ME ABSTRACT The Nazareth College Physical Therapy Clinic has expressed the need for a portable motion tracking system capable of measuring patients' range of motion in their natural environments. The objective of this project is to research the sensor aspects of a motion tracking system comprising of multiple sensors, a portable microcontroller (MCU), and some form of software interface. The final goal of this project is to create a portfolio of multiple sensor options for future RIT senior design teams working with Nazareth. Figure 1: P10010 System Overview A low power MCU which provided a wide array of input and output ports was selected. The diverse capabilities of the MCU enabled tests to be completed on a variety of applications with one functional unit. Data capture and storage were also performed, utilizing a microSD card, with easy removal for quick computer access. Completion of careful testing and analysis yielded conclusive results. Two sensors were found to be ideal for measuring linear movements in the x-y-z-axis. The flex sensor provides for a high degree of accuracy, ease of use, and most importantly minimal invasiveness. Additionally, position was proven to be found within a small tolerance for the DE-ACCM2G2 sensor, making it ideal for linear movements. If one desires to measure position as well as rotation, the Ultra-Thin IMU has all the requisite bells and whistles. Accuracy of angles was found to be well within customer specifications, and allows for a wide range of body motion to be analyzed for future groups BACKGROUND RIT’s Biomedical Systems & Technologies track has long enjoyed a mutually beneficial relationship with the Nazareth College Physical Copyright © 2010 Rochester Institute of Technology
Transcript of Proceedings - Rochester Institute of...

Multi-Disciplinary Senior Design ConferenceKate Gleason College of Engineering
Rochester Institute of TechnologyRochester, New York 14623
Project Number: P10010
MOTION TRACKING TECHNOLOGY EVALUATION
Assis Ngolo / CE Brian Glod / CEJahanavi Gauthaman / EE Cory Laudenslager / EE
James Stern / ME David Monahan / ME
ABSTRACT The Nazareth College Physical Therapy Clinic has expressed the need for a portable motion tracking system capable of measuring patients' range of motion in their natural environments. The objective of this project is to research the sensor aspects of a motion tracking system comprising of multiple sensors, a portable microcontroller (MCU), and some form of software interface. The final goal of this project is to create a portfolio of multiple sensor options for future RIT senior design teams working with Nazareth.
Figure 1: P10010 System Overview
A low power MCU which provided a wide array of input and output ports was selected. The diverse capabilities of the MCU enabled tests to be completed on a variety of applications with one functional unit. Data capture and storage were also performed, utilizing a microSD card, with easy removal for quick computer access. Completion of careful testing and analysis yielded conclusive results. Two sensors were found to be ideal for measuring linear movements in the x-y-z-axis. The flex sensor provides for a high degree of accuracy, ease of use, and most importantly minimal invasiveness. Additionally, position was proven to be found within a small tolerance for the DE-ACCM2G2 sensor, making it ideal for linear movements. If one desires to measure position as well as rotation, the Ultra-Thin IMU has all the requisite bells and whistles. Accuracy of angles was found to be well within customer specifications, and allows for a wide range of body motion to be analyzed for future groups
BACKGROUNDRIT’s Biomedical Systems & Technologies track has long enjoyed a mutually beneficial relationship with the Nazareth College Physical Therapy Clinic. To date, over ten Multidisciplinary Senior Design (MSD) teams have worked closely with two Physical Therapy PT professors/clinic practitioners at Nazareth: Dr. J.J Mowder-Tinney and Dr. Sara Gombatto. Dr. Mowder-Tinney supervises a muscle rehabilitation clinic, and provides rehabilitative services to patients with severe loss of muscular control, such as stroke victims or patients affected by multiple sclerosis. Dr. Gombatto, on the other hand, directs a musculoskeletal research lab, with a primary focus on investigating lower back pain. Both have expressed the need for a portable motion tracker which would allow them to observe patients’ daily motions in their native environment.
In 2007, P08006: Motion Tracking System [1] designed a single-leg, portable gait motion tracker for Dr. Mowder-Tinney. Ultimately, the P08006 motion tracker did not satisfy Nazareth’s needs, and brought to attention several significant design challenges for portable motion tracking systems. Firstly, the gyroscope utilized by P08006 could not provide the needed accuracy, especially when exposed to repetitive cycles of motion. Secondly, the project required significant expertise in the fields of data communication and interpretation. Thirdly, the majority of P08006’s efforts were focused on the motion tracking aspects of their system; P08006 did not have enough resources or time to give necessary consideration to the human interfaces of their system. Lastly, the 22-week MSD cycle proved to be too short for a project of P08006’s scope- building a portable motion tracker from scratch requires a much longer developmental cycle.
After some consideration, it was decided that the second iteration of P08006’s portable motion tracking efforts would focus on establishing a solid technical foundation for future MSD teams. Two new sister teams were initiated during fall of 2009: P10011
Copyright © 2010 Rochester Institute of Technology

Proceedings of the Multi-Disciplinary Senior Design Conference Page 2
and P10010: P10011, titled Motion Tracking Human Interface, [2] will establish suitable interfaces between humans and the motion tracking components evaluated by P10010. Interfaces developed by P10011 will include both protective enclosures for sensors and MCUs, and methods of comfortably affixing said enclosures to a patient without compromising the data collected by P10010’s sensors.
The focus of this technical document is P10010, titled Motion Tracking Technology Evaluation [3]. Members of P10010 will evaluate the technical feasibility of system components, such as sensors and microcontrollers (MCUs), both while isolated and in a simulated motion tracking system. The two primary ranges of motion of interest in this study will be human’s lower back and limbs, where a limb is defined as a three-bar linkage, such as the upper arm, lower arm, and hand. The ultimate goal for P10010 is to amass significant information on ideal system components, with the intention of facilitating the implementation of an actual system by future MSD teams.
OVERVIEWNeeds/Objectives Development:
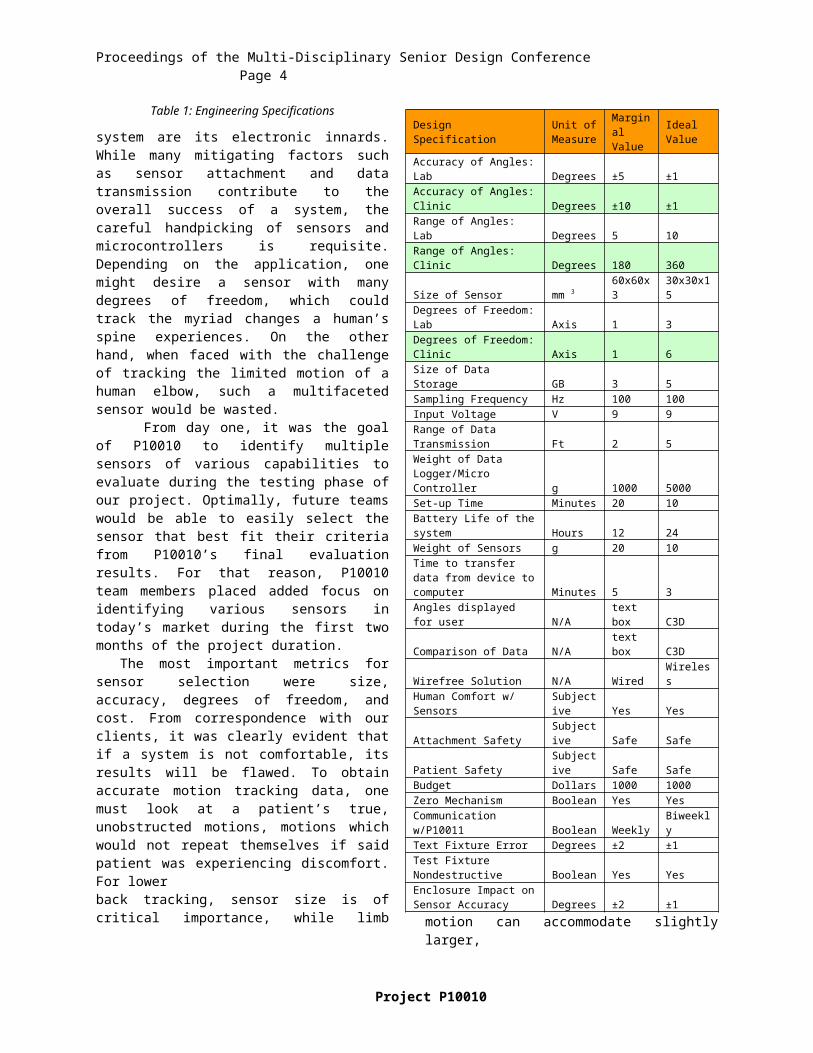
Specific metrics for desired sensor and MCU performance were yielded from meetings with the customer. An analysis of the systems available on the market was then performed in order to deduce the capability of sensors within our budget range. From identified customer needs and market criteria, the engineering specifications displayed in Table 1 were derived. The purpose of these specifications are both to ensure all of our customer needs are met, and to give us a means of qualitatively determining which sensors best meet our customer’s needs.
There is a significant difference in the level of accuracy required by Dr. Gombatto and Dr. Mowder- Tinney. This deviation in needed accuracy is due to both physiological and clinical reasons. The three-bar linkages (human arm and leg) measured by Dr. Mowder Tinney both display very large ranges of motion- as high as 360 degrees of freedom for a human arm. On the other hand, Dr. Gombatto’s research pertains to the lumbar region of a human’s body, which typically rotates less than 10 degrees [4]. In addition, while the rehabilitation clinic does not require high accuracy, the research laboratory is interested in highly scientific measurements, and publishes papers dependent on statistical quantities. Hence, a sensor with an accuracy of +5 degrees would be satisfactory for Dr. Mowder-Tinney’s application, but would be borderline acceptable for Dr. Gombatto’s purposes. Therefore, for the specifications in which our two customers’ needs differed, we developed two discrete values. Specifications highlighted in green represent the needs of limb tracking, while their white contemporaries are spinal equivalents. Sensor Selection:
The most critical components of a motion tracking
Table 1: Engineering Specifications
system are its electronic innards. While many mitigating factors such as sensor attachment and data transmission contribute to the overall success of a system, the careful handpicking of sensors and microcontrollers is requisite. Depending on the application, one might desire a sensor with many degrees of freedom, which could track the myriad changes a human’s spine experiences. On the other hand, when faced with the challenge of tracking the limited motion of a human elbow, such a multifaceted sensor would be wasted.
From day one, it was the goal of P10010 to identify multiple sensors of various capabilities to evaluate during the testing phase of our project. Optimally, future teams would be able to easily select the sensor that best fit their criteria from P10010’s final evaluation results. For that reason, P10010 team members placed added focus on identifying various sensors in today’s market during the first two months of the project duration.
The most important metrics for sensor selection were size, accuracy, degrees of freedom, and cost. From correspondence with our clients, it was clearly evident that if a system is not comfortable, its results will be flawed. To obtain accurate motion tracking data, one must look at a patient’s true, unobstructed motions, motions which would not repeat themselves if said patient was experiencing discomfort. For lower back tracking, sensor size is of critical importance, while limb motion can accommodate slightly larger,
Project P10010
Design Specification Unit of Measure
Marginal Value
Ideal Value
Accuracy of Angles: Lab Degrees ±5 ±1Accuracy of Angles: Clinic Degrees ±10 ±1Range of Angles: Lab Degrees 5 10Range of Angles: Clinic Degrees 180 360Size of Sensor mm 3 60x60x3 30x30x15Degrees of Freedom: Lab Axis 1 3Degrees of Freedom: Clinic Axis 1 6Size of Data Storage GB 3 5Sampling Frequency Hz 100 100Input Voltage V 9 9Range of Data Transmission Ft 2 5Weight of Data Logger/Micro Controller g 1000 5000Set-up Time Minutes 20 10Battery Life of the system Hours 12 24Weight of Sensors g 20 10Time to transfer data from device to computer Minutes 5 3Angles displayed for user N/A text box C3D Comparison of Data N/A text box C3D Wirefree Solution N/A Wired WirelessHuman Comfort w/ Sensors Subjective Yes YesAttachment Safety Subjective Safe SafePatient Safety Subjective Safe SafeBudget Dollars 1000 1000Zero Mechanism Boolean Yes YesCommunication w/P10011 Boolean Weekly BiweeklyText Fixture Error Degrees ±2 ±1Test Fixture Nondestructive Boolean Yes YesEnclosure Impact on Sensor Accuracy Degrees ±2 ±1

Proceedings of the Multi-Disciplinary Senior Design Conference Page 3
A sensor’s level of accuracy and degrees of freedom are intrinsically tied to its cost. The more one is willing to pay, the better performance one will receive. In P10010’s case, the budget allowance and practicality did not permit for sensors greater than $125 in value. After two months of investigating commercially available sensors and comparing advertised metrics via concept selection matrices, P10010 selected four characteristically different sensors for evaluation. Table 2 displays the concept selection matrix utilized to select our sensors. MCU Selection: The other key component of a portable motion tracking system is a microcontroller. Whereas some portable systems may operate wirelessly, in P10010’s case budgetary and technical constraints eliminate the possibility of a wireless solution. Therefore, in this system, the utilized microcontroller must be highly multifunctional, performing many different tasks in comparison to the relative simplicity of a sensor’s functionality.
Following market research P10010 identified six different potential microcontrollers suitable for portable motion tracking applications. A concept selection matrix was once again utilized to identify the MCU which best adhered to P10010’s needs. Metrics used to distinguish between MCUs included: physical dimensions, current draw, power consumption, input/output ports, ADC inputs/bits, supported communication protocols, memory storage/add on capabilities, battery compatibility, and cost.
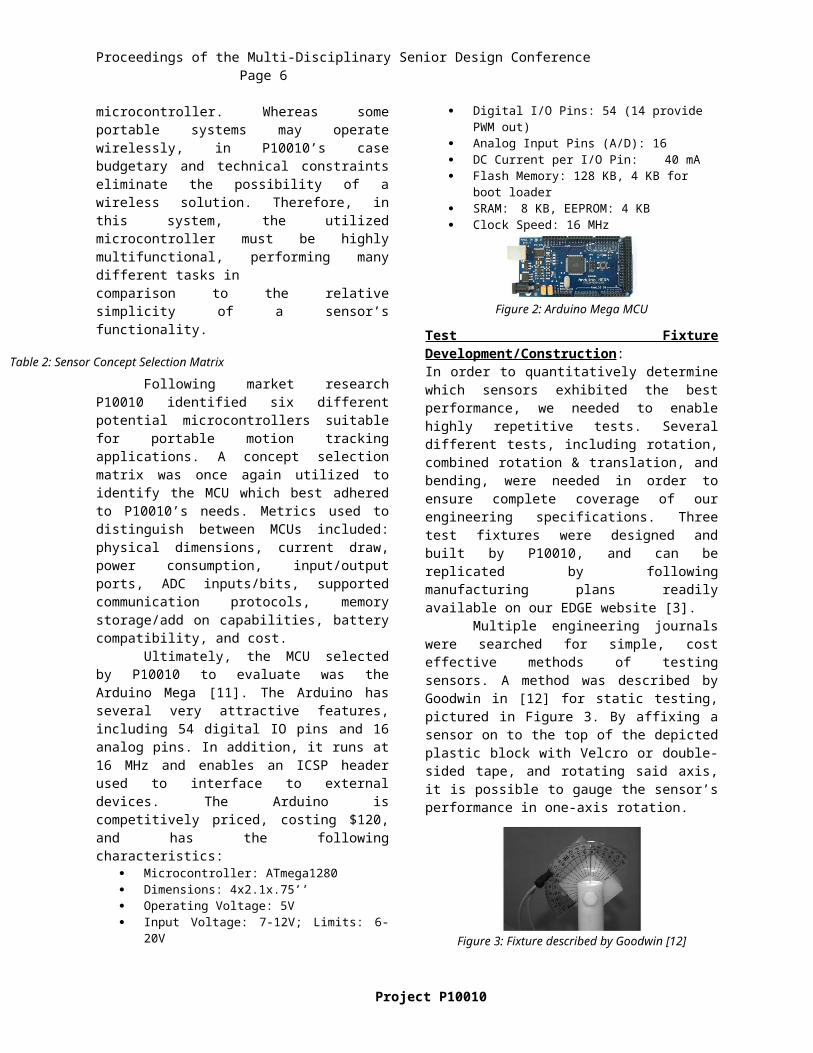
Ultimately, the MCU selected by P10010 to evaluate was the Arduino Mega [11]. The Arduino has several very attractive features, including 54 digital IO pins and 16 analog pins. In addition, it runs at 16 MHz and enables an ICSP header used to interface to external devices. The Arduino is competitively priced, costing $120, and has the following characteristics:
Microcontroller: ATmega1280 Dimensions: 4x2.1x.75’’ Operating Voltage: 5V Input Voltage: 7-12V; Limits: 6-20V
Copyright © 2010 Rochester Institute of Technology
Design Specification Units Ideal
Value Flex Sensor Rank (1-10)
DE-ACCM3D2 Accelerometer
Rank (1-10)
Atomic IMU - 6DoF
Rank (1-10)
Razor IMU - 6DoF Rank (1-10)
Accuracy Degrees ±1 ± 10% 7 ± 10% 7 ± 10% 7 ± 10% 7
Range Degrees 180 90 6 180 8 180 10 180 10
Size of Sensormm x mm x mm 30x30x15 4.5x3x5 9 21 x 10x 8 10 47 x 37 x 25 4 17.5 x 15 x1 10
Degrees of Freedom Axis 3 1 5 3 9 6 10 6 10
Input Voltage V 9 5V 103.5 to 15V or 2.4 to 3.6 10 3.4-10 10 2.7-3.6 10
Output Voltage V 3-5 2.8-4 10 1.5-2.4 10 3.3 10 3.3 10
Set-up Time Minutes 10 5 10 15 8 15 8 15 8
Weight of Sensors g 10 5g 10 1.3 10 15 6 4 10
Comfort of Sensors on Person Subjective High High 8 High 10 Low 6 High 10
Patient Safety SubjectivePatient is Safe Safe 8 Safe 10 Safe 10 Safe 10
Cost Dollars 10 10 Medium ($35) 8 125 5 89.95 6
RANK (10 = High, 1 = Low) 93 100 86 101
Table 2: Sensor Concept Selection Matrix
Proceedings of the Multi-Disciplinary Senior Design Conference Page 4
Digital I/O Pins: 54 (14 provide PWM out) Analog Input Pins (A/D): 16 DC Current per I/O Pin: 40 mA Flash Memory: 128 KB, 4 KB for boot loader SRAM: 8 KB, EEPROM: 4 KB Clock Speed: 16 MHz
Figure 2: Arduino Mega MCU
Test Fixture Development/Construction:In order to quantitatively determine which sensors exhibited the best performance, we needed to enable highly repetitive tests. Several different tests, including rotation, combined rotation & translation, and bending, were needed in order to ensure complete coverage of our engineering specifications. Three test fixtures were designed and built by P10010, and can be replicated by following manufacturing plans readily available on our EDGE website [3].
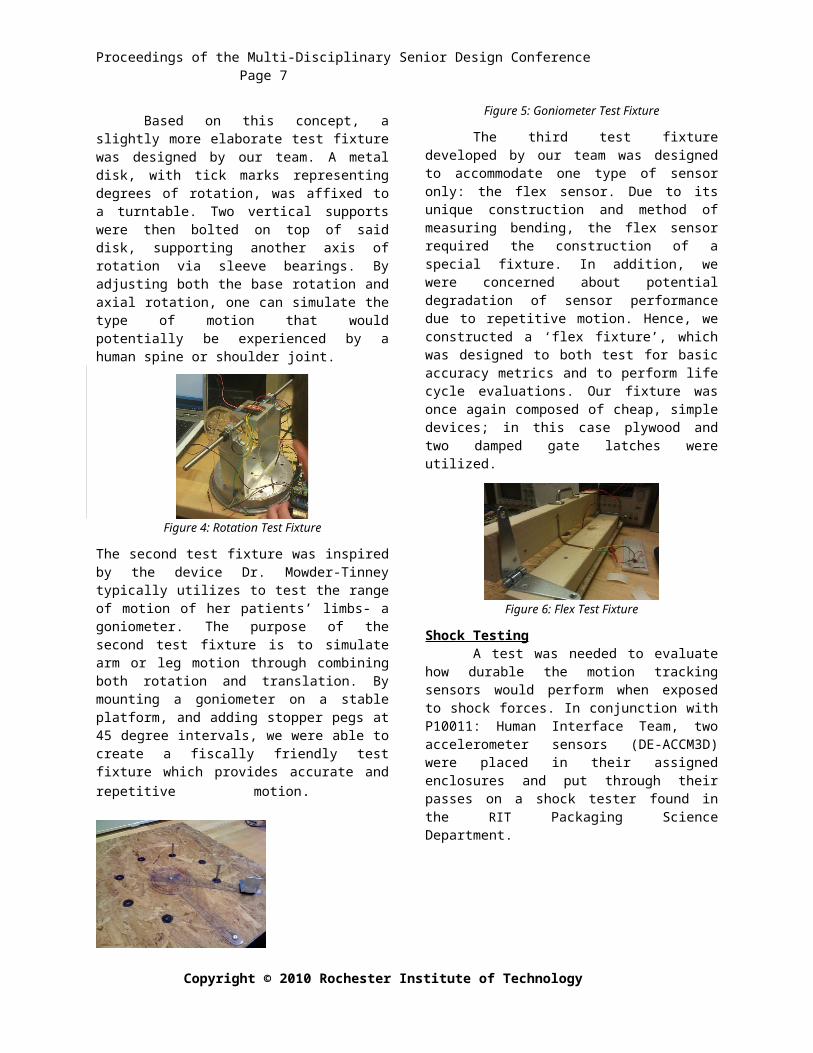
Multiple engineering journals were searched for simple, cost effective methods of testing sensors. A method was described by Goodwin in [12] for static testing, pictured in Figure 3. By affixing a sensor on to the top of the depicted plastic block with Velcro or double-sided tape, and rotating said axis, it is possible to gauge the sensor’s performance in one-axis rotation.
Figure 3: Fixture described by Goodwin [12]
Based on this concept, a slightly more elaborate test fixture was designed by our team. A metal disk, with tick marks representing degrees of rotation, was affixed to a turntable. Two vertical supports were then bolted on top of said disk, supporting another axis of rotation via sleeve bearings. By adjusting both the base rotation and axial rotation, one can simulate the type of motion that would potentially be experienced by a human spine or shoulder joint.
Figure 4: Rotation Test Fixture
The second test fixture was inspired by the device Dr. Mowder-Tinney typically utilizes to test the range of motion of her patients’ limbs- a goniometer. The purpose of the second test fixture is to simulate arm or leg motion through combining both rotation and translation. By mounting a goniometer on a stable platform, and adding stopper pegs at 45 degree intervals, we were able to create a fiscally friendly test fixture which provides accurate and repetitive motion.
Figure 5: Goniometer Test Fixture
The third test fixture developed by our team was designed to accommodate one type of sensor only: the flex sensor. Due to its unique construction and method of measuring bending, the flex sensor required the construction of a special fixture. In addition, we were concerned about potential degradation of sensor performance due to repetitive motion. Hence, we constructed a ‘flex fixture’, which was designed to both test for basic accuracy metrics and to perform life cycle evaluations. Our fixture was once again composed of cheap, simple devices; in this case plywood and two damped gate latches were utilized.
Figure 6: Flex Test Fixture
Shock TestingA test was needed to evaluate how durable
the motion tracking sensors would perform when exposed to shock forces. In conjunction with P10011: Human Interface Team, two accelerometer sensors (DE-ACCM3D) were placed in their assigned enclosures and put through their passes on a shock tester found in the RIT Packaging Science Department.
Project P10010

Proceedings of the Multi-Disciplinary Senior Design Conference Page 5
Figure 7: Shock Test Fixture
The shock tester works by raising a table up to a given height and then releasing it, allowing the table to free fall and come to a complete stop when it hits the base. A G-Sensor is attached to the table itself, and another is attached to the sensor enclosure, which records how many G’s are felt when the table hits the base after its free fall. The first test raised the table to a height of 2.5inches; after the drop the results showed a max acceleration of 114 G’s on the enclosure and sensor. The voltages from the X, Y, and Z outputs were then tested to see if they read the same as before the test was performed. This test was repeated, continually increasing the height of the table and again checking to see if the sensors output voltages changed in any way. The test fixture was maxed out at a height of 30inches, and an acceleration reading of over 500G’s was yielded (maximum value of the G-Sensor) with no damage done to motion sensor. Figure 8 shows the final, maximum values of shock:
Figure 8: Shock Test Results Figure 9: Pendulum
Pendulum TestingAll of the custom test fixtures designed by P10010 depend on human input for sensor movement, making integration of acceleration with time difficult. To alleviate this problem, P10010 acquired a preexisting pendulum from the MSD Assistive Devices family, pictured in Figure 9. A system model was developed for the pendulum, and incorporated in a Matlab M-File. By plotting the system model alongside our acquired data, we were able to compare our sensors’ metrics to known values.Test Plan: A test plan was authored to ensure that both all engineering specifications are addressed via some form of concrete measurement, and to provide metrics for validation of sensor performance. The final test plan is readily available on P10010’s EDGE website [3]. Included in the test plan are specific tests for sensors, microcontrollers, test fixtures, and software subsystems, as well as available equipment and phases of testing.
RESULTS AND DISCUSSION Dimension Engineering’s DE-ACCM2G2 ±2g 3-
axis accelerometer was the first sensor tested. With
acceleration being measured in only x, y, and z, this sensor would make an ideal candidate to determine position in linear motion. The first task was to power the sensor and measure the output corresponding to 1g (gravity) of force on the accelerometer. This value will be used as a base line and is a critical step to ensure accurate results for all other readings. The sensor outputs 660mV/g, so converting the output voltage into can be easily accomplished. By using the pendulum test fixture to swing the device ±15°, one can model the pendulum with the given parameters and create an ideal MATLAB simulation. This ideal MATLAB simulation will be compared to the actual values captured. By plotting acceleration, one can utilize the trapezoid rule with a best fit line to integrate twice. With larger ranges of data a best fit line will not be possible, in which case using point to point integration/summation is the optimal path.
Figure 10:DE-ACCM2G2 Acceleration in X Plot Vs. Time, Red=Ideal, Blue=Actual
Figure 11:DE-ACCM2G2 Velocity in X Plot Vs. Time, Red=Ideal, Blue=Actual
Figure 12:DE-ACCM2G2 Position in X Plot Vs. Time , Red=Ideal, Blue=Actual
The resulting plots of acceleration, velocity, and position in the x component can be seen in Figures 10-12. In looking at position, the distance the pendulum traveled in the X component was measured to be
Copyright © 2010 Rochester Institute of Technology
Proceedings of the Multi-Disciplinary Senior Design Conference Page 6
around 22 cm. In looking at Figure 12, the hardware value distance was around 20 cm which is well within tolerance limits. The same plots were compared in the y direction, and similar results were found. With the proof of concept confirmed, one can now start to determine ranges of motion in which the DE-ACCM2G2 would be appropriate.
Some examples would be range/distance of the arm in the x-direction to determine shoulder extension. Another example would be to place the sensor anywhere vertical on the leg to determine range of motion in z-direction. It is important to note that original placement and distance of sensor is a key element to later determining final position. Another future concept that could be used in conjunction with the DE-ACCM2G2 is full 3 axis gyroscopes to incorporate rotation. With the accuracy of the accelerometers, potential for rotation, and the lightweight/smallness of the sensor, the possibilities are endless for the DE-ACCM2G2. Please see DE-ACCM2G2.docx for complete documentation and testing analysis [3].
The next sensor evaluated was Sparkfun.com’s 6DOF Ultra-Thin IMU. At only 1 mm thick, this sensor provides ultimate convert and streamlined placement against the body. Like the DE-ACCM2G2, the Ultra-thin has 3-axis of acceleration, as well as three individual gyroscopes to measure rotation. Rotation or angular acceleration is given by the sensor’s output of 3.33mV/1°/Second. To measure rotation one can use the rotation test fixture described above. To test rotation as well as drift, which will be discussed later, we decided to test both 90° as well 180° over fast and slow speed. In looking at Figure 13, one can see how the output voltages of the gyroscope rotated about the y-axis. Using the trapezoid rule again, this time in excel, one can calculate angle changed over time. In looking at Figure 13, one can see that the accuracy of angles is far superior in fast rotations rather then slow rotations. The cause of this is contributed to drift.
Drift is a phenomenon that occurs in gyroscopes and has to do with the gyroscope “losing” its original starting position which will then skew the degree change from the original axis. To correct for this, future groups may want to look into something called Kalman filtering. Kalman filtering is a mathematical method that accounts for the varaiations of degrees over time and corrects for this factor. In looking at the fast rotations, it is well within the customer specifications and meets proof of concept.
Next the pendulum was incorporated to test for acceleration. Although clear data was collected from the sensor, MATLAB processing of the data continues, and we hope to achieve the same results as the DE-ACCM2G2 in the following days. Assuming the data is able to accurately determine position, it can do all the things the DE-ACCM2G2 can do and then some. With the gyroscopes/rotation, one can now
strap the sensor onto the wrist and determine displacement, as well as rotation of the wrist which may be critical for some physial therapy patients. The sensor could be strapped to the top of someone’s head to determine neck rotation in spinal patients as well. The possibilities for this sensor are endless, and with its slender design makes it an optimal choice for future implementation. Please see Ultra-Thin.docx for complete documentation and testing analysis [3].
Figure 13: Ultra-Thin Y-Rotation V as a Function of Time
The flex sensor was the third sensor evaluated for motion tracking practicability. The flex sensor was tested on the flex fixture, by bending the fixture and measuring output at every ten degrees. Figure 14 shows the consistent behavior of two flex sensors, with two sets of data for each sensor. The X-Axis represents voltage output, while the Y-Axis measures degrees of bending. The equations are third degree fitted polynomial equations that can be used for any future testing related to the specific sensor tested.
The test fixture was then used to test the efficiency and functionality of the flex sensor both when bent in its middle, or at its end. Maximum error between end and middle measurements were 14%; or 0.14o. The error increases as the sensor moves from a flat orientation to a completely bent position. Overall, the error is very small at the different positions on the flex sensor. It is concluded that the flex sensor is an ideal technology for a one-degree of motion joint, but one that does not need to be extremely accurate. For example, the flex sensor is ideal for measuring the count of repeated movements of a joint. Please see Flex.docx for complete documentation and testing analysis [3].
Figure 14: Flex Sensor Bending Test
The fourth, and final sensor evaluated was the Atomic IMU, which was tested on three different fixtures. The data obtained was in ASCII format, and
Project P10010
Proceedings of the Multi-Disciplinary Senior Design Conference Page 7
was not directly useful to check for accuracy. The raw data from the gyros and accelerometers goes through a processor of its own on the IMU. Due to the underlying processing that takes place to convert the raw data to the ASCII/ binary output, conversion of the output data to corresponding angles is not trivial. For the pendulum data, a sample of the X-Axis acceleration data plotted against the designed MATLAB pendulum model is shown in Figure 15. Further analysis, similar to that needed of the Ultra-Thin sensor, will be performed to validate the accuracy of the Atomic IMU. Please see Atomic.docx for complete documentation and testing analysis [3].
Figure 15: ATOMIC IMU Curve Fit ExampleMCU: The Arduino Mega’s ADC conversion was very satisfactory, for the MCU divides its 16 A/D channels in two groups of 8 channels. Both groups can be read concurrently, doubling the speed at which data can be read, since two channels can be read per iteration. The channels are also reasonably precise, and although depending on the sensor sensitivity, more than19 bit precision might be needed; the data obtained from the sensor used in this project are very accurate.
One of the factors affecting the Arduino’s ADC performance and speed is the tradeoff between sampling frequency and sampling time. If all 16 channels are being utilized at once and data logging is sluggish, it is possible to reduce the sampling time. This reduction in sampling time increases sampling rate and speed, but reduces precision, as the signal will not be as smooth as when the channel has time to average through a good time interval. Conversely, the best signal is obtained with the longest sample time, and slower sample frequency. That being said, in a worst case scenario of very unstable signals, a high sample time should be used so that the Arduino’s sampling will be at 240 Hz for all 16 channels, or 480 Hz for 8 channels, resulting in channel multiplexing.
Local storage was an optimal solution to achieve portability of design, and the technology of choice was micro SD. We used a micro SD shield developed by Libelium[13], which interfaces with the MCU directly through the ICSP header, using the I2C interface. Several libraries exist to support SD storage, some of which are: microfat, SD_FAT16lib, SdFat, SD_FAT32lib, and SD_GCC_V2.2_M32. Upon evaluation of the libraries, most of which are
advertised to be load and play, serious issues were encountered. Poor documentation and library incapability of initializing the SD card were problems. In addition, some of the libraries required that a previously, manually created file be already on the card, with a specified size and ending characters. It was evident that this setup would not work well when trying to log data into a CSV file, since it would have a different format and irregularly variable sizes.
The library that performed best was sdFat, which needed a few tweaks in its main source Sd2Card.cpp and Sd2Card.h. Afterwards, the card initialization was successful and the MCU could then be programmed to obtain process and store data on the micro SD card very easily. The logging is very robust, as the card does not need any special treatment. As a matter of fact, upon removal of the SD card, the MCU will prepare for a new data set. Once the SD card is reinstalled, logging is resumed instantly, and stored in a new data file- making it easy to differentiate between consecutive logging sessions. The only requirement for this process to work is that the card needs to be formatted to FAT (FAT16), before use. The code used for the SD card is displayed on EDGE [3], and logging operations, including card initialization, file creation, and CSV format setup are located on lines 33 to 135 of the SdFatAnalogLogger.pde file. The resulting files are readable directly from any program able to access comma separated values (CSV) files, including Microsoft EXCEL, Matlab and a multitude of programming languages.
The values stored are the decimal values corresponding to the signal magnitudes within the 10 bit (0 - 1023) range, so in order to use this data for analysis, it needed to be converted back into voltages, and a C++ program was written to do just that. The code is contained in the file decimal_to_voltage.cpp. After the conversion is complete, the data was imported into Matlab, where we performed all of our data analysis operations such as model analysis and curve fitting to test data accuracy. We also performed running integrations using the trapezoidal rule (using the built in function cumtrapz) to obtain velocity and displacement. For curve fitting, we used both Matlab’s built in curve fitting feature, and a free toolbox called ezyfit developed by Frédéric Moisy [14].
CONCLUSIONS AND RECOMMENDATIONS All in all, a solid foundation of knowledge was established for future MSD teams aiming to track human motion. P10010’s EDGE website [3] hosts myriad documents from every phase of this project, spanning from research to concept development to evaluation. Sensor & MCU research documents, selection matrices, assembly instructions, and evaluation results are all available on EDGE [3]. In addition, Test Fixture research and manufacturing plans are also documented for future teams.
Copyright © 2010 Rochester Institute of Technology

Proceedings of the Multi-Disciplinary Senior Design Conference Page 8
Substantial infrastructure has also been established during the duration of P10010’s project. Four fully assembled, functional test fixtures are available for future teams, as well as multiple prepared sensors and two Arduino MCU’s. An extensive library of code is additionally available on EDGE, comprising of code for general MCU operation, data storage & translation, and MATLAB testing/analysis. Ideally, future teams will be able to replicate P10010’s steps without any hitches, using both documentation and existing infrastructure. The following are several recommendations from P10010 team members for future MSD teams attempting similar tasks. The recommendations are broken up in several relevant groups: Text Fixtures: A text fixture with adjustable velocity would be extremely beneficial for future teams. By integrating a motor, servo, or equivalent input into a fixture, and possibly a software interface such as LabView, future teams would be able to seamlessly compare sensor readings to actual system metrics. Data Analysis: Although using a best fit curve for the sensor output provided an approximation of the area under the curve, it was not very accurate or representative of what actual prolonged daily movements will look like. Future data analysis should explore a more efficient and accurate point to point method of integration. By having on board MCU integration, or PC software, a new method of data display can be characterized and implemented.Sensors: As has been mentioned, it is recommended that Kalman Filters be employed to reduce gyroscope drift. In addition, consideration should be placed on deriving an efficient method to route wires for a complete motion tracking system. MCU: A great improvement in performance would be recognized if interrupts were implemented, so that the MCU would not have to poll every channel each time. Cycles would be saved for data processing operations like direct conversion to voltages, and running integrations, from acceleration to displacement. It would be ideal to have full position and angular data analysis processed by the MCU, however, full analysis is a bit unrealistic due to the needed extensive modeling. Additionally, it is useful to have a dedicated data logging MCU, providing more analog channels and higher precision. In addition, as 0 to 10 LSBs (0 to 50 mV) are lost during ADC conversion, processing to implement calibration curves to ADC values would be greatly beneficial.
REFERENCES [1] Mora, Josemaria , Wade Daugherty, Brian Leigh, Jennifer Mallory, and Eric Danielson. "Motion Tracking System." Edge. Rochester Institute of Technology, n.d. Web. 12 Dec. 2009. <edge.rit.edu/content/P08006/public/Home>.[2] Shields, Dan, Joe Piehler, and Alex Frechette. "Motion Tracking Human Interface." Edge. Rochester Institute of Technology, n.d. Web. 29 Nov. 2009. <https://edge.rit.edu/content/P10011/public/Home>.
[3] Monahan, David , James Stern, Assis Ngolo, Brian Glod, Cory Laudenslager, and Jahanavi Gauthaman. "Motion Tracking Technology Evaluation." Edge. Rochester Institute of Technology, n.d. Web. 29 Nov. 2009. <https://edge.rit.edu/content/P10010/public/Home>.[4] Gombatto, Sarah. "Hip Rotation Range of Motion in People With and Without Low Back Pain Who Participate in Rotation-Related Sports." National Center for Biotechnology Information. N.p., n.d. Web. 14 May 2010. <http://www.ncbi.nlm.nih.gov/pmc/articles/PMC2597839/>.[5] Jan, Khwaja. "Flex Sensors." Flex Sensors. N.p., n.d. Web. 22 Jan. 2010. <mech207.engr.scu.edu/SensorPresentations/Jan - Flex Sensor Combined.pdf>.[6] "LIS302DL." MEMS motion sensor. ST, n.d. Web. 2 Feb. 2010. <www.st.com/stonline/products/literature/ds/12726.pdf>.[7] "IMU Combo Board." SparkFun Electronics. N.p., n.d. Web. 23 Jan. 2010. <www.sparkfun.com/datasheets/Accelerometers/IMU_ Combo_Board-v2.pdf>.[8] "DE-ACCM3D2 General Description." Dimension Engineering. N.p., n.d. Web. 14 Feb. 2010. <www.dimensionengineering.com/datasheets/DE-ACCM3D2.pdf>.[9] "SparkFun Electronics - Atomic IMU 6 Degrees of Freedom - XBee Ready." SparkFun Electronics - News. N.p., n.d. Web. 14 May 2010. <http://www.sparkfun.com/commerce/product_info. php?products_id=9184> [10] "SparkFun Electronics - IMU 6DOF Razor - Ultra-Thin IMU." SparkFun Electronics. N.p., n.d. Web. 14 May 2010. <http://www .sparkfun.com/commerce/product_info.php?products_id=9431>.[11] "Arduino - ArduinoBoardMega ." Arduino - HomePage . N.p., n.d. Web. 14 May 2010. <http://arduino.cc/en/Main/ArduinoBoardMega>.[12] Goodwin, A., Agnew, M., and Stevenson, J."Accuracy of inertial Motion Sensors in Static, Quasistatic, and Complex Dynamic Engineering." ASME J Biomedical Engineering 131, pp 114501-1 - 114501-5[13]”MicroSD Module 2Gb for Arduino” Libelium. N.p., n.d. Web. 14 May 2010. <http://www.libelium.com/tienda/catalog/product_ info.php?cPath=21&products_id=66> [14] “ezyfit- a free curve fitting toolbox for Matlab” n.d. Web. 14 May 2010. < http://www.fast.u-psud.fr/ezyfit/>
ACKNOWLEDGMENTSOur utmost gratitude is extended to the following:
Dr. Elizabeth DeBartolo, for guiding us through this project from day one with her expertise and invaluable insight.
The members of P10010: Joseph Piehler, Dan Shields, and Alex Frechette, for their perpetually open line of communication and ease of working with.
Dr. Sanjay Palit, for extending his industry experience and advice during MSD1.
Dr. Roy Czernikowski, for his continued guidance of our CE’s.
Dr. Daniel Phillips, for graciously extending us the usage of his laboratory.
Mr. Dave Hathaway, Mr. Steven Kosciol, Mr. Robert Kraynik, and the members of the RIT Mechanical Engineering staff, for lending us their invaluable time and experience, especially in the machine shop.
The National Science Foundation, for providing the grant support which made this project possible.
The Nazareth College Physical Therapy Clinic, specifically Dr. JJ Mowder- Tinney and Dr. Sara Gombatto, for providing us with a wonderful client base, and for always being available to tender advice.
Project P10010

Proceedings of the Multi-Disciplinary Senior Design Conference Page 9
The RIT Packaging Science Department, and more specifically, Ian Cannon, for assisting us with shock testing, both with their time and resources.
Copyright © 2010 Rochester Institute of Technology