Intellectual Disabilities: Developmental & Mild Intellectual Disabilities

Proceedings of the
3rd European Conference on Intellectual Capital
University of Nicosia,
Cyprus
18-19 April 2011
Edited by
Geoff Turner and Clemente Minnone
Copyright The Authors, 2011. All Rights Reserved. No reproduction, copy or transmission may be made without written permission from the individual authors. Papers have been double-blind peer reviewed before final submission to the conference. Initially, paper abstracts were read and selected by the conference panel for submission as possible papers for the conference. Many thanks to the reviewers who helped ensure the quality of the full papers. These Conference Proceedings have been submitted to Thomson ISI for indexing. Further copies of this book and previous year’s proceedings can be purchased from http://academic-conferences.org/2-proceedings.htm ISBN:97-1-906638-95-5 CD Published by Academic Publishing International Limited Reading UK 44-118-972-4148 www.academic-publishing.org
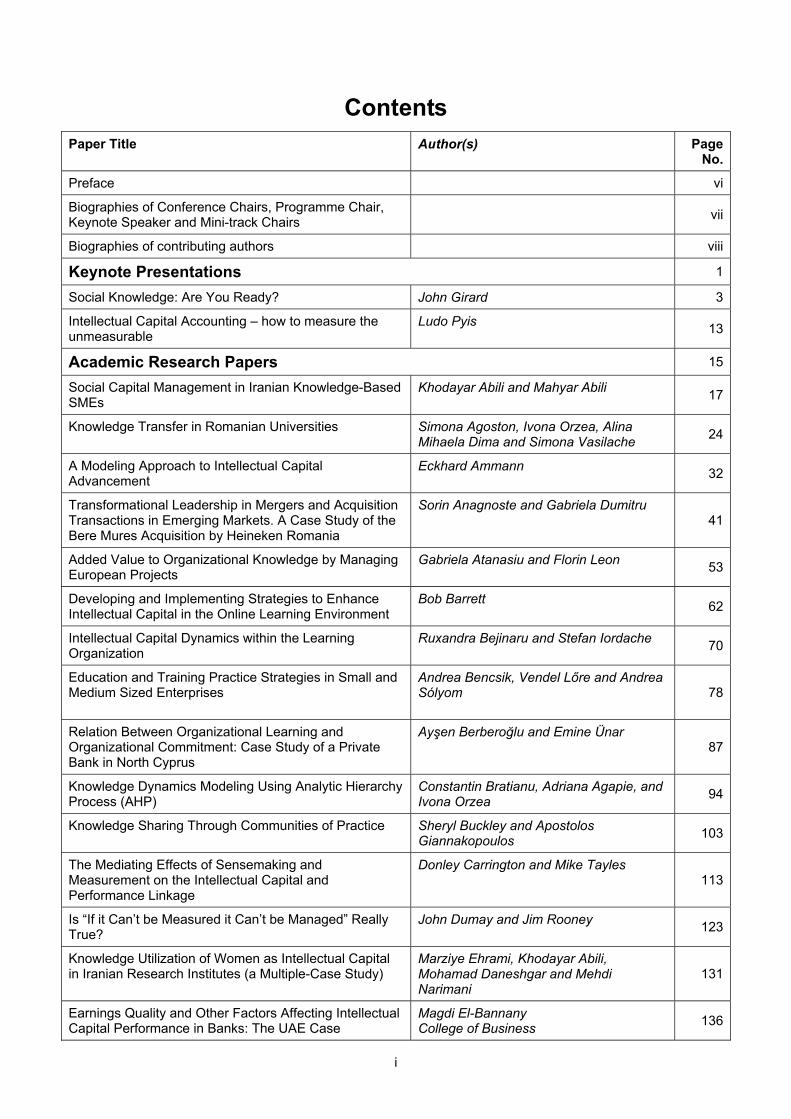
Contents
Paper Title Author(s) Page No.
Preface vi
Biographies of Conference Chairs, Programme Chair, Keynote Speaker and Mini-track Chairs
vii
Biographies of contributing authors viii
Keynote Presentations 1
Social Knowledge: Are You Ready? John Girard 3
Intellectual Capital Accounting – how to measure the unmeasurable
Ludo Pyis 13
Academic Research Papers 15
Social Capital Management in Iranian Knowledge-Based SMEs
Khodayar Abili and Mahyar Abili 17
Knowledge Transfer in Romanian Universities Simona Agoston, Ivona Orzea, Alina Mihaela Dima and Simona Vasilache
24
A Modeling Approach to Intellectual Capital Advancement
Eckhard Ammann 32
Transformational Leadership in Mergers and Acquisition Transactions in Emerging Markets. A Case Study of the Bere Mures Acquisition by Heineken Romania
Sorin Anagnoste and Gabriela Dumitru
41
Added Value to Organizational Knowledge by Managing European Projects
Gabriela Atanasiu and Florin Leon
53
Developing and Implementing Strategies to Enhance Intellectual Capital in the Online Learning Environment
Bob Barrett
62
Intellectual Capital Dynamics within the Learning Organization
Ruxandra Bejinaru and Stefan Iordache
70
Education and Training Practice Strategies in Small and Medium Sized Enterprises
Andrea Bencsik, Vendel LQre and Andrea Sólyom
78
Relation Between Organizational Learning and Organizational Commitment: Case Study of a Private Bank in North Cyprus
Ayşen Berberoğlu and Emine Ünar 87
Knowledge Dynamics Modeling Using Analytic Hierarchy Process (AHP)
Constantin Bratianu, Adriana Agapie, and Ivona Orzea
94
Knowledge Sharing Through Communities of Practice Sheryl Buckley and Apostolos Giannakopoulos
103
The Mediating Effects of Sensemaking and Measurement on the Intellectual Capital and Performance Linkage
Donley Carrington and Mike Tayles
113
Is “If it Can’t be Measured it Can’t be Managed” Really True?
John Dumay and Jim Rooney
123
Knowledge Utilization of Women as Intellectual Capital in Iranian Research Institutes (a Multiple-Case Study)
Marziye Ehrami, Khodayar Abili, Mohamad Daneshgar and Mehdi Narimani
131
Earnings Quality and Other Factors Affecting Intellectual Capital Performance in Banks: The UAE Case
Magdi El-Bannany College of Business
136
i

Paper Title Author(s) Page No.
The Relationship Between Intellectual Capital and Process and Product Innovation in Banks: An Exploratory Study
Ahmed Elsetouhi and Ibrahim Elbeltagi 147
The Strategies and Tactics of Patent Management and Their Importance for Competitive Advantage
Albrecht Fritzsche and Rebecca Geiger
157
Intangible Assets and Value Creation of a Company: Russian and UK Evidence
Tatiana Garanina and Yana Pavlova
165
Impact of Investment in Human Capital on the Business Value
Lidia García-Zambrano, Arturo Rodríguez-Castellanos and José Domingo García-Merino
176
The Relationship between Gross Domestic Product (GDP) and Hidden Wealth during the years 2000- 2009: An International Study
Víctor Raúl López Ruiz, José Luis Alfaro Navarro and Domingo Nevado Peña
187
Academic Satisfaction as an Amplifier of the Organizational Intellectual Capital
Maria de Lourdes Machado and Odília Gouveia
199
Intellectual Capital and Corporate Performance Agnes Maciocha
206
The Influence of Human Capital in Achieving Corporate Performance
Anca Mândruleanu
216
Eliciting Tacit Knowledge From a Domain of Physical Skill
Peter Marshall and Damian Gordon 222
Innovation Strategy and Management Control: The Link Between Knowledge Management and Management Control Systems
Maurizio Massaro, Roland Bardy and Filippo Zanin
231
Intellectual Capital Management: Case Study Portugal Versus Romania
Florinda Matos, Albino Lopes, Marta-Christina Suciu and Alex Ghitiu
240
Intellectual Capital Management and Food Control Florinda Matos, Susana Rodrigues, Albino Lopes, Rui Coutinho and Nuno Matos
251
Knowledge Management for Knowledge Workers Ludmila Mládková
260
Applying the VAIC™ Model to Russian Industrial Enterprises
Maria Molodchik and Anna Bykova
268
Perspectives on the Possibilities Companies Have to Recognise and Measure Intellectual Capital
Maria Cristina Morariu
278
The Structural Model of Intellectual Capital in Higher Education Institutions
Fattah Nazem
286
Knowledge Dynamics in a Chaotic Environment Andrei Stefan Nestian
295
Increasing Knowledge Management Maturity in Organisations: A Capabilities - Driven Model
Theodora Ngosi, Markus Helfert and Ashley Braganza
302
Strategic Innovation and Knowledge Management: The Logic of Creativity and Development Institutionalization, Framing and Diffusion
Bongani Ngwenya 313
The Quality of Knowledge Flows and its Impact on the Intellectual Capital Development of a University
Corina Pelau, Irina Bena, Anca Daniela Vladoi, Dan Cristian Dabija and Monica Fufezan
322
ii

Paper Title Author(s) Page No.
Hierarchy and Tacit Knowledge in the Swedish Armed Forces: An Organisational Approach
Ulrica Pettersson and James Nyce
328
An Alternative to the Crystal Ball: Participatory Approaches for Sustainable Management
Katja Pook and Campbell Warden
333
Human Capital and Relational Capital Dynamics Within a University
Nicolae Al. Pop, Adrian Tantau, Corina Pelau and Irina Bena
343
Knowledge Cities: A Portuguese Case Katia Rodrigues and Eduardo Tomé 350
Governance of Networks of Small Enterprises: A Knowledge Perspective - Some Case Studies in the Mechanical Industry in Italy
Anna Romiti and Daria Sarti 359
Organizational Development Activities and Social Capital Accumulation: Exploring Relationships in Canadian Healthcare Organizations
Kent Rondeau and Terry Wagar
369
Intellectual Capital and a Firm‘s Innovativeness Helena Santos-Rodrigues, Pedro Figueroa Dorrego and Carlos Maria Jardon
378
Factors Influencing the Acquiring of Technological Knowledge Among Technology Transfer Recipients – a Perspective From a Radar Manufacturing Firm
Thanaletchumi Sathasivam, Zuraini Ismail and Ahmad Rahman Songip
388
Enhancing IC Formation by Evoking Hidden Potentials – the Case of Smart Textiles
Klaus Bruno Schebesch
400
In Search of key Factors for Ideal Research and Education Projects
Karen Smits, Ilse van den Donker and Josephine Lappia
410
Intellectual Capital and the Romanian Education System Marta-Christina Suciu, Luciana Picioruş, Cosmin Imbrişc<, Alexandru Ghitiu Bratescu and Foksha Vitaly
417
Information and Communication Technology in Bilingual Societies in Finland
Jukka Surakka, Pertti Saariluoma, Pertti Jokivuori, Marjo Silvennoinen, Helena Suvinen and M T Hyyppä
426
Personal Knowledge Management (PKM) and Personal Employability Management (PEM) – Concepts Based on Competences
Marzena VwigoM 432
World Atlas of Intellectual Capital: Concept and Methodology
Eduardo Tomé
439
Relational Capital Management of new Ventures Through Virtual Embeddedness and Social Media
Eleni Magdalini Vasileiadou, Magdalena Missler-Behr and Sebastian Ullrich
447
ICBS Intellectual Capital Benchmarking System: A Practical Methodology for Successful Strategy Formulation in the Knowledge Economy
José María Viedma Marti 461
A Critical Review of Business Performance Models and Frameworks and Their Application to Sales Organisations
Angelos Vouldis and Angelica Kokkinaki
475
The Global Position of the European Patent Office (EPO): Is Europe Capable of Protecting its Intellectual Capital Effectively?
Piotr Wisniewski 486
PhD Research papers 499
Intellectual Capital Disclosure Commitment: A Myth or Reality?
Deborah Branswijck and Patricia Everaert
501
iii
iv
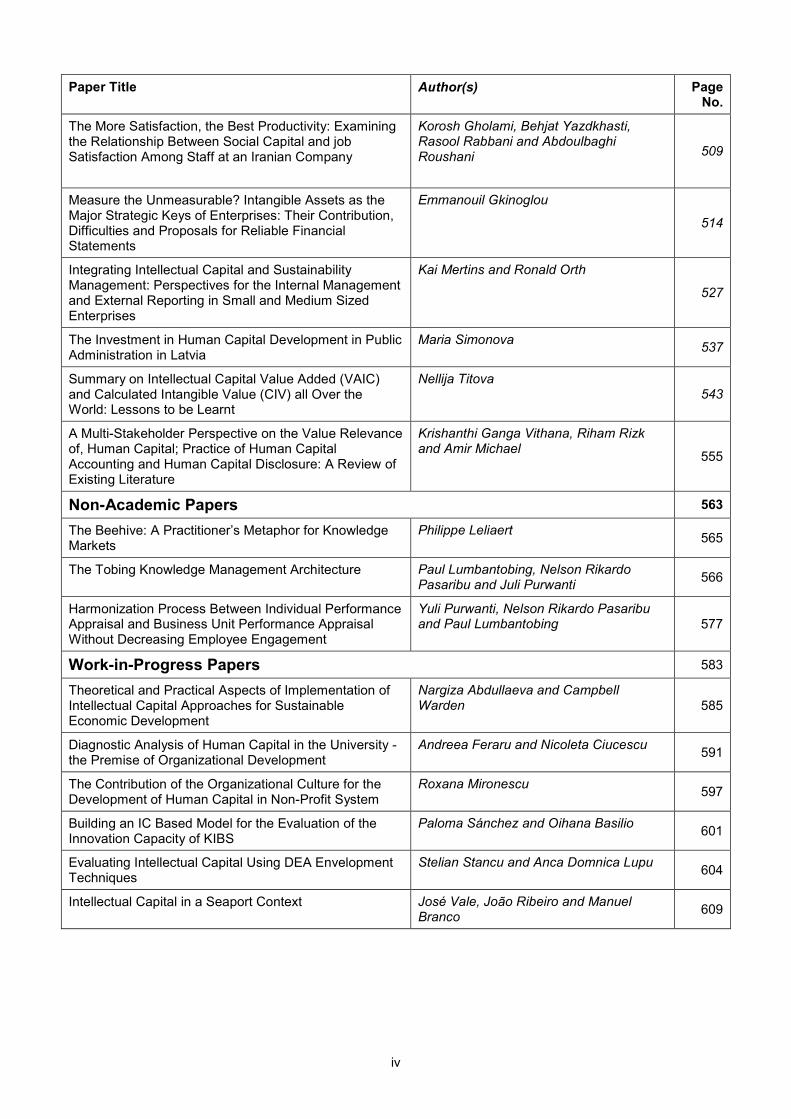
Paper Title Author(s) Page No.
The More Satisfaction, the Best Productivity: Examining the Relationship Between Social Capital and job Satisfaction Among Staff at an Iranian Company
Korosh Gholami, Behjat Yazdkhasti, Rasool Rabbani and Abdoulbaghi Roushani
509
Measure the Unmeasurable? Intangible Assets as the Major Strategic Keys of Enterprises: Their Contribution, Difficulties and Proposals for Reliable Financial Statements
Emmanouil Gkinoglou
514
Integrating Intellectual Capital and Sustainability Management: Perspectives for the Internal Management and External Reporting in Small and Medium Sized Enterprises
Kai Mertins and Ronald Orth
527
The Investment in Human Capital Development in Public Administration in Latvia
Maria Simonova
537
Summary on Intellectual Capital Value Added (VAIC) and Calculated Intangible Value (CIV) all Over the World: Lessons to be Learnt
Nellija Titova 543
A Multi-Stakeholder Perspective on the Value Relevance of, Human Capital; Practice of Human Capital Accounting and Human Capital Disclosure: A Review of Existing Literature
Krishanthi Ganga Vithana, Riham Rizk and Amir Michael
555
Non-Academic Papers 563
The Beehive: A Practitioner’s Metaphor for Knowledge Markets
Philippe Leliaert
565
The Tobing Knowledge Management Architecture Paul Lumbantobing, Nelson Rikardo Pasaribu and Juli Purwanti
566
Harmonization Process Between Individual Performance Appraisal and Business Unit Performance Appraisal Without Decreasing Employee Engagement
Yuli Purwanti, Nelson Rikardo Pasaribu and Paul Lumbantobing
577
Work-in-Progress Papers 583
Theoretical and Practical Aspects of Implementation of Intellectual Capital Approaches for Sustainable Economic Development
Nargiza Abdullaeva and Campbell Warden
585
Diagnostic Analysis of Human Capital in the University - the Premise of Organizational Development
Andreea Feraru and Nicoleta Ciucescu
591
The Contribution of the Organizational Culture for the Development of Human Capital in Non-Profit System
Roxana Mironescu
597
Building an IC Based Model for the Evaluation of the Innovation Capacity of KIBS
Paloma Sánchez and Oihana Basilio
601
Evaluating Intellectual Capital Using DEA Envelopment Techniques
Stelian Stancu and Anca Domnica Lupu
604
Intellectual Capital in a Seaport Context José Vale, João Ribeiro and Manuel Branco
609
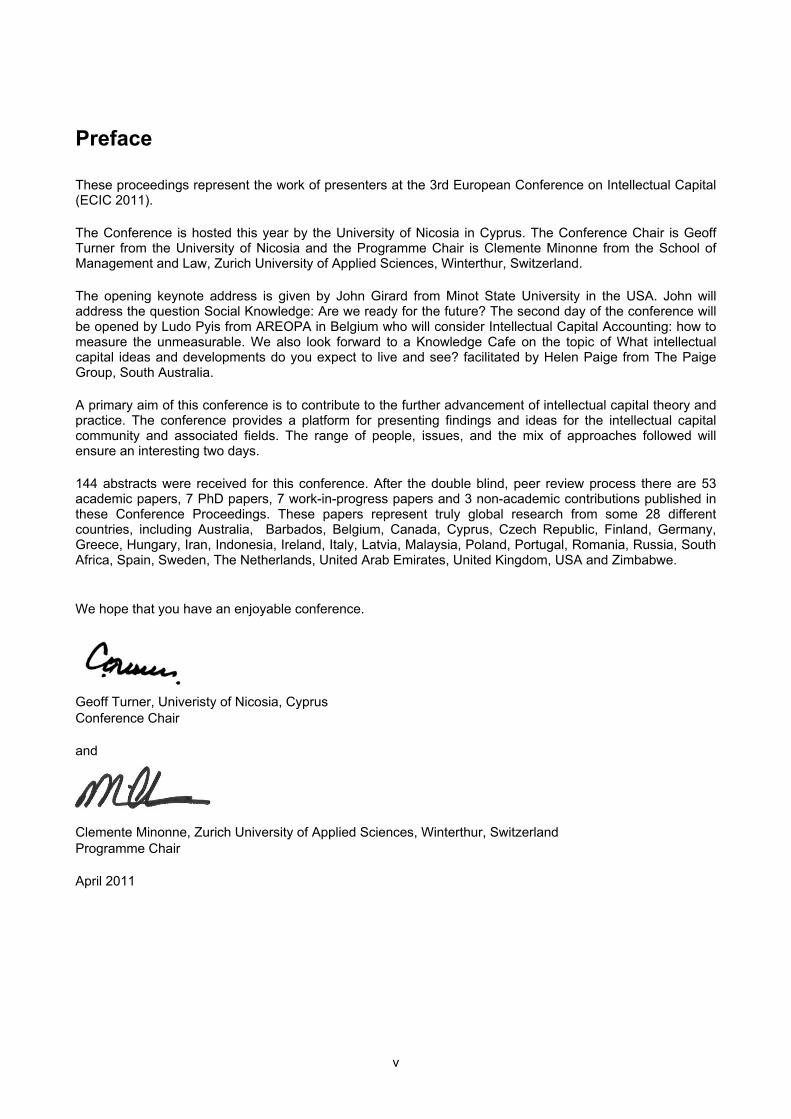
Preface
These proceedings represent the work of presenters at the 3rd European Conference on Intellectual Capital (ECIC 2011). The Conference is hosted this year by the University of Nicosia in Cyprus. The Conference Chair is Geoff Turner from the University of Nicosia and the Programme Chair is Clemente Minonne from the School of Management and Law, Zurich University of Applied Sciences, Winterthur, Switzerland. The opening keynote address is given by John Girard from Minot State University in the USA. John will address the question Social Knowledge: Are we ready for the future? The second day of the conference will be opened by Ludo Pyis from AREOPA in Belgium who will consider Intellectual Capital Accounting: how to measure the unmeasurable. We also look forward to a Knowledge Cafe on the topic of What intellectual capital ideas and developments do you expect to live and see? facilitated by Helen Paige from The Paige Group, South Australia. A primary aim of this conference is to contribute to the further advancement of intellectual capital theory and practice. The conference provides a platform for presenting findings and ideas for the intellectual capital community and associated fields. The range of people, issues, and the mix of approaches followed will ensure an interesting two days. 144 abstracts were received for this conference. After the double blind, peer review process there are 53 academic papers, 7 PhD papers, 7 work-in-progress papers and 3 non-academic contributions published in these Conference Proceedings. These papers represent truly global research from some 28 different countries, including Australia, Barbados, Belgium, Canada, Cyprus, Czech Republic, Finland, Germany, Greece, Hungary, Iran, Indonesia, Ireland, Italy, Latvia, Malaysia, Poland, Portugal, Romania, Russia, South Africa, Spain, Sweden, The Netherlands, United Arab Emirates, United Kingdom, USA and Zimbabwe. We hope that you have an enjoyable conference.
Geoff Turner, Univeristy of Nicosia, Cyprus Conference Chair and
Clemente Minonne, Zurich University of Applied Sciences, Winterthur, Switzerland Programme Chair April 2011
v

Applying the VAIC™ Model to Russian Industrial Enterprises
Maria Molodchik and Anna Bykova State University Higher School of Economics, Perm, Russia [email protected] [email protected] Abstract: Increased attention and focus has been laid on the strategic importance of intellectual capital for modern management. However, intangible resources appear difficult to measure. Today, there are several methods, both financial and nonfinancial ones that allow managing them, to provide benchmarking and analyze its value added function (Sveiby, 2007). The rare investigations of intellectual capital in Russian enterprises show that “Almost in all industries it is still more profitable to invest in tangible assets rather than in intangible ones” (Volkov, Garanina, 2007). Still, some investigations on the micro level show that there are enterprises with high level of technological capital and innovative activity. The researchers called them “innovative leaders” and empirically proved that they have high labour productivity and are awarded by market through extra profit (Gonchar et al., 2010). Using the research sample and Pulic’s Value Added Intellectual Coefficient (VAIC™) the authors investigate empirically the dynamics and structure of VAIC, and study the relation between the intellectual capital and indicators of organizational performance, such as labour productivity, sales growth and profitability. Additionally, the VAIC™ model allows analysing the role of human, structural and physical capital. This paper outlines the study based on 350 Russian industrial enterprises’ annual statistical and account reports from 2005 through 2007. Besides, the authors adopt the VAIC calculation according to the Russian accounting system’s specifications and limitations. The findings support the hypothesis that a company’s intellectual capital influences favourably the organizational performance, and may indicate future competitiveness. A proof showing that the explanatory power of models is higher when considering the additional variables such as investment in fixed capital, R&D expenditures and a company’s size is represented. The results extend the understanding of the intellectual capital role in creation of sustainable advantages for companies in developing economies where different technological advancements may bring different implications for organizational value creation efficiency. Keywords: VAIC™ model, organizational performance, Russian industrial enterprises
1. Introduction
New economy imposes new requirements to the enterprises. The strategic role of intellectual capital in value creation is widely discussed both on theoretical (Bontis, 2001) and empirical (Kremp, Mairesse, 2004; Chen et al., 2005) levels. However, measuring the intangible resources present a problem today. There are several methods both financial and nonfinancial ones that allow managing them, to provide benchmarking and analyze its value added function (Sveiby, 2007). A proof demonstrating that the intellectual capital has positive impact on market value, productivity, return on assets and sales growth is given (Pulic, 2000; Sofian et al., 2002; Chen et al., 2005; Firer, Williams, 2003; Kremp, Mairesse, 2004; Diez et al., 2010; Laing et al., 2010). These investigations were carried out in developed and emerging markets: France, Austria, Spain, Australia, Malaysia, Taiwan and South Africa. We have found only few papers that focus on the intellectual capital of Russian enterprises (Baiburina, Golovko, 2008; Volkov, Garanina, 2007; Gonchar et. al., 2010). Unfortunately, the economic and institutional regime in Russia impacts the efficient use of existing and new knowledge transforming them into competitive advantages. The series of studies conducted over 1000 Russian industrial enterprises show the tremendous difference (from 10 to 20 times) in labour productivity within all branches. And the last survey carried out in 2010 demonstrates that “technological leaders became more powerful and outsiders “fall further technological downstairs” (Gonchar et al., 2010, p.40). These studies empirically proved that “innovative leaders” (the enterprises with high level of technological capital and innovation activity) have high productivity and are awarded by market through extra profit (Gonchar et al., 2010). Due to a different accounting system and poor development of stock market the application of modern methods for measuring intangible assets on the organizational level, such as CIV (Calculated Intangible Value), Market-to-Book-Value, EVA (Economic Value Added), VAIC (Value Added Intellectual Coefficient) and others, is not a simple research task. In this paper the authors try to adapt the model offered by Pulic (2000) VAIC™ to intellectual capital measurement in non-public Russian companies.
268
Maria Molodchik and Anna Bykova
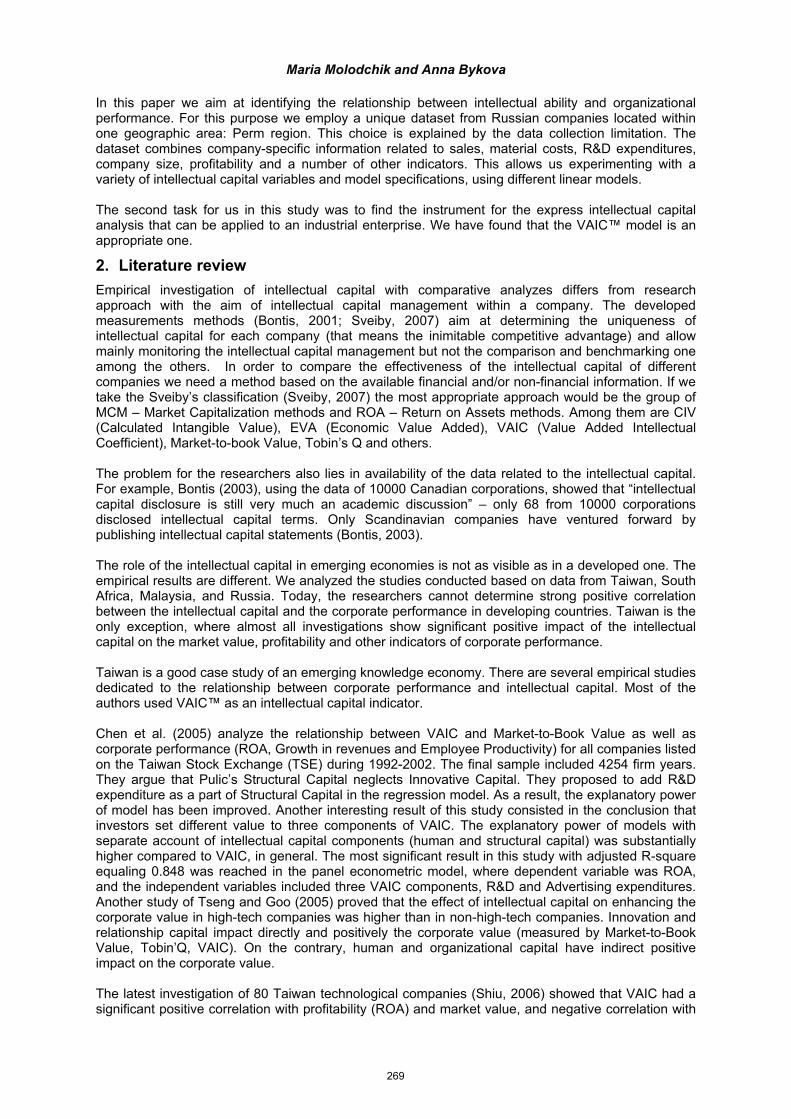
In this paper we aim at identifying the relationship between intellectual ability and organizational performance. For this purpose we employ a unique dataset from Russian companies located within one geographic area: Perm region. This choice is explained by the data collection limitation. The dataset combines company-specific information related to sales, material costs, R&D expenditures, company size, profitability and a number of other indicators. This allows us experimenting with a variety of intellectual capital variables and model specifications, using different linear models. The second task for us in this study was to find the instrument for the express intellectual capital analysis that can be applied to an industrial enterprise. We have found that the VAIC™ model is an appropriate one.
2. Literature review
Empirical investigation of intellectual capital with comparative analyzes differs from research approach with the aim of intellectual capital management within a company. The developed measurements methods (Bontis, 2001; Sveiby, 2007) aim at determining the uniqueness of intellectual capital for each company (that means the inimitable competitive advantage) and allow mainly monitoring the intellectual capital management but not the comparison and benchmarking one among the others. In order to compare the effectiveness of the intellectual capital of different companies we need a method based on the available financial and/or non-financial information. If we take the Sveiby’s classification (Sveiby, 2007) the most appropriate approach would be the group of MCM – Market Capitalization methods and ROA – Return on Assets methods. Among them are CIV (Calculated Intangible Value), EVA (Economic Value Added), VAIC (Value Added Intellectual Coefficient), Market-to-book Value, Tobin’s Q and others. The problem for the researchers also lies in availability of the data related to the intellectual capital. For example, Bontis (2003), using the data of 10000 Canadian corporations, showed that “intellectual capital disclosure is still very much an academic discussion” – only 68 from 10000 corporations disclosed intellectual capital terms. Only Scandinavian companies have ventured forward by publishing intellectual capital statements (Bontis, 2003). The role of the intellectual capital in emerging economies is not as visible as in a developed one. The empirical results are different. We analyzed the studies conducted based on data from Taiwan, South Africa, Malaysia, and Russia. Today, the researchers cannot determine strong positive correlation between the intellectual capital and the corporate performance in developing countries. Taiwan is the only exception, where almost all investigations show significant positive impact of the intellectual capital on the market value, profitability and other indicators of corporate performance. Taiwan is a good case study of an emerging knowledge economy. There are several empirical studies dedicated to the relationship between corporate performance and intellectual capital. Most of the authors used VAIC™ as an intellectual capital indicator. Chen et al. (2005) analyze the relationship between VAIC and Market-to-Book Value as well as corporate performance (ROA, Growth in revenues and Employee Productivity) for all companies listed on the Taiwan Stock Exchange (TSE) during 1992-2002. The final sample included 4254 firm years. They argue that Pulic’s Structural Capital neglects Innovative Capital. They proposed to add R&D expenditure as a part of Structural Capital in the regression model. As a result, the explanatory power of model has been improved. Another interesting result of this study consisted in the conclusion that investors set different value to three components of VAIC. The explanatory power of models with separate account of intellectual capital components (human and structural capital) was substantially higher compared to VAIC, in general. The most significant result in this study with adjusted R-square equaling 0.848 was reached in the panel econometric model, where dependent variable was ROA, and the independent variables included three VAIC components, R&D and Advertising expenditures. Another study of Tseng and Goo (2005) proved that the effect of intellectual capital on enhancing the corporate value in high-tech companies was higher than in non-high-tech companies. Innovation and relationship capital impact directly and positively the corporate value (measured by Market-to-Book Value, Tobin’Q, VAIC). On the contrary, human and organizational capital have indirect positive impact on the corporate value. The latest investigation of 80 Taiwan technological companies (Shiu, 2006) showed that VAIC had a significant positive correlation with profitability (ROA) and market value, and negative correlation with
269

Maria Molodchik and Anna Bykova
productivity. The certain time lag relationship between VAIC and the corporate performance has also been found in this study. Using data from 75 publicity traded companies in South Africa, Firer and Williams (2003) examined the relationship between the intellectual capital and traditional measures of the corporate performance. They have not found any strong positive effects of VAIC on profitability, productivity and market value. The overall physical capital appeared as the most significant resource of the corporate performance. The empirical evidence from Malaysia shows that the companies with higher intellectual capital tend to achieve higher performance levels (Sofian et al., 2002). The study conducted over more than 100 large Malaysian companies found positive association for different components of intellectual capital with industry leadership, future outlook, profit growth, successful new products and other factors. We have found only two econometric-based empirical investigations of the intellectual capital developed on the Russian companies. The researchers from St. Petersburg Volkov and Garanina (2007) have chosen the Calculated Intangible Value method offered by T. Stewart in order to investigate the impact of fundamental value of tangible and intangible assets on the market value of the Russian companies. They developed econometric models based on the data of Russian stock market from 2001 through 2005 for 43 companies. It was concluded that the market value of assets in the Russian economy depends on the fundamental value of both tangible and intangible assets. But the role of tangible assets is higher than that of the intangible ones. This study also provides the industry analysis. Evidence is represented showing that the relationship between the market value of assets and the fundamental value of intangible assets was better explained in such industries as engineering and communication services. Using the data from 19 open Russian companies from 2002 through 2006, Baiburina and Golovko (2008), investigated the drivers of intellectual enterprise value. The authors determined intellectual enterprise value as the difference between market value of ordinary shares and balance value of equity. They showed that the intellectual enterprise value was influenced by expenditures on training of employees, controlling shareholder, total assets/number of employees, delta dividend payout, and delta investment. In this paper we take into account previously obtained empirical results and try to extend the understanding of the intellectual capital role in the emerging economy conducting the empirical study over 350 non-public Russian industrial enterprises located in Perm region.
3. Research design
In our research study we have chosen Value Added Intellectual Coefficient as an indicator of organizational intellectual ability. The Value Added Intellectual Coefficient, VAIC indicates “corporate value creation efficiency, or corporate intellectual ability. VAIC measures how much new value has been created per invested monetary unit in resources” (Pulic, 2000). The higher the VAIC coefficient is, the better management utilizes a company’s value creation potential. To the first time VAIC was tested by Pulic (2000) on 30 randomly selected companies from the FTSE (UK) 250 from 1992 through 1998 (Pulic, 2000). He has found out that the average values of VAIC and a company’s market value exhibited a high degree of correspondence. The potential of VAIC is motivated by growing evidence in the literature. This method has the following advantages (Pulic, 2000):
Standardized measures approach that allows international comparative analysis;
Use of audited information, therefore calculations can be considered objective and verifiable;
Easy calculation, which promises future universal acceptance as measurement of corporation performance (such as ROA, MV/BV, and others).
VAIC consists of the total sum of the value creation efficiency of the intellectual capital that contains two components: human and structural capital and physical capital. The procedures calculating the Value Added intellectual Coefficient are, as follows (Pulic, 2000).
270

Maria Molodchik and Anna Bykova
VAIC = ICE +CEE ICE – Intellectual capital efficiency is obtained by adding up the partial efficiencies of human and structural capital: ICE=HCE+SCE HCE – Human capital efficiency: indicator of the Value Added efficiency of human capital; SCE – Structural capital efficiency: indicator of the Value Added efficiency of structural capital. CEE – Capital employed efficiency: indicator of the Value Added efficiency of capital employed. Intellectual capital as mentioned above has two components: human and structural capital. All the expenditures for employees are embraced in the human capital. According to Pulic (2000), the VAIC concept is the first one, where salaries and wages are no more part of “input” expenses. The human capital is defined by Edvinson and Malone (1997) as “combined knowledge, skill, innovativeness and ability of the company’s individual employees to meet the task at hand. It also includes the company’s values, culture and philosophy”. Pulic (2000) suggested calculating the human capital (HC) using companies’ total salaries and wages, and the human capital efficiency as a ratio of the Value Added to the Human Capital.
HCE = VA/HC VA – Value Added is calculated as the difference between total sales (OUT) and material costs (INPUT). The second component of intellectual capital is a structural capital. Edvinson and Malone (1997) suggested that it is “everything left at the office when the employees go home”. The structural capital includes hardware, software, databases, organizational structure, patents, trademarks and everything else of the organizational capability that supports the employees’ productivity. This form of capital is not an independent size compared to the human capital. It is dependent on the created value added and in reverse proportion to the Human Capital, and is calculated as follows:
SC= VA – HC This means that the higher the share of human capital in the created Value Added is, the smaller is the share of the Structural Capital. That is why the efficiency of the Human Capital and the Structural Capital is calculated in a different manner. Pulic suggested that the Structural Capital efficiency can be obtained as a ratio of the Structural Capital and the Value Added.
SCE = SC/VA The Value Added Intellectual Coefficient contains not only the efficiency of the Intellectual Capital but also the efficiency of employed capital that can be calculated by dividing the Value Added by the Capital Employed (CE - book value of the net assets).
CEE = VA/CE VAIC is an output-oriented process method that can be applied across different business forms and at various levels of operations. Any link between VAIC and its components, drivers and organizational performance is unlikely to be simple. We therefore consider the possibility that the link between VAIC, its components, performance indicators and drivers may be non-linear and conditional on other factors. We focus on two prominent hypotheses. Following this fact, two models have been constructed during the research:
1. The Model is directed on the performance and VAIC relationship search. It assumes that the positive link between VAIC and organizational performance indicators exists for the Russian industrial companies [Hypothesis 1].
271

Maria Molodchik and Anna Bykova
2. The Model is directed on the performance and VAIC components relationship search. It assumes that the positive link between the intellectual capital and capital employed efficiency and company performance indicators exists for the Russian industrial companies [Hypothesis 2].
We allowed for companies’ size and industries’ diversification. We also checked for our results robustness to the omission of all control variables. With regard to these assumptions and literature background we used the following research framework:
Figure 1: The research scheme (source: modified from Laing, Dunn, Hughes-Lucas (2010))
The review of the empirical literature (Pulic, 2004; Firer, Williams, 2003; Chen et al., 2005) reveals the use of VAIC as both a dependent and an independent variable. It will be included in this study as a dependent variable, in order to test the extent to which it may be related to a company performance. Table 1 provides a brief description of variables used in our study that were selected based on earlier studies and theoretical models. In order to capture possible effects, we also consider natural logarithms of the measures.
Table 1: Variable list
Variable Variable description Dependent variables
TLP_vad Total labour productivity (is measured by value added ) per 1 employee Sales_growth Total net sales figures (t) – total net sales figures (t-1)/total net sales figures (t-1);
measures changes in the total sales of the firm.
272

Maria Molodchik and Anna Bykova
Variable Variable description ROE Return on Equity
Profitability Net profit figures / total net sales figures Intellectual capital variables
VAIC Value added intellectual coefficient ICE Intellectual capital efficiency CEE Capital employed efficiency
CAPEX Capital investments R&D Research and development expenditures (dummy variable)
Before the empirical study results in the next section we will present the employed data and the research scheme.
4. Data and methodology
The data for the survey was provided by Russian Federal Agency of Government Statistics (Rosstat) and its regional department (Permstat) as well as by SPARK-INTERFAX and FIRA Pro Russian databases based on the companies’ annual statistical and financial reports. The data includes information on 401 small, medium and large companies from different industries, classified according to the 3-digit OKVED codes (classification system of economic activity) over 2005-2007 years. The dataset compiled by the authors reports the gross value-added (GVA) of 23 sectors across the Perm region and includes the following information:
Common indicators – form and structure of ownership, company age, industry and enterprise code.
Economic indicators – total revenue, costs, export, company profitability and unit labour costs.
Specific indicators – total labour productivity, R&D expenditures.
The representativeness study shows the sample equivalence to Perm region economic structure at the sector level (with probability of 0,683). This fact alone provides motivation for studying the intellectual capital for manufacturing industries only. It should be mentioned that a preliminary segregation of the sample was made in this analysis to filter out those companies that did not fall into manufacturing sectors, leaving a total of 101 companies, using which the study was carried out. Table 2 helped us to characterize the type of a company that agreed to collaborate in our study. It presents several descriptive objectives of the sample, where the median and the standard deviation of the variables are detailed.
Table 2: The sample descriptive adjectives (contains data of 2007)
Indicator Objects observation
numbers Median St. deviation
Total labour productivity (calculated with value added), thous. $
279 9,3 45,3
ROE, % 293 21,5 459,7
Profitability, % 289 3,9 42,8
Capex, thous. $ 300 12,7 19668,3
Sales growth, % 289 0,15 3,06
Employees, numbers 297 190 1705
SCE 248 1,0 2,2
HCE 248 1,9 2,6
CEE 248 0,5 0,4
ICE 248 2,3 2,8
VAIC 245 4,0 3,5
273

Maria Molodchik and Anna Bykova
Let us now turn to VAIC and its components for our sample. According to the established approach to the competitiveness theory and intellectual capital concept, the higher intellectual capital efficiency degree is, the more competitive and successful is a company, as measured by total labour productivity, ROE, profitability and other measures.
5. Results of the models’ estimation
As mentioned earlier, the interest in the study of intellectual capital emerged due to their assumed ability to stimulate the value creation. Nevertheless, empirical research offers contradictory results that, on occasions, calls into question the statements made in the papers that study this link. It should be made clear that we also used the following variables among the measures for value creation: sales growth, profitability and return on equity (ROE), none of which showed any significant results for our sample of companies. Only the total labour productivity (measured by value added) can be regarded as a dependent variable (or traditional indicator) in our sample. There is no statistically significant correlation existing between the independent variables. To test Hypothesis 1 we have constructed the following equation impact on the company’s productivity in the region: Y = g + g1VAIC+ g2Capex+ g3R&D+ g4Size+ g5Industry + つ (1) , where dependent variable represents the company’s competitiveness and is measured by total labour productivity. OLS method is used for regression equation coefficient estimation. In case of Hypothesis 1 confirmation, the variables reflecting intellectual capital efficiency, need to be statistically significant and have the positive sign. The results of the regression analyses are shown in Table 3.
Table 3: Regression results for model 1
Depend variable: Total labour productivity Independent variables
g Statistical significance VAIC 32,890 ,085*
Capex 0,002 ,000***
R&D 232,714 0,087**
Size ,282 , 485
Industry membership -71,657 ,721
Constant 211,869 ,131
F 56,778
Prob>F 0,000***
Adj. R-square 0,562
Observation numbers 226
Notes: * Significant at p<0.1. ** Significant at p< 0.05. *** Significant at p<0.001. The model reports the results for the total labour productivity variable (TLP_vad). As was expected, the coefficient for VAIC is significant and the coefficients for the capital investments and research & development expenditures indicators are positively associated with TLP. In spite of the fact that the explanatory model power is 56%, our equation is significant on 5% probability level, we can assume that non-linear relationship between analyzing factors and, as revealed by Shui (2006), time lag presence between VAIC and corporate performance, probably, exists. Due to these facts the additional research is required. It is needed to divide VAIC by two its components – human and structural capital. Let us now find the relationship between intellectual and capital employed capital efficiency and performance indicators. During the research process we have assumed that, as pointed out by Gonchar, Kuznecov and et al. (2010), the organizations with positive intellectual capital influence on the company’s performance and extra-return gaining from it do exist. For this purpose, we used the linear regression based on information of 2007. Equation (2) describes the general specification adopted for the aggregate empirical test of the intellectual ability drivers:
Y= g + g1ICE+ g2CEE + g3Capex+ g4R&D+ g5Size+ g6Industry + つ (2), where dependent variable (Y) is the total labour productivity, too.
274
Maria Molodchik and Anna Bykova
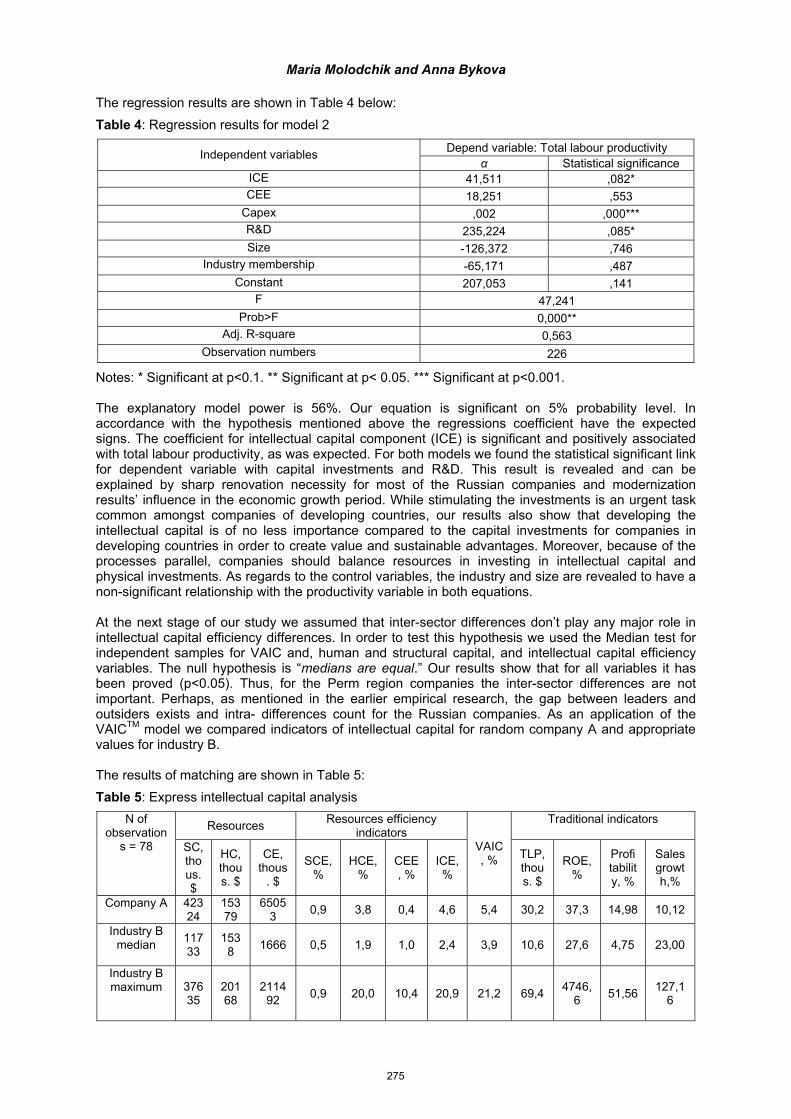
The regression results are shown in Table 4 below:
Table 4: Regression results for model 2
Depend variable: Total labour productivity Independent variables
g Statistical significance ICE 41,511 ,082*
CEE 18,251 ,553
Capex ,002 ,000***
R&D 235,224 ,085*
Size -126,372 ,746
Industry membership -65,171 ,487
Constant 207,053 ,141
F 47,241
Prob>F 0,000**
Adj. R-square 0,563
Observation numbers 226
Notes: * Significant at p<0.1. ** Significant at p< 0.05. *** Significant at p<0.001. The explanatory model power is 56%. Our equation is significant on 5% probability level. In accordance with the hypothesis mentioned above the regressions coefficient have the expected signs. The coefficient for intellectual capital component (ICE) is significant and positively associated with total labour productivity, as was expected. For both models we found the statistical significant link for dependent variable with capital investments and R&D. This result is revealed and can be explained by sharp renovation necessity for most of the Russian companies and modernization results’ influence in the economic growth period. While stimulating the investments is an urgent task common amongst companies of developing countries, our results also show that developing the intellectual capital is of no less importance compared to the capital investments for companies in developing countries in order to create value and sustainable advantages. Moreover, because of the processes parallel, companies should balance resources in investing in intellectual capital and physical investments. As regards to the control variables, the industry and size are revealed to have a non-significant relationship with the productivity variable in both equations. At the next stage of our study we assumed that inter-sector differences don’t play any major role in intellectual capital efficiency differences. In order to test this hypothesis we used the Median test for independent samples for VAIC and, human and structural capital, and intellectual capital efficiency variables. The null hypothesis is “medians are equal.” Our results show that for all variables it has been proved (p<0.05). Thus, for the Perm region companies the inter-sector differences are not important. Perhaps, as mentioned in the earlier empirical research, the gap between leaders and outsiders exists and intra- differences count for the Russian companies. As an application of the VAIC
TM model we compared indicators of intellectual capital for random company A and appropriate
values for industry B. The results of matching are shown in Table 5:
Table 5: Express intellectual capital analysis
Resources Resources efficiency
indicators Traditional indicators N of
observations = 78 SC,
thous. $
HC, thous. $
CE, thous
. $
SCE, %
HCE, %
CEE, %
ICE, %
VAIC, %
TLP, thous. $
ROE, %
Profi tability, %
Sales growth,%
Company A 42324
15379
65053
0,9 3,8 0,4 4,6 5,4 30,2 37,3 14,98 10,12
Industry B median
11733
1538
1666 0,5 1,9 1,0 2,4 3,9 10,6 27,6 4,75 23,00
Industry B maximum 376
35 20168
211492
0,9 20,0 10,4 20,9 21,2 69,4 4746,
6 51,56
127,16
275

Maria Molodchik and Anna Bykova
The figures show the good position of company A in comparison with average meanings, but also the growth potential in terms of human and employed capital efficiency and traditional performance indicators.
6. Conclusion
For the Perm companies our results suggest that VAIC and its components with other establishments are significantly associated with a company’s performance measured by total labour productivity. As such, our findings are rather similar to those from other recent research (Firer, Williams, 2003; Diez et al., 2010). We found that the VAIC
TM model is appropriate to express company’s intellectual ability
analysis. At the same time, our results need to be interpreted with a certain dose of caution. Although we took much care in trying to ascertain the robustness of the reported results, there are no limits to the number of additional sensitivity tests that could be applied in terms of data, variable definitions, model specification and econometric techniques. Furthermore, we did not investigate a question of occurrence of processes’ causality of intellectual capital efficiency and labour productivity, profitability, sales growth and others. Considering the organizational intellectual ability phenomenon specificity, it is necessary to carry out a qualitative research. Further investigation may concern analysis of the companies’ organizational intellectual ability best-practices. This paper has discussed the organizational intellectual ability analysis. Today, there exists the broad umbrella for a wide variety of similar, but nevertheless different concepts. A deeper understanding of how companies benefit from intellectual capital is necessary to avoid confusion, formulate a meaningful organizational intellectual ability concept, and select the appropriate methodology. The knowledge-based environment in Russia and majority of other currently developing countries requires a new model with intangible assets disclosure. In this case, the intellectual capital is receiving an increased attention.
Acknowledgements
This study comprises research findings from the ‘Intellectual Capital Evaluation” Project carried out within The Higher School of Economics’ 2011 Academic Fund Program.
References
Baiburina, E.R., Golovko, T.V., (2008), “Empirical investigation of intellectual enterprise value and its factors for big Russian companies”, Corporate Finance, ヽ2 (6), pp.5-23
Bontis, N. (2001), “Assessing knowledge assets: a review of the models used to measure intellectual capital”, International Journal of Management Reviews, Vol.3, No1: pp. 41-60
Bontis, N. (2003), “Intellectual capital disclosure in Canadian corporations”, Journal of Human Resource Costing and Accounting, Vol. 7 N1/2, pp. 9-20.
Chen, M-C., Cheng, S-J., Hwang, Y. (2005), “An empirical investigation of the relationship between intellectual capital and firms’ market value and financial performance”, Journal of Intellectual Capital, Vol.6, No.2, pp. 159-176
Diez, J.M., Ochoa, M.L., Prieto, M. B., Santidrian, A. (2010), “Intellectual capital and value creation in Spanish firms”, Journal of Intellectual Capital, Vol.11 No.3, pp.348-367
Edvinsson, L. and Malone, M. S., (1997), Intellectual Capital: Realizing your Company’s True Value by Finding its Hidden Brainpower. New York, NY: Harper Business.
Firer, S. and Williams, M. (2003), “Intellectual capital and traditional measures of corporate performance”, Journal of Intellectual Capital, Vol.4 No.3, pp.348-360
Gonchar, K., Kuznecov, B., Dolgopyatova, T., Golikova, V., Yakovlev, A. (2010), “Firms and markets in 2005-2009: evidence from two rounds of manufacturing industry research”, [online] https://www.hse.ru/data/2010/04/07/1218113331/report.pdf
Kremp, E., Mairesse J., (2004), Knowledge management, innovation and productivity: a firm level exploration based on manufacturing CIS3 DATA, National Bureau of Economic Research
Laing G., Dunn J., Hughes-Lucas S. Applying the VAIC model to Australian hotels, Journal of Intellectual Capital, Vol. 11, No.3, 2010, pp. 269-283
Pulic, A. (2000), “MVA and VAIC analysis of randomly selected companies from FTSE 250”, [online] www.vaic-on.net
Pulic, A. (2000), “Basic information on VAICTM”
, [online], www.vaic-on.net Shiu, H.-J. (2006), The Application of the Value Added Intellectual Coefficient to Measure Corporate
Performance: Evidence from Technological Firms, International Journal of Management, Vol.23 No.2, pp. 356-365
276

Maria Molodchik and Anna Bykova
Sofian, S., Tayles, M., Pike R., (2002), The implications of intellectual capital on performance measurement and corporate performance, [online], www.fppsm.utm.my/.../57-the-implications-of-intellectual-capital-on-performance-measurement-and-corporate-performance.html
Sveiby, K.-E., (2007), Methods for Measuring Intangible Assets, [online] http://www.sveiby.com/articles/IntanbibleMethods.htm
Tseng, C.-Y., Goo, Y.-J. J., (2005), Intellectual capital and corporate value in an emerging economy: empirical study of Taiwanese manufacturers, R&D Management, 35, 2, pp. 187-201
Volkov, D., Garanina T., (2007), Intangible Assets: Importance in the Knowledge-Based Economy and the Role in Value Creation of a Company. The Electronic Journal of Knowledge Management, Volume 5 Issue 4, pp.539-550, [online] www.ejkm.com
277