Proceedings of the 1 International Technology, Education ... · Proceedings of the 1st...
14
Proceedings of the 1 st International Technology, Education and Environment Conference (c) African Society for Scientific Research (ASSR) Co-Published By: Human Resource Management Academic Research Society 536 OPTIMAL PLACEMENT AND SIZING OF A DISTRIBUTED GENERATOR IN A POWER DISTRIBUTION SYSTEM USING DIFFERENTIAL EVOLUTION M. Abbagana 1 , G. A. Bakare 2 , and I. Mustapha 3 1 &3 Department of Electrical and Electronics Engineering, University of Maiduguri, Nigeria 2 Electrical Engineering Programme, Abubakar Tafawa Balewa University, Bauchi Nigeria. Email: [email protected]; [email protected] ; [email protected] Abstract Centralized generation of electricity based on bulk power planning pose many economical and environmental challenges, the best alternatives to overcome these challenges is to introduce distributed and dispersed generation, which can be conveniently located closer to load centers. There have been many studies, to define the optimal locations of distributed generation. In this paper, Differential Evolution approach is used to find the optimal location and size of a Distributed Generation (DG) unit. The DG sources are added to the network to mainly reduce the power losses and improve the voltage profile by supplying a net amount of power. The feasibility and effectiveness of the tool has been demonstrated on IEEE 33 bus radial distribution system consisting of 32 sections. MATPOWER and MATLAB software were used for simulation. The result revealed that the system losses have been reduced by 47.3934 percent for the installation of one DG. The nodes violating the voltage limits reduced to 3 from 18 and the sum of square of voltage error dropped to 0.02968 from 0.1369 p.u. Keywords: Distributed Generation, Real Power, Loses, Reactive Power, Optimization, Voltage, Nodes. INTRODUCTION Centralized generation of electricity based on bulk power planning methodology require large facilities, including land and personnel needed to operate and high capital cost. Moreover, since these big power stations cannot be constructed closer to load centers for some obvious reasons, there was a need for long extra high voltage or ultra high voltage transmission line, including transmission sub stations. Similar to power station, these transmission lines and sub stations need an ample amount of money in design, construction, operation and maintenance. The lengthy structure of the transmission line makes them vulnerable to natural hazards such as heavy wind, rain storms and lightning. These natural hazards, in some case become the major reason for partial or full black out of the power system triggered by some line outages. These conditions added with economical and environmental pressures have in the recent past, been changing the generation approaches of traditional electric power utilities. Some of the economical and environment factors associated with large power plants are environmental impacts, transmission right of way problems, high investment and long term planning, land requirement for power plant construction and resettlement, to overcome the economical and environmental factors associated with large power plants, one of the best alternatives for change in the traditional way of generation and delivery arrangement is to introduce distributed and dispersed generation, which can be conveniently located closer to load centers (Mithulananthan et al, 2004). Distributed generation is not a new concept. If one looks back on the evolution of the electric power industry, electricity was introduced as an alternative for steam, hydraulics, direct heating and cooling which were produced near the point of consumption in a small scale. The main idea behind the Distributed Generation is that generation is small scale, which can bee easily placed closer to the point of consumption. Various advantages and the climate of the current electricity business, strongly favour the application of DGs. However, there are many issues that need to be considered before allowing the Distributed generators to operate in power systems, in large numbers.
Transcript of Proceedings of the 1 International Technology, Education ... · Proceedings of the 1st...

Proceedings of the 1st International Technology, Education and Environment Conference(c) African Society for Scientific Research (ASSR)
Co-Published By: Human Resource Management Academic Research Society 536
OPTIMAL PLACEMENT AND SIZING OF A DISTRIBUTED GENERATOR INA POWER DISTRIBUTION SYSTEM USING DIFFERENTIAL EVOLUTION
M. Abbagana1, G. A. Bakare2, and I. Mustapha3
1 & 3 Department of Electrical and Electronics Engineering, University of Maiduguri, Nigeria2Electrical Engineering Programme, Abubakar Tafawa Balewa University, Bauchi Nigeria.Email: [email protected]; [email protected]; [email protected]
AbstractCentralized generation of electricity based on bulk power planning pose many economical and environmental
challenges, the best alternatives to overcome these challenges is to introduce distributed and dispersed generation, which can beconveniently located closer to load centers. There have been many studies, to define the optimal locations of distributedgeneration. In this paper, Differential Evolution approach is used to find the optimal location and size of a DistributedGeneration (DG) unit. The DG sources are added to the network to mainly reduce the power losses and improve the voltageprofile by supplying a net amount of power. The feasibility and effectiveness of the tool has been demonstrated on IEEE 33bus radial distribution system consisting of 32 sections. MATPOWER and MATLAB software were used forsimulation. The result revealed that the system losses have been reduced by 47.3934 percent for the installation of one DG.The nodes violating the voltage limits reduced to 3 from 18 and the sum of square of voltage error dropped to 0.02968 from0.1369 p.u.
Keywords: Distributed Generation, Real Power, Loses, Reactive Power, Optimization, Voltage, Nodes.
INTRODUCTION
Centralized generation of electricity based on bulk power planning methodology requirelarge facilities, including land and personnel needed to operate and high capital cost. Moreover, sincethese big power stations cannot be constructed closer to load centers for some obvious reasons, therewas a need for long extra high voltage or ultra high voltage transmission line, including transmission substations. Similar to power station, these transmission lines and sub stations need an ample amount ofmoney in design, construction, operation and maintenance. The lengthy structure of the transmission linemakes them vulnerable to natural hazards such as heavy wind, rain storms and lightning. These naturalhazards, in some case become the major reason for partial or full black out of the power system triggeredby some line outages. These conditions added with economical and environmental pressures have in therecent past, been changing the generation approaches of traditional electric power utilities. Some of theeconomical and environment factors associated with large power plants are environmental impacts,transmission right of way problems, high investment and long term planning, land requirement forpower plant construction and resettlement, to overcome the economical and environmental factorsassociated with large power plants, one of the best alternatives for change in the traditional way ofgeneration and delivery arrangement is to introduce distributed and dispersed generation, which can beconveniently located closer to load centers (Mithulananthan et al, 2004).
Distributed generation is not a new concept. If one looks back on the evolution of theelectric power industry, electricity was introduced as an alternative for steam, hydraulics, direct heatingand cooling which were produced near the point of consumption in a small scale. The main idea behindthe Distributed Generation is that generation is small scale, which can bee easily placed closer to thepoint of consumption. Various advantages and the climate of the current electricity business, stronglyfavour the application of DGs. However, there are many issues that need to be considered beforeallowing the Distributed generators to operate in power systems, in large numbers.
Proceedings of the 1st International Technology, Education and Environment Conference(c) African Society for Scientific Research (ASSR)
Co-Published By: Human Resource Management Academic Research Society
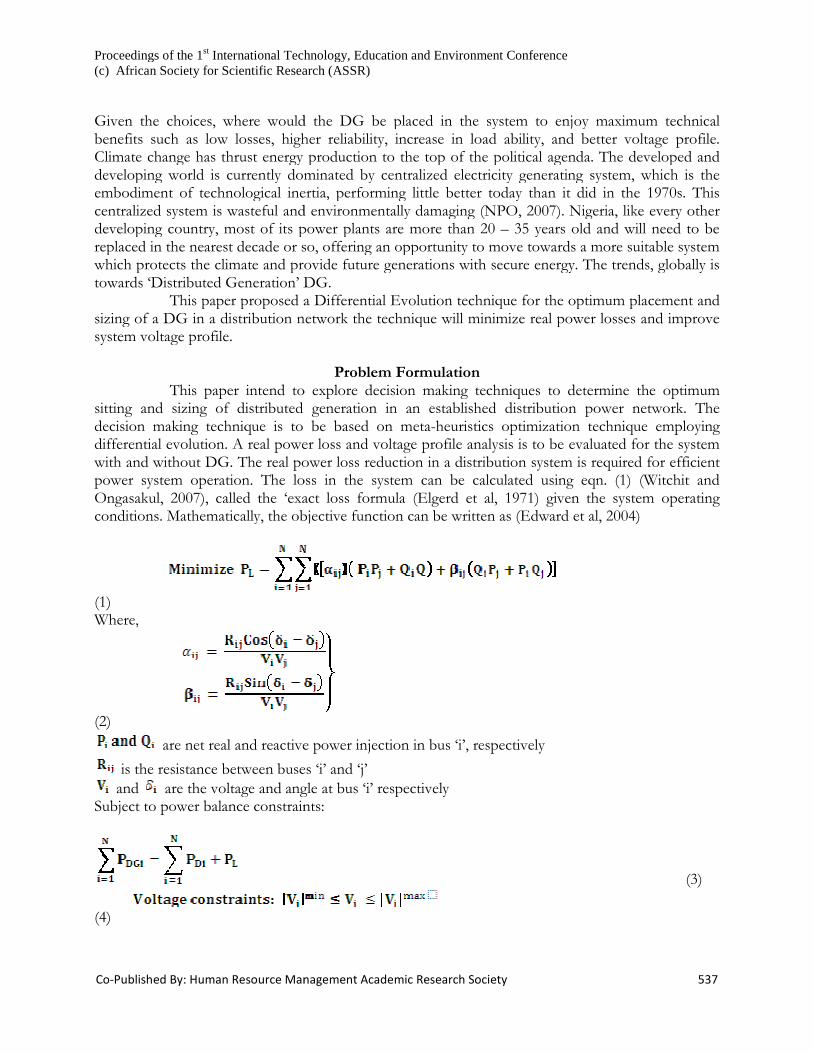
Given the choices, where would the DG be placed in the system to enjoy maximum technicalbenefits such as low losses, higher reliability, increase in load ability, and better voltage profile.Climate change has thrust energy production to the top of the political agenda. The developed anddeveloping world is currently dominated by centralized electricity generating system, which is theembodiment of technological inertia, performing little better today thancentralized system is wasteful and environmentally damaging (NPO, 2007). Nigeria, like every otherdeveloping country, most of its power plants are more than 20replaced in the nearest decade or so, offering an opportunity to move towards a more suitable systemwhich protects the climate and provide future generations with secure energy. The trends, globally istowards ‘Distributed Generation’ DG.
This paper proposed a Differential Evolution techsizing of a DG in a distribution network the technique will minimize real power losses and improvesystem voltage profile.
This paper intend to explore decision making techniques to determine thesitting and sizing of distributed generation in an established distribution power network. Thedecision making technique is to be based on metadifferential evolution. A real power loss and voltage profilwith and without DG. The real power loss reduction in a distribution system is required for efficientpower system operation. The loss in the system can be calculated using eqn. (1) (Witchit andOngasakul, 2007), called the ‘exact loss formula (Elgerd et al, 1971) given the system operatingconditions. Mathematically, the objective function can be written as (Edward et al, 2004)
(1)Where,
(2)
are net real and reactive power injection in bus ‘i’, respectively
is the resistance between buses ‘i’ and ‘j’and are the voltage and angle at bus ‘i’ respectively
Subject to power balance constraints:
(4)
International Technology, Education and Environment ConferenceAfrican Society for Scientific Research (ASSR)
Published By: Human Resource Management Academic Research Society
Given the choices, where would the DG be placed in the system to enjoy maximum technicalbenefits such as low losses, higher reliability, increase in load ability, and better voltage profile.
e has thrust energy production to the top of the political agenda. The developed anddeveloping world is currently dominated by centralized electricity generating system, which is theembodiment of technological inertia, performing little better today than it did in the 1970s. Thiscentralized system is wasteful and environmentally damaging (NPO, 2007). Nigeria, like every otherdeveloping country, most of its power plants are more than 20 – 35 years old and will need to be
so, offering an opportunity to move towards a more suitable systemwhich protects the climate and provide future generations with secure energy. The trends, globally istowards ‘Distributed Generation’ DG.
This paper proposed a Differential Evolution technique for the optimum placement andsizing of a DG in a distribution network the technique will minimize real power losses and improve
Problem FormulationThis paper intend to explore decision making techniques to determine the
sitting and sizing of distributed generation in an established distribution power network. Thedecision making technique is to be based on meta-heuristics optimization technique employingdifferential evolution. A real power loss and voltage profile analysis is to be evaluated for the systemwith and without DG. The real power loss reduction in a distribution system is required for efficientpower system operation. The loss in the system can be calculated using eqn. (1) (Witchit and
, called the ‘exact loss formula (Elgerd et al, 1971) given the system operatingconditions. Mathematically, the objective function can be written as (Edward et al, 2004)
are net real and reactive power injection in bus ‘i’, respectively
is the resistance between buses ‘i’ and ‘j’are the voltage and angle at bus ‘i’ respectively
Subject to power balance constraints:
537
Given the choices, where would the DG be placed in the system to enjoy maximum technicalbenefits such as low losses, higher reliability, increase in load ability, and better voltage profile.
e has thrust energy production to the top of the political agenda. The developed anddeveloping world is currently dominated by centralized electricity generating system, which is the
it did in the 1970s. Thiscentralized system is wasteful and environmentally damaging (NPO, 2007). Nigeria, like every other
35 years old and will need to beso, offering an opportunity to move towards a more suitable system
which protects the climate and provide future generations with secure energy. The trends, globally is
nique for the optimum placement andsizing of a DG in a distribution network the technique will minimize real power losses and improve
This paper intend to explore decision making techniques to determine the optimumsitting and sizing of distributed generation in an established distribution power network. The
heuristics optimization technique employinge analysis is to be evaluated for the system
with and without DG. The real power loss reduction in a distribution system is required for efficientpower system operation. The loss in the system can be calculated using eqn. (1) (Witchit and
, called the ‘exact loss formula (Elgerd et al, 1971) given the system operatingconditions. Mathematically, the objective function can be written as (Edward et al, 2004)
(3)

Proceedings of the 1st International Technology, Education and Environment Conference(c) African Society for Scientific Research (ASSR)
Co-Published By: Human Resource Management Academic Research Society
(5)Where,
is the real power loss in the system
is the real power generation of DG at bus
is the power demand at bus
is the current between buses
A survey of the literature shows that there is no consensus in the definition of DG(Pepermas et al., 2003; Zareipour et al., 2004; Mahat et al, 2006; Sedighizdeh and Rezazadeh,For the integration of distributed generation into distribution network, several literatures haveproposed the use of different optimization techniques. The optimum placement and sizing is done toachieve different objectives. In (Benemar et al., 200of maximizing the reduction on the load supply costs was used. In (Witchit and Ongasakul, 2006),Particles Swarm Optimization (PSO) was used for optimal placement of multiminimizing the total real power loss. Similarly, (Jahanbani et al., 2007) proposed a PSO techniquewith the same objective as above. The improvement in the voltage profile with this technique waspresented. (Siano et al., 2007) proposed the combination of Genetic AlgoriPower Flow (OPF) to efficiently site and size a predefined number of DGs. This differs with otherproposed methods that only define the optimal locations and capacities of DG as a means ofensuring that the maximum amount of DG can beliterature sources on GA optimization technique with the aim of reduction of losses and improvevoltage profile are proposed in (Sedighizaeh and Rezazadeh, 2008; Deependra et al., 2007;Mithulanathan et al., 2004; Hasesen et al., 2005). In (Devi and subranmanyam, 2007), the use ofFuzzy Logic for optimal DG unit placement for loss reduction was proposed. The use of analyticalapproach was presented in (Mahat et al., 2006).
In (Kumar and Goswani, 2009) a Goptimal allocation of distributed generations in power systems for voltage sensitive loads. (Ajay et al.,2008) used analytical approach for sizing of DG unit operated at optimal power factor to reducelosses in radial distribution. DE has been applied in a number of engineering problems. In powerengineering DE has been used to solve generation planning problems (Kannan et al., 2003);capacitor placement problems (Chiou et al., 2004); distribution network reconf(Chiou, et al., 2005); and induction motor identification problems, (Ursem and Vadstrup, 2003), etc.In this particular research, the application of DE for optimal placement and sizing of DG in a powerdistribution system was carried ou
DGs can be divided into two parts from the energy source view point. One is nonrenewable energy including cogeneration, fuel cells and micro turbine systems and the other isrenewable energy including photovoltaic, wind, geotherA constraint for DG source, similar to central generation, is active power constraint. It can beformulated as:
≤(6)
International Technology, Education and Environment ConferenceAfrican Society for Scientific Research (ASSR)
Published By: Human Resource Management Academic Research Society
is the real power loss in the system
is the real power generation of DG at bus
is the power demand at bus
is the current between buses and
Related WorksA survey of the literature shows that there is no consensus in the definition of DG
(Pepermas et al., 2003; Zareipour et al., 2004; Mahat et al, 2006; Sedighizdeh and Rezazadeh,For the integration of distributed generation into distribution network, several literatures haveproposed the use of different optimization techniques. The optimum placement and sizing is done toachieve different objectives. In (Benemar et al., 2006), evolutionary programming with the objectiveof maximizing the reduction on the load supply costs was used. In (Witchit and Ongasakul, 2006),Particles Swarm Optimization (PSO) was used for optimal placement of multi-DGs, with the aim of
total real power loss. Similarly, (Jahanbani et al., 2007) proposed a PSO techniquewith the same objective as above. The improvement in the voltage profile with this technique waspresented. (Siano et al., 2007) proposed the combination of Genetic Algorithm (GA) and OptimalPower Flow (OPF) to efficiently site and size a predefined number of DGs. This differs with otherproposed methods that only define the optimal locations and capacities of DG as a means ofensuring that the maximum amount of DG can be connected to existing and future networks. Otherliterature sources on GA optimization technique with the aim of reduction of losses and improvevoltage profile are proposed in (Sedighizaeh and Rezazadeh, 2008; Deependra et al., 2007;
2004; Hasesen et al., 2005). In (Devi and subranmanyam, 2007), the use ofFuzzy Logic for optimal DG unit placement for loss reduction was proposed. The use of analyticalapproach was presented in (Mahat et al., 2006).
In (Kumar and Goswani, 2009) a Genetic Algorithm based approach was used foroptimal allocation of distributed generations in power systems for voltage sensitive loads. (Ajay et al.,2008) used analytical approach for sizing of DG unit operated at optimal power factor to reduce
radial distribution. DE has been applied in a number of engineering problems. In powerengineering DE has been used to solve generation planning problems (Kannan et al., 2003);capacitor placement problems (Chiou et al., 2004); distribution network reconfiguration problems,(Chiou, et al., 2005); and induction motor identification problems, (Ursem and Vadstrup, 2003), etc.In this particular research, the application of DE for optimal placement and sizing of DG in a powerdistribution system was carried out.
Modelling of DG UnitsDGs can be divided into two parts from the energy source view point. One is non
renewable energy including cogeneration, fuel cells and micro turbine systems and the other isrenewable energy including photovoltaic, wind, geothermal, biomass and so on.A constraint for DG source, similar to central generation, is active power constraint. It can be
538
A survey of the literature shows that there is no consensus in the definition of DG(Pepermas et al., 2003; Zareipour et al., 2004; Mahat et al, 2006; Sedighizdeh and Rezazadeh, 2008.For the integration of distributed generation into distribution network, several literatures haveproposed the use of different optimization techniques. The optimum placement and sizing is done to
6), evolutionary programming with the objectiveof maximizing the reduction on the load supply costs was used. In (Witchit and Ongasakul, 2006),
DGs, with the aim oftotal real power loss. Similarly, (Jahanbani et al., 2007) proposed a PSO technique
with the same objective as above. The improvement in the voltage profile with this technique wasthm (GA) and Optimal
Power Flow (OPF) to efficiently site and size a predefined number of DGs. This differs with otherproposed methods that only define the optimal locations and capacities of DG as a means of
connected to existing and future networks. Otherliterature sources on GA optimization technique with the aim of reduction of losses and improvevoltage profile are proposed in (Sedighizaeh and Rezazadeh, 2008; Deependra et al., 2007;
2004; Hasesen et al., 2005). In (Devi and subranmanyam, 2007), the use ofFuzzy Logic for optimal DG unit placement for loss reduction was proposed. The use of analytical
enetic Algorithm based approach was used foroptimal allocation of distributed generations in power systems for voltage sensitive loads. (Ajay et al.,2008) used analytical approach for sizing of DG unit operated at optimal power factor to reduce
radial distribution. DE has been applied in a number of engineering problems. In powerengineering DE has been used to solve generation planning problems (Kannan et al., 2003);
iguration problems,(Chiou, et al., 2005); and induction motor identification problems, (Ursem and Vadstrup, 2003), etc.In this particular research, the application of DE for optimal placement and sizing of DG in a power
DGs can be divided into two parts from the energy source view point. One is nonrenewable energy including cogeneration, fuel cells and micro turbine systems and the other is
A constraint for DG source, similar to central generation, is active power constraint. It can be

Proceedings of the 1st International Technology, Education and Environment Conference(c) African Society for Scientific Research (ASSR)
Co-Published By: Human Resource Management Academic Research Society
The reactive power output of DG units is also important and must be considered. Smalland medium sized DG units mostly use asynchronous genereactive power. Several options are available to solve this problem. On the other hand, DG unitswith a power electronic interface are sometimes capable of delivering a certain amount of reactivepower (Pepermans et al, 2003). These interfaces or power converters can generate and inject reactivepower (Q) to the network, but ratings of elements increase. The reactive power generation of DGunits which use synchronous generators, depends on reactive power control stracontrol strategies for this group. Constant Q/ constant power factor mode, Voltage regulated mode.Considering this point, the bus connected to the DG can be modeled as PQ or PV bus, dependingon control strategy.
Certain type of DGs like photovoltaic will produce real power only. To find the optimalDG size at bus ‘i’, when it supplies only real power, the necessary condition for minimum loss isgiven by:
(7)From equation (7), we obtain the following relationship:
(8)Equation (8) gives the optimal DG size for each bus so as to minimize the tot
power loss. Any size of DG other than
however is function of loss coefficientof loss coefficients will change as it depends on the state variable voltage and angle.
For synchronous condenser DG, it provides only reactive power to improve voltageprofile. To determine the optimal DG placement, we again differentiate the loss equation on eitherside with respect to . The optimal DG size for every bus in the system is given by equation (9)
(9)
Here we consider that the DG will supply real power and in turn will absorb reactivepower. In the case of the wind turbines, induction generator is used to produce real power and thereactive power will be consumed in the process (Ermis et al, 1992). Thethey require is an ever increasing function of the active power output. The reactive power consumedby the DG wind generation in simple form can be given as in equation (10), (Mahat et al., 2006).
0.5+(10)
International Technology, Education and Environment ConferenceAfrican Society for Scientific Research (ASSR)
Published By: Human Resource Management Academic Research Society
The reactive power output of DG units is also important and must be considered. Smalland medium sized DG units mostly use asynchronous generators that are not capable of providingreactive power. Several options are available to solve this problem. On the other hand, DG unitswith a power electronic interface are sometimes capable of delivering a certain amount of reactive
al, 2003). These interfaces or power converters can generate and inject reactivepower (Q) to the network, but ratings of elements increase. The reactive power generation of DGunits which use synchronous generators, depends on reactive power control strategy. There are twocontrol strategies for this group. Constant Q/ constant power factor mode, Voltage regulated mode.Considering this point, the bus connected to the DG can be modeled as PQ or PV bus, depending
DG Type 1e of DGs like photovoltaic will produce real power only. To find the optimal
DG size at bus ‘i’, when it supplies only real power, the necessary condition for minimum loss is
From equation (7), we obtain the following relationship:
Equation (8) gives the optimal DG size for each bus so as to minimize the tot
power loss. Any size of DG other than placed at bus , will lead to a higher loss. This loss
however is function of loss coefficient .When DG is installed in the system, the valuesof loss coefficients will change as it depends on the state variable voltage and angle.
DG Type 2For synchronous condenser DG, it provides only reactive power to improve voltage
ptimal DG placement, we again differentiate the loss equation on either. The optimal DG size for every bus in the system is given by equation (9)
DG Type 3Here we consider that the DG will supply real power and in turn will absorb reactive
power. In the case of the wind turbines, induction generator is used to produce real power and thereactive power will be consumed in the process (Ermis et al, 1992). The amount of reactive powerthey require is an ever increasing function of the active power output. The reactive power consumedby the DG wind generation in simple form can be given as in equation (10), (Mahat et al., 2006).
539
The reactive power output of DG units is also important and must be considered. Smallrators that are not capable of providing
reactive power. Several options are available to solve this problem. On the other hand, DG unitswith a power electronic interface are sometimes capable of delivering a certain amount of reactive
al, 2003). These interfaces or power converters can generate and inject reactivepower (Q) to the network, but ratings of elements increase. The reactive power generation of DG
tegy. There are twocontrol strategies for this group. Constant Q/ constant power factor mode, Voltage regulated mode.Considering this point, the bus connected to the DG can be modeled as PQ or PV bus, depending
e of DGs like photovoltaic will produce real power only. To find the optimalDG size at bus ‘i’, when it supplies only real power, the necessary condition for minimum loss is
Equation (8) gives the optimal DG size for each bus so as to minimize the total real
, will lead to a higher loss. This loss
.When DG is installed in the system, the valuesof loss coefficients will change as it depends on the state variable voltage and angle.
For synchronous condenser DG, it provides only reactive power to improve voltageptimal DG placement, we again differentiate the loss equation on either
. The optimal DG size for every bus in the system is given by equation (9)
Here we consider that the DG will supply real power and in turn will absorb reactivepower. In the case of the wind turbines, induction generator is used to produce real power and the
amount of reactive powerthey require is an ever increasing function of the active power output. The reactive power consumedby the DG wind generation in simple form can be given as in equation (10), (Mahat et al., 2006).

Proceedings of the 1st International Technology, Education and Environment Conference(c) African Society for Scientific Research (ASSR)
Co-Published By: Human Resource Management Academic Research Society
The loss equation will be modified. After following the similar methodology of the twotypes, optimal DG size can be found by solving (11)
0.003 [1.004(11)
Equation (12) gives the amount of real power that a DG should produce when located atbus ‘i’, so as to obtain the minimum system loss whereas the amount of reactive power that itconsumes can be calculated from equation (12).
The distribution feeder model adopted is shown in Fig.1, as suggested in (Siano et al.,2007) , which allows the installation of loads and generation in all buses. Each branch has thefollowing properties: origin bus, destiny bus, impedance per unit length, apparent power installed,and load power factor. The model chosen is the constant power one. There can be a load (and a power generation (others, including those where generators are found, are PQ buses, with active and reactive powers
specified and voltage to be determined. The reactive power generated by the unit installedbus must be such that:
(12)
Realization of DG Based DG Placement And SizingThe optimal placement and sizing of distributed generators in a power distribution
system can be achieved using the following procedure:
Step i: At the initialization stage, relevant DE parameters such as maximum generation,number of control, D, population size, np, scaling factor for mutation, F, and cross over rate, CR,are defined. Also, power distribution system data required for computation process are actualizedfrom the database.
Fig 1: Feeder model
International Technology, Education and Environment ConferenceAfrican Society for Scientific Research (ASSR)
Published By: Human Resource Management Academic Research Society
The loss equation will be modified. After following the similar methodology of the twotypes, optimal DG size can be found by solving (11)
[1.004 +0.08 0.08 ] + (
Equation (12) gives the amount of real power that a DG should produce when located atminimum system loss whereas the amount of reactive power that it
consumes can be calculated from equation (12).
Load and Feeder ModelThe distribution feeder model adopted is shown in Fig.1, as suggested in (Siano et al.,
llation of loads and generation in all buses. Each branch has thefollowing properties: origin bus, destiny bus, impedance per unit length, apparent power installed,and load power factor. The model chosen is the constant power one. There can be a load (
) in any bus. The substation is the feeder swing bus, while all theothers, including those where generators are found, are PQ buses, with active and reactive powers
specified and voltage to be determined. The reactive power generated by the unit installed
+
+
Realization of DG Based DG Placement And SizingThe optimal placement and sizing of distributed generators in a power distribution
system can be achieved using the following procedure:
: At the initialization stage, relevant DE parameters such as maximum generation,, D, population size, np, scaling factor for mutation, F, and cross over rate, CR,
are defined. Also, power distribution system data required for computation process are actualized
Fig 1: Feeder model
540
The loss equation will be modified. After following the similar methodology of the two
) = 0
Equation (12) gives the amount of real power that a DG should produce when located atminimum system loss whereas the amount of reactive power that it
The distribution feeder model adopted is shown in Fig.1, as suggested in (Siano et al.,llation of loads and generation in all buses. Each branch has the
following properties: origin bus, destiny bus, impedance per unit length, apparent power installed,and load power factor. The model chosen is the constant power one. There can be a load ( )
) in any bus. The substation is the feeder swing bus, while all theothers, including those where generators are found, are PQ buses, with active and reactive powers
specified and voltage to be determined. The reactive power generated by the unit installed at the
The optimal placement and sizing of distributed generators in a power distribution
: At the initialization stage, relevant DE parameters such as maximum generation,, D, population size, np, scaling factor for mutation, F, and cross over rate, CR,
are defined. Also, power distribution system data required for computation process are actualized

Proceedings of the 1st International Technology, Education and Environment Conference(c) African Society for Scientific Research (ASSR)
Co-Published By: Human Resource Management Academic Research Society
Step ii: Run the base case Newton Raphsondetermine the initial bus voltage, and active power losses respectively.Step iii: Each control device of the possible location and the active power are treated as parametersfor optimization. Then randomlyparameter space. The objective function for each vector of the population is computed usingequation (13);
1 +(13)
WhereStep iv: Update the generation count.Step v: Perform mutation, cross over, selection and evaluation of the objective function as describedin iii.Step vi: If the generation count is less than the preset maximum number of generations, go to stepIV otherwise.Step vii: With the optimal size and location of DGs, run the final load flow to obtain the finalvoltage profile and the corresponding system active po
SIMULATION RESULTS AND DISCUSSIONS
In order to see the best location of DG in the distribution system with the view ofminimizing the total real power losses, the differential evolution algorithm was used. Also, an IEEE33 bus radial distribution system consisting of 32 sections shown in Fidemonstrate the effectiveness and feasibility of the techniques.
The DE parameters were varied according to the scenarios in Table 1 to see whichscenario is the best. The algorithm reached a stable (optimum) solution with 30 iterations as depictedin Figures 3 – 8 below, and the corresponding detailed outputs are given in Table 2.
Table 1: Different DE Parameters
Fig 2: Single line diagram of the 33
International Technology, Education and Environment ConferenceAfrican Society for Scientific Research (ASSR)
Published By: Human Resource Management Academic Research Society
: Run the base case Newton Raphson load flow using MATPOWER package version 3.0 todetermine the initial bus voltage, and active power losses respectively.
: Each control device of the possible location and the active power are treated as parametersfor optimization. Then randomly generate initial population comprising the parameters within theparameter space. The objective function for each vector of the population is computed using
1 + +
: Update the generation count.: Perform mutation, cross over, selection and evaluation of the objective function as described
If the generation count is less than the preset maximum number of generations, go to step
: With the optimal size and location of DGs, run the final load flow to obtain the finalvoltage profile and the corresponding system active power loss
SIMULATION RESULTS AND DISCUSSIONS
In order to see the best location of DG in the distribution system with the view ofminimizing the total real power losses, the differential evolution algorithm was used. Also, an IEEE33 bus radial distribution system consisting of 32 sections shown in Fig. 2 is used in order todemonstrate the effectiveness and feasibility of the techniques.
The DE parameters were varied according to the scenarios in Table 1 to see whichis the best. The algorithm reached a stable (optimum) solution with 30 iterations as depicted
8 below, and the corresponding detailed outputs are given in Table 2.
arameters Setting.
Single line diagram of the 33-Bus Radial Distribution System
541
load flow using MATPOWER package version 3.0 to
: Each control device of the possible location and the active power are treated as parametersgenerate initial population comprising the parameters within the
parameter space. The objective function for each vector of the population is computed using
: Perform mutation, cross over, selection and evaluation of the objective function as described
If the generation count is less than the preset maximum number of generations, go to step
: With the optimal size and location of DGs, run the final load flow to obtain the final
In order to see the best location of DG in the distribution system with the view ofminimizing the total real power losses, the differential evolution algorithm was used. Also, an IEEE
g. 2 is used in order to
The DE parameters were varied according to the scenarios in Table 1 to see whichis the best. The algorithm reached a stable (optimum) solution with 30 iterations as depicted
8 below, and the corresponding detailed outputs are given in Table 2.

Proceedings of the 1st International Technology, Education and Environment Conference(c) African Society for Scientific Research (ASSR)
Co-Published By: Human Resource Management Academic Research Society 542
Scenario Number of populationmembers (np)
Iterationmaximum (itermax)
DE-Stepsize (F)
Cross over probabilityconstant (CR)
1 20 30 0.4 0.5
2 30 40 0.5 0.63 40 50 0.6 0.74 50 60 0.7 0.85 60 70 0.8 0.96 70 80 0.9 1.0
Table 2: Best Placement, Size and Power LossesScenario Best
locationDG size(MW)
Initial powerloss(kW)
Final powerloss(kW)
%Power loss reduction
1 NODE12
2.6022 221.4346 116.4912 47.3925
2 NODE12
2.5778 221.4346 116.4919 47.3922
3 NODE12
2.5984 221.4346 116.4901 47.3930
4 NODE12
2.6109 221.4346 116.4948 47.3908
5 NODE12
2.5903 221.4346 116.4892 47.3934
6 NODE12
2.6017 221.4346 116.4910 47.3926
Table 3: Ssve and Number of Nodes Violating LimitsScenario Initial Initial Final Final
Ssve (p.u) No of nodesViolating limits
Ssve(p.u)
No of nodesViolating limits
1 0.1369 18 0.02968 32 0.1369 18 0.02968 33 0.1369 18 0.02968 34 0.1369 18 0.02968 35 0.1369 18 0.02968 36 0.1369 18 0.02968 3
According to the outputs of the six scenarios, which are presented in table 2 and 3, theinitial power loss of the test system which is 221.4346 kW reduced to 116.4892 kW which is 47.39%percent of the initial loss. The nodes that violate the voltage limit dropped from 18 to 3 signifyingthe voltage profile has fall within the maximum and minimum limits. The sum of square of voltageerror also reduced to 0.02968 from 0.1369 p.u. The corresponding DG size is 2.5903 MW to belocated at node 12. Compared with the remaining five scenarios, scenario 5 is the best in terms of thepower loss. For the sum of square of voltage error and the number of nodes violating voltage error,it is the same for all the scenarios. The convergence characteristics and the voltage profile before andafter allocation of DG for the above scenarios are shown in the figures 5 - 10.
Fig 2b: Convergence Characteristics for Case 1

Proceedings of the 1st International Technology, Education and Environment Conference(c) African Society for Scientific Research (ASSR)
Co-
Fig
Fig
Fig 2b: Convergence characteristics for case 1,
Published By: Human Resource Management Academic Research
3: Convergence Characteristics for Case 1, Scenario 2
4: Voage Profile for Case1, Scenario 2 of the 33bus Sy
Society 543
of the 33bus Test System
stem

Proceedings of the 1st International Technology, Education and Environment Conference(c) African Society for Scientific Research (ASSR)
Co-Published By: Human Resource Management Academic Research Society 544
Fig 5: Convergence Characteristics for Case 1, Scenario 3 of the 33bus Test
Fig 6: Voltage for Case1, Scenario 3 of the 33bus System
Fig 7: Convergence Characteristics For Case 1, Scenario 4 of the 33bus Test System

Proceedings of the 1st International Technology, Education and Environment Conference(c) African Society for Scientific Research (ASSR)
Co-Published By: Human Resource Management Academic Research Society 545
Fig 8: Voltage Profile For Case1, Scenario 4 of the 33bus System

Proceedings of the 1st International Technology, Education and Environment Conference(c) African Society for Scientific Research (ASSR)
Co-P
Fig 10: Convergence characteristics for case 1,
ublished By: Human Resource Management Academic Research
scenario 5 of the 33bus test system
Fig 11: Voltage profile for case1, scenario5of
Society 546
the 33 bus system

Proceedings of the 1st International Technology, Education and Environment Conference(c) African Society for Scientific Research (ASSR)
Co-
COAnsysvolalgThdisofIt a
REAja(20ProEle
BeUsCo
Fig 12: Convergence characteristics for case 1,
Published By: Human Resource Management Academic Research
NCLUSIONSextensive review of the DG technologies and their plac
tem using differential evolution with the view to reductage profile was carried out. The advantages and disorithm have been reviewed.e feasibility and effectiveness of the developed tool has btribution system consisting of 32 sections. The study revDG units can have a significant impact on system loss redlso revealed how improper choice of size would lead to h
FERENCESy-D-Vimal Raj, P., Senthilkumar, S., Raja, J., Ra08). Optimization of Distributed Generation Capacityfile Improvement Using PSO. Journal of Electricalctrical Engineering UTM, 10:41 – 48.
nemar, A. and Joao, M.C. (2006). Optimal Placemeing Evolutionary Programming. Proceedings of IEEEnference and Expansion. Latin American, Venezuela.
scenario 6 of the 33bus test system
Fig 13: Voltage profile for case1, scenario 6 ofSociety 547
ement and sizing in a power distributione real power loss and improvement of
advantages of the differential evolution
een demonstrated on IEEE 33 bus radialealed that the proper placement and sizeuction and voltage profile improvement.igher losses
vichandran, S. and Palanivelu, T.G.for Line Loss Reduction and Voltage
Engineering (ELEKTIKA), Faculty of
nt of Distributed Generators NetworksPES Transmission and Distribution
the 33 bus system

Proceedings of the 1st International Technology, Education and Environment Conference(c) African Society for Scientific Research (ASSR)
Co-Published By: Human Resource Management Academic Research Society 548
Chiou.J.P, Shang C.F and Su C. (2004) Ant Direction Hybrid Differential Evolution for SolvingLarge Capacitor Placement Problems.
Deependra, S., Devender, S. and Verma, K.S. (2007). GA Based Optimal Sizing And PlacementOf Distributed Generation For Loss Minimization. Proceedings of World Academy of Science,Engineering and Technology Vol. 26, Pp. 381 – 387.
Edward, M.P., Wills, H.L., and Takahashi, M. (2004). Distributed Generation in DevelopingCountries.www.worldbank.org/html/fpd/em/ distribution_abb.pdf, Accessed June 2007.
Elgerd I.O (1971), Electric energy system theory: an introduction McGrawhill.
Ermis M., H. B. Eratn, M. Demirekler, B. M.Saribatir, Y. Uctung. (1992)“Various Induction Generator Scheme forWind Power Electricity Generation,” Electric PowerSystems Research, vol.23, pp71-83,1992.
Hasesen, E., Esplnoza, M., Pluymers, B., Goethals, I., Thong, V.V., Driesen, J. Belmans, R.and De Moor, B. (2005). Optimal Placement and Sizing of Distributed Generator Units UsingGenetic Optimization Algorithms. Electrical Power Quality and Utilization, Journal, 11: 97 – 104.
Jahanbani, A.A., Kashefi, A.K., Pourmousavi, S.A., Hosseinian, S.H. and Abedi, M. (2007).Sitting and Sizing of Distributed Generation for Loss Reduction. Proceeding of InternationalConference on Power Systems (ICPS), Bangalore, India.
Kannan S.K, Sharf D,J and Ganu L.U (2003) Generation planning using Differential Evolution.
Mithulananthan, N., Than, O. and Le Van P. (2004). Distributed Generator Placement in PowerDistribution System Using Genetic Algorithm to Reduce Losses. Thammasat Int. Journal of Science,Technology, 9:55 – 62.
Mahat, P., Ongaskul, W. and Mithulananthan, N. (2006). Optimal Placement of Wind TurbineDG in Primary Distributions System for Real Loss Reduction. Proceeding of InternationalConference on Energy for Suitable Development: Issues and Prospects for Asia. Phuket. Thailand.
NPO (2007); No2 nuclearpower.org.uk. Decentralized Energy – Power for the 21st Century(Briefing). www.mng:org.uk/gh/resources/no2n_decentralisedenergy.pdf.One Sky/Energetic Solution Conference: OSESC, (2004). Status of Renewable Energy in Nigeria:21 – 27:5 of 5 – 12 of 12.
Pepermans G., Driesen J., Haeseldonckx D., D’haeseleer W., Belmans R. (2003). DistributedGeneration: Definition, Benefits and Issues. Working Paper Series No. 2003 – 8, KatholiekeUniversity Leuven – Energy Institute, Website at http://www.kuleven.belete.
Kumar Singh and S. K. Goswami (2009).A genetic Algorithm Based Approach for OptimalAllocation of Distributed Generations in Power Systems for Voltage sensitive Loads

Proceedings of the 1st International Technology, Education and Environment Conference(c) African Society for Scientific Research (ASSR)
Co-Published By: Human Resource Management Academic Research Society 549
Sedighizadeh, M. and Rezazadeh, A. (2008). Using Genetic Algorithm For DistributedGeneration Allocation to Reduce Losses and Improve Voltage Profile. Proceedings of WorldAcademy of Science, Engineering and Technology, Vol. 27, Pp. 251 – 256.
Siano, P., Harrison, G.P., Piccolo, A and Wallace, A.R. (2007). Strategic Placement ofDistributed Generation Capacity. Proceeding of 19th International Conference on ElectricityDistribution (CIRED), Vienna.
Ursem, R. K. and Vadstrup G. H (2003) Parameter Identification of Induction Motors UsingDifferential Evolution. EVALife, Dept. of Computer Science.
Witchit, K. and Ongasakul, W. (2006). Optimal Placement of Distributed Generation UsingParticle Swarm Optimization. Proceedings of the Australasian Universities Power EngineeringConference (AUPEC), Melboume, Victoria, Australia.
Zareipour, H., Bhattacharya, K., and Anizares, C.A. (2004). Distributed Generation: CurrentStatus and Challenges. Proceedings of 30th Annual North American Power Symposium