
Problems in the estimation and interpretation of the...
55
Quality & Quantity 13: 277-331, 1989. © 1989 Kluwer Academic Printed in Problems in the estimation and interpretation of the reliabDity of survey data DUANE F. ALWIN 277 Institute for Social Research, TM University of Michigan, P.O. Box 1248, Ann Arbor Ml 48106-1248, U.S.A. Allltract. In this paper I discuss several of the difficulties involved in estimating the reliability of survey measurement. Reliability is defined on the basis of classical true-score as the correlational consistency of multiple measures of the same construct, net of true change. This concept is presented within the framework of a theoretical discussion of the sources of error in survey data and the design requirements for separating response variation into components representing such response consistency and measurement errors. Discussion focuses on the potential sources of random and nonrandom errors, including "invalidity" of measurement, the term frequently used to refer to components of method variance. Problems with the estimation of these components are enumerated and discussed with respect to both cross-sectional and panel designs. Empirical examples are given of the estimation of the quantities of interest, which are the basis of a discussion of the interpretational difficulties encountered in reliability estimation. Data are drawn from the ISR's Quality of Life surveys, the National Election Studies and the NORC's General Social Surveys. The general conclusion is that both cross- sectional and panel estimates of measurement reliability are desirable, but for the purposes of isolating the random component of error, panel designs are probably the most advantageous. 1. Introducdon It is widely recognized that errors of measurement are problematic aspects of the data obtained from social surveys. Such "non-sampling" errors arise from several elements of the survey, including (a) the characteristics of the population of interest, (b) the topic or topics linked to the purpose of the survey, (c) the design of the questionnaire, including the wording and context of the questions, as well as the response formats provided, and (d) the specific conditions of measurement. The latter is a broad category including many factors that might affect the nature and extent of error, such as the observational design of the study (e.g. cross-sectional vs. longitudinal design), the mode of administering the questionnaire (e.g. self-administered vs. interviewer-administered), the training of interviewers, and more generally the social situation within which the survey interview is embedded. Survey measurement errors are known to behave both randomly and nonrandomly. In this paper I discuss the conditions under which traditional
Transcript of Problems in the estimation and interpretation of the...

Quality & Quantity 13: 277-331, 1989. © 1989 Kluwer Academic Publis~rs. Printed in t~ Net~rlands.
Problems in the estimation and interpretation of the reliabDity of survey data
DUANE F. ALWIN
277
Institute for Social Research, TM University of Michigan, P.O. Box 1248, Ann Arbor Ml 48106-1248, U.S.A.
Allltract. In this paper I discuss several of the difficulties involved in estimating the reliability of survey measurement. Reliability is defined on the basis of classical true-score t~ory, as the correlational consistency of multiple measures of the same construct, net of true change. This concept is presented within the framework of a theoretical discussion of the sources of error in survey data and the design requirements for separating response variation into components representing such response consistency and measurement errors. Discussion focuses on the potential sources of random and nonrandom errors, including "invalidity" of measurement, the term frequently used to refer to components of method variance. Problems with the estimation of these components are enumerated and discussed with respect to both cross-sectional and panel designs. Empirical examples are given of the estimation of the quantities of interest, which are the basis of a discussion of the interpretational difficulties encountered in reliability estimation. Data are drawn from the ISR's Quality of Life surveys, the National Election Studies and the NORC's General Social Surveys. The general conclusion is that both crosssectional and panel estimates of measurement reliability are desirable, but for the purposes of isolating the random component of error, panel designs are probably the most advantageous.
1. Introducdon
It is widely recognized that errors of measurement are problematic aspects of the data obtained from social surveys. Such "non-sampling" errors arise from several elements of the survey, including (a) the characteristics of the population of interest, (b) the topic or topics linked to the purpose of the survey, (c) the design of the questionnaire, including the wording and context of the questions, as well as the response formats provided, and (d) the specific conditions of measurement. The latter is a broad category including many factors that might affect the nature and extent of error, such as the observational design of the study (e.g. cross-sectional vs. longitudinal design), the mode of administering the questionnaire (e.g. self-administered vs. interviewer-administered), the training of interviewers, and more generally the social situation within which the survey interview is embedded.
Survey measurement errors are known to behave both randomly and nonrandomly. In this paper I discuss the conditions under which traditional
278 D.F. Alwin
psychometric conceptions of test reliability can be used to summarize the random component of survey error for single survey questions. I argue that under appropriate conditions of estimation, reliability is a useful piece of information regarding the quality of the survey information. Non-random components of error are less easily described, but as I suggest here, it is possible to extend the conventional psychometric models to include sources of non-random error. Although the primary focus of this paper is on problems of estimating the nature and extent of random sources of error, a general framework is provided that permits consideration of sources of nonrandom errors.
The first major section of the paper begins with a discussion of the concept of reliability and the importance of studying random measurement errors. This discussion leads to a consideration of the limitations of reliability theory for understanding measurement errors in surveys and the need to develop a more general framework for studying components of non-sampling survey error. A model is presented that conceptualizes the influences of errors on patterns of survey response, and survey measurement designs are evaluated in terms of their utility as strategies for estimating components of error. Empirical examples are presented, illustrating some of the factors affecting estimates of reliability. Data are drawn from the Institute for Social Research's Quality of Life surveys and panel studies from the National Opinion Research Center's General Social Surveys, and recent research results based on the analysis of attitudinal data from the ISR's National Election Studies are briefly summarized.
2. The concept of reliabDity
The psychometric concept of reliability, derived from classical test theory, refers to correlational consistency between two efforts to measure the same thing, using maximally similar measurements, and independent of any true change in the quantity being measured (see Lord and Novick, 1968). Reliability, defined in this way, has been used in a number of applications aimed at understanding the extent of randomness in survey response (e.g. see Achen, 1975; Alwin, 1989a, 1989b; Alwin and Krosnick, 1989a, 1989b; Alwin and Thornton, 1984; Andrews, 1984; Ashet, 1974; Bielby and Hauser, 1977; Bielby, Hauser and Featherman, 1977a, 1977b; Borus and Nestle, 1973; Converse and Markus, 1979; Corcoran, 1980; Erikson, 1979; Hauser, Tsai and Sewell, 1983; Jagodzinski and Kuhnel, 1987; Marquis and Marquis, 1977; Siegel and Hodge, 1968; Smith and Stephenson, 1979). The general conclusion of this body of work is that unreliability

Reliability of survey dala 279
of measurement occurs with respect to a wide variety of content areas, and while the measurement of attitudes may be particularly difficult (Converse, 1964), substantial amounts of error occur in the measurement of other phenomena as well.
Of course, not all survey errors are random. Substantial attention has been paid to the form of questions and reporting biases in survey responses (e.g. Alwin and Krosnick, 1985; Bachman and O'Malley, 1981; Cannell et al., 1981; Groves, 1987; Marquis, 1978; Marquis et al., 1981; Miller and Groves, 1985; Schuman and Presser, 1981; Weaver and Swanson, 1974). However, if one takes the preoccupation of the survey methods literature as a guide, it would seem that problems of random measurement error are minimal. Regardless of the presence of systematic or nonrandom errors in surveys, some error is certainly random. And, while some attention has been given this issue (see references listed above), we still know very little about patterns of reliability for most survey measures. Indeed, one recent discussion of reliability estimation in surveys even suggested: "we know of no study using a general population survey that has attempted to estimate the reliabilities of items of the types typically used in survey research" (Bohrnstedt et al., 1987:171). While these authors show little awareness of the existing literature on reliability estimation in surveys (cited above), they are correct in their general outlook concerning the relative lack of such information.
The importance of studying reliability of measurement
The study of the reliability of responses given to survey questions is important for several reasons. First, it is important to know to wh~t extent the variation observed in survey responses is "true" vs. "error" variation. In other words, the extent of randomness of response is a meaningful quantity to estimate, especially within the framework of evaluating the quality of survey data. Second, random measurement error is known to inflate response variance, and to the extent response variance estimates are biased, so will be statistical estimates based on them. For example, the well-known sample estimator of the standard error of the mean is upwardly biased by random measurement error, indicating a conservative bias in simple tests of differences of means (see Cleary et al., 1970). 1 Third, another consequence of random measurement errors is that correlations with other variables are attenuated. It is well-known that reliability is a
1 It is interesting to note that standard discussions of sampling and estimation of population parameters from samples in the social sciences often neglect to point this out.

280 D.F. Alwin
necessary condition for empirical validity, in that the correlation of a given variable with another cannot exceed the index of reliability of either variable.2 Thus, in this sense, the reliability of responses to a particular survey question sets an upper limit on the magnitude of observed correlations with other variables (Lord and Novick, 1968: 161). And, finally, for these same reasons, unreliability of measurement biases estimates of regression relationships among variables and makes inferences of relative importance of variables somewhat risky, especially when measures of variables differ significantly in levels of reliability (see Bohrnstedt and Carter, 1971).
Design strategies for reliability estimation
The estimation of measurement reliability is not straightforward, and there is a virtual absence of discussion in the survey methods literature of the .. problems of designing measurement strategies in such a way that useful estimates of reliability can be obtained.3 Two general design strategies have been employed, both of which require a within-subjects design: (1) the use of similar measures in cross-sectional studies, and (2) the use of replicate measures in panel designs.
The application of either one of these design strategies is problematic, and in some cases the estimation procedures used require assumptions that are inappropriate. Estimation of reliability in cross-sectional surveys is especially difficult, owing to the virtual impossibility of replicating questions within the same interview. Also, the covariance among similar questions is affected by their similarity in measurement format (wording, response scales etc.) and proximity in time and space. Estimation of reliability in panel designs is also difficult because of the potentially biasing effects of memory and because of the need to deal with the possibility of true change. The use of such data is particularly problematic when the phenomenon under study is not in dynamic equilibrium, that is, when the true variances are not homogeneous over time.
The following discussion focuses on problems of reliability estimation - in both cross-sectional and panel designs - within the framework of a model of components of survey response errors. I argue that without a model for interpreting the estimates of reliability, or other components of variation in
2 The index of reliability is defined as the square root of reliability (see Lord and Novick, 1968). 3 The report by Marquis and Marquis (1977) represents an important exception to this.

Reliability of survey data 281
survey response, reliability estimation and the decomposition of variance using related structural equation techniques are likely to generate large amounts of meaningless numbers. I turn now to a discussion of a model for understanding components of survey error and a more formal discussion of the concept of reliability and its estimation in surveys. Subsequent to that discussion, I present estimates of reliability for several types of survey measures, and evaluate the various features of these designs for optimal reliability estimation.
3. Components of survey error
The literature on survey response errors suggests that variation in responses to a survey question at time t can be usefully conceptualized as containing the following five components:
1. The true variable being measured, or r,.4
2. Constant measurement properties of questions, possibly due to the influence of question wording, form or context, denoted JL1 •
5
3. Errors of conceptualization and/or operationalization, i.e. other stable constructs that are measured by the question, represented by T'/t· For present purposes we represent a single such stable construct, as 711 ,
although in truth we should perhaps think in terms of a vector of such variates.
4. Measurement errors that are random, denoted E1 •
5. Measurement errors that are random with respect to r,, but correlated with measurement errors on separate occasions of measurement. Such type of measurement error may be thought of as a stable component of error, one which is correlated over time, represented as u,. 6
Thus, a given survey question, y, with response categories Yt. Y2 ... y"
4 In the present treatment we define true scores in the manner of psychometric theory, as the expected value of the propensity distribution of the observed variable for a fixed person (Lord and Novick, 1968:30). 5 Technically, constant errors are not part of the variation in a particular survey question. These errors affect the central tendency or mean of the response distribution. Of course, the model allows for the possibility that some question form, wording, or context effects may vary depending upon other variables assessed by y, in which case the !L term does not adequately represent such effects. In such cases, the effects of question bias are contained in the 1J and u terms. 6 One such an example of within-time random errors that may be correlated over time is memory or the conscious motivation to be consistent with previous responses (see Moser and Kalton, 1972:353).
282 D.F. Alwin
may be conceived as a function of the following components,
y=1L+T+71+v+e, (1)
where the IL term represents the constant errors, or bias, and the remaining terms are sources of variation.7
The variance of y may, thus, be written as:
Both v and e are random with respect to all of the other components and are, thus, difficult to separate from one another. Owing to this difficulty, for later purposes we consider their combined influences, and I treat them together, i.e. 8 = v + e, and u~ = u~ + u:. Further, it is possible that T and 71 are correlated, but for present purposes it is assumed that they are not. It is in the nature of 71 that we have difficulty separating it from T and v, and thus, we make the arbitrary decision that to the extent errors of measurement are correlated with T, they are included (however invalid) with T, and to the extent they are uncorrelated with T, they are included in either the 71, v or e terms. In actuality, our ability to separate these components will depend intimately on the nature of the design used to estimate their contribution to response variation.
As will be shown below, it is frequently the case that in order to identify sources of variability in survey response due to factors in 71, it is necessary to assume 71 is uncorrelated with T. In addition, since both v and e are also uncorrelated with T, and with each other, it is difficult to separate these three components. This is a major threat to classical true-score theory and an important obstacle to the interpretation of reliability estimates, since variation of factors represented by the 71 component are presumably reliable sources of variation. The use of inappropriate designs to estimate components of error variance will typically over-estimate the random error component, to the extent that it includes factors in 71· ·
Heise and Bohrnstedt (1970) introduce the terms validity and invalidity to refer to the factors in T and 71 respectively, and this may have some
7 For present purposes I have dropped the subscript t, which denotes time of measurement. Suffice it to say at this point, that except for p, and E, all of the components of survey response may be correlated over time.

Reliability of survey data 283
utility here.8 In this sense, both valid and invalid variation in y are reliable. Estimates of reliable variance often do not make explicit the components of variation that are thought to be nonrandom, and to the extent such nonrandom components are inadvertently included in the 'error' term, reliability interpretations may be inappropriate. I return to a discussion of these issues later in the paper.
Between- vs. within-subjects designs
One traditional approach to the study of survey 'response errors' is the use of classical randomized experimental designs. In such research two or more forms (or ballots) are devised which are hypothesized to evoke different responses in a given population. These forms are then randomly assigned to members of the sample and the 'effects' of different questions or 'methods' are studied by examining differences in the marginal distributions or the covariance properties of those distributions (see e.g. Schuman and Presser, 1981; Krosnick and Alwin, 1987).
This approach is useful for examining the constant errors or biases linked to a particular method or question form, as indicated in the previous discussion of components of survey error, but it provides little assistance in assessing components of response variation, whether random or systematic. By contrast, the psychometric approach to measurement error requires replication of measurement within subjects, so that covariances among measures can be identified. The following discussion and empirical exam-
8 In some important ways the use of the terms "validity" and "invalidity" to refer to components of reliable variation is unfortunate. Whereas the term validity refers to what one is measuring, reliability refers to how well it is being measured. Therefore, to define validity as a component of reliability is potentially misleading, since reliable measurement does not necessarily imply valid measurement. While it is true, as indicated above, that the index of reliability does place an upper limit on criterion validity, that is, the extent to which a measure may correlate with a theoretically-defined criterion, it is illogical to reverse the implication. Such confusion about the appropriate use of the term "validity" has led some authors (e.g. Bohrnstedt, 1983) to refer to univocal indicators (indicators presumed to measure one and only one thing) as 'perfectly valid' because they are tied to one theoretical latent variable. This is an unfortunate confusion of terms, since such a latent variable, however reliably measured, may not actually represent the theoretical construct of interest (see Alwin, 1989c). In any event, while we accept the distinction suggested by Heise and Bohrnstedt (1970) as a way of depicting multiple sources of reliable variation, we believe that the terms "validity" and "invalidity" should be used with great caution in such a context. In short, it would be a grave error to conclude that, since a high proportion of the reliable variance might be due to what appears to be "trait" variation, this necessitates the conclusion that one's measurement is valid. This would amount to a confusion of validity with reliability.

284 D.F. Alwin
pies rely solely on within-subjects designs, although it is a simple step to generalize the present set of results to the case where within-subjects designs are nested within several experimental conditions.
For example, let the following be the representation of the above model (see eq. 1) for the gth experimental group:
(2)
From this it may be seen that within this more general framework it is possible to compare components of response variance across subgroups or experimental conditions. In the following discussion of an approach to the decomposition of variance (section 4). I point out how such between-group designs may be implemented within the context of studying components of survey error.
An alternative strategy
For present purposes I abandon the potential between-groups ~pecification, for a somewhat less rigorous quasi-experimental approach. 'Rather than experimentally varying the· properties of survey questions between survey respondents, I examine their variability in affecting the properties of the variance components models examined here. It is important to recognize the role of aspects of the survey measurement process within a multivariate framework, and the limitations of the experimental or split-ballot approach for this purpose should be clear. To the extent that sources of survey errors tied to the nature of the population, the nature of the observational design, or the format of the questions can be linked de facto to systematic variation in the properties of the psychometric models specified here, then it is possible to study the role of factors hypothesized to generate errors, whether random or systematic, without employing the classical experimental approach.
4. Reliability estimation and the decomposition of variance
As noted above, the concept of reliability is derived from classical true score theory (Lord and Novick, 1968). Here I apply this psychometric concept to the assessment of the extent of random errors in survey responses. Although I take the concept of reliability to be useful for the evaluation of survey responses, its application in survey research is often difficult, and in some cases the estimation procedures used require assumptions that are inap-

Reliability of survey data 285
propriate. Estimation of reliability in cross-sectional surveys is especially difficult, owing to the impossibility of replicating questions within the same interview. On the other hand, while the use of reinterview or panel designs permits the exact replication of questions over occasions of measurement, such approaches create other kinds of problems, which must be addressed.
The psychometric conception of reliability differs from other, perhaps more popular usages of the term. In industry, for example, the term is often used to refer to the absence of 'inadvertent, unintentional human actions' that 'exceed some limit of acceptability or appropriateness in work performance' (Miller and Swain, 1987:220-21). The term is frequently used in social research to refer to the absolute agreement between measures or codes (e.g. Krippendorff, 1970).
The psychometric definition of reliability is both more and less restrictive than these other conceptions. It refers essentially to correlational consistency of response, independent of true individual change. Thus, it is limited to random errors, rather than to all such errors, and in this sense is more restrictive than other conceptions of measurement precision. It is less restrictive than ideas of reliability that rely on the idea of 'absolute' consistency or agreement, in that psychometric reliability theory requires neither a zero intercept in the regression relationships of true scores of multiple measures, nor the identical scaling of the two measures. Reliability, thus, refers to the normed linear relationship between two attempts to measure the same thing (Lord and Novick, 1968).<)
According to classical true score theory, an observed score is a function of a true score and a random error score, i.e. y == T + E, in a population of individuals for whom the random error model holds (Lord and Novick, 1968:32-34). Under conditions of random error in the measures, the covariance between two or more attempts to measure the same thing reflects true score variance, whereas the variance of replicate measures contain both true variance and random error variance. Reliability is defined as the squared correlation between the observed and true scores, p;, which is equal to the ratio of true-score variance to observed score variance, u;.Ju;. Because these are estimated population quantities, reliability is clearly a characteristic of a population of persons. However, it is also the case that the amount of measurement error may be affected by the measuring instrument, that is, by those aspects of data collection that depend not on the population being measured, but on the characteristics of survey questions.
9 In this sense classical true score theory is less restrictive than is sometimes suggested (e.g. Bohrnstedt, 1970; Zeller and Carmines, 1980).

286 D.F. Alwin
Reliability analysis based on classical true score theory (see Lord and Novick, 1968; Joreskog, 1971) may be thought of as a form of covariance structure analysis (see Bock and Bargmann, 1966). That is, reliability analysis may be viewed as an approach to decomposing components of variance and covariance in terms of a set of model parameters, expressing sources of reliable and unreliable variance. Two general approaches have been suggested for the estimation of the proportion of response variance which is true (or reliable) variance, i.e. u~tu;: using (a) cross-sectional and (b) panel designs. As indicated above, the first, the use of cross-sectional data, requires the implementation of the same, or very similar questions, within the same survey. The second, requires the repetition of the identical question in a reinterview survey.
Reliability estimaJion - cross-sectional designs
Cross-section designs are only infrequently used to assess the reliability of single survey questions, since it is virtually impossible to ask the same question more than once in a survey interview. Cross-sectional designs more often ask many different questions, similar in content, that are aimed at providing data for the purpose of creating composite variables or scales, for which reliability information is sought (see Greene and Carmines, 1979). However, composite score reliability is a function of the reliability of individual survey items or questions, and it is, thus, highly important to evaluate the factors affecting the reliability of responses to single survey questions.
Nonetheless, previous efforts have been made to estimate measurement reliability using cross-sectional designs (see Alwin and Jackson, 1979). Such designs require relatively strong assumptions regarding components of variation in the measures. Specifically, reliability estimation for individual items in this case requires multiple questions that measure the same construct. This means measures must be univocal, that is, their latent content must be limited to a single construct, and such sets of survey questions must be congeneric, that is, their true scores must be perfectly correlated (Joreskog, 1971). In other words, such questions must be able to be accounted for, within sampling error, by a single common factor.
In cross-sectional survey designs, one source of departure from this is what Campbell and Fiske (1959) referred to as method variance, error or bias that is correlated over similar measures because of their common wording or response scale (see Alwin, 1974; Andrews, 1984). Given this constancy of format, and given the often-practiced strategy of including

Reliability of survey data 287
questions as a part of a series of questions, the similarity of method promotes response sets, rating biases, or halo effects that mcrease the correlation of survey questions (see Alwin and Krosnick, 1985). Thus, some of the common reliable variance among survey questions is spuriously due to method factors and it may not be intended that it be counted as true variance. As I illustrate in the subsequent ,discussion, it is possible to address these problems through the use of structural equation models designed to incorporate method variance common to one or more questions from distinct domains of content but having common question wording or response formats (Alwin, 1974; Andrews, 1984; Andrews and Herzog, 1986). However, even in this situation the interpretation of the reliability of measurement is ambiguous.
Further, in cross-section survey designs, it is unlikely that measures can actually use the same, or very similar questions, since this often tries the patience of even the most willing of respondents; and thus, by necessity, questions included for reliability analysis are likely to be somewhat more factorially complex than is desirable. And finally, these models assume that the error term contains only measurement error and no reliable variation specific to a particular question (see Alwin and Jackson, 1979).
Classical estimation strategies
Suppose that for purposes of estimating the reliability of the measurement of multiple indicators in cross-sectional design we are able to assume a true-score model can be applied to the covariance structure of these measures. That is, suppose we are willing to assume a linear structure of relationships between measures and the latent variable, that is, y; = T; + E;;
that the error terms contain only measurement error and not reliable variance specific to the indicator; and that the error parts are uncorrelated with the true scores, that is, errors are strictly random. If we also assume that the true scores of two independent measurements of the same thing are linearly related, i.e. T; = /-Lii + A;1-r1, then it is a straightforward task to define a coefficient of reliability of measurement for each of a minimum of three measures. Previous work provides specific information regarding the design requirements for various reliability models (see Joreskog, 1971; Alwin and Jackson, 1979).
If we were able to assume further that there is tau-equivalence of true scores, that is, T; = -r1 = T, then it is an even simpler task to define a coefficient of reliability of measurement for each of the measures. Since, under this model the covariance of two measures of the same thing, o-;1,

288 D.F. Alwin
equals the true variance, u;, and the reliabilities of the measures Yi and Y; _ 21 2 _ I 2 d _ 21 2 _ I 2 • 1 to are Pii - u .. u Y• - u y,y1 u Y• an Pii - u .. u y1 - u y,y1 u y1 respective y.
Of course, if these assumptions are not met, reliability estimates for survey questions will be difficult to interpret. It will not be clear from the estimates themselves whether other forms of common variance in the questions are included in the estimates of true variance, or whether other types of random disturbance, i.e. other than random measurement error, are included in the estimates of e"or variance. However, these problems are compounded when cross-sectional data are used to estimate the reliability of composite variables (Greene and Carmines, 1979). The reliability of composites is, of course, a function of the reliability of the individual questions that form their basis, and while such composite indices are clearly valuable in exploratory research, one should, for the reasons given here, be somewhat cautious about the interpretation of composite reliability estimates.
Problems with classical true score theory
As noted in the foregoing, in order to estimate reliabilities for sets of measures of particular concepts using the classical true score model it is necessary to make several critical assumptions in order for the model to apply. In addition to assuming that measurement error is random, which is clearly not robust, even more importantly, it is assumed that measures are univocal, that is, that they measure one and only one thing. This assumption is probably incorrect for cross-sectional data, since it is likely that measures have more than one latent variable or factor in common. Indeed, as Campbell and Fiske (1959) argued some time ago, in addition to measuring traits in common, measures also share certain methods in common. Thus, measures covary both because of common trait variation and common method variation, and the interpretation of covariation of measures as if it were due entirely to univocity of measurement is likely to be erroneous.
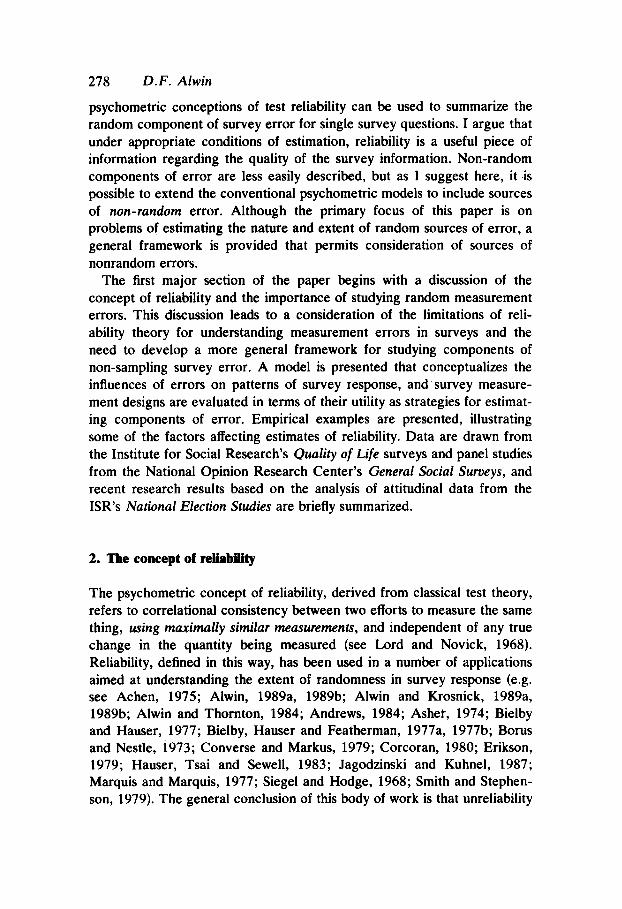
This situation can be depicted as in the model displayed in Figure 1. Two models are shown here for three measures. In Figure 1(a) the three measures are depicted as congeneric, in that their true scores are perfectly
10 If it were also true that the variances of the errors of measurement are equal, that is, if the variables are parallel measures, then the two reliabilities would be equal and expressable in terms of the correlation between them, namely p11• The proof that the correlations among parallel measures equal their reliability is available in Lord and Novick (1968:47-50). In either case, by assuming certain properties of the measures it is possible to extract information from the data which allow'one to obtain estimates of reliability. More general formulas are available for the congeneric measurement model (see Joreskog, 1971).
Reliability of survey data 289
e:l E2
13 ! L yl y2 y3
Fig. Ia.
Fig. lb.

290 D.F. Alwin
correlated. In the model depicted in Figure l(b), this property does not hold. Here the true scores for the several measures are not congeneric, that is, they are not perfectly correlated. In other words, there are disturbances in the equations linking the true scores. In the language of the common factor analysis model, these measures involve more than one factor. Each involves a specific factor, that is, a reliable portion of variance which is independent of the common factor. 11
David Jackson and I have argued in this regard (see Alwin and Jackson, 1979) that, unless one can assume measures are univocal, or build a more complex array of common factors into the model, measurement error variance will be over-estimated, and item reliability under-estimated. This can be seen by noting that the random error components included in the disturbance of the measurement model in Figure l(b) contain both random measurement error and specific variance. Thus, if a single-factor model does not fit a set of items intended to measure the same concept, it is unlikely that the disturbance variances will simply estimate unreliability in a straightforward way.
Biases in reliability estimation in cross-sectional designs
For purposes of illustration, let us assume that any given survey measure has three components of variation, as follows: (a) a true score, representing the trait or latent variable being measured, (b) a systematic component, due to the method characteristics associated with the question, and (c) a random error component. Let y1i represent a measure assessing trait T; with method characteristics TJi> and random error 81i, such that
If it were possible to replicate a particular y1i within the framework of a cross-sectional design in such a way that the replicate measure were unaffected by memory or consistency motivation, then the product-moment correlation between the two measures would provide the basis for reliability estimation. In such a case the reliability of measure y,i would assess the consistency of jointly measuring T1 and Tli· In this case the product-moment
11 Of course, if these specific components are themselves correlated, there is a basis for a second common factor. 12 Note that the subscript index i varies over traits or concepts measured and the subscript index j varies over the methods used to assess these traits. Thus, the error term is indexed by both subscript~

Reliability of suroey data 291
correlation would express the following ratio:
Pu.tt = CTu,u/ ui t
= (u~, + u~,)/uit
which equals the reliability of measurement. The components of these elements are shown in Chart 1 under case (a).
This example shows that it is only when one assumes a measure is univocal does the reliability estimate provide an unambiguous interpretation of components of variance. In this case one is forced to ignore the distinction between the two "reliable" components, namely T and 1J, thinking of reliability expressing consistency of measurement, regardless of what is being measured. While this is entirely possible, and perhaps desirable, it should be emphasized that classical true score theory does not assist in understanding this problem, since it assumes measures are univocal. In other words, it is only if one recognizes that what is being assessed in such a case is the reliability of the sum, T; + Tli, is a reliability interpretation appropriate. .
Of course, the above example is unrealistic in any event because it assumes something that is impractical, namely the replication of a particular measure in a cross-sectional design. Such applications are very rare. It is more commonly the case that either: (1) the same trait is assessed using a different method (e.g. a rating scale format with a different number of scale points); (2) a similar, but distinct, trait is assessed using a question with identical method characteristics (e.g. a rating scale format with the same
Chart I. Decomposition of variance/covariance for measures involving combinations of traits and methods
Common method
Different method
Common trait
Case (a) Ytl = Tt + 711 + 1>,,
Ytt = Tt + 71t + 1>,,
ui 1 = u;, + u~, + ui ..
u,,,,, = u;, + u~,
Case (b) Yll = Tt + 71t + 1)11
Yt2 = Tt + 712 + 1>,2
u~ 1 = u;, + u~, + ui .. u~2 = u;, + 0'~2 + uiu tTJt,l2 = u;.
Different trait
Case (c) Yll = Tt + 71t + 1)11
Y2t = T2 + 71t + ~. ui1 = u;, + u~, + ui11
ui, = u;,; + u~, + ui2 ,
0'11,21 = Q' TI,Tl + Q'~l
Case (d) Ytt = Tt + 71t + 1>,,
Y22 = T2 + 712 + ~2 ui 1 = u;, + u~, + ui11
uh = u;, + u~ + ui22
O'tt.22 = u.,..T2

292 D.F. Alwin
number of scale points), or (3) a similar, but distinct, trait is assessed using a question with a different method. These possibilities are depicted as Cases (b), (c) and (d) respectively in Chart 1.
In any one of these additional cases, it might be assumed that the product-moment correlation between the relevant measures expresses the reliability of measurement. This is not necessarily the case. The facts of the matter are given in Chart 1, where I present the components of variance/covariance for each of these logical combinations of two measures varying in commonality of trait and method.
As the evidence in Chart 1 illustrates, there is considerable variability in what might be treated as the estimate of the 'true' variance, if the product-moment correlation between the two measures in each case is used to estimate reliability. Obviously, the only case in which the covariance between the two measures is an estimate of reliable variance is case (a), where the measures are true replicates. All other cases in Chart 1 are merely an approximation. What is needed is an extension of the basic model, as well as an appropriate measurement design, that permits the estimation of these various components of variance and covariance. It is to such a model that I now turn.
Extensions of the classical model
If a congeneric model is judged to be inappropriate for a given set of measurements, either because of lack of fit to the data, or for theoretical reasons, it is possible to extend the classical model to include additional sources of variation which represent additional common factors of the measures. One approach to this is to complicate the model by introducing common factors that represent nonrandom errors of measurement (see Alwin, 1974; Alwin and Jackson, 1979).
It is well-known, for example, that rating scales, which are used quite frequently in surveys, are susceptible to response style or response sets (Berg, 1966; Block, 1965; Phillips, 1973; Alwin and Krosnick, 1985). If rating scales all utilize the identical set of response categories, then according to the reasoning employed here, the measures share covariation due to method similarity, and this needs to be addressed in their interpretation. Individuals may differ in their use of rating scales, such that ratings tend to fall within a rather restricted range of the available scale points (Feather, 1973). The particular center or anchor-point of an individual's ratings may be due to extremity response style (Hamilton, 1968), individual interpretations of the meaning of judgement categories (Cronbach, 1946, 1950; Messick, 1968), or group response sets (Cunningham et al., 1977). Varia-
Reliability of survey data 293
tions across persons in such response tendencies lead to correlated response patterns, or what Costner (1969) referred to as differential bias, producing spuriously positive correlations among measures due to the common method of measurement (Campbell and Fiske, 1959; Alwin, 1974).
The multitrait-multimethod design in cross-sectional studies
One method that has been proposed for obtaining improved information on the interpretation of the reliability of measurement is based on Campbell and Fiske's (1959) multitrait-multimethod matrix. This approach, summarized by Alwin (1974) and Werts et al. (1974), augments a basic assumption of classical true-score theory, by positing two sources of 'true' variation in each measure, one representing trait variation and one representing method variation. This model, attributable to Werts and Linn (1970) and Joreskog (1971 ), has been applied systematically to survey data in only a limited number of cases (e.g. Andrews, 1984; Andrews and Herzog, 1986; Rodgers and Herzog, 1987a, 1987b).
Given the above model for the components of variation in the survey response, it is possible to specify the components of variance in a given measure due to (1) true variation in the variables being measured, (2) systematic error variation due to characteristics of the method of measurement, and (3) random error variation. The general model I specify also makes it possible to compare variable means and variance components across experimental groups (e.g. across modes of administration of question forms or interviewing techniques), although for present purposes of estimating components of reliability, I do not here exploit the full potential of this general model. This model in somewhat more restricted form has been previously discussed by Joreskog (1971, 1974, 1978), Werts and Linn (1970), and Alwin (1974).
This model for estimating variance components in the cross-sectional design specifies multiple measures of each of multiple concepts. With multiple measures of the same concept, as well as different concepts measured by the same method, it is possible to formulate a multitraitmultimethod model. For example, concepts x, y, and z, measured by two different forms of question, methods a and b, is a possible configuration of measures. Such a model is depicted in diagram form in Figure 2. In general, the measurement of n traits measured by each of m methods for each of g groups or subpopulations, allows the specification of such a model (Alwin, 1974).
This design requires m measures of each of n traits, such that the number of variables, p equals the product of m and n. It is also possible to specify

294 D.F. Alwin
Fig. 2. A multitrait-multimethod model for six observed variables.
this model where there is just a single method used, i.e. m = 1. This corresponds to the classical true score model for several sets of congeneric tests (see Joreskog, 1971, 197 4, 1979). It corresponds to the type of model commonly used in reliability analysis. Thus, it will be seen that traditional forms of reliability analysis can be expressed as a special case of this model. It will be argued, however, that when method variance is ignored, these traditional approaches to reliability will obtain biased estimation of the amount of random measurement error variance.
In the model for this design I have also specified g experimental groups, so it is possible to model properties of the distributions (e.g. arithmetic means) produced by experimental manipulations. In this way, the present design for methodological experimentation is much more general than those previously applied to survey methods effects analysis (e.g. Schuman and Presser, 1981). The present model allows the additional investigation of latent variables and the covariation of multiple measures of the same thing. The exclusive focus on the marginals or the means of the distributions of experimental manipulations, as in the standard "split-ballot" approach (e.g. Schumann and Presser, 1981), is just a special case of this more general model. And, given the difficulty of adequately specifying social science concepts in terms of just a single survey question, it seems relatively short-sighted to ignore other aspects of this more general model. For

Reliability of survey data 295
example, as I have argued above, the reliability of measurement is a very important aspect of survey measurement, and the experimentally split-ballot approach does not explicitly include such a parameter. In addition, the split-ballot approach typically examines a single survey question at a time (e.g. Schuman and Presser, 1981), ignoring the regression relationships among measured variables within the same survey. 13
Components of variance I covariance
Consider the following representation of variation in an observed score, y~, where the superscript g refers to the population or experimental group to which the model applies, subscript i refers to the latent variable being measured, and the subscript j refers to the particular source of method variation in the measure:
g g g ~g
Yii = T; + 11i + Dij·
Here Tf and 11f are latent variables in subpopulation g, where the T
notation represents trait variation and 11 is used to represent nonrandom error variation associated with jth method of measurement; and 8;i
represents random error variation. Note that in terms of the above development 8 contains only within-time random error. Any such error that is correlated over-time is included in this component. Thus, 8;i = llui + E;i,
and 8 approximates e only when u;i is virtually non-existent. 14
As a matter of convenience, I henceforth drop the gth notation, since, given the focus of the present discussion on reliability and variance decomposition, dropping the g-notation will permit a somewhat more flexible presentation. And, although it is possible to estimate such models simultaneously (e.g. see Alwin, 1985, 1988), I do not do so here. Suffice it to say, however, that this represents a straightforward application of the present design, which I illustrate below. However, because the group means are no longer part of the model, the latent or unmeasured variables in this model, T, 11· and 8, are treated as centered variables, i.e. the expected value in the population is zero for these variables, E( T) = E( 11) = E( 8) = 0. Also,
13 11 should be pointed out that the 'experimental' groups referred to in the foregoing can be 'nonexperimental' groups in the sense that membership need not be experimentally assigned. Group status may be designated on the basis of naturally observed partitions in the data, for example, age groups or categories of amount of schooling. 14 It is possible to represent this model in matrix notation for a vector of measured variables assessed in the gth group (see Alwin, 1988), but to simplify matters I present the model in scalar form here.

296 D.F. Alwin
in accord with the assumptions of classical true score theory, we also assume that the disturbances are uncorrelated with one another within-time and with the latent variables.
Given the above model, it can be shown that the observed variance of a particular measure Yii may be written as:
2_ 2+ 2+ 2 u;i- uT, u.,J uiJ,J·
Here u;, represents the true variance in the variable being measured, u~1 reflects the variance due to the method of measurement, and u~,1 is the estimate of the random error variance. As I pointed out before, this component of variance contains errors that are random within-time, but which might be correlated over time. Thus, the u~,1 component contains both u~,1 and u;,r
In order to illustrate the characteristics of this model, I here provide a hypothetical example for four measures Yii in which two pairs of measures share a common s-ource of nonrandom measurement error variation. In equation form, the measurement model for these measures may be summarized as follows:
The variances and covariances of these four measures may be written as:
- 2 O'JJ,J2- 0' Tt

Reliability of survey data 297
<J"t2,2\ = (J" TtT2
It is possible to identify the parameters of this particular model, if it is assumed that trait and method factors are uncorrelated, and if the two method factors are uncorrelated. The latter assumption is not necessary in general, but it is necessary here. 15 The analysis of this covariance structure, within the framew~rk of the general LISREL or confirmatory factor analysis framework, can be carried out in such manner to provide estimates of the model parameters (Joreskog and Sobom, 1986).16 These estimates can then be used to partition the variance of each measure into the components given above. An example of such results are given in a subsequent part of the paper.
Reliability estimation - reinterview designs
As noted earlier, a second approach to the estimation of reliability of survey data uses a reinterview or panel design. Such designs also have several problematic features. The test-retest approach using a single reinterview must assume that there is no change in the underlying trait being measured (Lord and Novick, 1968; Siegel and Hodge, 1968). This is problematic in many situations, since with two waves of a panel survey, the assumption of perfect (correlational) stability is unrealistic, and little purchase can be made on the question of reliability in designs involving two waves without this assumption. 17 Because of the problematic nature of this assumption, several efforts have been made to analyze panel surveys involving three waves, where reliability can be estimated under certain assumptions about
15 See Alwin (1974) for a detailed discussion of the conditions under which the multitraitmultimethod model is identified. 16 It should be pointed out that the MTMM model can also be estimated by specifying only n latent variables, where each latent variable is indicated by m measures. Then the method covariance component can be added to the model by allowing the disturbances on the measures with. a common method of measurement to be correlated (see Alwin and Jackson, 1979). 17 In such cases the correlation can be estimated under a tau-equivalent measurement model (see above).

298 D.F. Alwin
the properties of the error distributions (Erikson, 1978; Heise, 1969; Wiley and Wiley, 1970; Werts et al., 1971; Alwin, 1973, 1976; Wheaton et al., 1977).
Estimation of reliability from panel surveys makes sense only if the occasions of measurement are of sufficient distance in time to make it unlikely that memory might produce bias. In such cases, where the remeasurement interval is too close to permit appropriate estimation of the reliability of response, the estimate of the amount of true stability in response will be biased. In such a case the measures may appear to be more reliable than is in fact the case. This issue can be assessed by comparing reliability estimates obtained from panel studies varying in the length of the reinterview period. 18
One type of model that is useful in estimating reliability with respect to a single variable measured at several timepoints falls under a rubric of simplex models (Joreskog, 1970, 197 4 ). Such models are characterized by a series of measures of the same variable separated in time, positing a Markovian (lag-1) process to account for change and stability in the underlying latent variable. This type of model has been useful in analyzing reliability of survey reinterview measures, since it does so by controlling for true change in the underlying variable. Because I utilize these models here to estimate reliability of single survey questions, as above, I consider them in some depth.
Such models can be partitioned into two parts: (a) a measurement model linking measures and the latent variables, and (b) a causal model relating latent variables, in this case a single latent variable experiencing change over time. The measurement model may be represented in scalar true-score form as:
Yi = T;+E;
where the i subscript refers to the time of observation (i = 1 ... t) and all E;
are independent of each other and of all T; •19 Joreskog (1970) indi~ates that
the simplex form relating the latent variables can be represented in scalar
18 Unless one knows the sign of the covariance among the errors over occasions of measurement, it is not possible to predict the nature of the bias. Our experience however, indicates that over shorter time intervals, reliability is estimated to be higher than over longer time intervals, suggesting that memory or consistency effects produce an upward bias in reliability (see Alwin and Krosnick, 1989b). 19 The true score, 7';. in this model may contain both trait and method components, as discussed above with respect to cross-sectional designs. In this sense, the reinterview approach is inferior to the multitrait-multimethod design.
Reliability of survey data 299
form as:
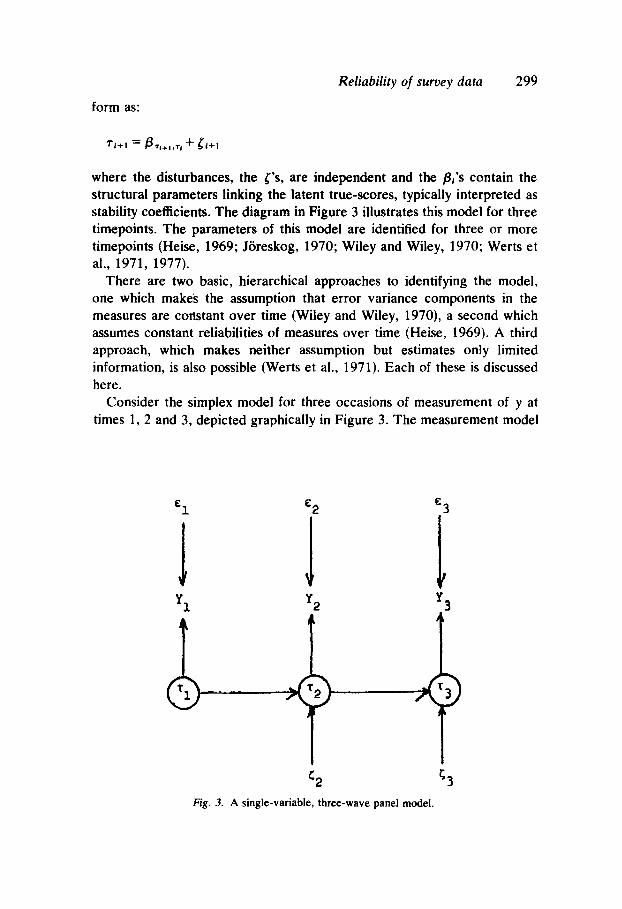
where the disturbances, the {'s, are independent and the {3; 's contain the structural parameters linking the latent true-scores, typically interpreted as stability coefficients. The diagram in Figure 3 illustrates this model for three timepoints. The parameters of this model are identified for three or more timepoints (Heise, 1969; Joreskog, 1970; Wiley and Wiley, 1970; Werts et al., 1971, 1977).
There are two basic, hierarchical approaches to identifying the model, one which makes the assumption that error variance components in the measures are cortstant over time (Wiley and Wiley, 1970), a second which assumes constant reliabilities of measures over time (Heise, 1969). A third approach, which makes neither assumption but estimates only limited information, is also possible (Werts et at., 1971). Each of these is discussed here.
Consider the simplex model for three occasions of measurement of y at times 1, 2 and 3, depicted graphically in Figure 3. The measurement model
l
Fig. 3. A single-variable, three-wave panel model.

300 D.F. Alwin
linking the true observed scores is given in scalar form as:
Yt = Tt + Et
(1)
and the structural equation model linking the true scores at the three occasions is given in scalar form as:
(2)
Given this statement of the model for the true scores, it is possible to write the reduced-form of the measurement model as follows:
Yt = (t + Et
(3)
With this set of equations in hand, it is possible to write the variances and covariances of the model in terms of the parameters that compose them. These quantities are as follows:
2- 2 + (T2 Ut - (T '' 01
- IJ. 2 u12- /J2tu,,
(4)

Reliability of survey data 301
(4)
Since the true scores and errors of measurement are independent, the variances of the observed scores may be expressed as the sum of the true and error variances, that is, u;, = u;, + u;,. In the above expressions of the variances of y2 and y3 we have expanded the equations for u;2 and u;
3 in
terms of the parameters in the true-score structural equation model. Wiley and Wiley (1970) show that by invoking the assumption that the
measurement error variances are equal over occasions of measurement, this model is just-identified, and parameter estimates can be defined. They suggest that measurement error variance is "best conceived as a property of the measuring instrument itself and not of the population to which it is administered (p. 112)". Following this reasoning, one might expect that the properties of one's measuring instrument would be invariant over occasions of measurement and that such an assumption would be appropriate. The solution of the model's parameters under this assumption are as follows:
(5)
Following classical true score theory (Lord and Novick, 1968), the reliability of the observed score, Yi, is the ratio of true variance to the observed variance, that is, u;.fu;,, and this model permits the calculation of distinct reliabilities at each occasion of measurement using the above estimates of u;,. It is also possible to calculate standardized values for the stability parameters of this model, {323 and {332, by applying the appropriate ratios of standard deviations (see Wiley and Wiley, 1970: 115).
While the Wiley and Wiley approach to identifying the parameters of this model - the assumption of homogeneity of error variances over time -appears on the face of it to be a reasonable assumption, it is somewhat

302 D.F. Alwin
questionable in practice. Measurement error variance is a property both ofthe measuring device and the population to which it is applied. It may therefore be unrealistic to believe that it is invariant over occasions of measurement. If the true variance of a variable changes systematically over time because the population of interest is undergoing change, then the assumption of constant error variance necessitates a systematic change in the reliability of measurement over time, an eventuality that may not be plausible. For example, if the true variance of a variable increases with time, as is the case in many developmental processes, then, by definition, measurement reliability would decline over time. Thus, it seems that the Wiley-Wiley assumption requires a situation of dynamic equilibrium, one which may not be plausible in the analysis of developmental processes. Such a state of affairs is one in which the true variances are essentially homogeneous with respect to time. This situation is most likely to hold in the case of most attitude variables ...
Heise (1969) proposes a solution to identifying the parameters of this type of simplex model which avoids this problem, by assuming that reliability of measurement of y is homogeneous over time. Because of the way reliability is defined, as the ratio of true variance to observed variance, Heise's model amounts to the assumption of constant ratios of variances over time. This model is frequently considered unnecessarily restrictive, because it involves a stronger set of assumptions compared to the Wiley-Wiley model. However, it is often the case that it provides a more realistic fit to the data (see Alwin and Thornton, 1984; Alwin, 1988).
Heise's (1969) model is stated for the observed variables in standard form, which is an inherent property of the model. The model linking the true and observed scores is given as:
Yt = AtTt + Et
(6)
where the A; coefficients are defined as uT, I uy,, the square root of the ratio of true to observed variance. In other words, the model standardizes both observed and unobserved variables. This has the effect of discarding any potentially interesting differences in the observed variances of the measures over time. The structural equation model linking the true scores at the three occasions is identical to the set of equations in (2) above, except that all true and observed variables are in standard form. Following the same

Reliability of survey data 303
algebra used above to reproduce the variance/covariance structure for the observed variables (in this case a correlation matrix), we may write the correlations among the observed variables as follows:
(7)
Heise (1969:97) shows that by assuming an equivalence of the Acoefficients, the solution to the model's parameters is straightforward:
(8)
1T32 = P131 Ptz
where 1r21 and 1r32 are the standardized versions of the J3-coefficients in the above model. These coefficients are interpreted by Heise as stability coefficients, that is, the extent to which the variable at a later state is dependent upon the distribution of true scores at an earlier state. It is important to note that this model involves a lag-1 or Markovian assumption, that is, there is no direct effect of the true state of the unobserved variable at time 1 on its true state at time 3. Thus, the effect of Tt on T3 is simply given by the product 1T21 1r32 • Wiley and Wiley (1970:115) show that Heise's computation of the stability coefficients are expressable in terms of their model.
The third approach mentioned above to the problem of identifying the parameters of these simplex measurement models for multi-wave data takes a somewhat more conservative approach. This approach assumes neither that measurement error variance is constant over time, nor that reliability is constant. Werts, Joreskog, and Linn (1971; see also Werts, Linn, and Joreskog, 1977; and Joreskog, 1974) show that just-identified and overidentified models may be estimated for such panel data without such restrictions. If, for example, we were to consider the 3-wave problem discussed above somewhat differently, it would be possible to obtain some information about the reliability of measurement but very little about inter-temporal trait stability. Suppose we respecify the above model, shown in Figure 3, as a single-factor model in which the latent variable is the

304 D.F. Alwin
time-2 embodiment of the latent trait, as follows: 20
As indicated above, this model is not identifiable unless some form of constraint is introduced to give the latent variable a metric. Thus, here we let a 22 = 1.0. Then, it is possible to solve for the remaining parameters as follows:
Given these equations, it is then possible to solve for the a 12, a 32, and u'T2 parameters, and the error variances may be obtained residually from these quantities and the observed variances.
Note that in this model it is possible to estimate the reliability of the time-2 measure, as u;
2/u;
2• In fact, the three approaches discussed here all
agree on the estimate of the time-2 measure (see Werts eta!., 1971). It is just the outer measures of the model for which one must impose some constraint in order to estimate their reliabilities. If one is content to leave the reliability and stability parameters confounded for Yt and y3 it is quite straightforward to estimate the reliability of y2 • The utility of this set of observations is quite readily seen for multi-wave panel models in which more than three waves of data are available. Indeed, Joreskog (197 4) discusses the general case in which both reliability and stability parameters are identified for the inner variables in such a model.
Multiple measurement in panel designs
Several authors consider issues of parameter estimation in multi-wave models of this type, which incorporate variations in model specifications.
2o This statement of the model uses a-notation for the relevant regression coefficients in order to avoid confusion with notation used earlier in this section.

Reliability of survey data 305
Alwin (1973), Sorbom (1975), Hargens et al. (1976), Jagodzinski and Kiihnel (1987), Jagodzinski et al. (1987), Saris and van den Putte (1988), Joreskog (1977), and Werts et al. (1980) discuss the problems associated with incorporating multiple measures in univariate panel models. In some cases this opens the opportunity for incorporating correlations among errors in similar measures obtained on different occasions (e.g. see Sorbom, 1975; Campbell and Mutran, 1982; Bohrnstedt, 1983). Werts et al. (1981) and Werts et al. (1977) discuss the application of these simplex models to multiple populations.
Such models do assist considerably in accounting for correlations of measurement errors over time, but unless they include truly replicate measures in a given cross-section, or unless they incorporate a multitraitmultimethod design, they do not necessarily assist in the estimation of reliability. In any event, further consideration of these models is beyond the scope of the present paper. More experience with such designs is required before we will know their payoff for reliability estimation.
S. Empirical estimation: data and methods
In order to illustrate the estimation strategies associated with the basic cross-sectional and panel designs discussed above, and to discuss the problematic elements of these designs for these purposes, I present survey data from the Institute for Social Research's Quality of Life Surveys and from the National Opinion Research Center's General Social Surveys. I use the QoL survey carried out in 1978 (Campbell and Converse, 1980) to illustrate the decomposition of variance in cross-sectional designs. I use the GSS reinterview surveys carried out in 1973 and 1974 to estimate components of variance in panel designs. Also, I briefly summarize a study of factors affecting the reliability of attitude measurement, which analyzes data from several National Election Study panels (see Alwin and Krosnick, 1989b).
Samples and measures
The 1978 Quality of Life survey The 1978 QoL survey data consist of a probability sample (n = 3,692) of persons 18 years of age and older living in households (excluding those on military reservations) within the coterminous United States. Interviews were conducted during June through August 1978. The original sample of approximately 4,870 occupied housing units, comprised of two in-

306 D.F. Alwin
dependently chosen multi-stage area probability samples, was used to represent the noninstitutionalized adult population of the United States. The overall completion rate for the survey was approximately 76 percent. Sampling and other procedural details are given in Campbell and Converse (1980).
The design of this survey included multiple measures of several domains of life satisfaction. Seventeen domains of satisfaction were assessed: satisfaction with the respondent's community, neighborhood, place of residence (dwelling unit), life in the U.S. today, education received, present job (for those persons who were employed), being a housewife (for unemployed women), ways to spend spare time, personal health, family's present income, standard of living, savings and investments, friendships, marriage (for those married), family life, self as a person, and life as a whole. All of these measures were assessed in at least two ways, and three areas were rated on three separate scales: place of residence, standard of living, and life as a whole. Here I analyze the covariance structure of these three latter measures.21
The three methods used for assessing these three domains of satisfaction were: a 7-point 'satisfied:..dissatisfied' scale in which only the endpoints and midpoint were labeled, (b) a 7-point 'delighted-terrible' scale in which all seven categories were labeled for the respondent, and (c) a 101-point 'feeling thermometer' rating scale in which only the endpoints were labeled. The formats for these questions are given in Appendix A.
The General Social Survey reinterview data The GSS is an annual cross-sectional survey of the noninstitutionalized residential population of the continentia! United States aged 18 and over (NORC, 1988). It has been conducted nearly every year since 1972 on approximately 1,500 rt!spondents per year. The purpose of the GSS has been to monitor social trends in attitudes and behavior. The GSS does not ordinarily include a panel component, however, in 1972, 1973, 197 4, 1978, and 1987 such a design was included. In the 1973 and 197 4 reinterview studies, three waves were included, making it possible to estimate the components of variance discussed above (see Smith and Stephenson, 1979). In the 1973 study, the GSS attempted to reinterview a random subset of 315 respondents to the initial survey, of which 227 completed a second interview and 195 completed a third. In the 1974 study, attempts were made to reinterview 291 of the original GSS respondents, of which 210
21 See Alwin (1989a) for a more detailed examination of the compOnents of variation in the full set of satisfaction measures.

Reliability of survey data 307
were reinterviewed a second time, and 195 a third. I analyze the data from the 195 cases surviving each of the 1973 and 1974 studies, 62 and 67 percent of the original target samples respectively. The average intervals between the first and second waves of the 1973 study was 46.9 days, the average interval between the first and third waves was 80.2 days. In the 1974 study the average intervals between first and second waves was 46.4 and between the first and third 78.9 days. The initial GSS interviews were conducted face-to-face, and reinterviews were conducted by telephone (see Smith and Stephenson, 1979). The 1973 reinterview study included 44 questions that were common across all three waves, 23 of which we use here (see Appendix B). In 1974 19 questions were repeated in the second and third waves, 11 of which I use here.22
The National Election Study panels I also briefly describe the results obtained in an analysis of attitude measures currently in progress (see Alwin and Krosnick, 1989b). Every two years since 1952, the University of Michigan's Institute for Social Rese~rch has interviewed a representative cross-section of Americans to track national political participation. On the years of presidential elections, a sample is interviewed before the election and is reinterviewed immediately afterward. In the non-presidential election years only post-election surveys are conducted. Data are obtained from face-to-face interviews with national fullprobability sampl~s of all citizens of voting age in the continental United States, exclusive of military reservations, using the Survey Research Certter's multi-stage area sample (see Miller, Miller and Schneider, 1980).23 The sample sizes typically range between 1,500 and 2,000.
Of the respondents interviewed in 1956, 1,132 of them were reinterviewed in 1958 and again in 1960. The 1958 and 1960 panel questionnaires were the same as those used in the 1958 and 1960 cross-sections respectively. This design afforded only a small number of items that were replicated in all three studies. Of the respondents interviewed in 1972, 1,320 were successfully reinterviewed in 1974 and again in 1976. Again, the questionnaires for these reinterview surveys were the same as those used for the cross-sectional samples interviewed at those times. l_'he data from the 1970's panel design, however, yielded many more replicate attitude
22 Some of the GSS reinterview items were excluded from consideration because of extreme skewness in the marginal distributions. See Alwin (1989b) for a complete description of the details of this analysis> 23 There was no survey in 1954. In 1978 the primary sampling unit specifications were changed from SMSA's and counties to fit congressional district lines, but this change should have no appreciable effect on the representativeness of the full sample.
308 D.F. Alwin
questions. In the 1980 National Election Panel Study, 769 respondents were reinterviewed at roughly 4-month intervals, beginning in January and ending in November (see Markus, 1982).24
6. Factors aftecting the reliability of survey data
It is beyond the scope of the present paper to exhaustively consider sources of error in survey responses, and the factors affecting the reliability of survey data. However, in this section of the paper I organize the presentation of my results within this more general framework. At the beginning of this paper, I indicated that measurement or 'non-sampling' errors arise from several elements of the survey measurement process: (a) the characteristics of the population of interest, (b) the topic or topics which are the object of study, (c) the design of the questions, and (d) the conditions of measurement, referring to a broad category of design and implementation aspects of the study. In this section I briefly consider some aspects of each of these domains of error sources, based on the findings from our research regarding reliability estimation.
A. Population of the study
It is extremely important to recognize that since estimates of reliability depend upon estimated characteristics of the population under study, it is potentially a mistake to think of reliability estimates, or other components of variance, as the exclusive properties of 'measuring instruments' (cf. Achen, 1975; Wiley and Wiley, 1970). Consequently, if there are theoretical reasons to believe that populations, or subpopulations, differ in the variability of error due to their unique response patterns, then it is of interest to examine the extent to which estimates of reliability, or other estimated error components, may vary as a function of the characteristics of populations.
There is a wide array of population or subpopulation characteristics that may be linked to levels of reliability. Because of the nature of reporting answers to survey questions, I suspect that those characteristics linked to respondent motivation and cognitive ability are the most relevant. Two such variables that have been studied are (1) level of schooling and (2) age of respondent.
24 The details of the National Election Study panels, including the particular attitude questions upon which our present results are based, are given in Alwin and Krosnick (1989a, 1989b).

Reliability of survey data 309
Schooling Greater access to schooling in modern society requires and promotes greater cognitive abilities and verbal learning. School attendance also provides considerable practice with question-asking and question-answering and exposure to myriad tests and questionnaires. Factors that lead to more reliable survey response are hypothesized to correlate positively with the amount of schooling of the population of interest.
My current research with Jon Krosnick concerning the reliability of attitude measurement (Alwin and Krosnick, 1989b) shows that attitude reporting reliability increases significantly with greater amounts of schooling. Using data from the National Election Studies panel surveys conducted in the 1950's, 1970's and 1980's, our research estimated the relation between reporting reliability and amount of schooling. These results are presented in Table 1.
These results suggest that respondents with less. than high school have the lowest level of attitude reporting reliability, and reliability for those with a high school diploma is somewhat higher, and those who have attended college have the highest reliability. There appears to be no difference in reporting reliability between those who have graduated from college and those who have attended college, but not graduated.25
Age It is often hypothesized that advancing age may lead to less measurement reliability because of mental decay, decreased memory, and impaired
Table 1. The relationship between schooling and reliability estimates for attitude questions in the NES panel studies
NES 1950s, 1970s NES 1980s Amount of schooling Sample #of Average Sample #of Average
size items reliability size items reliability
0-11 years 981 59 0.462 191 22 0.609 12 years 776 59 0.494 277 23 0.657 13-15 years 368 59 0.531 151 23 0.753 16+ years 320 58 0.540 139 23 0.767 Total 2,445 59 0.507 758 23 0.697
Source: Alwin and Krosnick (1989b).
25 The overall F-ratio for the combined 1950's and 1970's panels is 2.48 (df=3 and 231), which is significant at the p = 0.06 level. The F-ratio for the 1980's panel is 4.19 (df = 3 and 87), and is significant at the p < 0.01 level.

310 D.F. Alwin
judgement due to dementia. Research on this issue presents conflicting evidence. The most recent findings in the area suggest there may be some non-linear shift in reporting reliability in older age, but there is a variety of evidence regarding the point at which the shift occurs. At the same time, other evidence suggests there are no greater measurement errors introduced by older persons compared to younger. Andrews and Herzog (1986), for example, found that true-score variance tended to decline with age, while method variance and random error variance increased, suggesting that reliability will decline with increasing age. These results, however, indicate that the decline was not linear. Rather, there seemed to be a systematic decline around the age of 55 (see also Sears, 1981). Other evidence by the same investigators (Rodgers and Herzog, 1987a and 1987b) suggested that measurement errors were not greater among the older age groups. '
My research on this topic with Jon Krosnick (Alwin and Krosnick, 1989a, 1989b) suggests that for attitude reporting, reliability declines in old age, but the evidence is not strong. This evidence is based on 3-wave panel estimates from the 1950's, 1970's and 1980's National Election Studies. These results are shown in Table 2. The overall relationship between age and the reliability of attitude measurement is significant in neither one of these studies, although there is a slight, marginally significant decline in reliability in the oldest age group in both sets of data. More fine-grained longitudinal assessments of the effects of aging on reliability for one particular attitude measure, a 7-point measure of party identification, suggests that reliability declines with age across the entire life-span (Alwin and Krosnick, 1989a).
Table 2. The relationship between age and reliability estimates for attitude questions in the NES panel studies
NES 1950s, 1970s NES 1980s Age Sample #of Average Sample #of Average
size items reliability size items reliability
18-25 302 60 0.511 133 23 0.725 26-33 455 60 0.530 163 23 0.744 34-41 431 60 0.507 114 23 0.706 42-49 391 60 0.530 68 23 0.728 50-57 305 60 0.542 93 23 0.708 58-65 248 60 0.526 87 23 0.634 66-83 260 59 0.496 92 21 0.593 Total 2,392 60 0.520 755 23 0.692
Source: Alwin and Krosnick (1989b).

Reliability of survey data 311
The relation of age to reporting reliability is ambiguous, but one thing is clear: declines in reliability with age, while often occurring only in the oldest age groups, are almost always very small. Generally speaking, there do not seem to be any significant limitations concerning survey research procedures with regard to age. Nor do there seem to be any major consequences for data analysis.
B. Topic of questions
One might reasonably expect that the topic or topics addressed by survey questions play an important role in the reporting reliability of survey measurement. For example, one would expect that the survey measurement of factual material would be more reliable than the measurement of attitudes. And, one might expect that survey questions can assess some types of attitudes more reliably than others. At the same time, one would expect that reporting reliability will vary as a function of the nature of the factual material requested and the respondent's access to the information, and the facility with which it can be translated into the response categories provided by the survey instrument. Issues of comprehension and clarity are very important considerations when assessing the reliability of factual data (Kalton and Schuman, 1982).
My research with Arland Thornton on the reliability of reporting socioeconomic information provides an illustrative case (see Alwin and Thornton, 1984). Using panel data for a 692 women, successfully reinterviewed at several points over an 18-year period, we obtained the following reliability estimates: 26
Respondent's Amount of Schooling: 0.940 Husband's Amount of Schooling: 0.916 Husband's Occupational Status: 0.841 Family Assets: 0.889 Family Income: 0.663 Number of Children Ever Born: 1.000 Respondent's Employment: 0.679
26 Successful contact was maintained with 916 families, but only those remaining intact over the time period covered by the study were studied in that report, owing to the desire to maintain a constant frame of reference.

312 D.F. Alwin
These results provide the basis for several comments. First, perfect reliability is estimated in the case of reports of the number of live births. At least for women, reporting a discrete number of events of high salience, which for the large majority is a relatively small number, is an exercise that is not fraught with random errors. Such results are reassuring. Second, although reports of self and spouse's amount of schooling, spouse's occupation, and some aspects of the family's economic well-being (assets) have relatively high levels of reporting reliability- all ranging in the area of 0.9 or above - they are not perfect. The variability among these estimates, however, makes some sense. For example, these women seem to be able to report their own schooling (ever so slightly) more reliably than they report their husband's schooling, and it seems plausible that since schooling is measured in relatively few units, ranging from 8 or less years of schooling in single year units through 22 years, compared to occupational and economic categories, it would be reported more reliably. Third, variables in which there are many p<1tential units of information needed to formulate a response (e.g. in the case of family income), or where there is some arbitrariness in defining categories of the variables (e.g. maternal employment), the reliability is lowest. Finally, although we may often think that reports of occupation are relatively precise, when one considers the fact that such occupations require extensive coding, it is noteworthy that the reliability of occupational prestige is as high as it is. 27
Thus, it seems plausible that domains of content may inherently differ in the extent to which they may be measured reliably. Moreover, topics or attitude objects that are generally more important or salient to the respondent may reduce randomness of response in surveys simply because salient topics are more likely to have been thought about, discussed with others, or are otherwise more accessible. Krosnick (1986) describes five key characteristics of more central attitudes - they are built upon greater knowledge, more extreme positions, they are more consistent with other relevant attitudes and beliefs, they are relatively accessible, and they are more resistant to change. Measures of these aspects of centrality (or salience) revealed more unreliability among those behaviors or qualities associated with less central attitudes.
Our recent research (Alwin and Krosnick, 1989b) indicated that some types of survey content is more reliably measured than others. Specifically, ideological self-assessments, measures of party identification, and candidate
27 These estimates are consistent with the relative levels of reporting reliability obtained from other investigations of the reliability of socioeconomic variables (see Bielby and Hauser, 1977; Bielby et al., 1977a, 1977b; Hauser et al., 1983).

Reliability of survey data 313
preferences are measured most reliably, followed closely by measures of attitudes toward social groups. Less reliable were measures involving policy issues, and the least reliable were measures of political efficacy and alienation. We conjectured, however, that these results were artifactual, due to the fact that the different types of attitude questions are used to measure different types of attitude objects, and that those question types may be inherently different from one another in terms of the extent of random response they generate. The most significant and obvious differences between the measurement techniques involve the number of response options provided to respondents and the proportion of those options that are explicitly labeled.
It is possible within the GSS reinterviews to examine differences in reliability by the topic of the study. For these purposes I define the following categories:28
1. Factual Content: Objective information regarding the respondent or members of the household. For example, information on the respondent's characteristics, such as date of birth, amount of schooling, amount of income, and the timing, duration and frequencies of certain behaviors. Such 'objective' information must often be estimated, in which case there is some ambiguity in the distinction between the measurement of factual content and the measurement of beliefs. Some measures of factual content rely on the use of proxy reports from other members of the household, or in some cases rely on interviewer reports.29
2. Beliefs: Perceptions or subjective assessments of states and/or outcomes for self and others. The major distinction between beliefs and facts is that the latter could presumably be verified, whereas the former is, by definition, a matter of personal judgement. For example, components of income, such as earnings or income transfer payments, could presumably be verified with employers or social service agencies, in the same sense that date of birth could be verified in most cases using official records. In this sense, an individual's position with respect to the population income distribution is a matter that can presumably be verified, assuming one has access to the available information. On the other hand, it may also be interesting to know the individual's belief about her (or her household's) income relative to
28 I acknowledge the assistance of Jon Krosnick in the development of these five categories. 29 It is common in face-to-face interviews, for example, to rely on interviewer reports of sex and race, or of other variables (e.g. the nature of the housing).

314 D.F. Alwin
aspects of the income distribution, as a distinct variable in and of itself (see e.g. Alwin, 1987). Thus, facts refer to 'what is', whereas beliefs refer to 'subjective assessments' of what is. 30
3. Values: Subjective assessments of the importance or relative priority of desirable end-states or instrumental means of obtaining such objectives. Such assessments presumably reflect desirable facts or goals to the respondent and some relative preference of such outcomes when they are in competition or conflict (see Williams, 1968).
4. Attitudes: Affective responses to particular objects or actors, assumed to exist along a positive/negative continuum of acceptance, favorability, or agreement. Attitudes, for example, on policy issues or political leaders, are frequently used and measured along a dimension of approval or disapproval. In fact, many different concepts have been used to assess the direction and intensity of attitudes.
5. Self-assessments: Subjective evaluation of the 'state of accomplishment' within certain domains. A common form of self-assessment has to do with the evaluation of one's health or well-being. For example, there is a large literature that falls under the rubric of the study of the 'quality of life', which uses measures of satisfaction with various domains of life.
The reliability estimates for the GSS measures in these five categories are given in Table 3. The actual measures included in these categories are given in Appendix B.
These results show that there appear to be differences in estimated reliability across these categories, with questions seeking factual material, values and beliefs showing higher absolute levels of reliability than questions assessing attitudes or self-appraisals. These results are, however, not statistically significant (F = 1.627, df = 4 and 29, p = 0.19). Little research has apparently been carried out on this topic, and more evidence must be gathered before a firm conclusion in this regard will be possible.
C. Design of the question It is frequently assumed that by carefully designing survey questions survey measurement errors can be reduced. It is believed that errors can be reduced by making questions comprehensible, by using familiar words, by providing clear instructions, by providing ample precision in the response categories, by providing labels for categories, and by filtering out potential
30 There may also be some value in distinguishing expectations, that is, beliefs about future states, from other types of beliefs, but for present purposes I do not maintain this distinction.
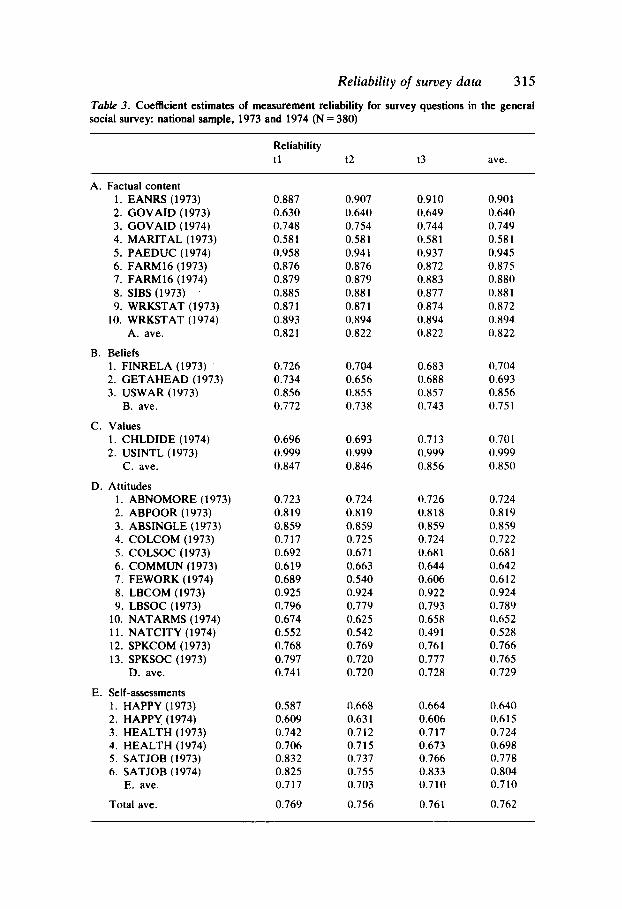
Reliability of survey data 315
Table 3. Coefficient estimates of measurement reliability for survey questions in the general social survey: national sample, 1973 and 1974 (N = 380) ·
Reliability t1 t2 !3 ave.
A. Factual content 1. EANRS (1973) 0.887 0.907 0.910 0.901 2. GOVAID (1973) 0.630 0.640 0.649 0.640 3. GOVAID (1974) 0.748 0.754 0.744 0.749 4. MARITAL (1973) 0.581 0.581 0.581 0.581 5. PAEDUC (1974) 0.958 0.941 0.937 0.945 6. FARM16 (1973) 0.876 0.876 0.872 0.875 7. FARM16 (1974) 0.879 0.879 0.883 0.880 8. SIBS(1973) 0.885 0.881 0.877 0.881 9. WRKSTAT (1973) 0.871 0.871 0.874 0.872
10. WRKSTAT (1974) 0.893 0.894 0.894 0.894 A. ave. 0.821 0.822 0.822 0.822
B. Beliefs 1. FINRELA (1973) 0.726 0.704 0.683 0.704 2. GETAHEAD (1973) 0.734 0.656 0.688 0.693 3. USWAR (1973) 0.856 0.855 0.857 0.856
B. ave. 0.772 0.738 0.743 0.751
C. Values 1. CHLDIDE (1974) 0.696 0.693 0.713 0.701 2. USINTL (1973) 0.999 0.999 0.999 0.999
C. ave. 0.847 0.846 0.856 0.850
D. Attitudes 1. ABNOMORE (1973) 0.723 0.724 0.726 0.724 2. ABPOOR (1973) 0.819 0.819 0.818 0.819 3. ABSINGLE (1973) 0.859 0.859 0.859 0.859 4. COLCOM (1973) 0.717 0.725 0.724 0.722 5. COLSOC (1973) 0.692 0.671 0.681 0.681 6. COMMUN (1973) 0.619 0.663 0.644 0.642 7. FEWORK (1974) 0.689 0.540 0.606 0.612 8. LBCOM (1973) 0.925 0.924 0.922 0.924 9. LBSOC (1973) 0.796 0.779 0.793 0.789
10. NAT ARMS (1974) 0.674 0.625 0.658 0.652 11. NATCITY (1974) 0.552 0.542 0.491 0.528 12. SPKCOM (1973) 0.768 0.769 0.761 0.766 13. SPKSOC (1973) 0.797 0.720 0.777 0.765
D. ave. 0.741 0.720 0.728 0.729
E. Self-assessments 1. HAPPY (1973) 0.587 0.668 0.664 0.640 2. HAPPY (1974) 0.609 0.631 0.606 0.615 3. HEALTH (1973) 0.742 0.712 0.717 0.724 4. HEALTH (1974) 0.706 0.715 0.673 0.698 5. SATJOB (1973) 0.832 0.737 0.766 0.778 6. SATJOB (1974) 0.825 0.755 0.833 0.804
E. ave. 0.717 0.703 0.710 0.710
Total ave. 0.769 0.756 0.761 0.762

316 D.F. Alwin
Table 4. Multitrait-multimethod factor model for three domains of satisfaction, assessed by three different measurement approaches. (Quality of Life Study, 1978)
(1) (2) (3) (4) (5) (6) ui
7PT SAT HU 0.768 0.308 0.314 101PT HU 0.752 0.426 0.252 7PT T/D HU 0.764 0.431 0.234 7PT SAT SOL 0.683 0.529 0.254 101PT SOL 0.518 0.671 0.281 7PT D/T SOL 0.529 0.693 0.236 7PT SAT LIF 0.377 0.733 0.320 101PT LIF 0.491 0.628 0.365 7PT D/T LIF 0.615 0.576 0.292
Decomposition of variance
7PT SAT HU 0.590 0.095 0.314 101PT HU 0.566 0.181 0.252 7PT T/D HU 0.584 0.186 0.234 7PT SAT SOL 0.466 0.280 0.254 101PT SOL 0.268 0.450 0.281 7PT D/T SOL 0.280 0.480 0.236 7PT SAT LIF 0.142 0.537 0.320 101PT LIF 0.241 0.394 0.365 7PT D/T LIF 0.367 0.332 0.292
respondents who do not have access to the requested information or an ability to provide a response.
The characteristics of the response categories of survey questions are often viewed as a potential influence on reporting reliability. Andrews (1984), for example, found that reporting reliability increased as the number of response categories increased. He found the greatest reliability for survey questions with twenty or more categories. He also found that fully-labeled response scales produced less reliability than those which were partially labeled and that by offering a 'Don't Know' option, reliability was increased. Andrews (1984), however, analyzed a pool of survey items that included attitudes, beliefs, and factual questions (including reports of behavior), and it may be that if question content had been held constant, these particular findings would not remain significant.
Our own research on the topic of attitude measurement reliability, which made an effort to control for question content, contradicts many of Andrews' (1984) findings (Alwin and Krosnick, 1989b). We find that survey questions with more response options tend to have higher reliabilities, although among rating scales, the 7-point, fully labeled format is found to have significantly higher average reliability than scales with either more or
Reliability of survey data 317
less scale-points. The 1 01-point 'feeling thermometers' used to assess attitudes, which label the endpoints and the midpoint, have significantly lower levels of reliability. The problem with these findings is that, while it was possible to control for question content to some extent, the fact remains that those 7 -point scales showing the highest reliability are typically measures of ideological content, whereas the other scales are used to assess policy attitudes, political efficacy, and a variety of other types of attitudes. It may be that because of its symbolic character, ideology may be more reliably measured, whereas less-symbolic attitudes may be reported less reliably. Further research is required to disentangle this puzzle.
One further test of the effects of question design can be carried out using the ISR's 1978 Quality of Life survey. Here we have three domains of satisfaction - housing, standard of living and life as a whole - each measured using three different types of response scales. 31 The response scale types used were: (a) a 7 -point, partially labeled 'satisfied-dissatisfied' scale, (b) a 7-point, fully labeled 'delighted-terrible' scale, and (c) a lOtpoint 'feeling thermometer' in which only the end-points were labeled. Details of these question formats are given in Appendix A. The results of a multitrait-multimethod estimation strategy for decomposing the variance of these measures into trait, method and random error components are presented in Table 4.
These results show, as suggested by the previous discussion, that reliability (in this case 1- u~) contains variance due to aspects of the method of measurement. In fact, it appears from this analysis that in the measurement of some latent satisfaction variables the method and error components of variance are greater than the trait variance.
There is a slight tendency for the fully-labeled satisfaction scales to be more reliable than the other types, regardless of the domain measured, but while consistently the case, this difference may not be significant. In two out of three cases, the 1 01-point rating scales are the least reliable of the three response forms, but again these results may not be significant. In any event, these results seem to contradict Andrews' (1984) findings that scales with greater numbers of scale points produce the most reliable data. They coincide to a greater degree with the results reported above indicating that 7 -point scales provide more reliable measurement of attitudes.
D. Conditions of measurement
One of the most important set of considerations in evaluating the factors that influence reliability of measurement involves the specific conditions of
31 A more detailed presentation of these results is given in Alwin (1989a).

318 D.F. Alwin
measurement. This category includes a variety of potential influences, including the observational design of the study (e.g. cross-sectional vs. longitudinal observations), the mode of administering the questionnaire (e.g. self-administered vs. interviewer-administered), the training of interviewers, and the factors linked to the actual setting in which the interview takes place. As indicated earlier, it is not possible to deal with all of these here, and I shall focus on just one of them here: the observational design. The remaining factors in this category are equally important, and the omission of their further consideration should perhaps be interpreted more in terms of lack of empirical knowledge than in terms of overall influence on reliability.
Design of remeasurement The central issue that has been given analytic attention in the foregoing discussion is the design of the replication of questions, that is, crosssectional vs. reinterview designs. In the separate detailed discussion of these two observational designs in the foregoing sections of the paper I have intended to provide some basis for a comparison of the relative advantages and disadvantages of these two designs for obtaining optimal reliability estimation. To this point in the presentation I have not addressed this issue, and do so now.
One way to evaluate this issue would be to compare reliability estimates produced by the two designs over a wide range of variables. This is not possible, however, because empirical data are limited in this regard. There is a single item in the present set of results which was measured using both types of design, the measure of job satisfaction. In this case a measure of job satisfaction was included in the 1978 Quality of Life survey, as well as in the 1973 and 1974 GSS reinterview designs (see the Appendices for the exact wording of the questions).
As shown in Table 3 above, in the GSS reinterview data the reliability of reports of job satisfaction is in the range 0. 78 to 0.80, a relatively high estimated reliability. The two different reinterview surveys are remarkably consistent in this regard. Such consistency does not exist in the crosssectional reliability estimates. In data not reported here (see Alwin, 1989a), the reliability of job satisfaction measured using a 7-point scale is estimated to be 0.62, whereas the estimate for a measure using a 101-point rating scale is 0.88! There is little basis here for any conclusion regarding the empirical differences in the nature of reliability estimates between the two types of design.
One empirical observation which might be used as a basis for some conjecture regarding the two types of design for reliability estimation is a
Reliability of survey data 319
result from our analysis of the reliability of attitude reports using panel data (Alwin and Krosnick, 1989b). Our results indicate fairly clearly that estimates of reliability of attitudes obtained from panel designs using shorter reinterview intervals are generally higher than estimates obtained from longer ones. Specifically, the average estimate of reliability for attitudes in the ass reinterview survey is 0.729, whereas the 1980 NE~ registers an average estimated reliability of attitudes of 0.692, and the average for the combined 1950's and 1970's NES panels is 0.520.
It appears, thus, that estimated attitude measurement reliability may be linked to the length of the reinterview period. Recall that the average length of time in the ass reinterview studies was approximately 2 months, whereas as the 1980's NBS reinterviews were conducted about every 4 months, and the 1950's and 1970's NBS panels involved 24-month intervals. The difference between the ass and 1980 NBS data does not seem to be substantial, but it does depict a trend consistent with the overall conclusion that reinterviews obtained over shorter time intervals produce higher estimates of reliability. There appears to be clear support for this if we compare the 1950's and 1970's NBS estimates with the other studies.
Such types of results lends support to the conclusion of Moser and Kalton (1972:353) that over shorter time intervals "respondents may remember their first answers and give consistent retest answers, an action which would make the test appear more reliable than is truly the case". Over longer time intervals, then, reliability is lower, and presumably as a consequence of the type of phenomena alluded to here, reliability is more accurately estimated over longer intervals of remeasurement.
If the empirical data provided here regarding attitudes can be generalized to other topics, and if the type of reasoning given is sound, it might be concluded the best designs for estimating reliability are those with lengthy reinterview intervals. What length is optimal is unclear, however. But, the logic of this line of thinking might usefully be applied to the issue of whether reliability can be optimally estimated in cross-sectional research designs. As my earlier discussion indicates, it seems obvious that the exact replication of questions within the same survey interview may produce somewhat spurious results, given the potential tendencies of respondents referred to by Moser and Kalton (1972). If the problems of memory and consistency motivation exist over remeasurement intervals of 2 to 4 months, they most certainly would exist over intervals involving minutes or hours.
It seems impossible therefore to avoid the conclusion that for purposes of estimating the reliability of reporting various types of content in survey interviews, the cross-sectional design is less than optimal. Even if one were to rule out the strategy of replicating the same question within a given

320 D.F. Alwin
interview, alternative strategies seem to be less than appealing. As indicated above, short of designing measurement strategies that cross traits and methods, as in the manner of the multitrait-multimethod design, there seems to be little room for certainty in knowing what type of an approximation various types of measurement strategies provide to reliability. We do not as yet have much empirical basis for assessing the extent to which Cases (b), (c) and (d) elaborated upon above (see Chart 1) provide workable solutions by themselves.
My conclusion is, thus, that both cross-sectional and panel estimates of measurement reliability may be useful and desirable, but given the seemingly greater difficulties in obtaining estimates of reliability in cross-sectional designs, I tentatively conclude that panel designs are probably the most advantageous. At the same time, as suggested at an earlier point in the paper, the ultimate strategy may well involve a combination of the two designs, that is, survey designs that involve a multi-method within-time measurement strategy coupled with a reinterview design. Further exploration of these issues should be given a high priority for future research.
7. Closing
Despite the infrequency with which survey measures are evaluated with respect to the criterion of measurement reliability, there is little doubt that this is an important consideration in the evaluation of the quality of survey data. Unfortunately, heretofore there has been only sparse discussion of the methodological issues that underlie reliability estimation strategies.
In this paper I have discussed several of the difficulties involved in estimating the reliability of survey data. The paper began with a brief discussion of the concept of reliability within the framework of a model for the sources of error in survey response. I then turned to a discussion of the design requirements for separating response variation into components of error. Problems with the estimation of these components were enumerated and discussed for both cross-sectional and panel designs. Empirical examples were given of the interpretational difficulties encountered in reliability estimation.
The presentation and discussion of these findings stresses the importance of recognizing the role of aspects of the survey measurement process in producing survey errors, and the importance of studying their influences on the nature and extent of errors. In the foregoing I have reviewed and evaluated two general methodological strategies for estimating survey measurement reliability. To the extent that these sources of error can be

Reliability of survey data 321
expressed as parameters of these psychometric models, then it is possible to study the role of factors hypothesized to generate errors, whether random or systematic.
The above results further reinforce the observation made at the beginning of this paper, and stressed throughout, that the characteristics of the population of interest, the topic or topics of the survey, the methodological characteristics of the questions used, and the general conditions of measurement are all factors that affect reliability. At the same time, I conclude that, in fact, very little is known about factors linked to reliability. A substantial number of papers have been devoted to considera,tion of these issues, and some findings exist. Much more work needs to be done, however, and systematic attention needs to address the general issue of the reliability of survey data and its potential impact on their interpretation and use.
References
Achen, C.H. (1975). "Mass political attitudes and the survey response", American Political Science Review 69: 1218-1231.
Alwin, D.F. (1973). "Making inferences from attitude-behavior correlations", Sociometry 36: 253-278.
Alwin, D.F. (1974). "Approaches to the interpretation of relationships in the multitraitmultimethod matrix'\ in H.L. Costner (ed.), Sociological Methodology 1973-74 (pp. 79-105). San Francisco: Jossey-Bass.
Alwin, D.F. (1976). "Attitude scales as congeneric tests: a re-examination of an attitudebehavior model", Sociometry 39: 377-383.
Alwin, D.F. (1985). "The application of structural equation models to experimental data: an addendum", pp. 82-88 in H.M. Blalock, Jr. (ed.), Causal Models in Panel and Experimental Design. New York: Aldine.
Alwin, D.F. (1987). "Distributive justice and satisfaction with material well-being", American Sociological Review 52: 83-95.
Alwin, D.F. (1988). "Structural equation models in research on human development and aging", pp. 71-170 in K.W. Schaie, R.T. Campbell, W. Meredith and S.C. Rawlings (eds.), Methodological Issues in Aging Research. New York: Springer Publishing Company.
Alwin, D.F. (1989a). "Are 100-point scales more reliable than 7-point scales? An investigation of components of variance for measures of life satisfaction". Unpublished manuscript. Institute for Social Research, University of Michigan, Ann Arbor MI.
Alwin, D.F. (1989b). "The reliability of survey data: Variation by topic.of the question", unpublished manuscript. Institute for Social Research, University of Michigan, Ann Arbor MI.
Alwin, D.F. (1989c). "The concept of validity and its applicability to survey measurement", unpublished manuscript. Institute for Social Research, University of Michigan, Ann Arbor MI.
Alwin, D.F. & Jackson, D.J. (1979). "Measurement models for response errors in surveys: issues and applications", pp. 68-119, in K.F. Schuessler (ed.), Sociological Methodology 1980. San Francisco: Jossey-Bass.

322 D.F. Alwin
Alwin, D.F. & Krosnick, J.A. (1985). "The measurement of values in surveys: a comparison of ratings and rankings", Public Opinion Quarterly 49: 535-552.
Alwin, D.F. & Krosnick, J.A. (1989a). "Aging, cohorts, and the stability of socio-political orientations over the lifecourse", unpublished paper. Institute for Social Research, University of Michigan, Ann Arbor MI.
Alwin, D.F. & Krosnick, J.A. (1989b). "The reliability of attitudinal survey data: the impact of question and respondent characteristics", unpublished paper. Institute for Social Research, University of Michigan, Ann Arbor MI.
Alwin, D.F. & Thornton, A. (1984). "Family origins and the schooling process: Early vs. late influence of parental characteristics", American Sociological Review 49: 784-802.
Andrews, F.M. (1984). "Construct validity and error components of survey measures: a structural modeling approach", Public Opinion Quarterly 48:409-442.
Andrews, F.M. and Herzog, A.R. (1986). "The quality of survey data as related to age of respondent", Journal of the American Statistical Association 81: 403-410.
Asher, H.B. ( 197 4 ). "Some consequences of measurement error in survey data", American Journal of Political Science 28: 468-485.
Bachman, J.G. & O'Malley, P.M. (1981). "When four months equal a year: inconsistencies in student reports of drug use", Public Opinion Quarterly 45: 536-548.
Berg, I.A. (1966). Response Set in Personality Assessment. Chicago: Aldine. Bielby, W.T. & Hauser, R.M. (1977). "Response errors in earnings functions for nonblack
males", Sociological Methods and Research 6: 241-280. Bielby, W.T., Hauser, R.M. & Featherman, D.L. (1977a). "Response errors of nonblack males
in models of the shatification process", Journal of the American Statistical Association 72: 723-735. .
Bielby, W.T., Hauser, R.M. & Featherman, D.L. (1977b). "Response errors of black and nonblack males in models of status inheritance and mobility", American Journal of Sociology 82: 1242-1288.
Block, J. (1965). The Challenge of Response Sets. New York: Appleton-Century-Crofts. Bock, R.D. & Bargmann, R.E. (1966). "Analysis of covariance structures", Psychometrika 31:
507-534. Bohrnstedt, G.W. (1970). "Reliability and validity assessment in attitude research", pp. 80-99,
in G.F. Summers (ed.), Attitude Measurement. Chicago: Rand McNally. Bohrnstedt, G.W. (1983). "Measurement", pp. 70-121, in P.H. Rossi, J.D. Wright, and A.B.
Anderson (eds), Handbook of Survey Research. New York: Academic Press. Bohrnstedt, G.W. & Carter, T.M. (1971). "Robustness in regression analysis", pp. 118-146, in
H.L. Costner (ed.), Sociological Methodology 1971. San Francisco: Jossey-Bass. Bohrnstedt, G.W., Mohler, P.P. & Miiller, W. (1987). "Editor's introduction", Sociological
Methods and Research 15: 171-176. Boros, M.E. & Nestle, G. (1973). "Response bias in reports of father's education and
socioeconomic status", Journal of the American Statistical Association 68: 816-820. Campbell, A. & Converse, P.E. (1980). The Quality of American Life, 1978 Codebook. Ann
Arbor MI: Inter-University Consortium for Political and Social Research. Campbell, D.T. & Fiske, D.W. (1959). "Convergent and discriminant validation by the
multitrait-multimethod matrix", Psychological Bulletin 56: 81-105. Campbell, R.T. and Mutran, E. (1982). "Analyzing panel data in studies of aging", Research
on Aging 4: 3-41. Cannell, C.F., Miller, P.V. & Oksenberg, L. (1981). "Research on interviewing techniques",
pp. 389-437 in S. Lienhard! (ed.), Sociological Methodology 1981. San Francisco: JosseyBass.
Cleary, T.A., Linn, R.L. & Walster, G.W. (1970). "Effect of reliability and validity on power of statistical tests", pp. 30-38 in E.F. Borgatta and G.W. Bohrnstedt (eds.), Sociological Methodology 1970. San Francisco: Jossey-Bass.

Reliability of survey data 323
Converse, P.E. & Markus, G.B. (1979). "Plus ca change ... : The New CPS election study panel", American Political Science Review 73: 32-49.
Corcoran, M. (1980). "Sex differences in measurement error in status attainment models", Sociological Methods and Research 9: 199-217.
Costner, H.L. (1969). "Theory, deduction, and rules of correspondence", American Journal of Sociology 75: 245-63.
Cronbach, L.J. (1946). "Response sets and test validity", Educational and Psychological Measurement 6: 475-94.
Cronbach, L.J. (1950). "Further evidence on response sets", Education and Psychological Measurement 10: 3-31.
Cunningham, W.H., Cunningham, I.C.M. & Green, R.T. (1977). "The ipsative process to reduce response set bias", Public Opinion Quarterly 41: 379-84.
Erikson, R.S. ( 1978). "Analyzing one variable-three wave panel data: a comparison of two models", Political Methodology 5: 151-161.
Erikson, R.S. (1979). "The SRC panel data and mass political attitudes", British Journal of Political Science 9: 89-114.
Feather, N.T. (1973). "The measurement of values: effects of different assessment procedures", Australian Journal of Psychology 25: 221-31.
Greene, V .L. & Carmines, E.G. (1979). "Assessing the reliability of linear composites", pp. 160-175 in K.F. Schuessler (ed.), Sociological Methodology 1980, San Francosco: JosseyBass.
Groves, R.M. (1987). "Research on survey data quality", Public Opinion Quarterly 51: S156-Sl72.
Hamilton, D.L. (1968). "Personality attributes associated with extreme response set", Psychological Bulletin 69: 192-203.
Hargens, L.L., Reskin, B.F. & Allison, P.O. (1976). "Problems in estimating measurement error from panel data: an example involving the measurement of scientific productivity", Sociological Methods and Research 4: 439-458.
Hauser, R.M., Tsai, S.L. & Sewell, W.M. (1983). "A model of stratification with response error in social and psychological variables", Sociology of Education 56: 20-46.
Heise, D.R. (1969). '"Separating reliability and stability in test-retest correlations", American Sociological Review 34: 93-101.
Heise, D.R. & Bohrnstedt, G.W. (1970). "Validity, invalidity and reliability", pp. 104-129 in E.F. Borgatta and G.W. Bohrnstedt (eds.), Sociological Methodology 1970. San Francisco: Jossey-Bass.
Jagodzinski, W. & Kiihnel, S.M. (1987). "Estimation of reliability and stability in singleindicator multiple wave models", Sociological Methods and Research 15: 219-259.
Jagodzinski, W., Kiihnel, S.M. & Schmidt, P. (1987). "Is there a 'Socratic effect' in nonexperimental panel studies?" Sociological Methods and Research 15: 259-303.
Joreskog, K.G. (1970). "Estimation and testing of simplex models", British Journal of Mathematical and Statistical Psychology 23: 121-145.
Joreskog, K.G. (1971). "Statistical analysis of sets of congeneric tests", Psychometrika 36: 109-133.
JOreskog, K.G. (1974). "Analyzing psychological data by structural analysis of covariance matrices", in D.H. Kranz, R.C. Atkinson, R.D. Luce and P. Suppes (eds.), Measurement, Psychophysics, and Neural Information Processing. San Francisco: Freeman.
Joreskog, K.G. (1977). "Statistical models for analysis of longitudinal data", pp. 285-325 in D.J. Aigner and A.S. Goldberger (eds.), Latent Variabs in Socioeconomic Models. Amsterdam: North-Holland.
Joreskog, K.G. (1978). "Structural analysis of covariance and correlation matr.ices", Psychometrika 43: 443-477.
Joreskog, K.G. ( 1979). "Statistical estimation of structural models in longitudinal develop-

324 D.F. Alwin
mental investigations", pp. 303-374 in J.R. Nessleroade and P.B. Baltes (eds.), Longitudinal Research in the Study of Behavior and Development. New York: Academic Press.
Joreskog, K.G. & Sorbom, D. (1986). LISREL VI. Analysis of Linear Structural Relationships by Maximum Likelihood, Instrumental Variables, and Least Squares Methods. Scientific Software, Inc. P.O. Box. 536, Mooresville, Indiana 46158.
Kalton, G. & Schuman, H. (1982). "The effect of the question on survey responses: a review", Journal of the Royal Statistical Association 145: 42-73.
Krippendorff, K. (1970). "Bivariate agreement coefficients for reliability of data", pp. 139-150 in E.F. Borgatta and G.W. Bohrnstedt (eds.), Sociological Methodology 1970. San Francisco: Jossey-Bass.
Krosnick, J.A. (1986). Policy Voting in American Presidential Elections: An Application of Psychological Theory to American Politics. Unpublished Ph.D. Dissertation, Department of Psychology, University of Michigan, Ann Arbor, MI.
Krosnick, J.A. & Alwin, D.F. (1987). "An evaluation of a theory of response order effects in· survey measurement", Public Opinion Quarterly 51: 201-219.
Lord, F.M. and Novick, M.R. (1968). Statistical Theories of Mental Test Scores, Reading, MA: Addison-Wesley.
Markus, G.B. (1982). "Political attitudes during an election year: a report on the 1980 NES panel study", American Political Science Review 76: 538-560.
Marquis, K.H. (1978). Record Check Validity of Survey Responses: A Reassessment of Bias in Reports· of Hospitalization. Santa Monica, CA: The Rand Corporation.
Marquis, K.H., Duan, N., Marquis, M.S. & Polich, J.M. (1981). Response Errors in Sensitive Topic Surveys: Estimates, Effects and Correction Options. Santa Monica, CA: Rand Corporation.
Marquis, M.S. & Marquis, K.H. (1977). Survey Measurement Design and Evaluation Using Reliability Theory. Santa Monica, CA: The Rand Corporation.
Messick, S. (1968). "Response sets", in D.L. Sills (ed.), International Encyclopedia of the Social Sciences, Vol. 13. New York: Macmillan.
Miller, D.P. and Swain, A.D. (1987). "Human error and human reliability", pp. 219-250 in G. Salvendy (ed.), The Handbook of Human Factors. New York: John Wiley.
Mille,·. p.V. & Groves, R.M. (1985). "Matching survey responses to official records: an exploration of validity in victimization reporting", Public Opinion Quarterly 49: 366-380.
Miller, W.E., Miller, A.H. & Schneider, E.J. (1980). American National Election Studies Data Sourcebook, 1952-1978. Cambridge, MA: Harvard University Press.
Moser, C.A. and Kalton, G. (1972). Survey Methods in Social Investigation. New York: Basic Books.
National Opinion Research Center. (1988). General Social Surveys, 1972-87: Cumulative Codebook. Chicago: Author.
Phillips, D.L. (1973). Abandoning Method. San Francisco: Jossey-Bass. Rodgers, W.L. and Herzog, A.R. (1987a). "Interviewing older adults: the accuracy of factual
information", Journal of Gerontology 42: 387-394. Rodgers, W.L. & Herzog, A.R. (1987b). "Measurement error in interviews with elderly
respondents". Paper Presented at the 21st annual meetings of the Public Health Conference on Records and Statistics. Institute for Social Research, Ann Arbor, MI.
Saris, W.E. & and van den Putte, B. (1988). "Test of measurement models: a secondary analysis of the ALBUS test-retest data", Sociological Methods and Research 17: 123-157. Department of Political Sciences, University of Amsterdam, The Netherlands.
Schuman, H. and Presser, S. (1981). Questions and Answers in Attitude Surveys: Experiments in Question Form, Wording and Context. New York: Academic Press.
Sears, D.O. (1981). "Life stage effects on attitude change, especially among the elderly", pp. 183-204 in S.B. Kielser, J.N. Morgan and V.K. Oppenheimer {eds.), Aging and Social Change. New York: Academic Press.
Siegel, P.M. & Hodge, R.W. (1968). "A causal approach to the study of measurement error",

Reliability of survey data 325
pp. 28-59 in H.M. Blalock, Jr and A.B. Blalock (eds.), Methodology in Social Research. New York: McGraw-Hill.
Smith, T.W. & Stephenson, C.B. (1979). "An analysis of test/retest experiments on the 1972, 1973, 1974, and 1978 General Social Surveys", GSS Technical Report, No. 14, December, 1979. NORC.
Sorbom, D. (1975). "Detection of correlated errors in longitudinal data", British Journal of Mathematical and Statistical Psychology 27: 229-239.
Weaver, C.N. & Swanson, C.L. (1974). "Validity of reports of date of birth, salary and seniority", Public Opinion Quarterly 38: 69-80.
Werts, C.E. and Linn, R.L. (1970). "Path analysis: psychological examples", Psychological Bulletin 74: 194--212.
Werts, C.E., Breland, H.M., Grandy, J. & Rock, D.A. (1980). "Ising longitudinal data to estimate reliability in the presence of correlated measurement errors", Educational and Psychological Measurement 40: 19-29.
Werts, C. E., JOreskog, K.G. & Linn, R.L. (1971 ). "Comment on 'The estimation of measurement error in panel data'", American Sociological Review 36: 11(}-113.
Werts, C.E., Linn, R.L. & Joreskog, K.G. (1974). "Quantifying unmeasured variables", pp. 27(}-292 in H.M. Blalock (ed.), Measurement in the Social Sciences. Chicago: Aldine.
Werts, C.E., Linn, R.L. & Joreskog, K.G. (1977). "A simplex model for analyzing academic growth", Educational and Psychological Measurement 37: 745-756.
Werts, C.E., Pike, L.W., Linn, R.L. & Joreskog, K.G. (1981). "Applications of a quasi-Markov simplex models across populations", Educational and Psychological Measurement 41: 295-307.
Werts, C.E., Rock, D.A., Linn, R.L. & Joreskog, K.G. (1977). "Validating psychometric assumptions within and between several populations", Educational and Psychological Measurement 37: 863-872.
Wheaton, B., Muthen, B., Alwin, D.F. & Summers, G.F. (1977). "Assessing reliability and stability in panel models", pp. 85-136 in D.R. Heise (ed.), Sociological Methodology 1977. San Francisco: Jossey-Bass.
Williams, R.M. (1968). "Values", in D.L. Sills (ed.), International Encyclopedia of the Social Sciences. New York: Macmillan.
Wiley, D.E. & Wiley, J.A. (1970). "Estimating measurement error using multiple indicators and several points in time", American Sociological Review 35: 112-117.
Zeller, R. & Carmines, E.E. (1980). Measurement in the Social Sciences, New York: Cambridge University Press.
Appendix A. 1978 Quality of Ufe
A. Satisfaction with housing
I. 7- point "Satisfied- Dissatisfied " scale Considering everything, how satisfied or dissatisfied are you with this (house/apartment/mobile home)?
I . Completely Satisfied 2. 3. 4. Neutral

326 D.F. Alwin
5. 6. 7. Completely Dissatisfied
2. Thermometer We have now talked about many different parts of your life and experience. I am going to ask you to think of the same things, to make some final ratings. This time I want you to use the scale on this sheet. Note that on this scale, 100 would mean that the situation is perfect - as good as you can imagine it being; and zero would mean it is terrible, as bad as you can imagine it being. Please tell me where you would place each thing on that scale: as I read each one, give me your answer as a number from zero to 100.
Where would you place your house/apartment?
3. 7-point "Delighted- Terrible" scale Before we finish we would like to have you think back to three of the things we talked about before, but this time using the scale in a different way. Tell me what number on this card best describes how you feel about each I will mention. Use "seven" for delighted; "six" for pleased; and so forth to "one" for terrible. If you have no feelings at all on the question, tell me letter A.
How do you feel about your (house/apartment)?
1. Delighted 2. Pleased 3. Mostly Satisfied 4. Mixed 5. Mostly Dissatisfied 6. Unhappy 7. Terrible
B. Satisfaction with standard of living
1. 7 -point "Satisfied-Dissatisfied" scale The things people have - housing, cars, furniture, recreation, and the like - make up their standard of living. Some people are satisfied with their standard of living, others feel it is not as high as they would like. How satisfied are you with your standard of living?
2. Thermometer (Where would you place) your standard of living?

Reliability of survey data 327
3. 7-point "Delighted-Terrible" scale How do you feel about your standard of living?
C. Satisfaction with life
1. 7 -point "Satisfied-Dissatisfied" scale We have talked about various parts of your life, now I want to ask you about your life as a whole. How satisfied are you with your life as a whole these days?
2. Thermometer Finally, where would you place your life as a whole?
3. 7-point "Delighted-Terrible" scale How do you feel about your life as a whole?
Appendix B. General social survey
A. Factual content
Just thinking about your family now - those people in the household who are related to you ... how many persons in the family, including yourself, earned any money last year from any job or employment? (1973 GSS/EARNRS)
Did you ever - because of sickness, unemployment, or any other reason -receive anything like welfare, unemployment insurance, or other aid from government agencies? (1973 GSS/GOV AID)
Did you ever - because of sickness, unemployment, or any other reason -receive anything like welfare, unemployment insurance, or other aid from government agencies? (1974 GSS/GOV AID)
Are you currently - married, widowed, divorced, separated, or have you never been married? (1973 GSS/MARIT AL)
What is the highest grade in elementary school or high school that (your father) finished and got credit for? (1974 GSS/PAEDUC)
*What race do you consider yourself? (ASKED ONLY IF THERE IS DOUBT IN INTERVIEWER'S MIND) (1973 GSS/RACE)
*What race do you consider yourself? (ASKED ONLY IF THERE IS DOUBT IN INTERVIEWER'S MIND) (1974 GSS/RACE)

328 D.F. Alwin
Which of the categories on this card comes closest to the type of place you were living in when you were 16 years old? (1973 GSS/RES16-FARM16)
Which of the categories on this card comes closest to the type of place you were living in when you were 16 years old? (1974 GSS/RES16-FARM16)
*During the last year, did anyone take something directly from you by using force -such as a stickup, mugging, or threat? (1973 GSS/ROBBRY)
*During the last year, did anyone take something directly from you by using force -such as a stickup, mugging, or threat? (1974 GSS/ROBBRY)
How many brothers and sisters did you have? Please count those born alive, but no longer living, as well as those alive now. Also include stepbrothers and stepsisters, and children adopted by your parents. (1973 GSS/SIBS)
Last week were ypu working full time, part time, going to school, keeping house, or what? (1973 GSS/WRKST AT)
Last week were you working full time, part time, going to school, keeping house, or what? (1974 GSS/WRKST AT)
B. Beliefs
Compared with American families in general, would you say your family income is far below average, below average, average, above average, or far above average? (1973 GSS/FINRELA)
Some people say that people get ahead by their own hard work; others say that lucky breaks or help from other people are more important. Which do you think is most important? (1973 GSS/GET AHEA)
Do you expect the United States to fight in another war within the next ten years? ( 1973 GSS/USW AR)
C. Values
What do you think is the ideal number of children for a family to have? ( 1974 GSS/CHLDIDE) Do you think it will be best for the future of this country if we take an active part in world affairs, or if we stay out of world affairs? ( 1973 GSS/USINTL)
* Question excluded from present analysis (see Alwin, 1989h).

Reliability of survey data 329
D. Attitudes
*Please tell me whether or not you think it should be possible for a pregnant woman to obtain a legal abortion if there is a strong chance of serious defect in the baby? (1973 GSS/ ABDEFECT)
*Please tell me whether or not you think it should be possible for a pregnant woman to obtain a legal abortion if the woman's own health is seriously endangered by the pregnancy? (1973 GSS/ ABHL TH)
Please tell me whether or not you think it should be possible for a pregnant woman to obtain· a legal abortion if she is married and does not want any more children? (1973 GSS/ABNOMORE)
Please tell me whether or not you think it should be possible for a pregnant woman to obtain a legal abortion if the family has a very low income and cannot afford any more children? (1973 GSS/ ABPOOR)
*Please tell me whether or not you think it should be possible for a pregnant woman to obtain a legal abortion if she became pregnant as a result of rape? (1973 GSS/ ABRAPE)
Please tell me whether or not you think it should be possible for a pregnant woman to obtain a legal abortion if she is not married and does not want to marry the man? (1973 GSS/ ABSINGLE)
Now, I should like to ask you some questions about a man who admits he is a Communist. Suppose he is teaching in a college. Should he be fired, or not? (1973 GSS/COLCOM)
Consider a person who favored government ownership of all the railroads and all big industries. Should such a person be allowed to teach in a college or university, or not? (1973 GSS/COLSOC)
Thinking about all the different kinds of governments in the world today, which of these statements comes closest to how you feel about Communism as a form of government? (1973 GSS/COMMUN)
Do you approve or disapprove of a married woman earning money in business or industry if she has a husband capable of supporting her? (1974 GSS/FEWORK)
Now, I should like to ask you some questions about a man who admits he is a Communist. Suppose he wrote a book which is in your public library. Somebody in your community suggests that the book should be removed

330 D.F. Alwin
from the library. Would you favor removing it, or not? (1973 GSS/LBCOM)
Consider a person who favored government ownership of all the railroads and all big industries. If some people in your community suggested a book he wrote favoring government ownership should be taken out of your public library, would you favor removing this book, or not? (1973 GSS/LBSOC)
We are faced with many problems in this country, none of which can be solved easily or inexpensively. I'm going to name some of these problems, and for each one I'd like you to tell me whether you think we're spending too much money on it, too little money, or about the right amount. Are we spending too much, too little, or about the right amount on the military, armaments and defense? (1974 GSS/NATARMS)
We are faced with many problems in this country, none of which can be solved easily or inexpensively. I'm going to name some of these problems, and for each one I'd like you to tell me whether you think we're spending too much money on it, too little money, or about the righ~ amount. Are we spending too much, too little, or about the right amount on solving the problems of the big cities? (1974 GSS/NATCITY)
*In some places in the United States, it is not legal to supply birth control information. How do you feel about this - do you think birth control information should be available to anyone who wants it, or not? (1974 GSS/PILL)
Now, I should like to ask you some questions about a man who admits he is a Communist. Suppose this admitted Communist wanted to make a speech in your community. Should he be allowed to speak, or not? (1973 GSS/SPKCOM)
Consider a person who favored government ownership of all the railroads and all big industries. If such a person wanted to make a speech in your community favoring government ownership of all railroads and big industries, should he be allowed to speak, or not? (1973 GSS/SPKSOC)
*Do you think birth control information should be available to teenagers who want it, or not? (1974 GSS/TEENPILL)
E. Self-assessments
Taken all together, how would you say things are these days- would you

Reliability of survey data 331
say that you are very happy, pretty happy, or not too happy? (1973 GSS/HAPPY)
Taken all together, how would you say things are these days - would you say that you are very happy, pretty happy, or not too happy? (1974 GSS/HAPPY)
Would you say your own health, in general, is excellent, good, fair, or poor? (1973, GSS/HEAL TH)
Would you say your own health, in general, is excellent, good, fair, or poor? ( 197 4 GSS/HEAL TH)
On the whole, how satisfied are you with the work you do - would you say you are very satisfied, moderately satisfied, a little dissatisfied, or very dissatisfied? ( 1973 GSS/SA TJOB)
On the whole, how satisfied are you with the work you do - would you say you are very satisfied, moderately satisfied, a little dissatisfied, or very dissatisfied? (197 4 GSS/SA T J 0 B)


