Problem-Oriented Patient Record Summary: An Early Report...
6
Problem-Oriented Patient Record Summary: An Early Report on a Watson Application Murthy Devarakonda, Dongyang Zhang, Ching-Huei Tsou, Mihaela Bornea IBM Research and Watson Group Yorktown Heights, NY Abstract — As the use of Electronic Medical Records (EMRs) becomes widespread, the amount of data in an EMR becomes a challenge for its comprehension. We developed problem-oriented EMR summarization to address this issue, as a part of a larger effort of adapting IBM Watson to the medical domain. The problem-orientation refers to the central role of a patient's medical problems in the summary. The summarization uses a generated problem list, relates these generated medical problems to relevant clinical data, and organizes the clinical data in a medically meaningful manner. Watson analytics are used for creating the summarization. This is a step in building the next generation EMR, one that is based not on just keeping record but instead on a conceptual understanding of medicine, thereby crossing the threshold from record storage to an intelligent entity for clinical decision making. Keywords—Electronic Medical Records; Problem-oriented patient record summary; Summarization; Clinical summarization; Medical concepts; Watson; UMLS; Text analysis; I. INTRODUCTION As Electronic Medical Records (EMRs) are widely adopted in patient care, the data they store for a patient has also grown accordingly. A typical EMR contains several hundreds of unstructured plain text clinical notes, as well as large amounts of semi-structured data, such as medications ordered, lab test values, procedures, and vitals. So, the very technology that allows recording every aspect of patient care is also making it (quite unintentionally) difficult to comprehend it quickly. Since manual summarization is time consuming and prone to errors, there is a pressing need for automatic methods. Summarization, in particular text summarization, is a well- known problem in Artificial Intelligence. The task is one of maximizing the information coverage while minimizing the redundancy within a limited amount of space. Developing accurate patient record summaries requires sophisticated medical semantic analysis of EMR data and is a fertile ground for applying the IBM Watson technology. Watson effectively analyzed vast amounts of unstructured text to answer natural language questions in defeating two all- time winning champions on the American TV quiz show Jeopardy! [1] [2]. Since then, we are adapting Watson to the medical domain. The value Watson provides in EMR summarization is in identifying key relationships among clinical concepts with a granularity that matches clinical decision making, e.g. inferring the purpose of specific medications that a patient is taking for curing a disease or palliative relief of symptoms. II. RELATED WORK Text summarization research goes back to the 1950s [3]. Today, it is generally accepted that a good summary should include the most important information and it should be short [4] [5]. While text summarization is researched extensively, clinical summarization, developing a summary of a patient’s clinical data, is at a nascent stage. The key difference is in the nature of data from which the summary is produced. Unlike in text summarization, a patient’s clinical data is a mix of unstructured plain text and semi-structured data. While the purpose of text summarization is often amorphous, clinical summarization has one clear goal, that is, to help a physician care for a patient, which is the goal of our summarization. The cognitive process in manually summarizing a patient record sheds some light on the requirements for automatic summarization. When asked to create a summary from a previously unseen EMR, it was reported [6] that physicians spend significant time studying clinical notes and labs. Diagnostic procedures and medications are the next most reviewed items. Physicians used a strategy of identify, validate, and ascertain status, as a way to understand patient problems. An automated summary should efficiently provide the information accessed in the manual process, and indeed that is a part of our summarization. In the seminal paper on keeping effective patient records, Weed [7] suggested that medical records should be organized by patient problems. He called medical records so organized as problem-oriented medical records. Diagnosing, treating, and managing a patient’s medical problems should be central to keeping a patient record. Therefore, it makes sense to organize the patient summary around patient problems. Succinct visualization of a patient record can be considered as a form of summarization [8]. AnamneVis [9] framework uses the journalistic approach of Five W’s (who, when, what, where, and why) to show a patient record. A medical incident is shown as a connected chain of symptoms, tests, diagnoses, and treatment. Our goal is to develop information content for summary, but not its visualization per se, and therefore, our summary can drive this or other similar visualization techniques [10]. III. PATIENT RECORD SUMMARIZATION What should be the summarization model since its purpose is to provide a clinician with a quick and easy way to grasp the most important information about a patient? What are the 2014 IEEE 16th International Conference on e-Health Networking, Applications and Services (Healthcom) 978-1-4799-6644-8/14/$31.00 ©2014 IEEE 228
Transcript of Problem-Oriented Patient Record Summary: An Early Report...

Problem-Oriented Patient Record Summary:
An Early Report on a Watson Application
Murthy Devarakonda, Dongyang Zhang, Ching-Huei Tsou, Mihaela Bornea
IBM Research and Watson Group
Yorktown Heights, NY
Abstract — As the use of Electronic Medical Records (EMRs)
becomes widespread, the amount of data in an EMR becomes a
challenge for its comprehension. We developed problem-oriented
EMR summarization to address this issue, as a part of a larger
effort of adapting IBM Watson to the medical domain. The
problem-orientation refers to the central role of a patient's
medical problems in the summary. The summarization uses a
generated problem list, relates these generated medical problems
to relevant clinical data, and organizes the clinical data in a
medically meaningful manner. Watson analytics are used for
creating the summarization. This is a step in building the next
generation EMR, one that is based not on just keeping record but
instead on a conceptual understanding of medicine, thereby
crossing the threshold from record storage to an intelligent entity
for clinical decision making.
Keywords—Electronic Medical Records; Problem-oriented
patient record summary; Summarization; Clinical summarization;
Medical concepts; Watson; UMLS; Text analysis;
I. INTRODUCTION
As Electronic Medical Records (EMRs) are widely
adopted in patient care, the data they store for a patient has also
grown accordingly. A typical EMR contains several hundreds
of unstructured plain text clinical notes, as well as large
amounts of semi-structured data, such as medications ordered,
lab test values, procedures, and vitals. So, the very technology
that allows recording every aspect of patient care is also
making it (quite unintentionally) difficult to comprehend it
quickly. Since manual summarization is time consuming and
prone to errors, there is a pressing need for automatic methods.
Summarization, in particular text summarization, is a well-
known problem in Artificial Intelligence. The task is one of
maximizing the information coverage while minimizing the
redundancy within a limited amount of space. Developing
accurate patient record summaries requires sophisticated
medical semantic analysis of EMR data and is a fertile ground
for applying the IBM Watson technology.
Watson effectively analyzed vast amounts of unstructured
text to answer natural language questions in defeating two all-
time winning champions on the American TV quiz show
Jeopardy! [1] [2]. Since then, we are adapting Watson to the
medical domain. The value Watson provides in EMR
summarization is in identifying key relationships among
clinical concepts with a granularity that matches clinical
decision making, e.g. inferring the purpose of specific
medications that a patient is taking for curing a disease or
palliative relief of symptoms.
II. RELATED WORK
Text summarization research goes back to the 1950s [3].
Today, it is generally accepted that a good summary should
include the most important information and it should be short
[4] [5]. While text summarization is researched extensively,
clinical summarization, developing a summary of a patient’s
clinical data, is at a nascent stage. The key difference is in the
nature of data from which the summary is produced. Unlike in
text summarization, a patient’s clinical data is a mix of
unstructured plain text and semi-structured data. While the
purpose of text summarization is often amorphous, clinical
summarization has one clear goal, that is, to help a physician
care for a patient, which is the goal of our summarization.
The cognitive process in manually summarizing a patient
record sheds some light on the requirements for automatic
summarization. When asked to create a summary from a
previously unseen EMR, it was reported [6] that physicians
spend significant time studying clinical notes and labs.
Diagnostic procedures and medications are the next most
reviewed items. Physicians used a strategy of identify, validate,
and ascertain status, as a way to understand patient problems.
An automated summary should efficiently provide the
information accessed in the manual process, and indeed that is
a part of our summarization.
In the seminal paper on keeping effective patient records,
Weed [7] suggested that medical records should be organized
by patient problems. He called medical records so organized as
problem-oriented medical records. Diagnosing, treating, and
managing a patient’s medical problems should be central to
keeping a patient record. Therefore, it makes sense to organize
the patient summary around patient problems.
Succinct visualization of a patient record can be
considered as a form of summarization [8]. AnamneVis [9]
framework uses the journalistic approach of Five W’s (who,
when, what, where, and why) to show a patient record. A
medical incident is shown as a connected chain of symptoms,
tests, diagnoses, and treatment. Our goal is to develop
information content for summary, but not its visualization per
se, and therefore, our summary can drive this or other similar
visualization techniques [10].
III. PATIENT RECORD SUMMARIZATION
What should be the summarization model since its purpose
is to provide a clinician with a quick and easy way to grasp the
most important information about a patient? What are the
2014 IEEE 16th International Conference on e-Health Networking, Applications and Services (Healthcom)
978-1-4799-6644-8/14/$31.00 ©2014 IEEE 228

semantic elements in this model where the Watson technology
plays an important role? This section discusses these topics.
An approach to clinical summarization involving
increasingly sophisticated abstractions of aggregation,
organization, reduction and/or transformation, interpretation,
and synthesis is proposed in [11]. Such a linear abstraction
works well for a lab or a single patient problem, but a model
for the extensive collection of data types found in a typical
EMR should include semantic relationships that exist among
various data types. For instance, a lab may be associated with a
problem in the sense that it is indicative of the problem status.
So, our model consists of multiple types of clinical data, as
well as relationships among the data. We group the elements of
the data aggregates in a clinically meaningful way. Numerical
data is interpreted and presented concisely, and detailed data is
only one or two clicks away. Details are described below.
A. Summarization Model
Since a patient record contains various collections of data
about a patient and their care, i.e. problems, medications, labs,
procedures, allergies, and so on, the natural way to achieve the
coverage and brevity as needed for summarization is to start
with aggregates of these collections, which we call clinical
data aggregates of a patient.
Elements of each of these aggregates may themselves be
summarized to some level of abstraction as conceptualized in
[11]. For example, results of a lab test may be organized,
transformed and interpreted such that the summary shows the
latest value and an indication as to whether it is now, or has
ever been, out of the normal range. By clicking on it (as
explained later) a detailed timeline can be seen with abnormal
values highlighted.
The next key part of our summarization is the clinical
relationships, which identify semantic relations between the
elements of the aggregates. For example, a problem is treated
by one or more medications. Neither the problem data
aggregate nor the medications data aggregate contains this
important semantic association. These relationships are not
directly present in an EMR, but they are the result of a
physician’s judgment. As described later, we apply the Watson
technology to identify such semantic relations.
The next element of the model is the similarity of elements
in a data aggregate. The nearness attribute identifies how
closely an element is related to the other elements of the
aggregate. For example, for the medications aggregate, the
clinically relevant feature space for determining the nearness
consists of the pharmacologic mechanisms of a medication and
the classes of pharmacologic effects on human physiology.
This is an example of how our summarization determines the
clinically meaningful grouping of aggregates.
One of the key data aggregates is the patient encounter
clinical notes, i.e. clinician written notes for patient contact
points. A clinician may be a primary care physician, specialist,
emergency medicine doctor, or a nurse. Each contact results in
a clinical note being written. Thus a clinical note and a patient
encounter are one to one. The encounters, and therefore the
clinical notes, need to be categorized by the practice for
subsequent reference, e.g. it would help answer the question,
when did the patient last see a cardiologist? While the clinical
notes are a significant part of an EMR, the practice and
specialty data is missing in the header of a clinical note,
especially when the service is provided by a physician from an
outside clinic. So, our summarization involves analytics to
identify this missing data and then use it to categorize clinical
notes (and thus encounters).
Yet another element of the summarization which we have
partially implemented is a filter that determines the data to
show and/or prioritize based on the specialty of the clinician.
For example, a cardiologist may want to see only heart related
problems, medications, labs, and so on, or may want this data
prioritized over the rest.
B. Problem-Oriented Summary
The central aggregate of this summarization is a generated
problem list, and hence we refer to this summarization as the
problem-oriented patient summary. The problem list, which is
a list of the most important medical disorders of a patient that
require care and treatment [7], is abstracted or “generated” by
our application from the clinical notes text and other data in the
patient’s EMR. This is different from (and more accurate than)
the data in the problems section of an EMR, which is typically
entered by the clinical staff (and not curated by physicians,
hence not consistently reliable). The details of our problem list
generation are beyond the scope of this paper, but we note that
the recall and precision of the generated problem list are far
higher than the entered problem list based on the ground truth
created by medical experts on a set of actual patient records.
Navigation to other clinical aggregates works best from
the problems list aggregate because all the clinical relationships
start with it. For navigational purposes, the other aggregates are
secondary to the problem list. It is expected that a physician
would start with the problem list and then explore the other
data aggregates.
The problem-oriented summarization model described so
far is shown in Figure 1. Notice the clinical data aggregates of
the summary, the centrality of the problem list, and the clinical
relationships of a problem to other clinical data. The value of
such a summarization is the ability to see the most relevant
Figure 1 Summarization model showing generated problems list,
the other data aggregates, and clinical relationships among them.
2014 IEEE 16th International Conference on e-Health Networking, Applications and Services (Healthcom)
229
patient data from a problem perspective. It is, however,
possible to consider more than one problem at a time, and in
that case, the relationships would represent the “union” of
relationships.
Our patient record summarization consists of the following
data aggregates:
• Generated problem list
• Medications
• Lab tests
• Procedures
• Vitals
• Timeline of patient encounters
• Social history, allergies, and demographics
Summarization automatically generates the following clinical
semantics:
• Relationships between the problem list entries and the
elements of the other clinical data aggregates
• Clinically meaningful grouping of elements in each
data aggregate
• Categorization of patient encounters based on the
physician specialty
• Filtered and/or prioritized summary data based on the
specialty of the physician using the summary
C. Visualization of Patient Record Summarization
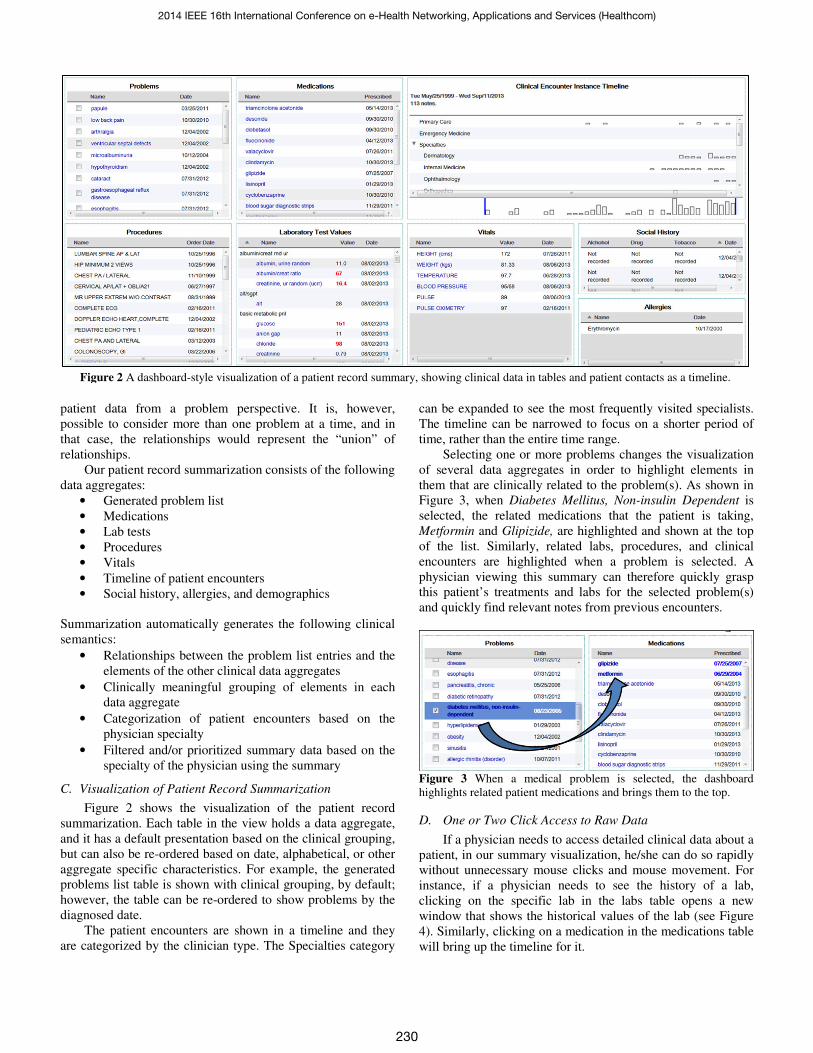
Figure 2 shows the visualization of the patient record
summarization. Each table in the view holds a data aggregate,
and it has a default presentation based on the clinical grouping,
but can also be re-ordered based on date, alphabetical, or other
aggregate specific characteristics. For example, the generated
problems list table is shown with clinical grouping, by default;
however, the table can be re-ordered to show problems by the
diagnosed date.
The patient encounters are shown in a timeline and they
are categorized by the clinician type. The Specialties category
can be expanded to see the most frequently visited specialists.
The timeline can be narrowed to focus on a shorter period of
time, rather than the entire time range.
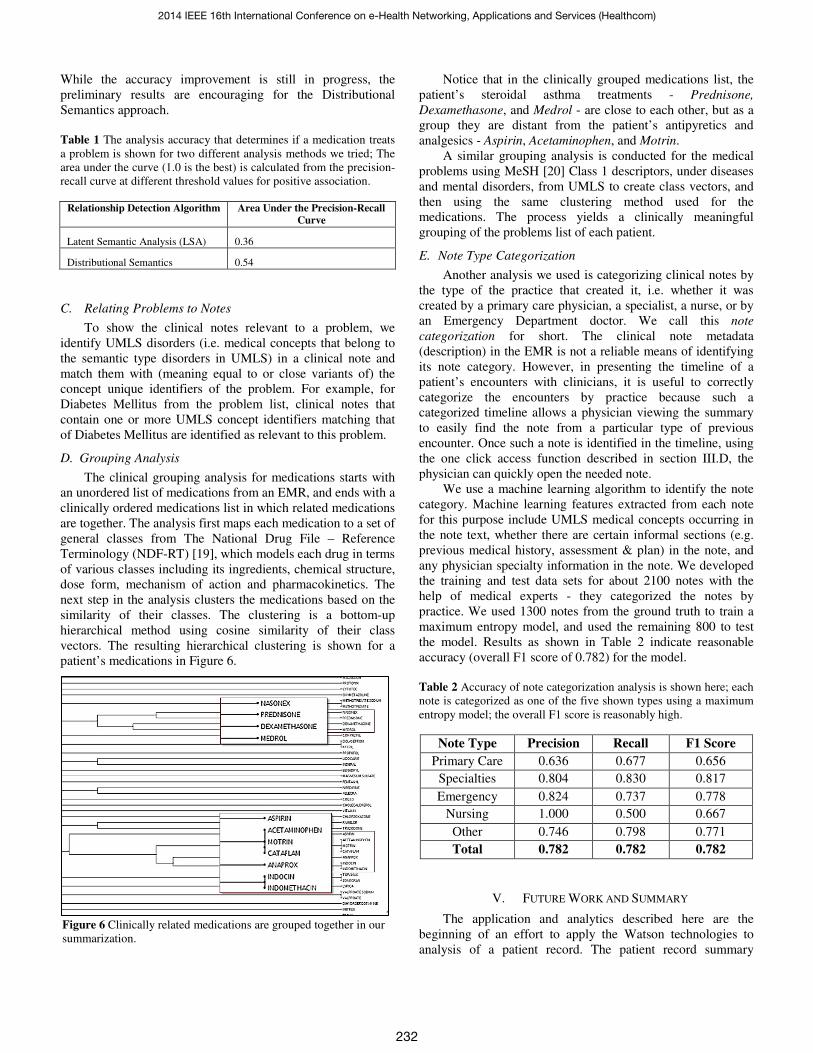
Selecting one or more problems changes the visualization
of several data aggregates in order to highlight elements in
them that are clinically related to the problem(s). As shown in
Figure 3, when Diabetes Mellitus, Non-insulin Dependent is
selected, the related medications that the patient is taking,
Metformin and Glipizide, are highlighted and shown at the top
of the list. Similarly, related labs, procedures, and clinical
encounters are highlighted when a problem is selected. A
physician viewing this summary can therefore quickly grasp
this patient’s treatments and labs for the selected problem(s)
and quickly find relevant notes from previous encounters.
Figure 3 When a medical problem is selected, the dashboard
highlights related patient medications and brings them to the top.
D. One or Two Click Access to Raw Data
If a physician needs to access detailed clinical data about a
patient, in our summary visualization, he/she can do so rapidly
without unnecessary mouse clicks and mouse movement. For
instance, if a physician needs to see the history of a lab,
clicking on the specific lab in the labs table opens a new
window that shows the historical values of the lab (see Figure
4). Similarly, clicking on a medication in the medications table
will bring up the timeline for it.
Figure 2 A dashboard-style visualization of a patient record summary, showing clinical data in tables and patient contacts as a timeline.
2014 IEEE 16th International Conference on e-Health Networking, Applications and Services (Healthcom)
230

Reviewing clinical notes from previous encounters is
sometimes necessary. Clicking on the markers in the
encounters timeline in the summary view opens a window
showing the corresponding clinical note. Relevant clinical
notes for a problem can also be accessed by clicking on the
problem. A list of relevant clinical notes appears, each with a
brief synopsis. The physician can preview the synopsis and
then click to fully open the corresponding clinical note. In the
clinical note, references to the problem are highlighted.
Figure 4 One click access to lab test results (Hemoglobin A1C) to
see data, as well as a plot with reference high and low.
IV. ANALYSIS AND ACCURACY
The summarization described above depends on natural
language processing, information retrieval, and semantic
reasoning techniques from the Watson system. The foundation
of the analysis is the medical concepts identification in an
EMR’s clinical notes and in its metadata, which we will
describe now.
A. UMLS concepts extraction
Our analyses use Unified Medical Language System
(UMLS) [12] defined Concept Unique Identifiers (CUIs) to
reason about medical concepts in the EMR data. UMLS
concepts are now commonly used in medical text analytics, as
it facilitates reasoning in a standardized vocabulary. Published
literature often cites UMLS Metamap software [12] for
mapping plain text to UMLS concepts, however, we use the
Watson NLP and medical concept analytic which offers
significant functional refinement and runtime improvement.
Figure 5 shows a typical clinical note and how the text is
annotated to identify UMLS concepts. The natural language
processing component of Watson includes an English language
parser, a concept mapper, a negation detector, and related
technologies. As seen in the figure, we identify various UMLS
concepts (e.g. Diabetes Mellitus) and their semantic types (e.g.
Disease or Syndrome) [13].
Figure 5 Medical concepts in the EMR clinical notes are identified
as UMLS concepts in preparation for reasoning about the EMR
contents using the UMLS standardized vocabulary.
In addition to the clinical notes text, we identify UMLS
concepts for the entries in the EMR semi-structured data, such
as the name of a medication. Here, there is no sentence
structure and the term represents a certain clinical entity (e.g. a
medication). Therefore, we can directly find the term’s UMLS
concepts in the corresponding semantic type. This helps to find
accurate concept identifiers for the term.
B. Relationship Scoring
As mentioned earlier, an important part of the
summarization is to establish clinically meaningful
relationships between the generated medical problems and the
elements of the other clinical data aggregates. In order to do so,
the summarization needs to quantify pair-wise clinical
association between the problems and medications, labs, and
procedures.
Watson used a combination of rule-based and statistical
approaches to learn relations between entities from the broad-
domain corpora for the Jeopardy game [14]. This approach was
later extended to relations between medical concepts in
adapting Watson to the medical domain [15] and was also
enhanced using the UMLS relations between medical concepts
[12] [16]. In addition, Latent Semantic Analysis [17] applied to
the medical corpus can also provide an association score
between medical concepts. An even more accurate approach
called Distributional Relation Detection, incorporating
Distributional Semantics [18], is being developed for scoring
associations between medical concepts in Watson.
We applied two of these methods, the Latent Semantic
Analysis and the Distributional Semantics, to score relations
between problems and elements from the other clinical
aggregates (e.g. medications). We measured the accuracy of
the two methods by testing with the “ground truth” created by
medical experts for twenty de-identified medical records of
actual patients made available to us by Cleveland Clinic under
an IRB protocol for the study. The medical experts reviewed
the patient medical records and identified the relationships.
Table 1 shows the accuracy of the relations scoring algorithms
for problems and medications compared to the ground truth.
2014 IEEE 16th International Conference on e-Health Networking, Applications and Services (Healthcom)
231
While the accuracy improvement is still in progress, the
preliminary results are encouraging for the Distributional
Semantics approach.
Table 1 The analysis accuracy that determines if a medication treats
a problem is shown for two different analysis methods we tried; The
area under the curve (1.0 is the best) is calculated from the precision-
recall curve at different threshold values for positive association.
Relationship Detection Algorithm Area Under the Precision-Recall
Curve
Latent Semantic Analysis (LSA) 0.36
Distributional Semantics 0.54
C. Relating Problems to Notes
To show the clinical notes relevant to a problem, we
identify UMLS disorders (i.e. medical concepts that belong to
the semantic type disorders in UMLS) in a clinical note and
match them with (meaning equal to or close variants of) the
concept unique identifiers of the problem. For example, for
Diabetes Mellitus from the problem list, clinical notes that
contain one or more UMLS concept identifiers matching that
of Diabetes Mellitus are identified as relevant to this problem.
D. Grouping Analysis
The clinical grouping analysis for medications starts with
an unordered list of medications from an EMR, and ends with a
clinically ordered medications list in which related medications
are together. The analysis first maps each medication to a set of
general classes from The National Drug File – Reference
Terminology (NDF-RT) [19], which models each drug in terms
of various classes including its ingredients, chemical structure,
dose form, mechanism of action and pharmacokinetics. The
next step in the analysis clusters the medications based on the
similarity of their classes. The clustering is a bottom-up
hierarchical method using cosine similarity of their class
vectors. The resulting hierarchical clustering is shown for a
patient’s medications in Figure 6.
Notice that in the clinically grouped medications list, the
patient’s steroidal asthma treatments - Prednisone,
Dexamethasone, and Medrol - are close to each other, but as a
group they are distant from the patient’s antipyretics and
analgesics - Aspirin, Acetaminophen, and Motrin.
A similar grouping analysis is conducted for the medical
problems using MeSH [20] Class 1 descriptors, under diseases
and mental disorders, from UMLS to create class vectors, and
then using the same clustering method used for the
medications. The process yields a clinically meaningful
grouping of the problems list of each patient.
E. Note Type Categorization
Another analysis we used is categorizing clinical notes by
the type of the practice that created it, i.e. whether it was
created by a primary care physician, a specialist, a nurse, or by
an Emergency Department doctor. We call this note
categorization for short. The clinical note metadata
(description) in the EMR is not a reliable means of identifying
its note category. However, in presenting the timeline of a
patient’s encounters with clinicians, it is useful to correctly
categorize the encounters by practice because such a
categorized timeline allows a physician viewing the summary
to easily find the note from a particular type of previous
encounter. Once such a note is identified in the timeline, using
the one click access function described in section III.D, the
physician can quickly open the needed note.
We use a machine learning algorithm to identify the note
category. Machine learning features extracted from each note
for this purpose include UMLS medical concepts occurring in
the note text, whether there are certain informal sections (e.g.
previous medical history, assessment & plan) in the note, and
any physician specialty information in the note. We developed
the training and test data sets for about 2100 notes with the
help of medical experts - they categorized the notes by
practice. We used 1300 notes from the ground truth to train a
maximum entropy model, and used the remaining 800 to test
the model. Results as shown in Table 2 indicate reasonable
accuracy (overall F1 score of 0.782) for the model.
Table 2 Accuracy of note categorization analysis is shown here; each
note is categorized as one of the five shown types using a maximum
entropy model; the overall F1 score is reasonably high.
Note Type Precision Recall F1 Score
Primary Care 0.636 0.677 0.656
Specialties 0.804 0.830 0.817
Emergency 0.824 0.737 0.778
Nursing 1.000 0.500 0.667
Other 0.746 0.798 0.771
Total 0.782 0.782 0.782
V. FUTURE WORK AND SUMMARY
The application and analytics described here are the
beginning of an effort to apply the Watson technologies to
analysis of a patient record. The patient record summary
Figure 6 Clinically related medications are grouped together in our
summarization.
2014 IEEE 16th International Conference on e-Health Networking, Applications and Services (Healthcom)
232

described here includes a generated problem list and clinical
data aggregates such as medications, lab tests, procedures, and
clinical encounter notes. The Watson analytics provide
clinically relevant relationships between problems and the
other clinical data. The analytics also provide a means to group
data aggregates semantically, and to categorize clinical notes
(and therefore, encounters). The Watson analytics are also used
for the problem list generation, but the method is not described
in this paper. The summary can be visualized in a dashboard of
clinical data aggregates and clinical note timelines. The
dashboard also shows semantic relations, grouping, and clinical
note categorization. In addition, it also provides rapid access to
actual notes, and the current and historical values of
medications and labs via a single click in the application. The
intent of the summarization is to help physicians quickly grasp
all of the important aspects of a patient record, with easy access
to details as needed.
The larger goal of this research is to apply Watson
technology to build a clinical decision support system that
works directly with a complete Electronic Medical Record of a
patient. As a near term goal, we will further improve patient
record summarization and conduct experiments to assess the
effectiveness of this record summary in patient care. Improving
patient record summarization is the process of establishing
increasingly richer clinical relationships, including disease
progression and causal associations, in a patient’s EMR. Many
of the Watson technologies, including Deep Question and
Answering, can help develop the necessary algorithms.
VI. ACKNOWLEDGEMENTS
We thank the physicians and IT staff at Cleveland Clinic
who guided definition of the requirements for this application
and provided de-identified EMRs under an IRB protocol for
the study. We also acknowledge the groundbreaking work of
our Watson team colleagues, past and present, which made this
application possible.
VII. REFERENCES
[1] D. Ferrucci, E. Brown, J. Chu-Carroll, J. Fan, D. Gondek, A.
A. Kalyanpur, A. Lally, J. W. Murdock, E. Nyberg, J. Prager,
N. Schlaefer and C. Welty, "Building Watson: An overview of
the DeepQA project," AI Magazine, vol. 31, no. 3, pp. 59-79,
2010.
[2] "This Is Watson," IBM Journal of Research and Development,
vol. 56, no. 3.4, pp. 1:1 - 1:15, 2012.
[3] D. Das and F. T. M. Andre, "A Survey on Automatic Text
Summarization," Carnegie Mellon University, 2007.
[4] R. Alterman, "Understanding and Summarization," Artificial
Intelligence Review, vol. 5, no. 4, pp. 239-254, 1991.
[5] D. R. Radev, E. Hovy and K. McKeown, "Introduction to the
special issue on text summarization," Computational
Linguistics, vol. 28, no. 4, December 2002.
[6] D. Reichert, D. Kaufman, B. Bloxham, H. Chase and N.
Elhadad, "Cognitive Analysis of the Summarization of
Longitudinal Patient Records," in AMIA Annu Symp Proc,
2010.
[7] L. L. Weed, "Medical Records That Guide and Teach," New
England Journel of Medicine, pp. 652-657, March 1968.
[8] C. Plaisant, R. Mushlin, A. Snyder, J. Li, D. Heller and B.
Schneiderman, "LifeLines: Using Visualization to Enhance
Navigation and Analysis of Patient Records," in AMIA Annu
Symp Proc, 1998.
[9] Z. Zhang, F. Ahmed, A. Mittal, I. Ramakrishnan, R. Zhao, A.
Viccellio and K. Mueller, "AnamneVis: A Framework for the
Visualization of Patient History and Medical Diagnostics
Chains," in Workshop on Visual Analytics in Healthcare:
Understanding the Physician Perspective, Providence, RI,
2011.
[10] T. D. Wang, C. Plaisant, A. J. Quinn, R. Stanchak and B.
Shneiderman, "Aligning temporal data by sentinel events:
discovering patterns in electronic health records," in
Proceedings of the ACM SIGCHI Conference on Human
Factors in Computing Systems (CHI '08), 2008.
[11] J. C. Feblowitz, A. Wright, H. Singh, L. Samal and D. F.
Sittig, "Summarization of clinical information: A conceptual
model," Jounral of Biomedical Informatics, vol. 44, pp. 688-
699, 2011.
[12] "UMLS Reference Manual," National Library of Medicine
(US), September 2009. [Online]. Available:
http://www.ncbi.nlm.nih.gov/books/NBK9675/. [Accessed 15
04 2014].
[13] "UMLS Semantic Groups," National Library of Medicine
(US), [Online]. Available:
http://semanticnetwork.nlm.nih.gov/SemGroups/SemGroups.t
xt. [Accessed 15 4 2014].
[14] C. Wang, A. A. Kalyanpur, J. Fan, B. Boguraev and D.
Gondek, "Relation Extraction and Scoring in DeepQA," IBM
Journal of Research and Development, 2012.
[15] D. Ferrucci, A. Levas, S. Bagchi, D. Gondek and R. T.
Mueller, "Watson: Beyond Jeopardy!," Artificial Intelligence,
pp. 93-105, 2013.
[16] C. Wang and J. Fan, "Medical Relation Extraction with
Manifold Models," in The 52nd Annual Meeting of the
Association for Computational Linguistics (ACL 2014), 2014.
[17] S. Deerwester, D. T. Susan, G. W. Furnas, T. K. Landauer and
R. Harshman, "Indexing by Latent Semantic Analysis,"
Journal of the American Society for Information Science, vol.
41, no. 6, pp. 391-407, September 1990.
[18] A. Gliozzo, "Beyond Jeopardy! Adapting Watson to New
Domains Using Distributional Semantics," [Online].
Available:
https://www.icsi.berkeley.edu/icsi/sites/default/files/events/tal
k_20121109_gliozzo.pdf. [Accessed 18 04 2014].
[19] "National Drug File - Reference Terminology (NDF-RT),"
National Library of Medicine (US), [Online]. Available:
http://www.nlm.nih.gov/research/umls/sourcereleasedocs/curr
ent/NDFRT. [Accessed 15 04 2014].
[20] "MeSH," National Library of Medicine (US), [Online].
Available: http://www.nlm.nih.gov/mesh/meshhome.html.
[Accessed 16 04 2014].
2014 IEEE 16th International Conference on e-Health Networking, Applications and Services (Healthcom)
233