Probability & Using Frequency Distributions Chapters 1 & 6 Homework: Ch 1: 9-12 Ch 6: 1, 2, 3, 8, 9,...
34
Probability & Using Frequency Distributions Chapters 1 & 6 Homework: Ch 1: 9-12 Ch 6: 1, 2, 3, 8, 9, 14
-
date post
20-Dec-2015 -
Category
Documents
-
view
221 -
download
1
Transcript of Probability & Using Frequency Distributions Chapters 1 & 6 Homework: Ch 1: 9-12 Ch 6: 1, 2, 3, 8, 9,...
Probability &Using Frequency Distributions
Chapters 1 & 6
Homework: Ch 1: 9-12
Ch 6: 1, 2, 3, 8, 9, 14
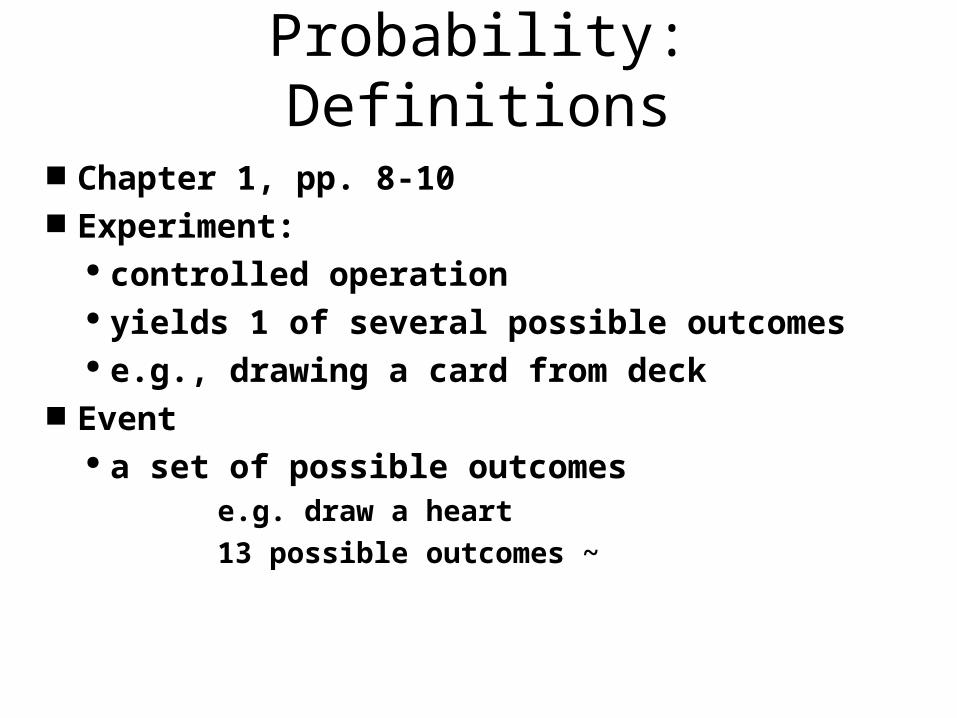
Probability: Definitions
Chapter 1, pp. 8-10 Experiment:
controlled operation yields 1 of several possible outcomes e.g., drawing a card from deck
Event a set of possible outcomes
e.g. draw a heart
13 possible outcomes ~
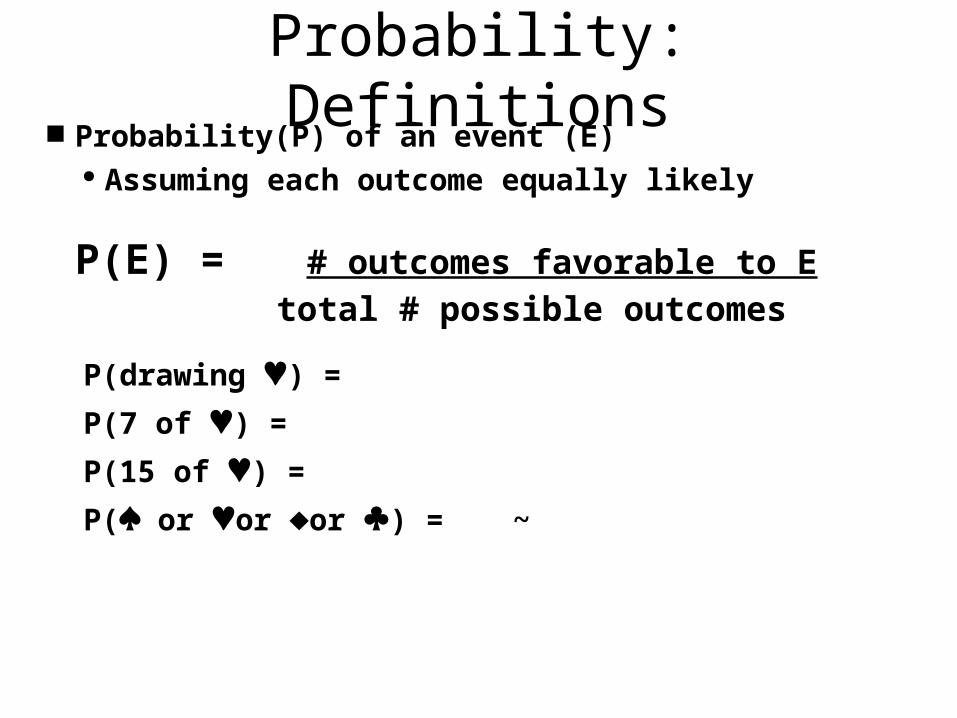
Probability: Definitions Probability(P) of an event (E)
Assuming each outcome equally likely
P(E) = # outcomes favorable to E total # possible outcomes
P(drawing ) =
P(7 of ) =
P(15 of ) =
P(or or or ) = ~
Probability: 3 important characteristics
1. Probability event cannot occur is 0
2. P(E) that must occur = 1
3. 0 P(E) 1, probabilities lie b/n 0 & 1 ~
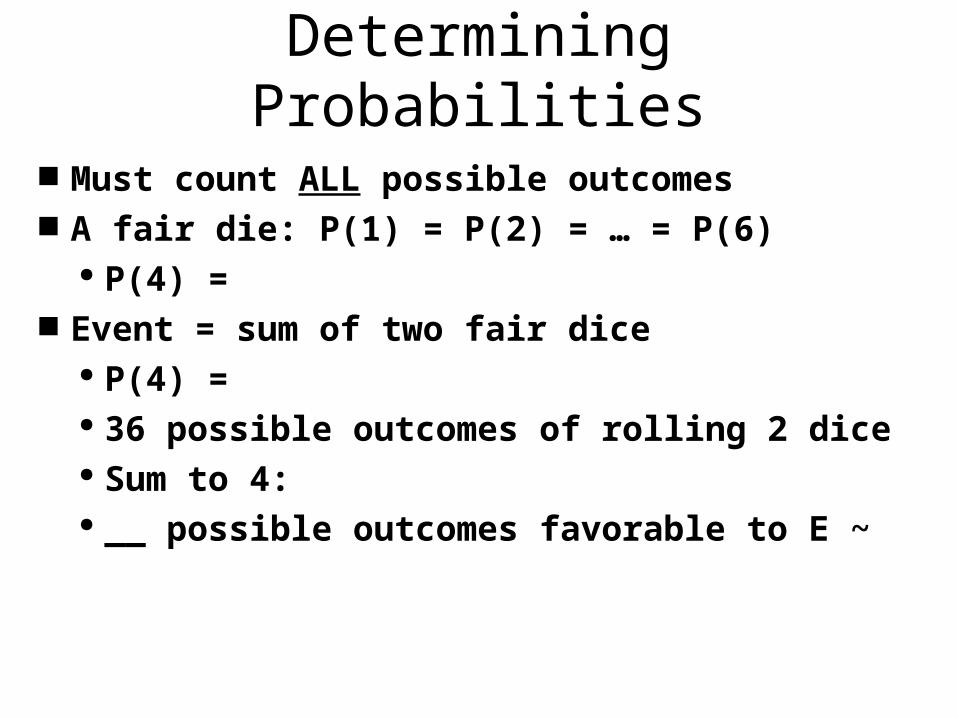
Determining Probabilities
Must count ALL possible outcomes A fair die: P(1) = P(2) = … = P(6)
P(4) = Event = sum of two fair dice
P(4) = 36 possible outcomes of rolling 2 dice Sum to 4: __ possible outcomes favorable to E ~
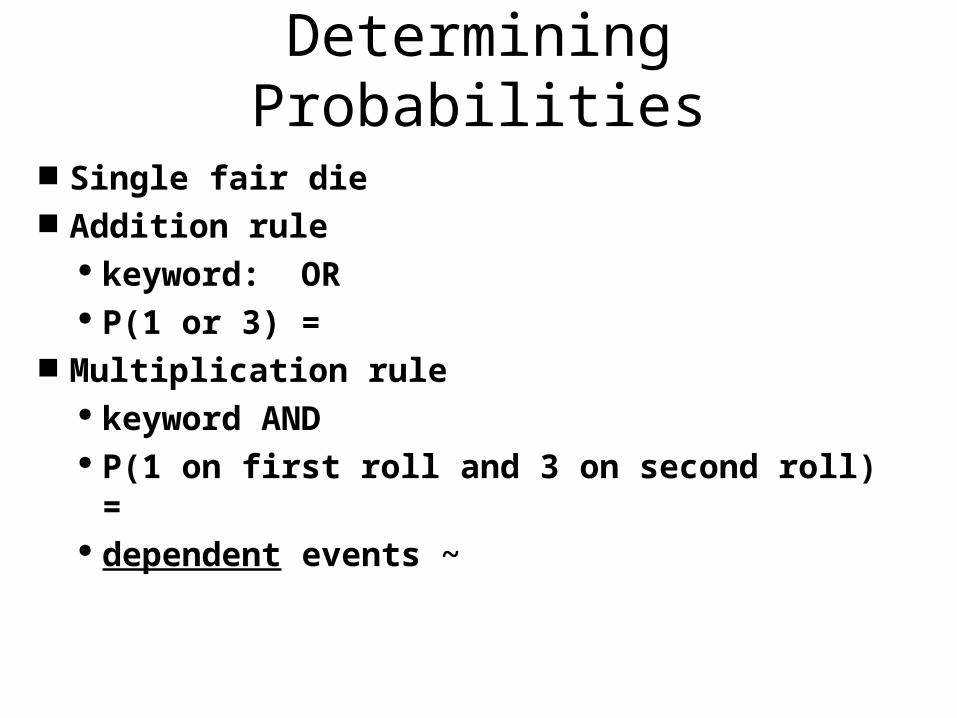
Determining Probabilities
Single fair die Addition rule
keyword: OR P(1 or 3) =
Multiplication rule keyword AND P(1 on first roll and 3 on second roll) = dependent events ~
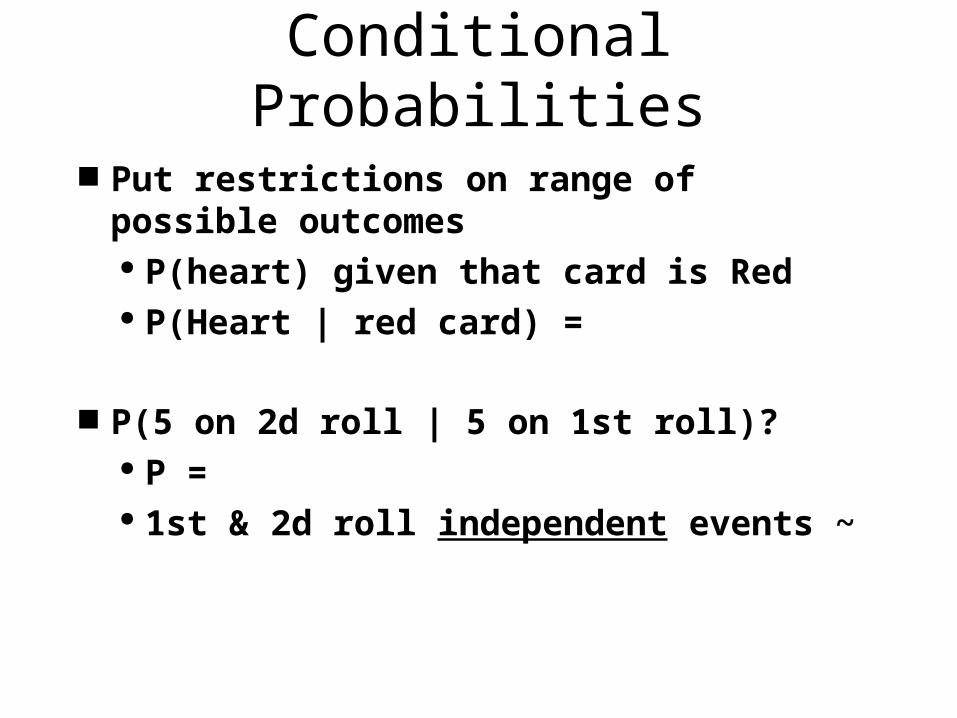
Conditional Probabilities
Put restrictions on range of possible outcomes P(heart) given that card is Red P(Heart | red card) =
P(5 on 2d roll | 5 on 1st roll)? P = 1st & 2d roll independent events ~
Points in Distributions
Up to now describing distributions Comparing scores from different
distributions Need to make equivalent comparisons Percentile rank & standard scores z scores ~
Percentiles & Percentile Rank Percentile
score below which a specified percentage of scores in the distribution fall
start with percentage ---> score Percentile rank
Per cent of scores a given score start with score ---> percentage
Score: a value of any variable ~

Percentiles E.g., test scores
30th percentile = (A) 46; (B) 22
90th percentile = (A) 56; (B) 46 ~
A58565454525048464442
B50463230302323222120
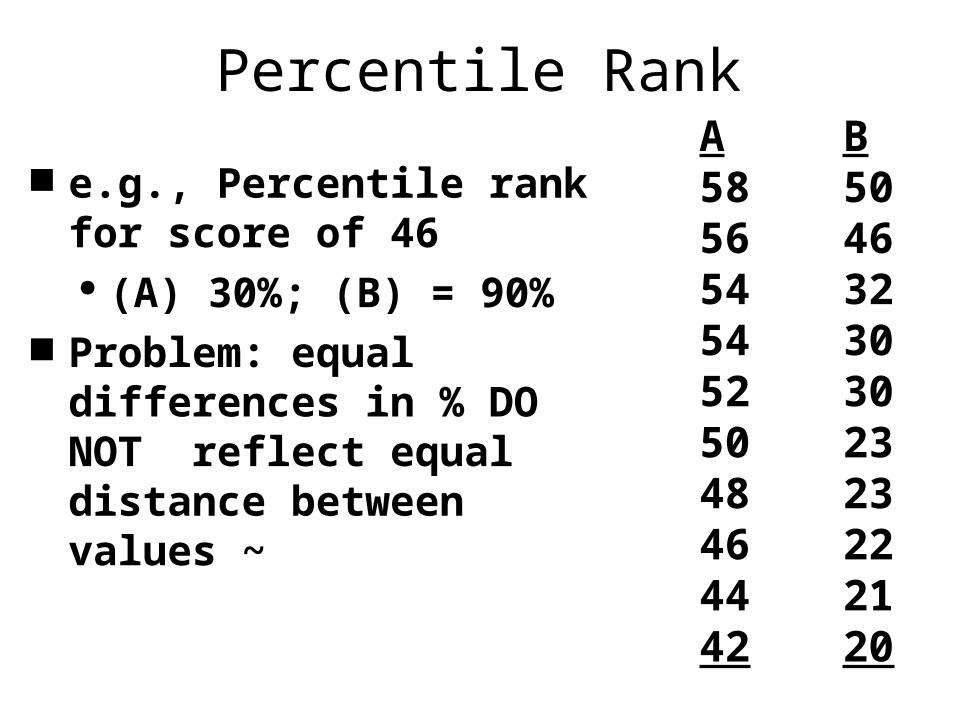
Percentile Rank
e.g., Percentile rank for score of 46 (A) 30%; (B) = 90%
Problem: equal differences in % DO NOT reflect equal distance between values ~
A58565454525048464442
B50463230302323222120
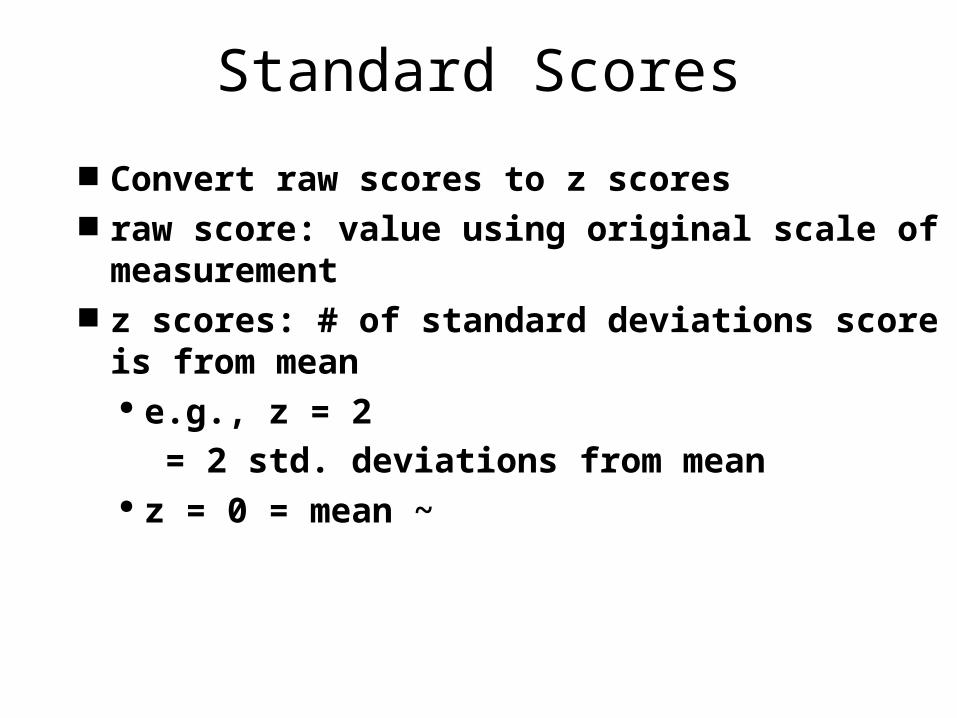
Standard Scores
Convert raw scores to z scores raw score: value using original scale of
measurement z scores: # of standard deviations score is from
mean e.g., z = 2
= 2 std. deviations from mean z = 0 = mean ~
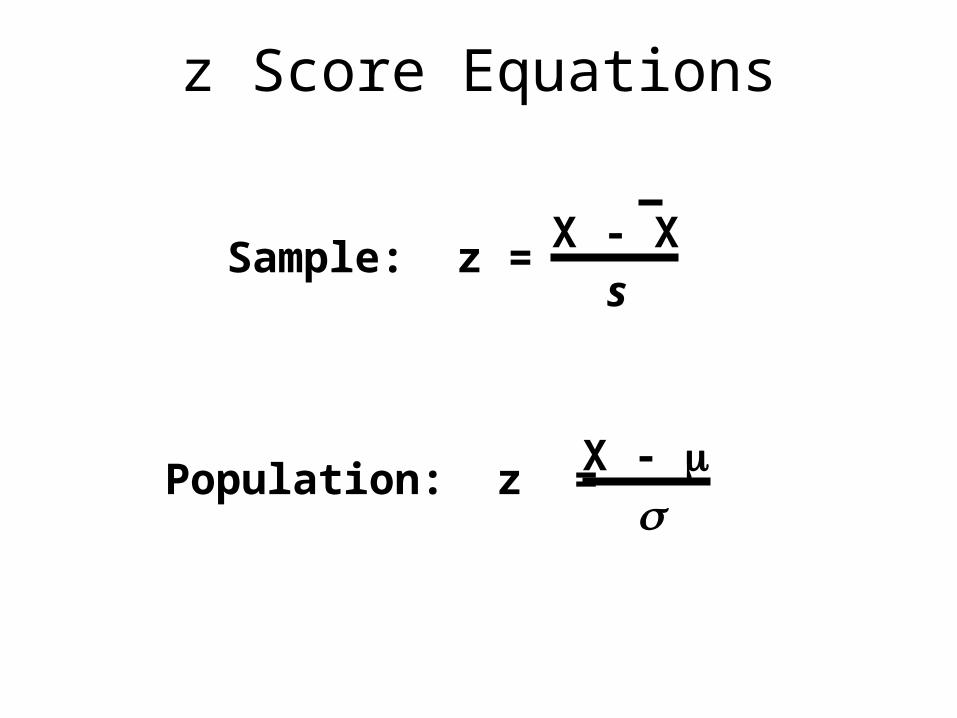
z Score Equations
Sample: z =
Population: z =
X - Xs
X -
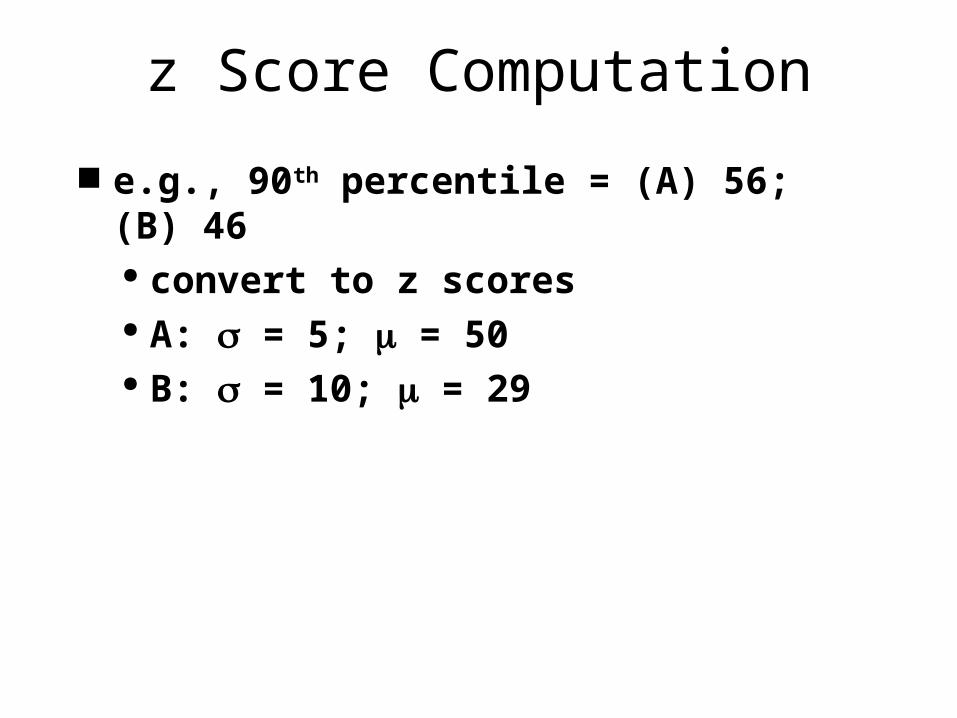
z Score Computation
e.g., 90th percentile = (A) 56; (B) 46 convert to z scores A: = 5; = 50 B: = 10; = 29
Areas Under Distributions
Area = frequency Relative area
total area = ____
= proportion of individual values in area under curve ~
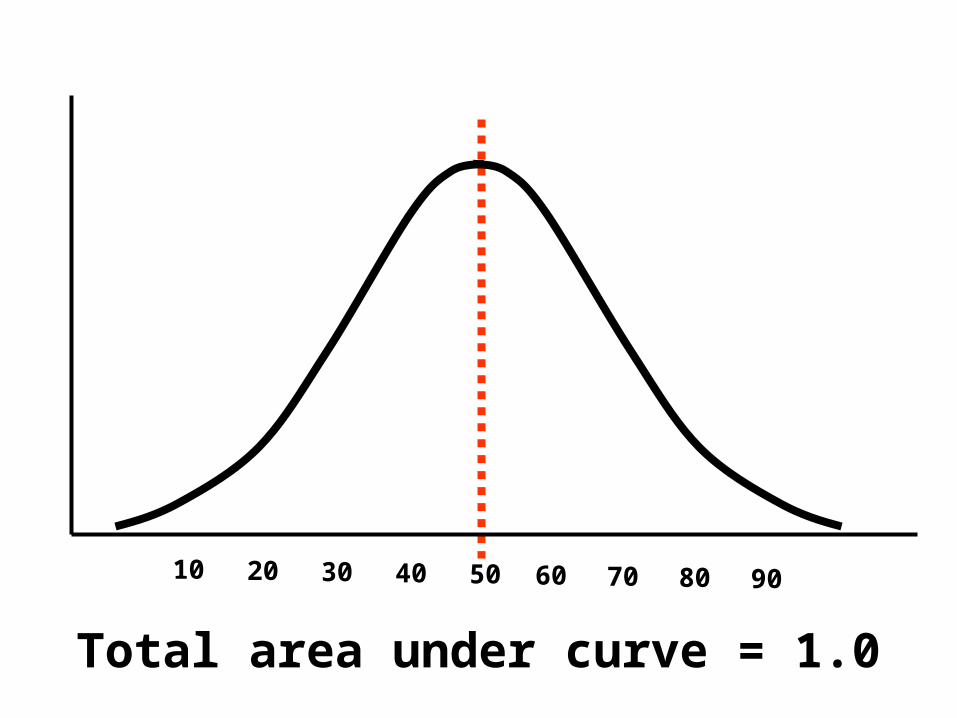
Total area under curve = 1.0
10 20 30 40 50 60 70 80 90
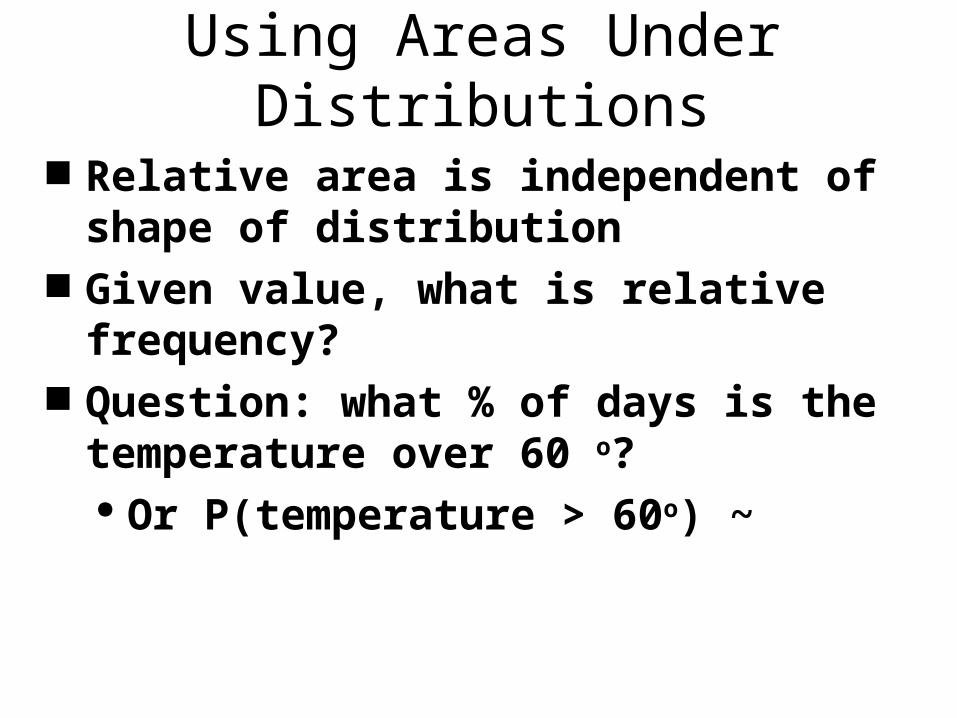
Using Areas Under Distributions
Relative area is independent of shape of distribution
Given value, what is relative frequency? Question: what % of days is the
temperature over 60 o? Or P(temperature > 60o) ~
10 20 30 40 50 60 70 80 90
Average Daily Temperature (oF)
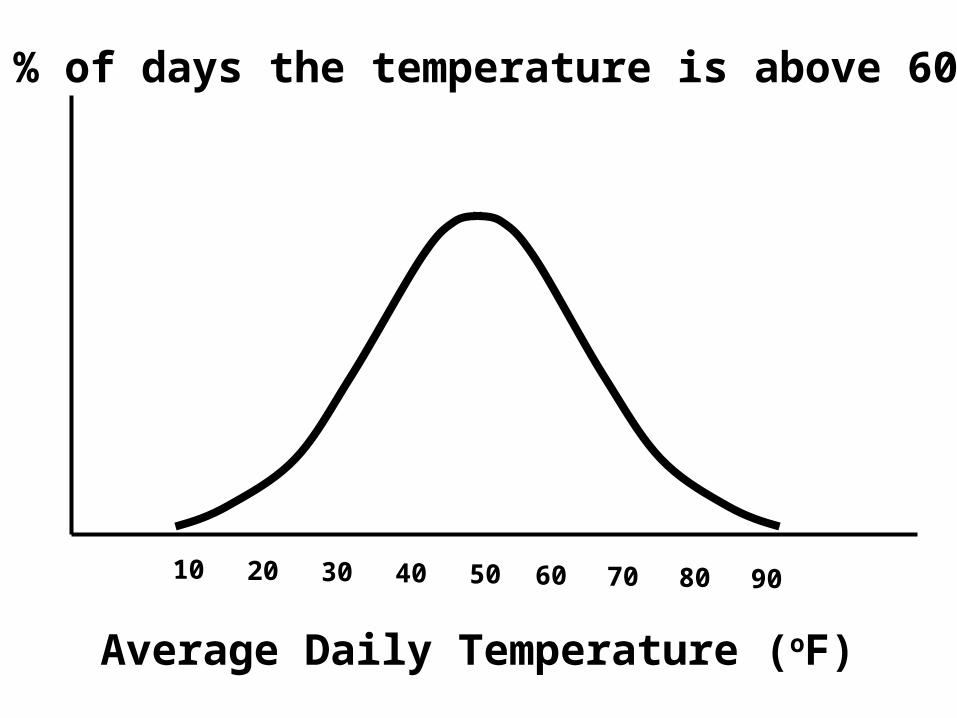
% of days the temperature is above 60 o
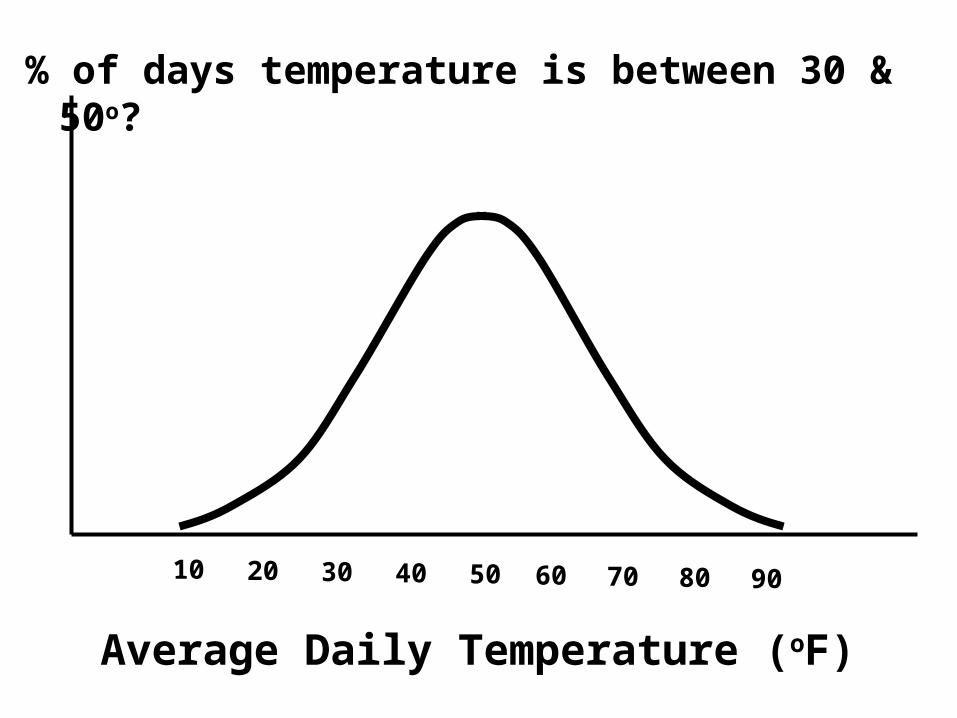
10 20 30 40 50 60 70 80 90
Average Daily Temperature (oF)
% of days temperature is between 30 & 50o?
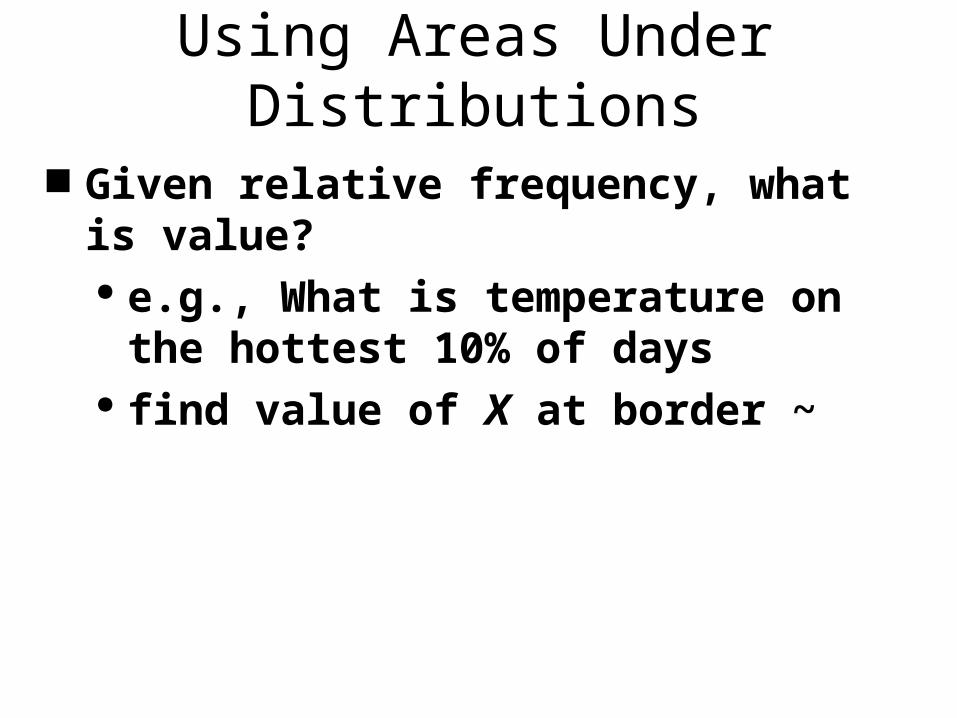
Using Areas Under Distributions
Given relative frequency, what is value? e.g., What is temperature on the
hottest 10% of days find value of X at border ~
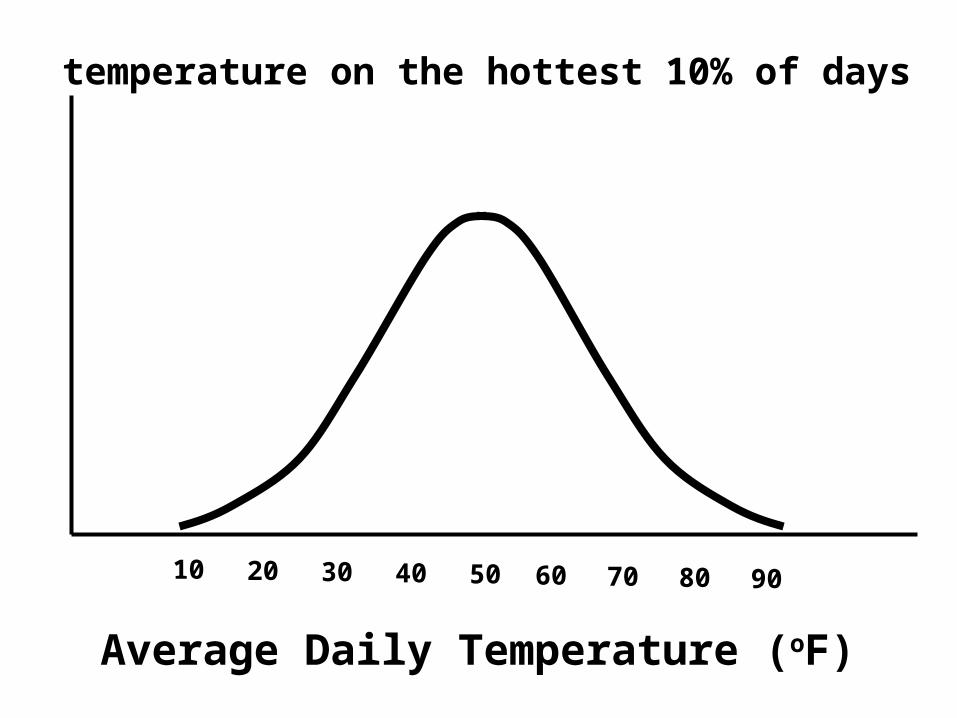
10 20 30 40 50 60 70 80 90
Average Daily Temperature (oF)
temperature on the hottest 10% of days
Areas Under Normal Curves
Many variables normal distribution Normal distribution completely
specified by 2 numbers mean & standard deviation
Many other normal distributions have different & ~
Areas Under Normal Curves Unit Normal Distribution
based on z scores
= 0
= 1 e.g., z = -2
relative areas under normal distribution always the same precise areas from Table A.1 ~

Areas Under Normal Curves
1 20-1-2
f
standard deviations
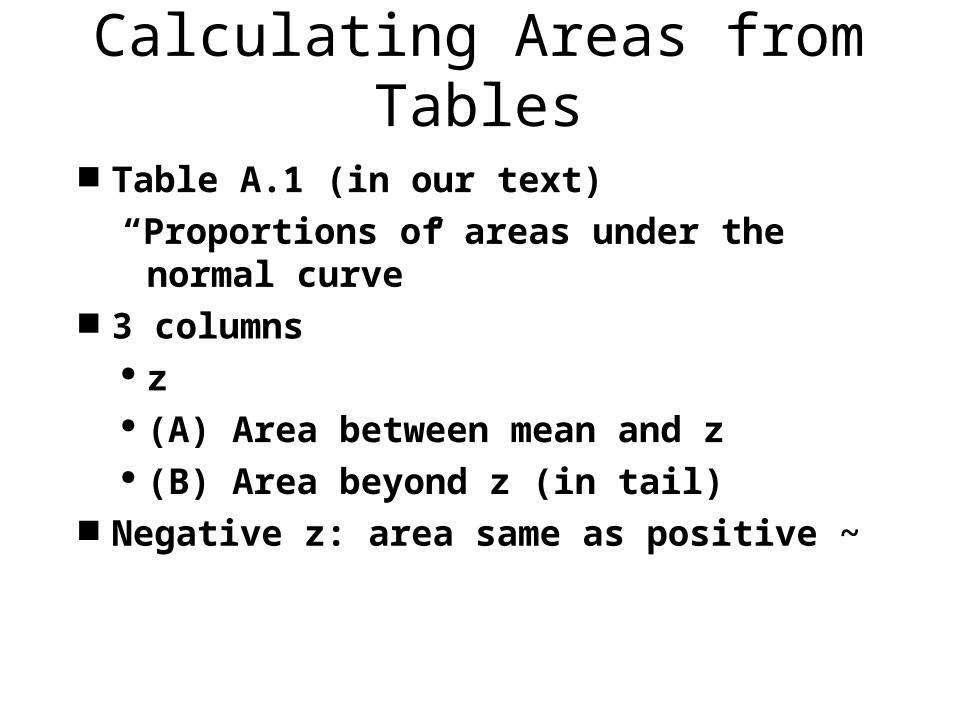
Calculating Areas from Tables
Table A.1 (in our text)
“Proportions of areas under the normal curve”
3 columns z (A) Area between mean and z (B) Area beyond z (in tail)
Negative z: area same as positive ~
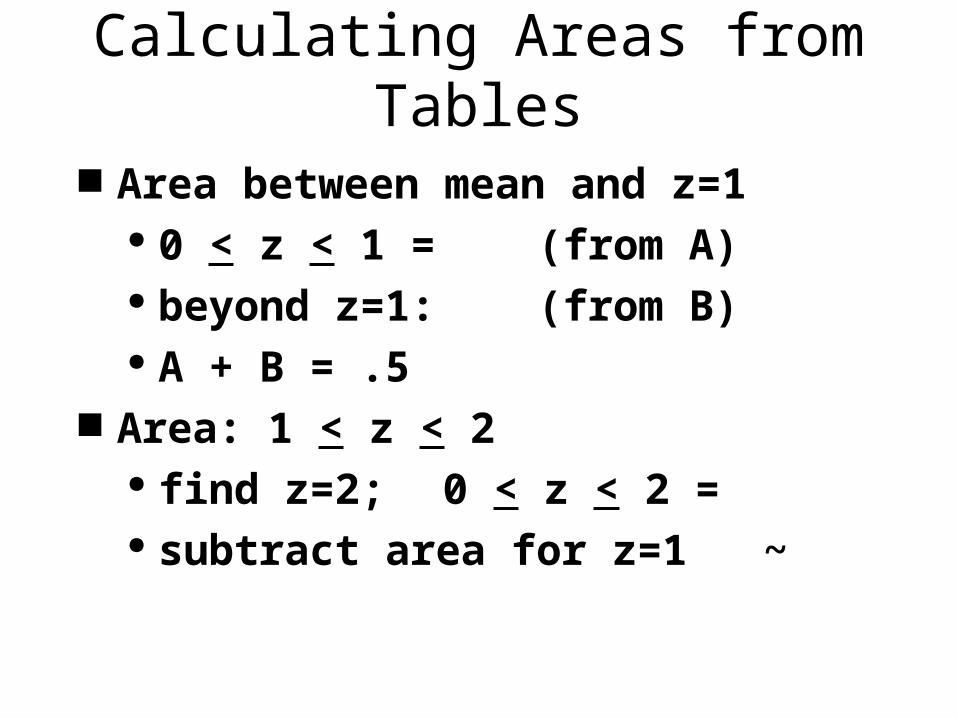
Calculating Areas from Tables
Area between mean and z=1 0 < z < 1 = (from A) beyond z=1: (from B) A + B = .5
Area: 1 < z < 2 find z=2; 0 < z < 2 = subtract area for z=1 ~
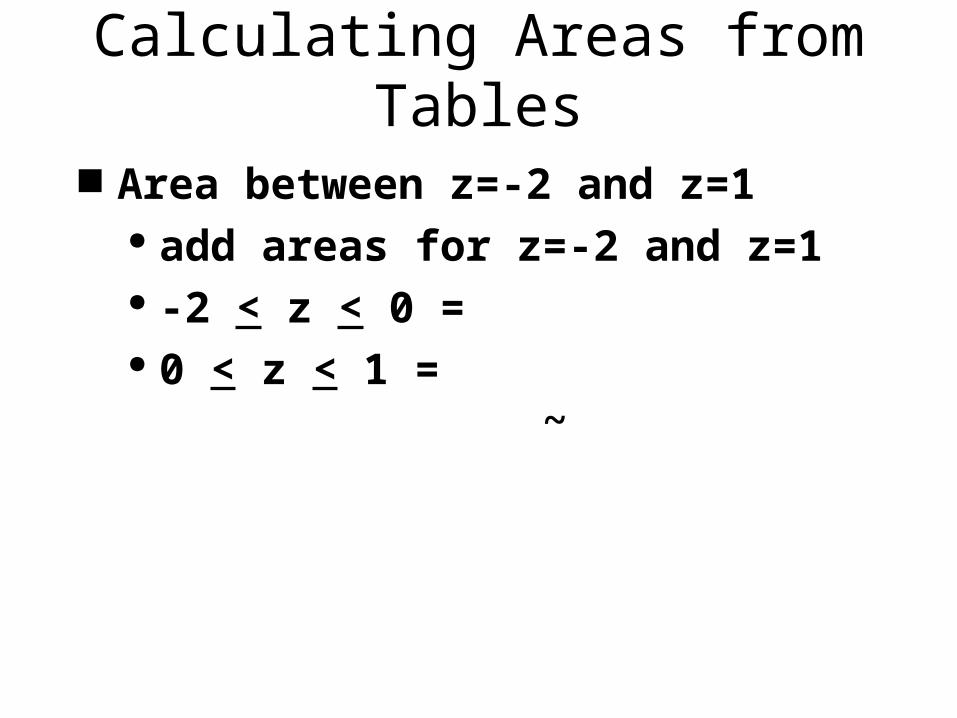
Calculating Areas from Tables
Area between z=-2 and z=1 add areas for z=-2 and z=1 -2 < z < 0 = 0 < z < 1 = ~
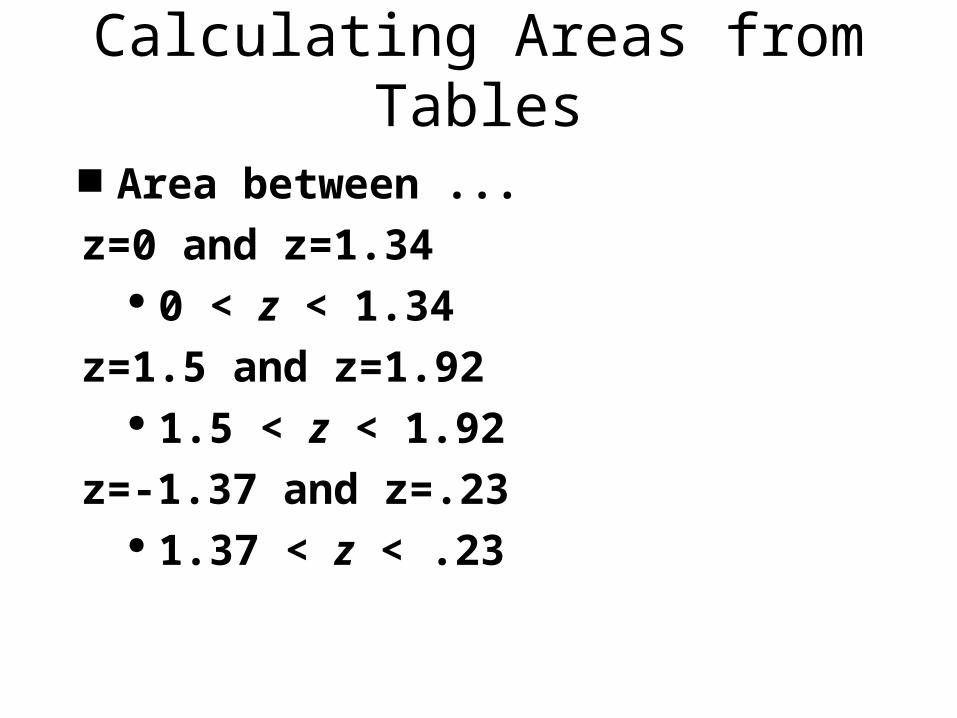
Calculating Areas from Tables
Area between ...
z=0 and z=1.34 0 < z < 1.34
z=1.5 and z=1.92 1.5 < z < 1.92
z=-1.37 and z=.23 1.37 < z < .23
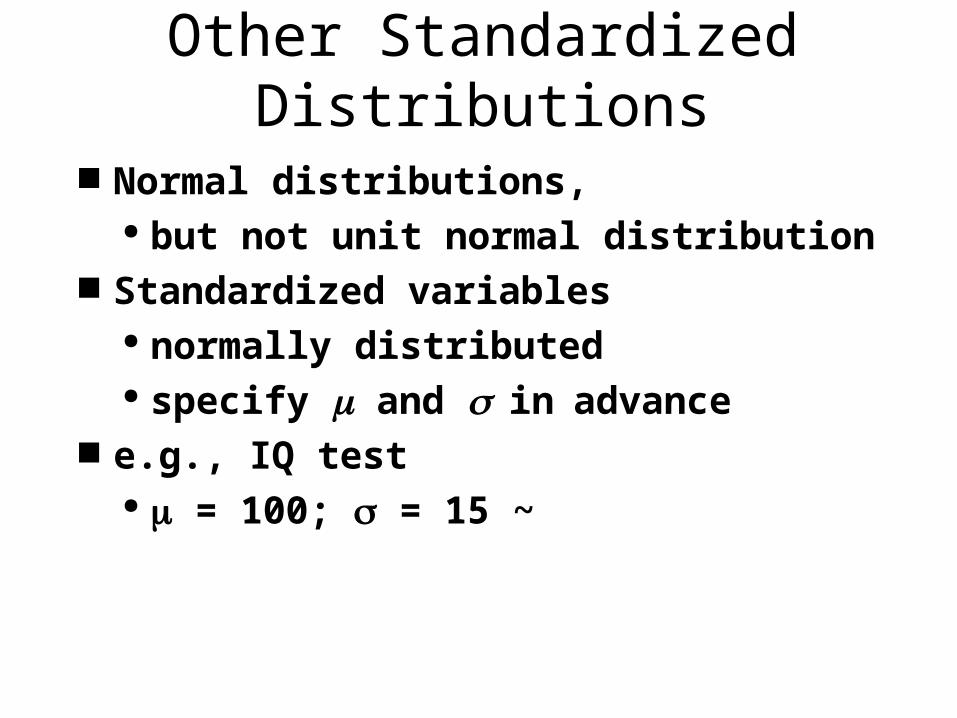
Other Standardized Distributions
Normal distributions, but not unit normal distribution
Standardized variables normally distributed specify and inadvance
e.g., IQ test = 100; = 15 ~

Other Standardized Distributions
115 1301008570
f
IQ Scores
1 20-1-2z scores
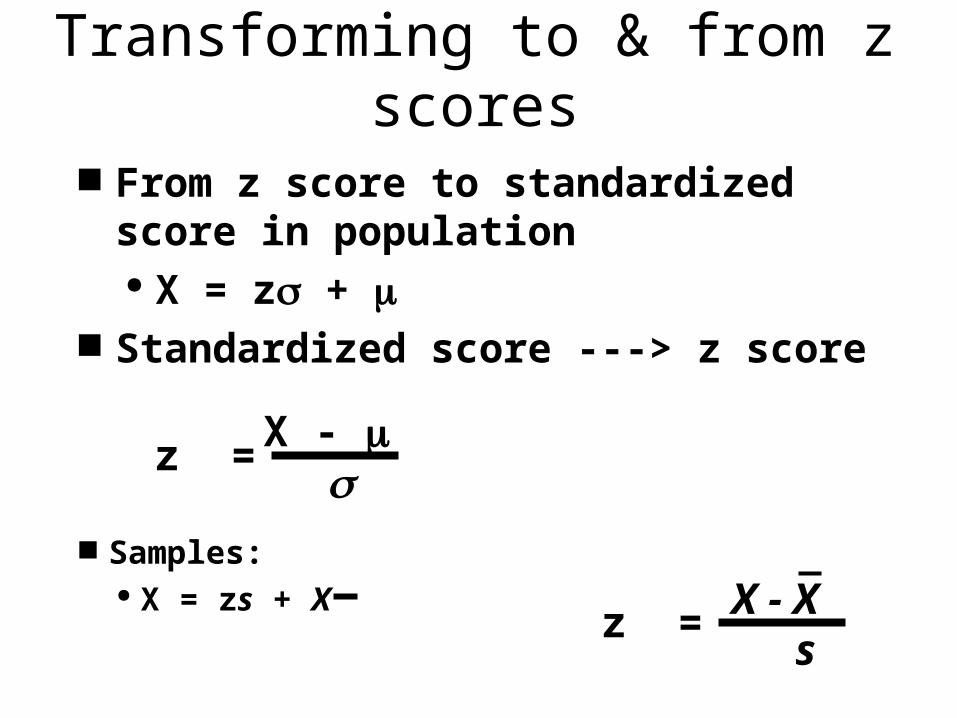
Transforming to & from z scores
From z score to standardized score in population X = z +
Standardized score ---> z score
z = X -
z = X - Xs
Samples: X = zs + X
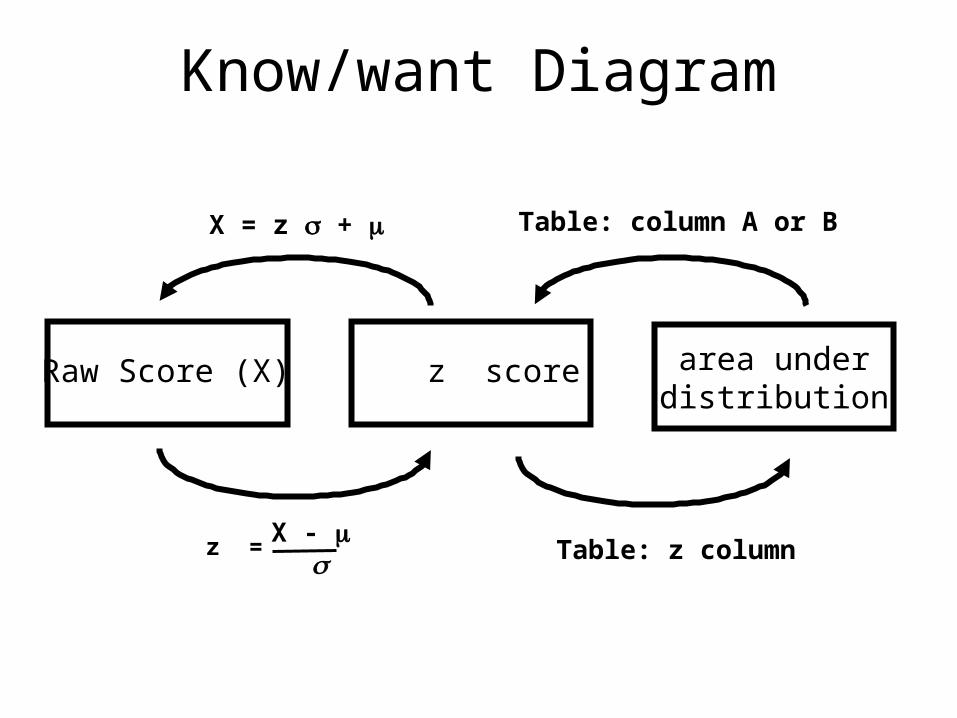
Know/want Diagram
Raw Score (X) z score area under distribution
z = X -
X = z + Table: column A or B
Table: z column
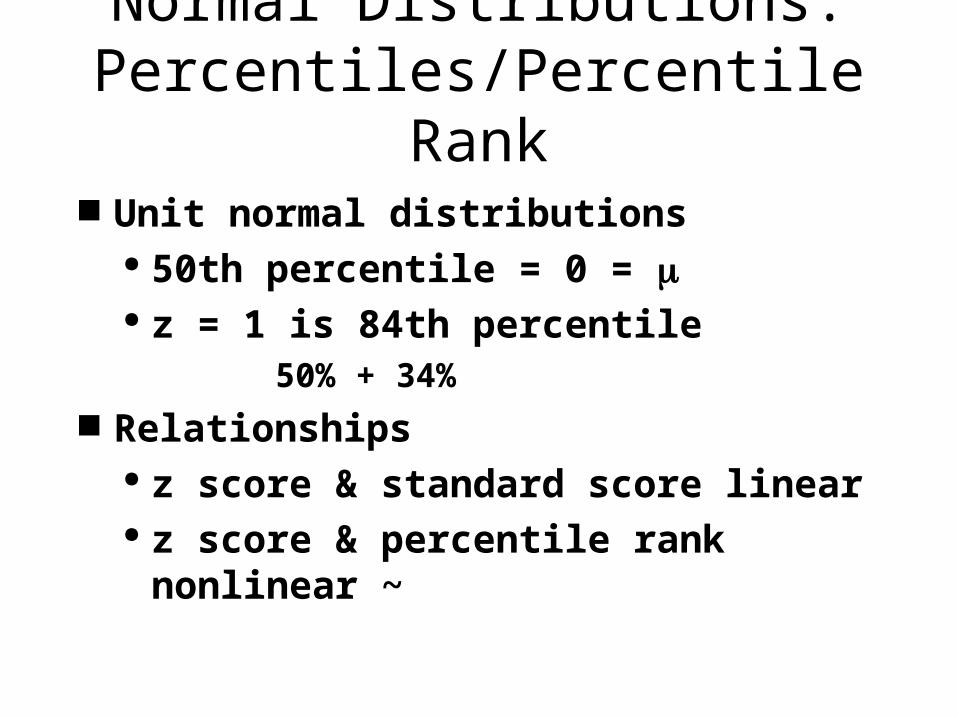
Normal Distributions: Percentiles/Percentile Rank
Unit normal distributions 50th percentile = 0 = z = 1 is 84th percentile
50% + 34% Relationships
z score & standard score linear z score & percentile rank nonlinear ~
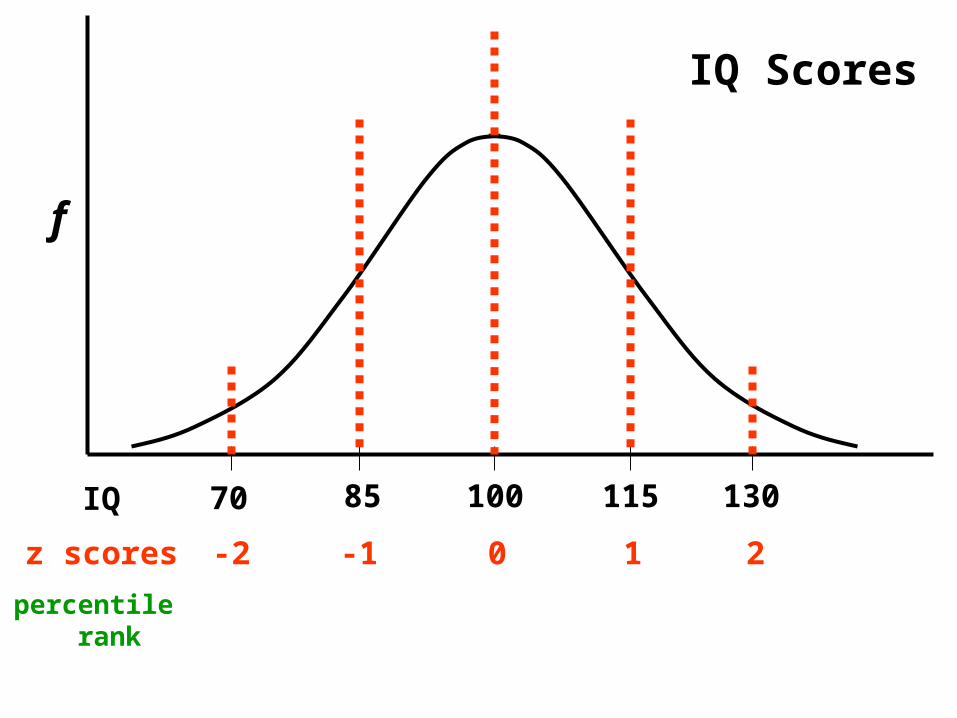
115 1301008570
f
IQ Scores
1 20-1-2z scores
percentile rank
IQ