Probability Forecasting, Probability Evaluation, and Scoring Rules: Expanding the Toolbox Robert L....
23
Probability Forecasting, Probability Evaluation, and Scoring Rules: Expanding the Toolbox Robert L. Winkler Duke University Subjective Bayes Workshop – Warwick December 2009
-
date post
20-Dec-2015 -
Category
Documents
-
view
224 -
download
0
Transcript of Probability Forecasting, Probability Evaluation, and Scoring Rules: Expanding the Toolbox Robert L....

Probability Forecasting, Probability Evaluation, and Scoring Rules:
Expanding the Toolbox
Robert L. Winkler
Duke University
Subjective Bayes Workshop – Warwick
December 2009

Outline of Presentation• Probability Forecasting• Why Probability Evaluation?• Scoring Rules: Incentives and Evaluation• Some Issues and Recent Developments
• Extended Families of Scoring Rules
• Relative Evaluation
• Taking Order into Account
• Probability Assessment vs. Quantile Assessment
• Calibration, Sharpness, etc. – What Matters?
• Competition among Forecasters
• Concluding Thoughts

Probability Forecasting
• Formal representation of uncertainty
• Various sources of forecasts – all with some subjective element• Subjective forecasts from “experts”• Probabilities from Bayesian analyses• Probabilities from other modeling

Why Probability Evaluation?
• Recognition of importance of uncertainty• Some increase in use of probability forecasts• Concern about levels of risk
• Importance of ex post evaluation• Connection of forecasts with reality• Concern about impact of “poor” forecasts• Improvement of future probability forecasts• Identification of better probability forecasters• Keep forecasters honest (accountability!)

Scoring Rules
• As incentives• Strictly proper scoring rules • Maximizing Expected Score honest reporting,
incentive for “better” forecasts
• As evaluation measures• Overall measures of accuracy• Decompositions for specific characteristics
• Commonly-used rules
• Some background, historical notes

Quadratic Spherical Logarithmic
0.4
0.5
0.6
0.7
0.8
0.9
1
1.1
0.00 0.20 0.40 0.60 0.80 1.00
0.4
0.5
0.6
0.7
0.8
0.9
1
1.1
0.00 0.20 0.40 0.60 0.80 1.00 -0.7
-0.6
-0.5
-0.4
-0.3
-0.2
-0.1
0
0.1
0.00 0.20 0.40 0.60 0.80 1.00
Score Score Score
Expected Score (n=2) Expected Score (n=2)Expected Score (n=2)
Commonly-Used Rules

Some Issues & Recent Developments
• My own biased view!
• Based in part on recent work with Casey Lichtendahl, Victor Richmond Jose, Bob Nau, and others
• Influenced greatly by many years of work with Allan Murphy
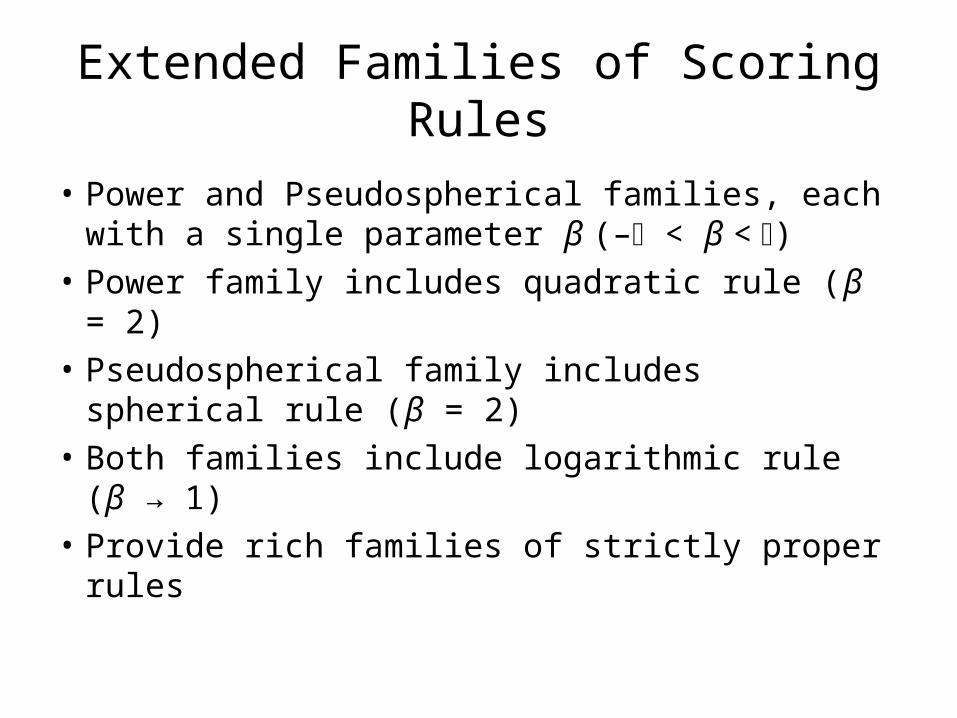
Extended Families of Scoring Rules
• Power and Pseudospherical families, each with a single parameter β (– < β < )
• Power family includes quadratic rule (β = 2)
• Pseudospherical family includes spherical rule (β = 2)
• Both families include logarithmic rule (β → 1)
• Provide rich families of strictly proper rules

Power and Pseudospherical Families
1
1
11/
1
1 1( ) 1
1
1( ) / 1
1
njP
j ii
nSj j i
i
rS r
S r r
r
r

Relative Evaluation
• Standard scoring rules are symmetric• Maximum ES is smallest when the distribution is
uniform – forecasts are rewarded for improvements over a uniform distribution
– Is the uniform distribution a suitable baseline?
• Evaluation relative to a non-uniform baseline• Often makes more sense• Facilitates comparability of scores from different
situations – improvements over their baselines• Motivated “Skill Score” (but not strictly proper)

Scoring Rules with Baseline Distributions
• Strictly proper asymmetric rules
• Generalized Power & Pseudospherical families• Strictly proper• Score = 0 when forecast = baseline• ES > 0 when forecast ≠ baseline

Power and Pseudospherical Families with Baselines
1
11
11/
11
( / ) 1 1( | ) 1
1
1( | ) / / 1
1
nj jP i
ji i
nS ij j j
i i
r q rS
q
rS r q
q
r q
r q

Expected Scores (β = 2)
POWER SCORE, q = (0.2, 0.7, 0.1)
QUADRATIC SCORE SPHERICAL SCORE
PSEUDOSPHERICAL SCORE, q = (0.2,0.7, 0.1)
State 1 State 2
State 3
State 1 State 2
State 3
State 1 State 2
State 3
State 1 State 2
State 3

Taking Order Into Account
• What if the events of interest are ordered? • Standard scoring rules ignore the order • For events other than the one that occurs, the
probabilities matter but not “where they are”
• Do we want the scoring rule to reflect order?• Then we want it to be “sensitive to distance”• Having more probability on events “close” to the
event that happens than on events “far” from the event that happens results in a higher score.

Scoring Rules that Reflect Order
• First such rule: ranked probability score• Based on quadratic scoring rule• Reflects order by using cumulative probabilities
• The same approach can be used with any basic scoring rule
• Can generate Power and Pseudospherical families that include baseline distributions and are sensitive to order

Sensitive to Distance Rules
1 12 2( ) (1 )1
1 1( ) ( ,1 ) ( ,1 )2 11
1 1( | ) ( ,1 | ) ( ,1 | )2 11
j nRPS R Rj i ii ji
j nS S R R S R Rj i i i ii ji
j nS S R R Q S R R Qj i i i i i ii ji
r
r
r q

Expected Scores (β = 2)
QUADRATIC SCORE RANKED PROBABILITY SCORE
POWER SCORE, q = (1/3,1/3,1/3) POWER SCORE, q = (0.7, 0.2, 0.1)
State 1 State 2
State 3
State 1 State 2
State 3
State 1State 2
State 3
State 1 State 2
State 3

Probabilities vs. Quantiles• Often we have ordered events or values of a
variable, as noted earlier
• We might have quantile forecasts, or a mix of probability forecasts and quantile forecasts
• Why not just use the previously-discussed scoring rules to evaluate quantiles?• They provide improper incentives for quantiles• Can be gamed to get perfect calibration artificially

Scoring Rules for Quantiles
• Scores are based on the quantiles and on the actual value of the variable
• Rules based on linear loss functions
• Can be used for multiple quantiles• Special case: interval forecasts (2 quantiles)
• Strictly proper for quantile assessment

Calibration & Sharpness
• How much should we care about calibration?• Evaluation of probability forecasts often focuses
almost exclusively on calibration• Forecasters can game calibration measures• A good Bayesian should try to recalibrate
probabilities (viewing them as new information)• A key issue: will the forecasts be taken at face
value?

Calibration & Sharpness, cont.
• What about sharpness?• Sharpness is a better indicator of how informative
the forecasts are (or can be)• Sharpness can often be improved with effort (more
data-gathering, improved models)• Limited exploration suggests that sharpness has
greater impact on overall scores than calibration
• Ideal: Maximize sharpness subject to good calibration
• Pay more attention to sharpness measures

Competition Among Forecasters• Forecasters can have goals other than maximizing ES
• Utility could be nonlinear in the score• Risk averse• Step function with step at “target score”
• Goal could be to outscore other forecasters• Brings in game-theoretic considerations• Results in forecasts that are more extreme than the forecaster’s
probabilities
• Goal could be to be similar to other forecasters, or not to be near the bottom of the group in scores
• Leads to so-called “herding” behavior
• Tricky to model• We don’t know exactly what a forecaster’s goals are• Can’t recover the forecaster’s probabilities from those that
are reported

Concluding Thoughts/Recommendations• Encourage greater use of probabilities• Encourage consistent evaluation of probabilities• Rich families of scoring rules
• Need better understanding of characteristics of different rules
• Choice of a baseline distribution and sensitivity to distance more important than value of β
• Tailor rules to other probability-related forecasts, such as quantiles, for proper incentives
• Pay more attention to sharpness, less to calibration• Be aware of possible other goals and their impact on
reported probabilities• Other issues in probability forecasting & evaluation