
Probabilistic Seismic Hazard Maps - Inputs and Status Choi Yoon Seok Jennifer S. Haase Robert L....
14
Probabilistic Seismic Hazard Maps - Inputs and Status Choi Yoon Seok Jennifer S. Haase Robert L. Nowack Purdue University
-
Upload
emory-edwards -
Category
Documents
-
view
219 -
download
2
Transcript of Probabilistic Seismic Hazard Maps - Inputs and Status Choi Yoon Seok Jennifer S. Haase Robert L....

Probabilistic Seismic Hazard Maps - Inputs and Status
Choi Yoon Seok
Jennifer S. Haase
Robert L. Nowack
Purdue University
Status
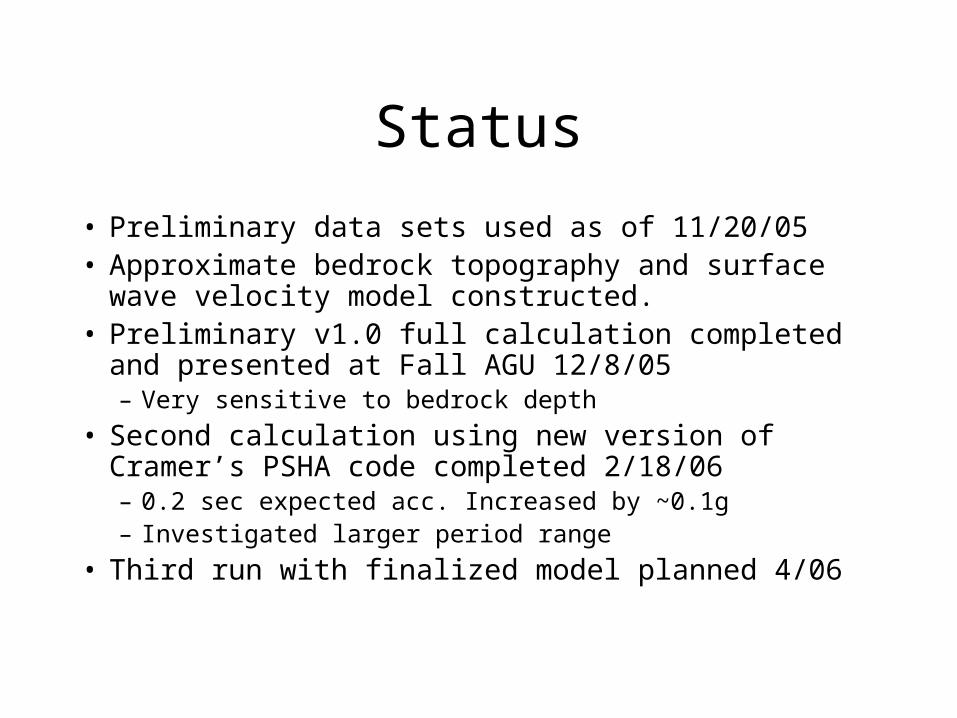
• Preliminary data sets used as of 11/20/05• Approximate bedrock topography and surface
wave velocity model constructed.• Preliminary v1.0 full calculation completed and
presented at Fall AGU 12/8/05– Very sensitive to bedrock depth
• Second calculation using new version of Cramer’s PSHA code completed 2/18/06– 0.2 sec expected acc. Increased by ~0.1g– Investigated larger period range
• Third run with finalized model planned 4/06

Legend
PGA_0.05
Prediction Map
[Amp_pga_all].[A_2]
Filled Contours
1 - 1.4
1.4 - 1.8
1.8 - 2.2
2.2 - 2.6
2.6 - 3
3 - 3.4
3.4 - 3.8
3.8 - 4.2
4.2 - 4.6
4.6 - 5
5 - 5.4
5.4 - 5.8
5.8 - 6.2
6.2 - 6.6
6.6 - 7
Site amplification factor
Amplification Factor

Legend
PGA_0.05
Prediction Map
[Amp_pga_all].[A_2]
Filled Contours
1 - 1.4
1.4 - 1.8
1.8 - 2.2
2.2 - 2.6
2.6 - 3
3 - 3.4
3.4 - 3.8
3.8 - 4.2
4.2 - 4.6
4.6 - 5
5 - 5.4
5.4 - 5.8
5.8 - 6.2
6.2 - 6.6
6.6 - 7
Site amplification factor
Amplification Factor

PSHA mapsUSGS_A02
Prediction Map
[Level4.0_2%PE_50Yr_PSHA_USGS].[A02]
Filled Contours
-0.3 - -0.2
-0.2 - -0.1
-0.1 - 0
0 - 0.1
0.1 - 0.2
0.2 - 0.3
0.3 - 0.4
0.4 - 0.5
0.5 - 0.6
0.6 - 0.7
0.7 - 0.8
0.8 - 0.9
0.9 - 1
1 - 1.1
1.1 - 1.2
1.2 - 1.3
1.3 - 1.4
1.4 - 1.5
1.5 - 1.6
1.6 - 1.7
Acceleration Level (g)
Data inputs
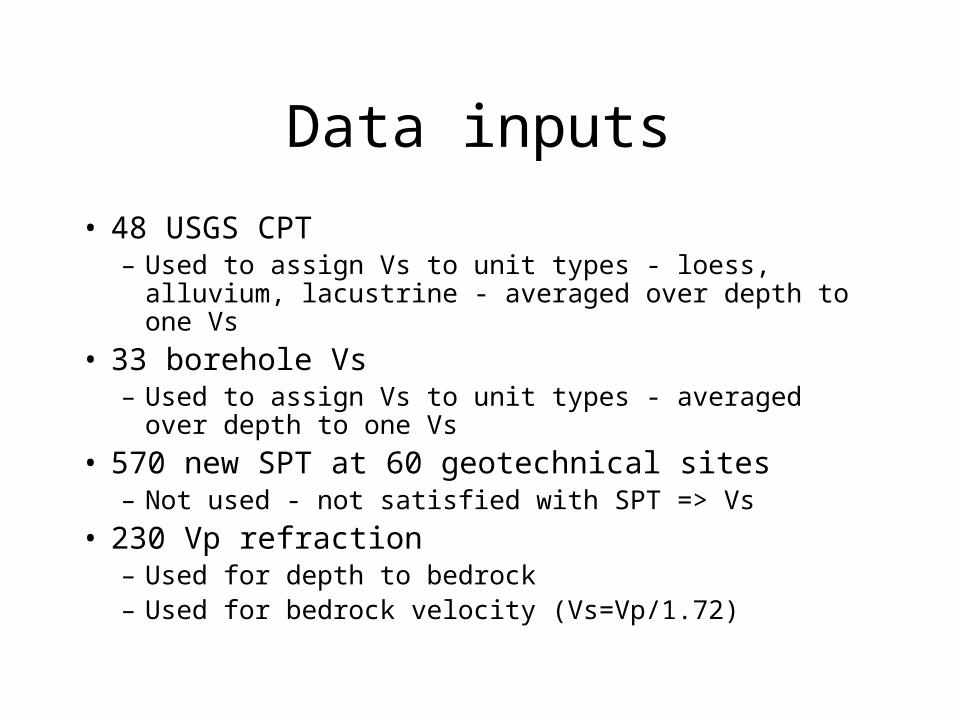
• 48 USGS CPT– Used to assign Vs to unit types - loess, alluvium,
lacustrine - averaged over depth to one Vs
• 33 borehole Vs– Used to assign Vs to unit types - averaged over depth
to one Vs
• 570 new SPT at 60 geotechnical sites– Not used - not satisfied with SPT => Vs
• 230 Vp refraction– Used for depth to bedrock– Used for bedrock velocity (Vs=Vp/1.72)

Data inputs
• KGS Vs refraction profiles (CUSEC report)– Used only to check approx bedrock Vs
• IGS Ilith water well logs– Used for bedrock depth– Not used for densifying lateral varying
lithology, yet…
• KY bedrock elevation points (R. Counts)

Data inputs
• Surficial geology– Used to determine surface lithology type,
then one velocity and uncertainty assigned to all grid points within that map area
– All these surficial geology maps were preliminary products

Quadrangle Map Status?Caborn (name?) Quadrangle surficial maping – IN side IGS surficial mapping – KY side KGS Steve Martin 11/2005 KGS Ron Counts revising bedrock contours 4/2006?
Evansville N Quadrangle prelim surf mapping Scott Lundstrom 11/2005 final surf mapping ?
Daylight Quadrangle surf mapping IGS – old GIS database Scott Lundstrom ?
West Franklin surf mapping KGS Steve Martin 11/2005 KGS R. Counts revising bedrock contours 4/2006 Dave Moore
Evansville S prelim surf mapping Scott Lundstrom 11/2005 final surf mapping
Newburgh field mapping done 4/2006? Scott Lundstrom existing surf mapping KGS DVGQ map
Wilson
Henderson Spottsville field mapping done 4/2006? Mike Murphy Mark Thompson existing surf mapping KGS DVGQ map

Bedrock depth model

Effect of depth of soil on amplification
• At 0.05 g input
Legend
PGA_0.05
Prediction Map
[Amp_pga_all].[A_2]
Filled Contours
1 - 1.4
1.4 - 1.8
1.8 - 2.2
2.2 - 2.6
2.6 - 3
3 - 3.4
3.4 - 3.8
3.8 - 4.2
4.2 - 4.6
4.6 - 5
5 - 5.4
5.4 - 5.8
5.8 - 6.2
6.2 - 6.6
6.6 - 7
Site amplification factor

What’s left to try?
• Use more data to determine correspondence between velocity and unit lithology
• Water wells and SPTs : calculate average velocity given the total thickness of different units using lithology for each unit
• Try a depth dependence for each unit• Need some kind of numbers for bedrock• Refraction data in Ron’s marginal areas• Make cross sections through our Vs/bedrock model
for detailed cross section lines to make sure they are consistent with detailed depositional cross sections.

Products
• PSHA maps at any level desired– Level of acceleration in g with X% probability to be
exceeded in 50 years– At pga, 0.2 sec, 1 sec (or others)– 9 quadrangle region
• Scenario earthquake calculation for Indiana side? Using same scenarios as Zhenming?

Products
• From 3D Vs above bedrock model can calculate site classification
• Give information to CUSEC to make updated NEHRP soil classification maps
• These could be available products to other scientists and also users of HAZUS


![Nowack AKK Selb 2014.ppt [Schreibgesch tzt]) - DKG · 2014. 11. 24. · AKK DKG Herbsttagung2014 in Selb Vortrag Die Partikelmessung und die Krümelkunde Dr. Gerhard Nowack, Micromeritics](https://static.fdocuments.net/doc/165x107/60d942d487573051c57fa726/nowack-akk-selb-2014ppt-schreibgesch-tzt-dkg-2014-11-24-akk-dkg-herbsttagung2014.jpg)


![Martin Haase: Linguistic Hacking [24c3]](https://static.fdocuments.net/doc/165x107/549ea58db37959aa618b4791/martin-haase-linguistic-hacking-24c3.jpg)