
Probabilistic Risk Models for Plastic Piping Systems...Probabilistic Risk Models for Plastic Piping...
39
Probabilistic Risk Models for Plastic Piping Systems Ernest Lever Plastic Pipe Conference, SPE Philadelphia Section West Conshocken, PA April 16-17, 2019
Transcript of Probabilistic Risk Models for Plastic Piping Systems...Probabilistic Risk Models for Plastic Piping...

Probabilistic Risk Models for Plastic Piping Systems
Ernest LeverPlastic Pipe Conference, SPE Philadelphia SectionWest Conshocken, PAApril 16-17, 2019

Probabilistic Risk Models for Plastic Piping Systems 2
GTI Risk Modeling Approach
> Lifetime Prediction (Prediction of Failure) dependent on:─ Stress distribution, and ─ Material properties
> System Simulation dependent on:─ System components─ Boundary conditions─ End of life metrics
> Understanding of interactions dependent on:─ System configuration─ Environment─ Known influencing factors─ Unknown influencing factors
> Policy evaluation dependent on:─ Risk governance framework
> Risk appetite> Risk tolerances
─ Business process> Goals> Situations> Assessors> Metrics

Probabilistic Risk Models for Plastic Piping Systems 3
GTI Incorporation of Ground Movement in Risk Models
> GTI is heavily focused on Causal Modeling to drive risk models> GTI executed a project with Rutgers University to evaluate damage to gas distribution
systems after Hurricane Sandy─ Ground movement measured by LiDAR─ Causal model + Bayesian network developed for pipeline strain due to ground movement
> The Bayesian network was modified for general pipeline risk models─ Pipeline displacements induce bending moments on pipeline components─ Bending moment induced stresses converted to Stress Intensification Factors (SIF)─ All factors impacting pipeline lifetime converted to equivalent SIF
> SIF acting on pipeline become normalizing factor─ Distributions of SIF due to various components developed from empirical data, historic data, analysis─ Distributions of SIF fully express uncertainty─ Distributions of SIF express quality of various pipeline attributes─ Reductions in uncertainty in SIF distributions are a measure of program effectiveness
> The general pipeline risk model was adapted to address highly transient loading due to blasting activity adjacent to distribution system

Probabilistic Risk Models for Plastic Piping Systems 4
Analysis of Natural Gas System After Hurricane Sandy

Probabilistic Risk Models for Plastic Piping Systems 5
Worked with Rutgers U. in Post-Hurricane Sandy Study

Probabilistic Risk Models for Plastic Piping Systems 6
LiDAR Data of Debris Field and Flow

Probabilistic Risk Models for Plastic Piping Systems 7
LiDAR Data of Building Displacements

Probabilistic Risk Models for Plastic Piping Systems 8
GTI Integrated Infrastructure Analysis

Probabilistic Risk Models for Plastic Piping Systems 9
Vertical Displacement Horizontal Displacement
Natural Forces Threats – Belowground Pipe Strains
Belowground pipelines may experience high longitudinal and axial strains due to soil movement resulting from slope instability, soil subsidence, seismic activity, and flooding.

Probabilistic Risk Models for Plastic Piping Systems 10
Natural Forces Threats – Belowground Pipe Strains
Pipe deformations are not necessarily equal to soil displacements. Various factors: pipe type, size, depth of pipe, soil type, length of displaced section along the pipe affect soil-pipe interaction
FE program* was used to estimate pipe strains corresponding to the ranges of soil deformations.
Procedures used: ASCE Committee on Gas and Liquid Fuel Lifelines, Guidelines for the
Seismic Design of Oil and Gas Pipeline Systems, 1984. Guidelines for the Design of Buried Steel Pipe, American Lifelines Alliance
(ALA), American Society of Civil Engineers, July, 2001. Guidelines for the Seismic Design and Assessment of Natural Gas and
Liquid Hydrocarbon, PRCI, 2004. PIPLIN, Computer Program for Stress and Deformation Analysis of
Pipelines, Version 4.59, SSD Inc., December 2013.

Probabilistic Risk Models for Plastic Piping Systems 11
Natural Forces Threats – Belowground Pipe Strains
FE Analysis of Pipe StrainsThe pipe is represented as a structural beam with the soil as spring elements in the axial (longitudinal), transverse horizontal, and transverse vertical directions. The axial strains on the pipe result mainly from the friction caused by soil shear stresses around the pipe circumference.
As the ground displacement is progressively increased, the pipe may reach their specified compressive or tensile strain limits.
The soil may yield and continue to move past the pipe with no increased pipe deformations.

Probabilistic Risk Models for Plastic Piping Systems 12
-4.8 – -1.0 ft-1.0 – 0.10 0.10 – 0.550.55 – 2.502.50 – 6.00
Data Tabulated in 50-ft Grids, Change of Soil Elevation
Soil Movement, [LiDAR DATA]

Probabilistic Risk Models for Plastic Piping Systems 13
Spatial Changes in soil elevation before and after Sandy.[Note: Z in this figure is in meters]
Belowground Pipes Assessment – Input Data

Probabilistic Risk Models for Plastic Piping Systems 14
Spatial Changes in water elevation before and after Sandy.[Note: Z in this figure is in meters]
Belowground Pipes Assessment – Input Data

Probabilistic Risk Models for Plastic Piping Systems 15
Integrated Risk Model, Bayesian Network

Probabilistic Risk Models for Plastic Piping Systems 16
Integrated Risk Model, Bayesian Network.

Probabilistic Risk Models for Plastic Piping Systems 17
Integrated Risk Model, Bayesian Network.
Risk model output in a sample GIS grid:Damage Likelihood:
High
Medium
Low

Probabilistic Risk Models for Plastic Piping Systems 18
GTI Material Models
> GTI has progressively been improving the modeling tools it applies to risk analysis over the past eight years
> Models have been developed for:─ Polyethylene
> Aldyl A> MDPE> HDPE
─ Steels> Leak Rupture Boundary> FEM based FAD from 2D and 3D crack propagation modeling> Critical flaw curves to allow ILI as an alternative to a hydrotest> Currently working on reducing uncertainty due to damage interactions, NDE uncertainties and
material uncertainties─ Cast Iron
> Line breaks due to frost heave> Line breaks due to graphitic corrosion

Probabilistic Risk Models for Plastic Piping Systems 19
Material Models for Polyethylene
> Fully viscoelastic/plastic material models> Capture large strains in compression and
tension across wide temperature and strain rate ranges
> Accurately predict damage propagation

Probabilistic Risk Models for Plastic Piping Systems 20
Material Models for Steel
>GTI models capture yield point offset, strain hardening and plasticity
>State-of-the-art Bao-Wierzbicki ductile damage models incorporated
>Models capable of simulating impact loading with large displacements, plastic deformation and damage propagation

Probabilistic Risk Models for Plastic Piping Systems 21
Influence of Toughness on Critical Crack Depth
>GTI material models are capable of capturing stress/strain toughness
>Damage propagation models introduce the capability of calibrating toughness to strain rate, morphology and chemistry
4” IPS, 0.25” Wall

Probabilistic Risk Models for Plastic Piping Systems 22
FEM Coupled with DoE
> GTI routinely runs several thousand FEM analyses to fully capture wide ranges of asset geometries, flaw geometries, material properties and boundary conditions
> ANOVA analysis of the results provides closed form equations for system response given different levels of input parameters
> Prediction limits at any desired confidence level can be specified to suit particular decision support needs.

Probabilistic Risk Models for Plastic Piping Systems 23
Stress Intensity Factor (SIF) from FEM Coupled with DoE
𝑆𝑆𝑆𝑆𝑆𝑆 = 𝑎𝑎𝑃𝑃𝑏𝑏𝐵𝐵𝐵𝐵𝑆𝑆𝑐𝑐
Configuration a b cPipe without Saddle Tee 4453.0 -1.0657 -0.744
Pipe with Saddle Tee Positive
Bending5310.7 -0.9654 -0.7251
Pipe with Saddle Tee Negative
Bending9364.1 -1.0757 -0.7789
Pipe with Saddle Tee Lateral
Bending3476.7 -1.0059 -0.5593
Pipe with Coupling 4285.0 -0.676 -0.9252

Probabilistic Risk Models for Plastic Piping Systems 24
GTI Causal Model for Vintage Aldyl-A Pipeline Risk
32 factors impacting vintage pipeline performance
Interaction reduction and quantification using Directed Acyclic Graph

Probabilistic Risk Models for Plastic Piping Systems 25
Constructing the Bayesian Network

Probabilistic Risk Models for Plastic Piping Systems 26
Bayesian Network Probabilistic Model for Lifetime Expectancy

Probabilistic Risk Models for Plastic Piping Systems 27
How does the Bayesian Network (BN) work?
Surface Conditions
Logistic Regression Model
RPM ModelMaterial, Temperature
Internal PressureStress Riser
> RPM and logistic regression models have been implemented in the Bayesian network
log 𝑡𝑡 = 𝐶𝐶1 + 𝐶𝐶21𝑇𝑇
+ 𝐶𝐶3 log 𝜎𝜎 + 𝐶𝐶4𝑙𝑙𝑙𝑙𝑙𝑙(𝜎𝜎)𝑇𝑇

Probabilistic Risk Models for Plastic Piping Systems 28
RPM, Master Curves

Probabilistic Risk Models for Plastic Piping Systems 29
Material Morphology Impacting Lifetime Expectancy
Actual System Data
Not Theory

Probabilistic Risk Models for Plastic Piping Systems 30
SIF – Reducing Uncertainty in Data Analysis

Probabilistic Risk Models for Plastic Piping Systems 31
Adjusting RPM Models for Use with SIF: 2 order of magnitude reduction in uncertainty
• Normalizing measured system data to historic data sets yields unique SIF distributions.
• These SIF distributions become an objective measure of system quality

Probabilistic Risk Models for Plastic Piping Systems 32
• SME knowledge, physics based models, and historic data are integrated into the Bayesian network
• Effects from different perspectives are merged using an equivalent stress intensification factor (SIF)
• Output from the Bayesian network is a probability distribution of life expectancy
Quantified Bayesian Network
ID surface features• Surface Oxidation• Surface Crystals• Boundary Crystals• Dimple• Rod• Oxidation induction
Years in service• Years after repair• Squeeze-off
Soil • Soil movement• Soil type• Bending• Impingement
Pipe & pressure• Pipe geometry• Fitting• Hoop stress

Probabilistic Risk Models for Plastic Piping Systems 33
Smart Form for Intelligent Data Collection
Multiple Use Cases Leak Inspection Leak Survey Leak Repair Leak Monitoring First Respond Keyhole Data Collection
Risk Analysis Collect Model Input Bayesian Network Show Risk Output
Data Visualization Update Database PowerBI for
Visualization

Probabilistic Risk Models for Plastic Piping Systems 34
Risk Model Demonstration
PowerBI Dashboard-Risk evolution over 0-30 years Fitness for Service after 30 years

Probabilistic Risk Models for Plastic Piping Systems 35
Risk Analysis: Blasting Adjacent to HDPE Distribution System
The developed model fuses field data, soil movement, wave propagation, pipe deformation, FEA, and SME opinions
It is verified by subsequent data provided by the sponsor and included in the GIS system to facilitate the implementation
The risk on fusion joints should be carefully assessed when blast activities are performed in proximity
10 -8 10 -6 10 -4 10 -2 10 0
We/( c 2 R 3)
10 -8
10 -7
10 -6
10 -5
10 -4
10 -3
10 -2
10 -1
(X/R
)(P0/
c2)0.
5
Historic data
Historic data fitting
ORU 2016 data with assumed soil modulus
ORU 2016 data using the optimal soil modulus
Mean(burial depth) & mean(explosive)-2015
95% LB-burial depth & 95% UB-explosive-2015
95% UB-burial depth & 95% LB-explosive-2015
FEAMaterial Testing
Blast modelin
g Response surface model10 20 30 40 50 60 70 80
Radial distance (ft)
0
0.02
0.04
0.06
0.08
0.1
0.12
0.14
0.16
0.18
0.2
Max
ium
pea
k di
spla
cem
ent(i
n)
Data-underground
Top 2.5%
fitted curve
95% upper bound
95% lower bound
Median
Field data
collection

Probabilistic Risk Models for Plastic Piping Systems 36
Bayesian Network: Blasting Adjacent to HDPE Distribution System
> The developed model fuses field data, soil movement, wave propagation, pipe deformation, FEA, and SME opinions> It is verified by subsequent data provided by the sponsor and included in the GIS system to facilitate the
implementation> The risk on fusion joints should be carefully assessed when blast activities are performed in proximity
Soil movement• Soil movement• Soil properties
(modulus, density)
Interaction with blasting• Standoff distance• Burial depth• Blast hole depth• Blast information
Pipe • Pipe geometry• Joint type
Failure probability• Maximum principal stress• Probability category
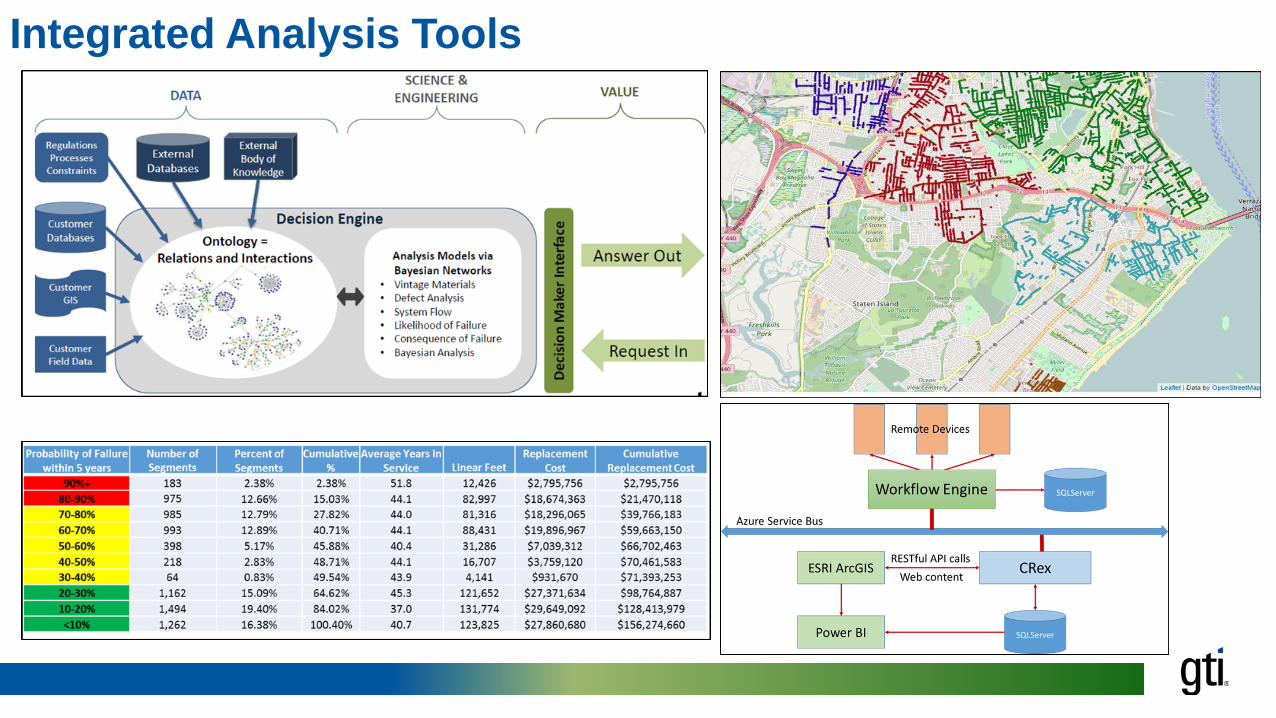
Integrated Analysis Tools

Probabilistic Risk Models for Plastic Piping Systems 38
What do the models currently offer
1) The probabilistic models capture expected system behavior very well2) The material models and damage propagation models are state-of-the-art
and based on sound science3) The model outputs are calibrated to historic data4) The probability distributions used to assign asset conditions match known
aggregate system performance5) The models offer valuable assistance in root cause analysis and the
temporal progression of failures due to the various root causes6) The Bayesian Network models are the best known solution for addressing
all system interactions, including human factors and unknown factors

Probabilistic Risk Models for Plastic Piping Systems 39
Questions
![Piping and Pipe Support Systems[1]](https://static.fdocuments.net/doc/165x107/553e5279550346933f8b496e/piping-and-pipe-support-systems1.jpg)