Pro- vs. retro-foreland basins - University of Edinburgh
19
Pro- vs. retro-foreland basins M. Naylor and H. D. Sinclair School of GeoSciences, Grant Institute, University of Edinburgh, Edinburgh,UK ABSTRACT Alpine-type mountain belts formed by continental collision are characterised by a strong cross- sectional asymmetry driven by the dominant underthrusting of one plate beneath the other. Such mountain belts are £anked on either side by two peripheral foreland basins, one over the underthrust plate and one over the over-riding plate; these have been termed pro- and retro-foreland basins, respectively. Numerical modelling that incorporates suitable tectonic boundary conditions, and models orogenesis from growth to a steady-state form (i.e. where accretionary in£ux equals erosional out£ux), predicts contrasting basin development to these two end-member basin types. Pro-foreland basins are characterised by: (1) Accelerating tectonic subsidence driven primarily by the translation of the basin ¢ll towards the mountain belt at the convergence rate. (2) Stratigraphic onlap onto the cratonic margin at a rate at least equal to the plate convergence rate. (3) A basin in¢ll that records the most recent development of the mountain belt with a preserved interval determined by the width of the basin divided by the convergence rate. In contrast, retro-foreland basins are relatively stable, are not translated into the mountain belt once steady-state is achieved, and are consequently characterised by: (1) A constant tectonic subsidence rate during growth of the thrust wedge, with zero tectonic subsidence during the steady-state phase (i.e. ongoing accretion-erosion, but constant load). (2) Relatively little stratigraphic onlap driven only by the growth of the retro-wedge. (3) A basin ¢ll that records the entire growth phase of the mountain belt, but only a condensed representation of steady- state conditions. Examples of pro-foreland basins include the Appalachian foredeep, the west Taiwan foreland basin, the North Alpine Foreland Basin and the Ebro Basin (southern Pyrenees). Examples of retro-foreland basins include the SouthWestland Basin (Southern Alps, New Zealand), the Aquitaine Basin (northern Pyrenees), and the Po Basin (southern European Alps).We discuss how this new insight into the variability of collisional foreland basins can be used to better interpret mountain belt evolution and the hydrocarbon potential of these basins types. INTRODUCTION Foreland basins are the sedimentary basins located on continental lithosphere at the outer edge of mountain belts (cf. Dickinson, 1974).They are formed by the regional isostatic compensation by lithospheric £exure driven by both the topography and internal density variations of mountain ranges; additional bending forces on the down- £exed lithosphere may also drive further subsidence (for review see Beaumont, 1981; Jordan, 1981). Foreland basins are characterised by a regionally low gravity anomaly that broadly mimics the geometry of the £exural pro¢le of the underlying lithosphere (Karner & Watts, 1983). This geo- metry also results in a marked asymmetry in cross-section of foreland basins, with a much deeper orogenic margin beneath the deformation front of the mountain belt, and a wedge-shaped form that tapers out over the stable cra- tonic margin of the basin (Allen et al., 1986).Their dimen- sion perpendicular to the mountain front ranges from 100oL basin o300 km depending on the wavelength of iso- static compensation which is a function of the £exural rigidity of the lithosphere.The cratonic margin of foreland basins may be de¢ned by the point of zero de£ection that separates the down£exed basin from the region of fore- bulge uplift. This is best recorded by marine settings, where the palaeocoastline is used as a proxy for this point (Crampton & Allen, 1995). In continental basin ¢lls, it is common for sediment to drape well beyond the point of zero de£ection, and hence DeCelles & Giles (1996) advo- cated the use of ‘forebulge’and ‘backbulge depocenters’. The ¢rst recognition of the variety of foreland basin types was by Dickinson (1974) who distinguished retro- arc from peripheral foreland basins. The former develops during ocean-continent collision associated with the growth of a magmatic arc. In this case, the foreland basin evolves on the continental side of the mountain belt as seen to the east of the Andes and the Rockies (Jordan, 1995). In contrast, peripheral foreland basins develop on both sides of a mountain belt resulting from continent^ continent collision (for review see Miall,1995); well-docu- mented examples of peripheral foreland basins include the Correspondence: M. Naylor, School of GeoSciences, Grant Institute, University of Edinburgh, West Mains Rd, Edinburgh EH9 3JW, UK. E-mail: [email protected] Basin Research (2008) doi: 10.1111/j.1365-2117.2008.00366.x r 2008 The Authors. Journal compilation r 2008 The Authors 1
Transcript of Pro- vs. retro-foreland basins - University of Edinburgh

Pro- vs. retro-foreland basinsM. Naylor and H. D. Sinclair
School of GeoSciences, Grant Institute, University of Edinburgh, Edinburgh,UK
ABSTRACT
Alpine-type mountain belts formed by continental collision are characterised by a strong cross-sectional asymmetry driven by the dominant underthrusting of one plate beneath the other. Suchmountain belts are £anked on either side by two peripheral foreland basins, one over the underthrustplate and one over the over-riding plate; these have been termed pro- and retro-foreland basins,respectively. Numerical modelling that incorporates suitable tectonic boundary conditions, andmodels orogenesis from growth to a steady-state form (i.e. where accretionary in£ux equals erosionalout£ux), predicts contrasting basin development to these two end-member basin types. Pro-forelandbasins are characterised by: (1)Accelerating tectonic subsidence driven primarily by the translation ofthe basin ¢ll towards the mountain belt at the convergence rate. (2) Stratigraphic onlap onto thecratonic margin at a rate at least equal to the plate convergence rate. (3) A basin in¢ll that records themost recent development of the mountain belt with a preserved interval determined by the width ofthe basin divided by the convergence rate. In contrast, retro-foreland basins are relatively stable, arenot translated into the mountain belt once steady-state is achieved, and are consequentlycharacterised by: (1) A constant tectonic subsidence rate during growth of the thrustwedge, with zerotectonic subsidence during the steady-state phase (i.e. ongoing accretion-erosion, but constant load).(2)Relatively little stratigraphic onlap driven only by the growth of the retro-wedge. (3)Abasin ¢ll thatrecords the entire growth phase of the mountain belt, but only a condensed representation of steady-state conditions. Examples of pro-foreland basins include the Appalachian foredeep, the west Taiwanforeland basin, theNorthAlpine ForelandBasin and the EbroBasin (southern Pyrenees). Examples ofretro-foreland basins include the SouthWestlandBasin (SouthernAlps,NewZealand), theAquitaineBasin (northern Pyrenees), and the Po Basin (southern European Alps).We discuss how this newinsight into the variability of collisional foreland basins can be used to better interpret mountain beltevolution and the hydrocarbon potential of these basins types.
INTRODUCTION
Foreland basins are the sedimentary basins located oncontinental lithosphere at the outer edge of mountainbelts (cf. Dickinson,1974).They are formed by the regionalisostatic compensation by lithospheric £exure driven byboth the topography and internal density variations ofmountain ranges; additional bending forces on the down-£exed lithosphere may also drive further subsidence (forreview see Beaumont, 1981; Jordan, 1981). Foreland basinsare characterised by a regionally low gravity anomaly thatbroadly mimics the geometry of the £exural pro¢le of theunderlying lithosphere (Karner & Watts, 1983).This geo-metry also results in a marked asymmetry in cross-sectionof foreland basins, with a much deeper orogenic marginbeneath the deformation front of the mountain belt, anda wedge-shaped form that tapers out over the stable cra-tonic margin of the basin (Allen et al., 1986).Their dimen-sion perpendicular to the mountain front ranges from
100oLbasino300 km depending on the wavelength of iso-static compensation which is a function of the £exuralrigidity of the lithosphere.The cratonic margin of forelandbasins may be de¢ned by the point of zero de£ection thatseparates the down£exed basin from the region of fore-bulge uplift. This is best recorded by marine settings,where the palaeocoastline is used as a proxy for this point(Crampton & Allen, 1995). In continental basin ¢lls, it iscommon for sediment to drape well beyond the point ofzero de£ection, and hence DeCelles & Giles (1996) advo-cated the use of ‘forebulge’and ‘backbulge depocenters’.
The ¢rst recognition of the variety of foreland basintypes was by Dickinson (1974) who distinguished retro-arc from peripheral foreland basins.The former developsduring ocean-continent collision associated with thegrowth of a magmatic arc. In this case, the foreland basinevolves on the continental side of the mountain belt asseen to the east of the Andes and the Rockies (Jordan,1995). In contrast, peripheral foreland basins develop onboth sides of a mountain belt resulting from continent^continent collision (for review seeMiall,1995); well-docu-mented examples of peripheral foreland basins include the
Correspondence: M. Naylor, School of GeoSciences, GrantInstitute, University of Edinburgh, West Mains Rd, EdinburghEH93JW, UK. E-mail: [email protected]
BasinResearch (2008) doi: 10.1111/j.1365-2117.2008.00366.x
r 2008 The Authors. Journal compilation r 2008 The Authors 1

North Alpine Foreland Basin of western Europe and theGanges Basin of northern India.
Understanding di¡erences in tectonic boundary condi-tions for peripheral foreland basin types came from theanalysis of doubly vergent thrust wedges where one thrustwedge evolves over the underthrust lithosphere, and theopposing wedge develops over the overriding plate (Fig.1)(Willett et al., 1993). Johnson & Beaumont (1995) used anumerical model to simulate the evolution of peripheralforeland basins on either side of a doubly vergent moun-tain belt. In so doing, they introduced the terms pro- andretro-foreland basins in order to distinguish the basinoverlying the underthrust plate from that overlying theoverriding plate, respectively (Fig.1); we adopt this termi-nology for distinguishing between these peripheral fore-land basin types.While the nominal distinction betweenpro- and retro-foreland basins on either side of a moun-tain belt has been recognised in terms of basin setting(e.g. Allen&Allen, 2005), no criteria in terms of basin evo-lution, subsidence histories or stratigraphic architecturehave yet been provided to distinguish between them.Thisstudy focuses on distinguishing peripheral foreland basinsusing these criteria, but also highlights the potential sig-ni¢cance for retro-arc basin types.
We use numerical modelling to investigate the strati-graphic record of peripheral foreland basins.The temporal
evolution of these basins is divided into a growth phasewhere the topographic mass of the mountain beltincreases and a steady state phase where the topographicmass remains constant (Willett & Brandon, 2002). Thecontrasting tectonic boundary conditions are explored forthe side of a mountain belt experiencing active under-thrusting and accretion (pro-side sensu Willett et al.,1993) vs. the side that is being overthrust, and whichexperiences relatively little accretion (retro-side sensuWillett et al., 1993, Fig.1). By comparing results from theseexperiments with natural examples, we demonstrate themarked contrast between these basin types, and go on toprovide new predictions for stratal architecture, chronos-tratigraphy and subsidence that discriminate betweenthem.We conclude by exploring the implications for inter-pretations of tectonics from stratal records, and for hydro-carbon prospectivity.
Background on foreland basins
The primary criteria used to characterise the stratigraphicin¢ll of foreland basins are thickness, lateral extent, ratesof subsidence, rates of onlap and broad depositional envir-onments. Numerical models that combine the tectonics ofthe system with algorithms to simulate surface processeshave been used to analyse basin development and predict
Pro-forelandbasin
Retro-forelandbasin
αpro αretro
FA
FE FE
V
Loaddivider
Pro-wedge Retro-wedge
H
W0
(a)
(b)
Cratonic basinmargin
Cratonic basinmargin
Deformationfront
Deformationfront
ho
Overriding lithosphereUnderthrust lithosphere
Fig.1. Cartoon of a steady-state doubly vergent orogen. (a) The pro-foreland basin lies in the £exural depression over the subductingslabwhich advances towards the orogen at the regional convergence rate, v.The retro-foreland basin lies in the £exural depression abovethe over-riding slabwhich is predominantly stationarywith respect to the orogen. (b)The mass budget of thewedge system is controlledby the relative rate of the accretionary and erosive £uxes (FA and FE, respectively).The rate of accretion of new material from thedowngoing plate is a function of the convergence rate and the thickness of material that is accreted from that plate, h0.The cross-sectional area of the mountain’s topography is described by two triangles of heightH and surface taper angles apro and aretro that abut atthe load divider.
r 2008 The Authors. Journal compilation r 2008 The Authors,Basin Research, 10.1111/j.1365-2117.2008.00366.x2
M. Naylor andH. D. Sinclair

these characteristics for di¡erent boundary conditions andparameter sets. Initially, these models used blocks pro-gressively added onto an elastic plate to simulate the pro-gressive addition of thrust sheets into a wedge and their£exural response (Beaumont, 1981; Jordan, 1981; Quinlan& Beaumont, 1984). A signi¢cant advance was provided bya model that coupled the growth of a single, critically ta-pered thrustwedge to the in¢ll of a foreland basin throughthe simulation of erosion and sedimentation by a di¡usionalgorithm (Flemings & Jordan, 1989; Sinclair et al., 1991). Amore sophisticated surface process model coupled to adoubly vergent thrust wedge model was used to explorethe impact of the asymmetry of orographically enhancedprecipitation over mountain ranges (Johnson & Beau-mont, 1995).This important insight into the potential im-pact of orogenic asymmetry on the two neighbouringforeland basins hinted at the prospect of fundamental dif-ferences in basin types. Recent models of thrust wedgedevelopment have evolved to demonstrate the intimatecoupling between the timescale of deformation on loca-lised structures to the surface processes response time(Simpson, 2006); this has implications for the linkbetween propagation of the deformation front, ¢lling ofthe basin, and source areas for sediment.
Numerical model developments have evolved in parallelwith improved documentation of a range of basins fromaround theworld. Studies of peripheral foreland basins havebeen dominated by those developed on the pro-side of amountain belt due to the improved access to surface expo-sures of foreland basin sediments that have been accretedand deformedwithin the thrustwedge. For example, the no-tion that subsidence in foreland basins should acceleratethrough time was initially tested in the North Alpine Fore-land Basin (Allen et al., 1986), and by subsequent analyses inthe Ebro Basin of the Pyrenees (Verge¤ s et al., 1998) and insoutheastern Papua New Guinea (Haddad & Watts, 1999).The erosion of a region of forebulge uplift was ¢rst docu-mented and modelled from the Appalachian and NorthAlpine systems (Quinlan & Beaumont, 1984; Crampton &Allen,1995).Comparisons have beenmade between the pro-gressive stratigraphic onlap of the outer craton of forelandbasins with the time-equivalent activity of the deformationfront in the North Alpine and Himalayan systems (Home-wood et al., 1986; Burbank et al., 1996; Sinclair, 1997). Finally,tectonostratigraphic models for the progressive evolution of‘peripheral’ foreland basins from a deep-water ‘under¢lled’stage to a shallow marine to continental ‘¢lled’or ‘over¢lled’stage have been provided by the Appalachian, Himalayanand North Alpine Foreland Basins (Stockmal et al., 1986;Sinclair &Allen,1992; Sinclair, 1997).
In contrast, retro-foreland basins have been relativelyunderstudied, except where extensive subsurface dataexists. Hence, basins like the Aquitaine Basin to the northof the Pyrenees, or the South Alpine foreland basin havehad little impact on the development of stratigraphicmodels for peripheral foreland basins.We argue that ourmechanical understanding of foreland basins is currentlybased on the model for pro-foreland basin types, but that
this represents only half the story, lacking a comparativemodel for retro-foreland basins.
Here, we use a numerical model of a mountain beltwhose asymmetry into pro- and retro-sides is de¢ned bythe asymmetry of underthrusting.We consider the impactof this asymmetry on the stratigraphic development of theopposing peripheral foreland basins, and so provide a newmodel aimed at distinguishing the subsidence and strati-graphic development of pro- vs. retro-foreland basins.The model only analyses the main foredeep of forelandbasin systems (sensu DeCelles & Giles, 1996), we do notconsider the impact upon wedge-top or forebulge sedi-mentation.
THE MODEL
We investigate the coupled evolution of the pro- and ret-ro-foreland foreland basins (Fig.1) that bound a collisionalmountain belt. Because there are many regional specialcases that can be considered,we choose a parameterisationthat produces a singular solution whichwe believe re£ectsthe most general case from which more complicated sys-tem-speci¢c cases can be considered. The sensitivity ofthe model to varying the parameterisation is reserved untilthe ‘Summary andDiscussion’ section.
The total system area, Asystem above the £exed slabs isbroken down into a topographic component Atopo, andthe region bounded below the zero de£ection datum andabove the £exed slabs,A¢ll which comprises the basin in¢lland the root of the mountain belt.We consider two phasesof evolution of the system; (a) its growth phase, where thearea of the topographic wedge is increasing dAsystem
dt > 0 and(b) its subsequent steady-state phase, where the in£ux ofmaterial FA into the topographic wedge is balanced by theerosional e¥ux FE out of the wedge and dAsystem
dt ¼ 0. Thistransition occurs as the volume of a mountain beltincreases, assuming a constant rate of accretion, becausesurface uplift rates progressively decrease, allowing upliftand erosion rates to converge (Dahlen & Suppe, 1988).
The model requires the integration of three compo-nents:
(1) A topographic model that describes the cross-sec-tional pro¢le of the mountain belt from which thetopographic load is derived.
(2) Tectonic boundary conditions that describe both therate of accretion of new material into the system andthe advection of the basins due to the motion of theunderlying slabs.
(3) A £exural model for the semi-in¢nite slabs thatrespond to the topographic load.
Topographicmodel
The form of the mean topographic elevation of the doublyvergent mountain belt is approximated by two triangles of
r 2008 The Authors. Journal compilation r 2008 The Authors,Basin Research, 10.1111/j.1365-2117.2008.00366.x 3
Pro- vs. retro-foreland basins

the same height,H, abutting back to back (Fig. 2).Thus thetotal cross-sectional area of the topographic load is givenby:
Atopo ¼H2
2 tan aproþ H2
2 tan aretroð1Þ
Pro- and retro-wedges accrete material in kinematicallydi¡erent ways (Willett, 1992), which leads to a characteris-tically di¡erent topographic form. The pro-wedge growsby the accretion of material at the toe, which leads to thestress solution corresponding to the minimum taperangle predicted by critical wedge theory (Davis et al., 1983;Dahlen et al., 1984). However, the retro-wedge predomi-nantly grows by material added at the back of the wedgeand has the maximum taper angle predicted by criticalwedge theory (Willett, 1992).We apply typical surface an-gles of apro51.51, aretro5 2.51 which are at the lower endof typical wedge angles (e.g. Davis et al., 1983; Ford, 2004)to highlight the impact of load distribution. Thus, thecross-sectional area of our modelled topography withthe mean elevation at the highest point Hmax5 3 km is
Atopo5 275 km2, generating a pro-wedge 115 km wide anda retro-wedge 69 km wide.This represents the maximumtopographic load applied in this study.
Tectonic boundary conditions
The tectonic boundary conditions are the underlyingsource of asymmetry (Fig. 1b). The simulated mountainbelt evolves above the subduction zone as a consequenceof new material being accreted into the system from thedown going plate. The slab underlying the pro-forelandbasin is continually translated towards and down thesubduction zone at the regional convergence rate. Thepro-foreland stratigraphic model incorporates this bytranslating the basin ¢ll along and down the subductingslab, creating new accommodation space. In contrast, theretro-foreland basin ¢ll, on the overlying slab, is not trans-lated toward the subduction zone.This study uses a con-vergence rate of v5 5 kmMyr�1 typical to a number ofsettings (e.g. Beaumont et al., 2000). This velocity repre-sents the rate at which material is translated towards themountain belt from the far ¢eld. Further, we simulate thecase where the basins are instantaneously ¢lled to the level
v
Pro-side Retro-side
αpro0
H(t)
Load divider
δx=0
(a)
αretro
(c)
Ap Ar
l δx
Atopo=Ap+Ar
Ahalf
H(t)αpro αretro
Ahalf =Atopo /2
Gap between slabs
xw(xpro,t)
v
0
Load divider
δx(b)
αpro αretro
Retroward shift in topographyto minimise the gap between slabs
H(t)
w(xretro,t)
Fig. 2. End-member scenarios to balance the topographic load across the slabs. (a) The subducting slab supports the pro-wedge andthe over-riding slab supports the retro-wedge.This leads to a discontinuity between the tips of the slabs. (b)The pro- and retro-wedgesare shiftedwith respect to the slabs in order to ensure that the gap between the slabs is minimised. (c) The simpli¢ed model fortopographic shift used in Appendix A.
r 2008 The Authors. Journal compilation r 2008 The Authors,Basin Research, 10.1111/j.1365-2117.2008.00366.x4
M. Naylor andH. D. Sinclair

of zero de£ection (i.e. approximately sea-level), however,all of our results are also directly applicable to under- ¢lledbasins.
The growth phase of the simulated mountain belt de-scribes the period over which the wedge grows from noth-ing to a topographic maximum of 3 km elevation. Byassuming a convergence rate and a thickness of materialto be accreted into the mountain belt, h0 we can determinethe total amount of material that is accreted into the sys-tem after a period of time, t:
Aaccreted ¼ Asystem þ Aloss ¼ vh0t ð2ÞWhich implies thatAaccreted � Asystem.The loss of mass
from the system represents the material that is transportedout of the mountain belt ^ foreland basin system. It is tri-vial to incorporate transportation of material out of thesystem, however, this results in an non-unique solutionwhich requires either calibration to a speci¢c setting orfull coupling to a surface process model. Because the aimof this paper is to de¢ne the ¢rst order signal, we take theunique end-member case where the basins are instanta-neously ¢lled and no material escapes the system such thatAloss5 0 and:
Asystem ¼ Atopo þ Afill ¼ Aaccreted ¼ vh0t ð3ÞDuring the steady-state phase, Asystem5 constant and
thus any additional material accreted is exactly balancedby material that is transported out of the system by ero-sion. In practice, A¢ll is calculated from the current topo-graphic distribution.Therefore to implement this model,at eachmodel time-stepwe: (1) increment the topographicdistribution Atopo5Atopo1DA, (2) calculate the resultingincrease in A¢ll, and (3) calculate the age of the systemusing t5 (Atopo1A¢ll)/vh0.
Under this parameterisation, and choosing a value ofh055.0 km, material is accreted into the system at a rateof dA
dt ¼ vh0 ¼ 25 km2 Myr�1.The sensitivity of the systemto these choices of parameters is considered in the ‘Sum-mary and Discussion’ section. As a rule of thumb for theAiry isostatic case, the de£ected area is expected to beapproximately ¢ve times the area of the topographic load.Thus, given that Atopo5 275 km2 and using the Airyapproximation we can predicts the total duration requiredto grow the entire mountain belt system to the elevation of3 km is 6 Atopo/vh0 �66Myr. Further, the total topographicload at the end of the growth period is: Qtopo5Atopo
rcrustg5 7.28� 106MPa. To the ¢rst order, this approxi-mation provides a reasonable estimate to the £exural case,which also depends on the £exural rigidity of the slabs, thatcan be measured directly from the simulation.
In the steady-state phase, we assume that the rate ofaccretion of new material is sustained and that time aver-aged in£ux of accreted material into the topographicwedge balances the erosional e¥ux of material out of thewedge such that the mean topography remains constant.The £exure model assumes that the £uctuations about thistime average (Naylor & Sinclair, 2007) are negligible. As a
result there is no further increase in the loading on theslabs once steady-state has been attained.
Flexuremodels
A £exure model provide a description for the shape of theslab which supports the mountain belt and its pro- andretro-foreland basins. The general £exure equationdescribing the de£ection of an elastic plate assuming nohorizontal compressional force and a hydrostatic restoringforce is given by:
Dd4wðx; tÞ
dx4þ Drgwðx; tÞ ¼ qðx; tÞ ð4Þ
Where, w(x, t) is the vertical de£ection of point on theslab from the horizontal z5 0 datum at some time t, D isthe £exural rigidity parameter and x is the horizontal dis-tance from the free end of the slab.The second term repre-sents the upward hydrostatic restoring force per unit areathat results from the replacement of mantle rocks withcrustal rocks in a layer of thickness w.Thus, Dr5 rmantle-
rcrustl and g is the acceleration due to gravity.We use thisterm to describe the instantaneous ¢lling of the forelandbasins.The applied load, q(x, t) describes the time evolvingvertical force per unit length at the position x, derivedfrom the topography.
We assume that the system is supported on two semi-in¢nite plates which represent the subducting and over-riding plates (Fig. 1b). Initially, the slabs are unloaded and£at, thus we ignore system speci¢c pre-orogenic inheritedstratigraphy.
We investigate two di¡erent end member solutions toEqn. (4). Firstly, we use the end load solution to isolatethe ¢rst-order role of the asymmetric tectonic boundaryconditions in pro- and retro-foreland basin evolution.Secondly, we extend this model by coupling the basinstogether by appropriately partitioning the distributedtopographic load. The distributed load scheme reducesto the endload model if the wedge angles are set toapro5 aretro5 901.
End load model
The end load model assumes that all of the topographicload, q(x) can be reduced to a single line load, Q(t) at theend of the slab such that:
qð0Þ ¼ Q ðtÞqðx 6¼ 0Þ ¼ 0
The £exure of an elastic plate under the in£uence of anevolving end load (Turcotte & Schubert, 2001) is describedby:
wðx; tÞ ¼ a2e�x=a
2D�M0 sin
xaþ ðaQ ðtÞ þM0 cos
xa
n oð5Þ
r 2008 The Authors. Journal compilation r 2008 The Authors,Basin Research, 10.1111/j.1365-2117.2008.00366.x 5
Pro- vs. retro-foreland basins
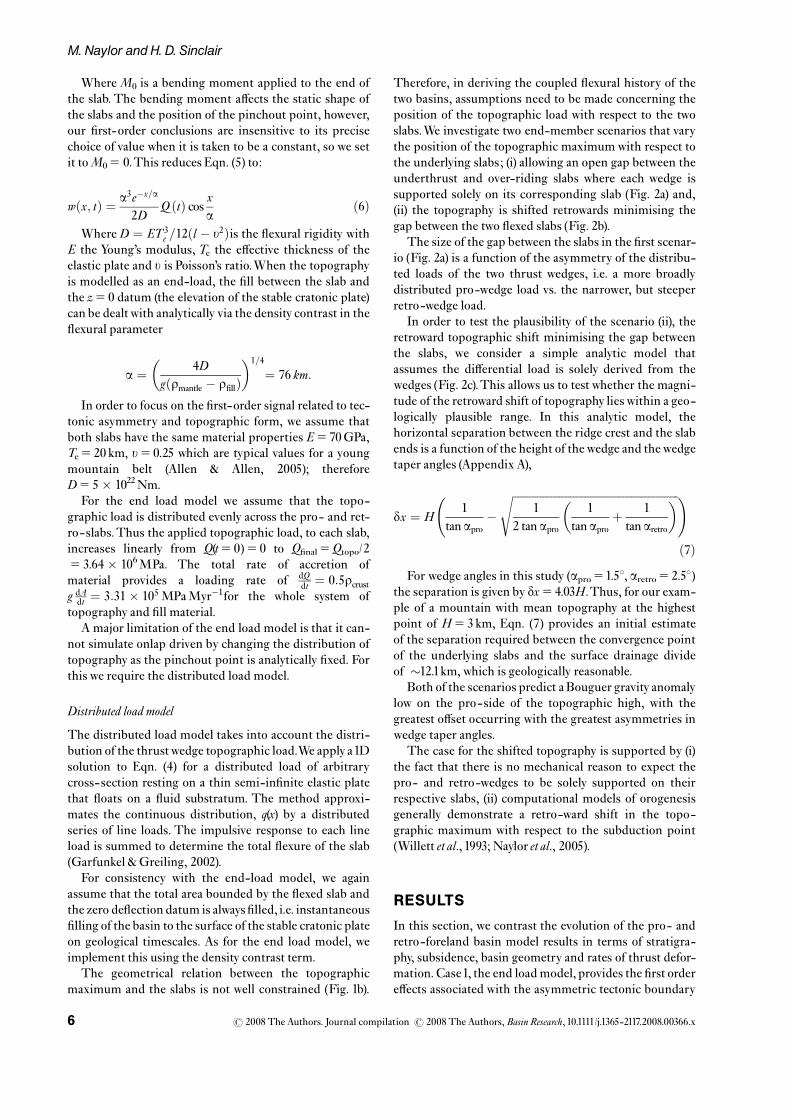
Where M0 is a bending moment applied to the end ofthe slab. The bending moment a¡ects the static shape ofthe slabs and the position of the pinchout point, however,our ¢rst-order conclusions are insensitive to its precisechoice of value when it is taken to be a constant, so we setit toM05 0.This reduces Eqn. (5) to:
wðx; tÞ ¼ a3e�x=a
2DQ ðtÞ cos x
að6Þ
Where D ¼ ET3e =12ðl � u2Þis the £exural rigidity with
E the Young’s modulus, Te the e¡ective thickness of theelastic plate and u is Poisson’s ratio.When the topographyis modelled as an end-load, the ¢ll between the slab andthe z5 0 datum (the elevation of the stable cratonic plate)can be dealtwith analytically via the density contrast in the£exural parameter
a ¼ 4Dg rmantle � rfillð Þ
� �1=4
¼ 76 km:
In order to focus on the ¢rst-order signal related to tec-tonic asymmetry and topographic form, we assume thatboth slabs have the same material properties E5 70GPa,Te5 20 km, u5 0.25 which are typical values for a youngmountain belt (Allen & Allen, 2005); thereforeD5 5 � 1022Nm.
For the end load model we assume that the topo-graphic load is distributed evenly across the pro- and ret-ro-slabs.Thus the applied topographic load, to each slab,increases linearly from Q(t5 0)5 0 to Q¢nal5Qtopo/25 3.64 � 106MPa. The total rate of accretion ofmaterial provides a loading rate of dQ
dt ¼ 0:5rcrustg dA
dt ¼ 3:31� 105 MPaMyr�1for the whole system oftopography and ¢ll material.
A major limitation of the end load model is that it can-not simulate onlap driven by changing the distribution oftopography as the pinchout point is analytically ¢xed. Forthis we require the distributed load model.
Distributed load model
The distributed load model takes into account the distri-bution of the thrustwedge topographic load.We apply a1Dsolution to Eqn. (4) for a distributed load of arbitrarycross-section resting on a thin semi-in¢nite elastic platethat £oats on a £uid substratum. The method approxi-mates the continuous distribution, q(x) by a distributedseries of line loads. The impulsive response to each lineload is summed to determine the total £exure of the slab(Garfunkel &Greiling, 2002).
For consistency with the end-load model, we againassume that the total area bounded by the £exed slab andthe zero de£ection datum is always ¢lled, i.e. instantaneous¢lling of the basin to the surface of the stable cratonic plateon geological timescales. As for the end load model, weimplement this using the density contrast term.
The geometrical relation between the topographicmaximum and the slabs is not well constrained (Fig. 1b).
Therefore, in deriving the coupled £exural history of thetwo basins, assumptions need to be made concerning theposition of the topographic load with respect to the twoslabs.We investigate two end-member scenarios that varythe position of the topographic maximumwith respect tothe underlying slabs; (i) allowing an open gap between theunderthrust and over-riding slabs where each wedge issupported solely on its corresponding slab (Fig. 2a) and,(ii) the topography is shifted retrowards minimising thegap between the two £exed slabs (Fig. 2b).
The size of the gap between the slabs in the ¢rst scenar-io (Fig. 2a) is a function of the asymmetry of the distribu-ted loads of the two thrust wedges, i.e. a more broadlydistributed pro-wedge load vs. the narrower, but steeperretro-wedge load.
In order to test the plausibility of the scenario (ii), theretroward topographic shift minimising the gap betweenthe slabs, we consider a simple analytic model thatassumes the di¡erential load is solely derived from thewedges (Fig. 2c).This allows us to test whether the magni-tude of the retroward shift of topography lies within a geo-logically plausible range. In this analytic model, thehorizontal separation between the ridge crest and the slabends is a function of the height of the wedge and the wedgetaper angles (Appendix A),
dx ¼ H1
tan apro�
ffiffiffiffiffiffiffiffiffiffiffiffiffiffiffiffiffiffiffiffiffiffiffiffiffiffiffiffiffiffiffiffiffiffiffiffiffiffiffiffiffiffiffiffiffiffiffiffiffiffiffiffiffiffiffiffiffiffiffiffi1
2 tan apro
1tan apro
þ 1tan aretro
� �s !
ð7Þ
For wedge angles in this study (apro51.51, aretro5 2.51)the separation is given by dx5 4.03H.Thus, for our exam-ple of a mountain with mean topography at the highestpoint of H5 3 km, Eqn. (7) provides an initial estimateof the separation required between the convergence pointof the underlying slabs and the surface drainage divideof �12.1km, which is geologically reasonable.
Both of the scenarios predict a Bouguer gravity anomalylow on the pro-side of the topographic high, with thegreatest o¡set occurring with the greatest asymmetries inwedge taper angles.
The case for the shifted topography is supported by (i)the fact that there is no mechanical reason to expect thepro- and retro-wedges to be solely supported on theirrespective slabs, (ii) computational models of orogenesisgenerally demonstrate a retro-ward shift in the topo-graphic maximum with respect to the subduction point(Willett et al., 1993; Naylor et al., 2005).
RESULTS
In this section, we contrast the evolution of the pro- andretro-foreland basin model results in terms of stratigra-phy, subsidence, basin geometry and rates of thrust defor-mation. Case1, the end loadmodel, provides the ¢rst ordere¡ects associated with the asymmetric tectonic boundary
r 2008 The Authors. Journal compilation r 2008 The Authors,Basin Research, 10.1111/j.1365-2117.2008.00366.x6
M. Naylor andH. D. Sinclair
conditions. Case 2, the distributed load model, highlightsthe important second-order e¡ects associated with expli-citly describing the thrustwedge as a distributed load.Thesimulated basins record only the foredeep depocenter(DeCelles & Giles, 1996) and does not consider sedimentaccumulated in wedge-top, forebulge or backbulge set-tings.
Case 1: end loadmodel
Stratigraphic evolution
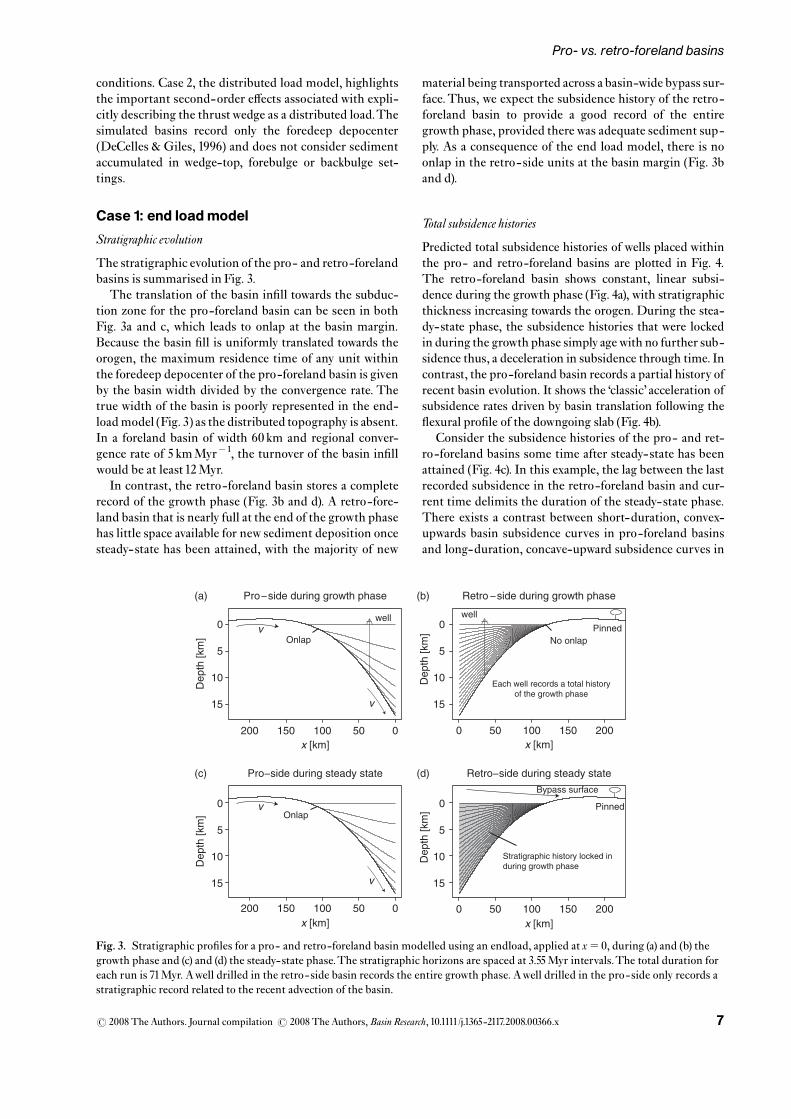
The stratigraphic evolution of the pro- and retro-forelandbasins is summarised in Fig. 3.
The translation of the basin in¢ll towards the subduc-tion zone for the pro-foreland basin can be seen in bothFig. 3a and c, which leads to onlap at the basin margin.Because the basin ¢ll is uniformly translated towards theorogen, the maximum residence time of any unit withinthe foredeep depocenter of the pro-foreland basin is givenby the basin width divided by the convergence rate. Thetrue width of the basin is poorly represented in the end-loadmodel (Fig. 3) as the distributed topography is absent.In a foreland basin of width 60 km and regional conver-gence rate of 5 kmMyr�1, the turnover of the basin in¢llwould be at least 12Myr.
In contrast, the retro-foreland basin stores a completerecord of the growth phase (Fig. 3b and d). A retro-fore-land basin that is nearly full at the end of the growth phasehas little space available for new sediment deposition oncesteady-state has been attained, with the majority of new
material being transported across a basin-wide bypass sur-face.Thus, we expect the subsidence history of the retro-foreland basin to provide a good record of the entiregrowth phase, provided there was adequate sediment sup-ply. As a consequence of the end load model, there is noonlap in the retro-side units at the basin margin (Fig. 3band d).
Total subsidence histories
Predicted total subsidence histories of wells placed withinthe pro- and retro-foreland basins are plotted in Fig. 4.The retro-foreland basin shows constant, linear subsi-dence during the growth phase (Fig. 4a), with stratigraphicthickness increasing towards the orogen. During the stea-dy-state phase, the subsidence histories that were lockedin during the growth phase simply agewith no further sub-sidence thus, a deceleration in subsidence through time. Incontrast, the pro-foreland basin records a partial history ofrecent basin evolution. It shows the ‘classic’ acceleration ofsubsidence rates driven by basin translation following the£exural pro¢le of the downgoing slab (Fig. 4b).
Consider the subsidence histories of the pro- and ret-ro-foreland basins some time after steady-state has beenattained (Fig. 4c). In this example, the lag between the lastrecorded subsidence in the retro-foreland basin and cur-rent time delimits the duration of the steady-state phase.There exists a contrast between short-duration, convex-upwards basin subsidence curves in pro-foreland basinsand long-duration, concave-upward subsidence curves in
15
10
5
0
15
10
5
0
15
10
5
0
15
10
5
0
Dep
th [k
m]
Dep
th [k
m]
Pro−side during growth phase Retro −side during growth phase
200 150 100 50 0x [km]
0 50 100 150 200x [km]
Dep
th [k
m]
Dep
th [k
m]
200 150 100 50 0x [km]
Pro−side during steady state
0 50 100 150 200x [km]
Retro−side during steady state
v
v
v
v
Onlap
Onlap
Bypass surface
Each well records a total historyof the growth phase
Stratigraphic history locked in during growth phase
No onlap
Pinned
Pinnedwell well
(a) (b)
(d)(c)
Fig. 3. Stratigraphic pro¢les for a pro- and retro-foreland basin modelled using an endload, applied at x5 0, during (a) and (b) thegrowth phase and (c) and (d) the steady-state phase.The stratigraphic horizons are spaced at 3.55Myr intervals.The total duration foreach run is 71Myr. Awell drilled in the retro-side basin records the entire growth phase. Awell drilled in the pro-side only records astratigraphic record related to the recent advection of the basin.
r 2008 The Authors. Journal compilation r 2008 The Authors,Basin Research, 10.1111/j.1365-2117.2008.00366.x 7
Pro- vs. retro-foreland basins

retro-foreland basins. A transition from the growth phaseto a steady-state phase driven by the asymptotic conver-gence of uplift and erosion rates would be characterisedby a more gradual and smoother retro-foreland subsi-dence curve than is suggested in Fig. 4c.
Case 2: distributed loadmodel
The end loadmodel demonstrates the ¢rst order signal de-rived from the asymmetric tectonic boundary conditionsthat require no assumptions about the topographic loaddistribution.We now use a distributed loadmodel to inves-tigate the second-order overprinting associated with thespatial distribution of mountain belt topography and thede¢nition of the basin margin by the deformation front.
The cross-sectional evolution of the mountain belt forthe open gap (Fig. 2a) and closed gap (Fig. 2b) loadingschemes is shown in Fig. 5.The depth of the slab pro¢lesis clearly sensitive to relatively subtle changes in the posi-tion of the topographic load.However, the basic basin evo-lution signal remains clear.
Onlap of cratonic margin
The position of both basin margins is now controlled by boththe £exural parameter and the form of the distributed load
(that de¢nes the position of the deformation front). Duringthe growth phase, the evolving distributed load introducesan extra £exural component that drives onlap in both thepro- and retro-forelandbasins.This inducedonlap by the en-croachment of the thrust load for the retro-foreland basin isan important correction to the end load model. Duringgrowth of the system, the regional convergence drives theprogressive accretion of new material into the thrust wedges,evolving the distributed load; at steady state, this accretionmerely maintains a stable load distribution. Consequently,during growth, the time averaged rate of migration of thepro-foreland cratonic basin margin is greater than the regio-nal convergence rate and equals it at steady state. In contrastthe onlap rate of the cratonic margin of the retro-forelandbasin is signi¢cantly less than the regional convergence rateduring growth, and negligible at steady state.
Deformation fronts
The deformation fronts are de¢ned to be the point wherethe wedge tips intersect the top of the basin succession(Fig.5).As thewedges grow, the deformation fronts propa-gate out across the basins (red lines in Fig. 5 show thepaleo-deformation front positions). Because the wedgesmust be the same heightwhere they meet (at the load divi-der), the relative taper angles of the wedges controls the
10
8
6
4
2
0
Dep
th (
km)
Age (Ma)70 60 50 40 30 20 10 0110 100 90 80
Growth phase Steady-state phase
Retro
Pro
(c)
90km
60km
30km
Dep
th (
km)
Pro−side subsidence
10
8
6
4
2
090km
60km
30km
Towardsforebulge
Wells towards forebulge recorda shorter history
Steady state phase
Growth phase
20 15 10 5 0
Age (Ma)
Dep
th (
km)
Age (Ma)
Retro−side subsidence (Growth phase)
10
8
6
4
2
0
90km
60km
30km
Towardsforebulge
70 60 50 40 30 20 10 0
(b)(a)
Fig.4. Graphs of the subsidence histories recorded in wells located 30 km, 60 km and 90 km away from the endload. (a) The retro-sidewells all record a complete history of the growth phase of the mountain-belt.There are no steady-state curves as no newaccommodation space is created during the steady-state phase. (b) The pro-side wells only record a modern subset of the entire historyas the oldest parts of the basin are being continually destroyed as they are accreted into the mountain belt.The growth phase showsgreater acceleration of subsidence rates with due to the extra £exural component of subsidence. (c) A sample scenario of how the pro-foreland and retro-foreland subsidence curves relate to each other.The pro-side wells only record a partial history of the modern basinevolution. In contrast, the retro-side wells only record the growth phase and then steadily age with no further subsidence.
r 2008 The Authors. Journal compilation r 2008 The Authors,Basin Research, 10.1111/j.1365-2117.2008.00366.x8
M. Naylor andH. D. Sinclair

relative rates at which the deformation fronts propagateout in order to accommodate the accretion of newmaterial.As a kinematic consequence of how material is accretedinto mountain belts, the mean surface slope angle of theretro-wedge is generally steeper than that of the pro-wedge (Willett et al., 1993).Thus, geometrically, the topo-graphic load of the retro-wedge is more compact than thepro-wedge load and more mass is stored in the pro-wedgethan the retro-wedge. Further, the rate at which the defor-mation fronts propagate out across the basin are directlyrelated to their taper angles.We can compare the rate atwhich the wedges grow using the cross-sectional areas ofeach wedge and noting that they must have the sameheight,H (Fig. 2c).The rate of propagation of each defor-mation front relative to the load divider is then the rate of
change in the length of the base of the wedge,
Aprotopo ¼
H2
2 tan apro
� �> Aretro
topo ¼H2
2 tan aretro
� �
vproDF ¼dHdt
1tan apro
� �> vretroDF ¼
dHdt
1tan aretro
� � ð8Þ
Thus, the rate at which the retro-wedge deformationfront propagates out, vretroDF is slower than the pro-wedgedeformation front vproDF(Fig. 6a and b) providedaretro4apro.
The rate at which material crosses the deformationfronts can be used to estimate the amounts of tectonicdeformation, i.e. thrusting.Themean rate atwhichmaterialis accreted at the pro-side deformation front is the sum ofthe rate at which the deformation front migrates out and
v
αpro
Load divider
δx=0
αretro
v
Load divider
δx
αpro αretro
−200 −100 100 200
5
17.8Myr
−200 −100 100 200
10
5
35.5Myr
−200 −100 100 200
20
15
10
5
71.0Myr
0
10
5
0
0
0
0
0
0
20
15
10
5
0
x [km]
Dep
th [k
m]
Open gap
Dep
th [k
m]
Dep
th [k
m]
(b)
(a)
(c)
−200 −100 100 200
5
0
17.8Myr
−200 –100 100 200
35.5Myr
−200 −100
0
0
0 100 200
71.0Myr
x [km]
Closed gap
(e)
(d)
(f)
Fig. 5. Stratigraphic evolution of pro- and retro-foreland basins coupled by a topographic wedge load. (a^c) Show the time evolutionfor the open gap model where the pro-wedge is supported on the subducting slab and the retro-wedge is supported on the over-ridingplate. (d^f) Show the time evolution for the closed gap model where the topographic load is shifted laterally in order to close the gapbetween the subducting and over-riding plates.The stratigraphic horizons are projected under the mountain belt as greydashed lines tohighlight the contrast between the basins; such stratigraphy is of course deformed as the basin is consumed at the deformation fronts.The evolution of the paleo-deformation front positions are shown in red (online).
r 2008 The Authors. Journal compilation r 2008 The Authors,Basin Research, 10.1111/j.1365-2117.2008.00366.x 9
Pro- vs. retro-foreland basins

the convergence rate atwhich the basin ¢ll is translated to-wards the mountain belt. Because the retro-side basin ¢llis not translated and the retro-side deformation front pro-pagates out at a slower rate than its counterpart on thepro-side; the rate of structural deformation (i.e. accretion)of the basin margin is signi¢cantly lower on the retro-sidethan the pro-side.
Basin width and depth
In contrast to the deformation fronts, the position of thebasin margins is more strongly controlled by the £exuralparameter than the topographic load, and so if we assumeconstant £exural rigidities, the retro-foreland basin iswider than the pro-foreland basin. This is a result of thedegree to which the thrust wedge occupies the £exuralde£ection vs. the sediment in¢ll; with lower taper thrustwedges, often characterised by a salt detachment, thewedge can propagate to occupy a large portion of the £ex-ural depression (Ford, 2004), and so the foreland basins arerelatively narrow. With steeper taper angles, as charac-
terises retro-wedges, more of the £exural depression is¢lled with sediment rather than deformed wedge, hencethe basins arewider (Fig. 6c andd). Because the retro-fore-land basin is wider, so it is also deeper at the deformationfront than the pro-foreland basin.This holds for both to-pographic load distribution scenarios (Fig. 5).
Thewidth of both basins decreases as the mountain beltgrows, primarily due to the deformation front propagatingout faster than the pinchout point (Fig. 6).Because the rateat which the deformation fronts and basin margins propa-gate out decrease as the mountain belt grows, the width ofthe basins stabilises with time.
Chronostratigraphy of basin ¢ll
Chronostratigraphic plots are key to understanding thetemporal development of a basin, and are simply plottedas time against the distribution of sedimentation and ero-sion (Wheeler, 1964). In foreland basins, it is usual to plotthe spatial development of the stratigraphy with referenceto a stable cratonic foreland. However, when considering
−200 −100 0 100 200
0
10
20
30
40
50
60
70
0
10
20
30
40
50
60
70
0
10
20
30
40
50
60
70
0
10
20
30
40
50
60
70
Absolute position of fronts (km)
Mod
el ti
me
(Myr
)
Time evolution of the frontswith open gap
70 80 90 100 110Basin Width (km)
Mod
el ti
me
(Myr
)
Time evolution of basin widthwith open gap
−200 −100 0 100 200Absolute position of fronts (km)
Mod
el ti
me
(Myr
)
Time evolution of the frontswith closed gap
70 80 90 100 110Basin Width (km)
Mod
el ti
me
(Myr
)
Time evolution of basin widthwith closed gap
Pro Retro Pro Retro
ProPro
RetroRetro
Steady state
GrowthSteady state
Growth
Steady state
Growth
Steady state
Growth
XPPpro XDF
proX
DFretro X
PPretro XPP
pro XDFretro
XPPretroX
proDF
(a)
(c) (d)
(b)
Fig. 6. Graphs showing the geometric evolution of the pro- and retro-foreland basin margins (solid lines for pro-foreland basinmargins and dashed lines for the retro-foreland basin margins). (a and b) Show the absolute positions of the basin margins for the opengap and closed gap experiments, respectively.The outermost lines are the basin pinchout points, xPP and the innermost lines are thedeformation fronts, xDF. (c and d) Show the resulting evolution of the basinwidths. Notice that the retro-foreland basins (dashed lines)are wider than the pro-foreland basins (solid lines) and that closing the gap between the slabs minimises this di¡erence.
r 2008 The Authors. Journal compilation r 2008 The Authors,Basin Research, 10.1111/j.1365-2117.2008.00366.x10
M. Naylor andH. D. Sinclair

the synchronous development of two opposing forelandbasins, it is interesting to note that these cannot be plottedon the same ¢gure, as the cratonic forelands are movingrelative to one another i.e. there is no ¢xed reference point.The reference frame for Fig. 6 is x5 0 the regionwhere theslabs meet. The reference frame for the chronostrati-graphic fronts in Fig. 7 is a ¢xed point on each of theirrespective plates. As the pro-foreland basin sits on thedown going plate but is moving relative to it, the chronos-tratigraphic reference frame changes with respect to plateconvergence rate aswell as the growth of the foreland basinduring the growth phase (for an expansion on this refer-ence frame problem see Appendix B).
Given the di⁄culty of reference frames in these set-tings, we will consider the two basins separately, as if beingstudied on an individual basis. The contrasting characterof the pro- and retro-chronostratigraphic plots (Fig. 7)can be summarised in terms of the temporal preservationof stratigraphy, and the rate of migration over the foreland.Pro-foreland basins only preserve the most recent recordof basin development, the rest being accreted into thethrust belt. The age of the oldest sediments found at thebottom of the basin ¢ll at the deformation front equatesto the width of the basin times the rate of convergence. Incontrast, retro-foreland basins preserve a much fuller his-tory of mountain belt growth and steady state, as there islittle destruction of the basin through accretion. However,the transition from growth to steady state should berecorded by a reduction in sediment accumulation rates,as there is no longer a tectonic driver of subsidence.Thereare only subtle di¡erences between the open and closedgap experiments.
The onlap of the outer margin of a pro-foreland basin isdriven byboth the growth of the mountain belt, and the un-derthrusting of the plate at the convergence rate. Hence,during growth, the onlap rate combines these factors, butduring steady state it should equate to the convergence rate(Fig. 7). In contrast, the progressive onlap of the retro-fore-land basin can only be driven by the growth of the mountainbelt, and so during steady-state onlap should cease.
EXAMPLES
Pro-foreland basins
The onlap of the cratonic margin of pro-foreland basinshas been documented from the Palaeozoic Appalachianforeland basin (Quinlan & Beaumont, 1984; Tankard,1986) the Cretaceous strata of the North Slope forelandbasin, Alaska (Bird &Molenaar, 1992) and from numerousTertiary examples such as the Pyrenees (Verge¤ s etal., 1998),Alps (Sinclair,1997) andTaiwan (Lin etal., 2003). As such itis a well known attribute of these basin types. As outlinedin the model, such dramatic onlap is driven by the advec-tion of the pro-foreland basin ¢ll into the deformingthrust wedge. A further outcome of this is that these basintypes typically only preserve a stratigraphicrecord of the more recent stages of orogenesis; the earlierbasin ¢ll being accreted into the thrust wedge, and com-monly eroded. This is why there is a lack of stratigraphyolder than �16Ma in the southHimalayan foreland basinof the Gangetic Plains when collision started �50Ma(Burbank et al., 1996; Najman et al., 2001). Similarly, thereis only a partial preservation of the Eocene/Oligocene his-tory of the North Alpine Foreland Basin in the folds andthrusts of the Helvetic domain of the Swiss Alps (Home-wood et al., 1986).
Subsidence histories of foreland basins in generalare thought to be characterised by accelerating subsidencethrough time (Miall, 1995; Allen & Allen, 2005). Weview this as a unique characteristic of pro-forelandbasins supported by a range of examples including NewGuinea/Timor Trough (Haddad & Watts, 1999), westernTaiwan (Lin et al., 2003), Ebro Basin, Pyrenees (Verge¤ set al., 1998), and the North Alpine Foreland Basin (Allenet al., 1986). As demonstrated in the modelling experi-ments, this pattern is dominated by subsidence inducedby the progressive underthrusting of the slab beneaththe mountain belt with a secondary component drivenby any growth in the size of the topographic load.The former control does not occur in retro-forelandbasins.
−500 −400 −300 −200 −100 0 100 200
Position of chronostrat fronts (km)
Mod
el ti
me
(Myr
)
Chronostratigram with open gap
−500 −400 −300 −200 −100 0 100 200
Position of chronostrat fronts (km)
Mod
el ti
me
(Myr
)
Chronostratigram with closed gap
0
10
20
30
40
50
60
70
0
10
20
30
40
50
60
70
−600 −600
Pro Retro Pro Retro
Deformationfronts
Pinchout points
Steady stateGrowth
Steady stateGrowth
(b)(a)
Fig.7. Chronostratigraphic plots summarise the temporal preservation of stratigraphy, and the rate of basin migration over theforeland.The pro- and retro-chronostratigraphic plots are constructed relative to their respective stable cratons.
r 2008 The Authors. Journal compilation r 2008 The Authors,Basin Research, 10.1111/j.1365-2117.2008.00366.x 11
Pro- vs. retro-foreland basins

Retro-foreland foreland basins
Detailed documentation of retro-foreland basins is lesscommon than for their pro-foreland counterparts. TheAquitaine Basin to the north of the Pyrenees in southernFrance (Fig. 8) is on the retro-side of the mountain belt(Sinclair etal., 2005) and has been thoroughly documenteddue to the long history of hydrocarbon exploration andproduction (Bourrouilh et al., 1995). In contrast to thepro-foreland basins described above, the Aquitaine Basinforms a wedge of sedimentary in¢ll 4^6 km thick, thattapers over a distance of approximately 140 km away fromthe Pyrenees, and contains a full stratigraphic record ofpre- and syn-orogenic sedimentation (Desegaulx et al.,1991) (Fig. 8). The Upper Cretaceous to Oligocene unitsall thin onto the European cratonwith awedge-shaped ar-chitecture that are vertically superimposed i.e. they exhibitlittle, if any, onlap. Additionally, the tectonic subsidencehistories of theAquitaineBasin (Fig.8c) record a minor ac-celeration in subsidence at around the onset of Pyreneanorogenesis ( �60Ma), followed by a deceleration to zerosince then (Desegaulx etal.,1991).The pre-orogenic subsi-dence of the Aquitaine Basin records the remnant thermalsubsidence to the thinned lithosphere. In contrast, the tec-tonic subsidence of a restored stratigraphic successionfrom the South Pyrenean Fold and thrust belt records a
short-lived, accelerating record during early Eocene time.Additionally, in comparing theAquitaine to theEbroBasin(its pro-foreland counterpart), the amount of basin short-ening is markedly di¡erent with approximately 60 kmshortening of the Ebro Basin (Verge¤ s, 1999) too10 km inthe Aquitaine basin (Desegaulx & Brunet, 1990).
Another well documented example of a retro-forelandforeland basin is the SouthWestland Basin to the west ofthe Southern Alps, New Zealand (Kamp et al., 1992;Sircombe & Kamp, 1998). This Pliocene basin is locatedimmediately west of the steep retro-wedge dominated bythe Alpine Fault (Beaumont et al., 1996) and contains a fullstratigraphic record of Southern Alps orogenesis. Theshortening of the Australian plate adjacent to the basin issmall (from 2 to 12 km), and is accommodated on steepbasement faults rather than thin-skinned deformation;again attributes typical of retro-wedge deformation fronts.Tectonic subsidence within the basin accelerated at5^6Ma, and either remained steady or decelerated sincethat time as predicted above for retro-foreland basins.Similar examples of decelerating subsidence historiesare documented for the Miocene history of the TertiaryPiedmont basin, which from Oligocene through earlyMiocene times was part of the western Po Basin compres-sional system (Carrapa et al., 2003). Hence, this basin rem-nant records the retro-foreland basin of the southern
(b)
(c)(a)
Fig. 8. ThePyrenees mountain belt as a type example of a systemwith a pro-foreland (EbroBasin) and retro-foreland (AquitaineBasin)foreland basin that can be compared in terms of their stratigraphic in¢ll and tectonic subsidence histories. (a) Summary cross-section ofthe Pyrenean mountain belt formed by the Iberian plate of Spain subducting beneath the European Plate of south-western France.Thissection is constrained by the ECORS deep seismic section (Choukroune, 1989), other geophysical measurements (Pous et al., 1995) andsurface geology (Mun� oz, 1992). (b) Close-up of the stratigraphy of the Ebro (Verge¤ s, 1999) and Aquitaine Basins (Desegaulx et al., 1991).(c) Subsidence plots from twowells located near to the deformation front in the Aquitaine Basin (Desegaulx & Brunet, 1990) and fromstructurally restored stratigraphic pro¢les from the central South Pyrenean fold and thrust belt (Verge¤ s,1999).Note that the Ebro Basincontains a limited section of stratigraphy dominated byUpper Eocene strata; the subsidence plots through this record a rapid phase ofaccelerating subsidence at this time. In contrast, the Aquitaine Basin contains a much broader chronostratigraphic range, and showsonly minor tectonic subsidence during the early stages of orogenesis, but this decreases to zero.These contrasts match predictions madefor pro-foreland vs. retro-foreland foreland basin development, respectively.
r 2008 The Authors. Journal compilation r 2008 The Authors,Basin Research, 10.1111/j.1365-2117.2008.00366.x12
M. Naylor andH. D. Sinclair

French Alps, although this is complicated by Apenninedeformation and loading from the south.
The full stratigraphic record of orogenesis, the rela-tively insigni¢cant record of progressive basin onlap, andthe linear to decelerating subsidence histories of these ba-sins ¢t the modelled predictions, and contrast with theirpro-foreland counterparts.
SUMMARYAND DISCUSSION
While the chosen boundary conditions that determineslab behaviour beneath mountain belts are vital to under-standing orogenesis, the predictions for the di¡erentiationof pro- and retro-foreland basins require only an asymme-try of underthrusting and consequent thrust accretion.
The generic ¢rst-order signal is summarised in Fig. 9.A collisional mountain belt is generally bounded by twobasins, a relatively mobile pro-basin above the subductingslab and a relatively stable retro-basin above the over-rid-ing slab (Figs 8a and 9a).The rate of growth of the moun-tain belt is primarily controlled by the net rate of accretionof new material (Eqn. (2)).Thus the systemwill grow fasterwhen accreting thicker material and for faster convergencerates.Varying the rate of accretion also has other implica-tions because it controls the rate atwhich the pro-forelandbasin ¢ll is carried towards the mountain belt. Increasingthe convergence rate increases the contrast between thepro- and retro-foreland basins; it increases the rate of tec-tonic deformation at the pro-deformation front which in-creasing the thickness of the accreted layer would not.However, increasing h promotes longer thrust sheets (Platt,1988;Naylor&Sinclair, 2007).Varying accreted thickness canbe taken into account by generalising Eqn. (2)to Aaccreted ¼
RvhðtÞdt. Such changes in thickness may
occur because of inherited rheology or a progressive transi-tion from thin skinned to thick-skinned tectonics.The im-pact of increasing the thickness of the accreted layer is toincrease the rate of accretionwith time, delaying the conver-gence of uplift and erosion rates. However, such variationsonly transiently modify the behaviour we have documentedin this paper rather than negating it.
The relative rates of migration of the deformationfronts relative to the load divide are purely a function ofthe wedge angles, assuming critical wedge theory. Rear-ranging Eqn. (8),
vproDF
vretroDF¼ Apro
Aretro ¼tan aretrotan apro
The pro- and retro- wedge angles, we chose are at thelower end of the range of observed angles.This a¡ects thephysical geometry, but it is the ratio of these angles thatcontrols the relative asymmetry in the propagation rates.Increasing the wedge angles makes the mountain belt nar-rower, tending the system towards the endload model, andcontains less mass for the same maximum height at thedivide and is bounded by shallower basins.
Onlap is driven by both the outward propagation of thepinchout point by an increasingly distributed load and anyrelative motion between stable craton and the mountainbelt that translates the basin ¢ll; out of these two mechan-isms it is the regional convergence that predominantlydrives onlap. The mobile pro-foreland basin records on-lapping stratigraphy and the oldest sediments in the basincan be found beneath the deformation front with an ageapproximated by the width of the basin divided by the re-gional convergence rate (Fig. 9b, Appendix B, eqn (B1)).Young sediments continue to onlap in the steady statephase while convergence is sustained. In contrast, the old-est sediments in the retro-foreland basin date from the in-itiation of growth of the mountain belt (eqn (B3)) and thisbasin records little onlap. As steady state is attained, theretro-foreland basin becomes ¢lled and dormant with abypass surface.
Owing to the long-term translation of the mobile pro-foreland basin towards the mountain belt at the far ¢eldconvergence rate, the pro-foreland basin records acceler-ating subsidence (Fig. 9c). In contrast, the retro-basin re-cords decelerating subsidence in the time period thatrelates to the transition from growth to steady state.
We can relate surface uplift to the increasing topo-graphic mass by di¡erentiating Eqn. (1),
dAtopo
dt¼ KH
dHdt
Where
K ¼ 1tan apro
þ 1tan aretro
� �:
From this, using the rate of accretion (2) and dropping theproportion of material that is accreted into the topography(which is approximately 1/6), we can rearrange for the sur-face uplift rate,
dHdt� vh0
KHIncreasing either wedge angle decreases K and increases
the surface uplift rate required to accommodate a givenin£ux of material. Further, this equation reinforces therelationship that the mean surface uplift rate will decrease asa mountain belts increase in size unless the rate of accretionof new material also increases.While this e¡ect is not impor-tant for the ¢rst-order signal documented in this paper, itdoes become important when explicitly coupling suchsystems to a surface process model (e.g.Whipple & Meade,2006) to investigate sediment sourcing and supply.Thus, theheight of the mountain belt at steady state is also dependentupon the wedge angles (Dahlen& Suppe,1988).
By studying the ¢rst-order e¡ects that are distinguish-able between pro- and retro-foreland basins we have madea number of assumptions in the modelling approach thatneed further quali¢cation. The predicted evolution of theorogenic and cratonic basin margins for both basin types isdepicted as the intercept of the deformation front and the
r 2008 The Authors. Journal compilation r 2008 The Authors,Basin Research, 10.1111/j.1365-2117.2008.00366.x 13
Pro- vs. retro-foreland basins

Pro-forelandbasin
Retro-forelandbasinPro-wedge Retro-wedge
(a)
DistanceDistance
Time
Tim
e
Tim
eD
epth
Dep
th
Time
Onset oforogenesis
Onset oforogenesis
Onset oforogenesis
Growth
Steady-state
Pre-orogenic craton stratigraphy Pre-orogenic craton stratigraphy
Unconformable gap
Onlap
Steadystate
Steadystate
Growth Growth
(b)
(c)
Condensed intervaldue to bypass
-oldest strata in foredeep =basin width /convergence rate
-oldest strata in foredeep =onset of orogenesis
Underthrust lithosphere
Overriding lithosphere
- Chronostratigraphy
- Tectonic subsidence
Fig.9. Summary ¢gure contrasting the basin characteristics of Pro-foreland (left-hand side) and Retro-foreland (right-hand side)foreland basins. (a)ThePro-foreland foreland basin exhibits dramatic basin onlap of the cratonic margin, at a rate greater or equal to theplate convergence rate dependent uponwhether the thrust wedge is in a growth or steady-state phase, respectively; in contrast theRetro-foreland basin records little onlap except in the early stage of growth.This contrasting onlap pattern is clearly seen in thechronostratigraphic equivalent, (b) which also illustrates the relatively limited chronostratigraphic interval preserved in the pro-foreland basin relative to the retro-foreland basin.Note that the reference frame for both chronostratigraphic ¢gures are their respectivecratonic plates (cf. Appendix B and Fig.10), and not an absolute frame.The degree to which foreland basin deposits are accreted andpreserved in the thrustwedges also contrasts markedlydue to the ongoing advection of the pro-foreland basin’s succession into the pro-wedge, in contrast to the retro-foreland basin succession whichwill only be accreted during growth of the mountain belt. Hence, theoldest deposits preserved in the foredeep of the pro-foreland basin equal the width of the basin divided by the convergence rate. Incontrast, the oldest strata preserved in the foredeep of the retro-foreland basin record the initiation of orogenesis.The tectonicallydriven subsidence of the two basins also contrasts, (c) The pro-foreland basin records accelerated subsidence over a relatively shortinterval of orogenesis. In contrast, the retro-foreland basin records the full history of the basinwith initial uniform subsidence duringgrowth of the mountain belt, and hence of the retro-thrust wedge, followed by zero subsidence during steady-state when the retro-wedge no longer accretes new material. During this latter stage, the retro-foreland basin record a condensed stratigraphic successionwhich is likely to be dominated by bypass of the sediment generated in the mountain belt and exported farther a¢eld.
r 2008 The Authors. Journal compilation r 2008 The Authors,Basin Research, 10.1111/j.1365-2117.2008.00366.x14
M. Naylor andH. D. Sinclair

basin ¢ll, and the stable craton and the basin ¢ll, respec-tively. Naturally, the way in which sediment supply is mod-elled determines these parameters. For this exercise, wehave assumed that all accommodation space in the basinsare ¢lled to a reference base-level (the z5 0 datum). Clearly,these geometries will di¡er for under or over¢lled basinsuccessions (Covey, 1986; Jordan, 1995). Consequently, it isessential that the nature of the stratigraphy used to approx-imate the cratonic basin margin is clearly documented interms of the facies (Sinclair, 1997); i.e. whether they recordcoastal, deep-water or fully continental settings.
Critical to understanding output from numerical mod-els is determining the role of the boundary conditions; inthis case the laws that determine the behaviour of thedowngoing tectonic slab and its impact on the growth ofthe doubly vergent thrust wedge. Understanding the nat-ure of the coupling between the two slabs is a complicatedissue and depends upon the nature and maturity of theorogen. For example, we applied the same £exural rigidityto both slabs, even though there is no requirement that the£exural rigidities should be the same. Such variations willmodify the curvature of the slabs that bound the basinsand change the topographic shift required to close thegap between the slabs. Because the shift in the topographydid not have a major e¡ect on the ¢rst order signal, we ex-pect our conclusions to be robust to reasonable contrastsin elastic thickness between the two slabs.
In small, collisional orogens (e.g. Pyrenees, Olympics,Taiwan) with little evidence of crustal melting, the discussionof a physical coupling is justi¢ed, as the surface geology revealsdiscrete faulted contacts between rocks accreted from thedowngoing slab vs. those accreted from the overlying slab(Mun� oz,1992;Willett etal., 2003).Mountain belts with signif-icant crustal melting of the root demonstrate the juxtapositionof crustal meltwith mantle melt and the nature of the contactbecomes less obvious. For very large orogens where theirheight is limited by the rheology of a £owing lower crust andmantle as recorded through volcanism (e.g. Himalaya/Tibetand Andes) the slabs are clearly decoupled. Examples such asthe Southern Alps, New Zealand provide a case of strongthrust wedge asymmetry (Kamp & Tippett, 1993), but withcontinuous deformation of themantle lithosphere, i.e.withouta dominant subducting slab (Molnar et al., 1999).Thus, whilethe separation of pro- and retro-wedges in settings such asthe Southern Alps has been strongly advocated (Beaumontetal.,1996), the deep structure that determines this asymmetryis debated.
WIDER IMPLICATIONS
Enhanced understanding of the coupling between thegrowth of mountain belts and the development of their as-sociated foreland basins enables more sophisticated inter-pretation of foreland basin stratigraphy. Importantly, inorder to gain insight into the growth phase of a mountainbelt, it is clear that the best preserved records are at thebase of the retro-foreland basin. It is possible to recon-struct this record from the pro-foreland basin, but only if
the stratigraphy is preserved in the accreted thrust units ofthe pro-wedge of the mountain belt (e.g. Homewood et al.,1986; Lihou & Allen, 1996). Similarly, it is the retro-fore-land basin that should hold a record of the transition fromgrowth of the mountain belt to steady-state; the subsi-dence histories should record this transition as a cessationof tectonic subsidence, and so the stratigraphy shouldreveal increased condensation. In contrast, the mostrecent history of orogenesis will always be preserved inthe pro-foreland basin.
The distinction between linear basin subsidenceinduced by the growth of the thrust wedge and accelerat-ing subsidence generated by the advection of the basindown and towards the mountain belt implies that subsi-dence histories may be inverted to distinguish thesecontrols.The question of whether an overthrust plate hasbeen actively subducted is usually investigated usinggeophysical imaging (Van der Voo et al., 1999). We nowconsider basin subsidence records as a valuable additionaltool to answering this question.
The recognition that peripheral foreland basins can beseparated into two end-member models with distinctsubsidence histories and stratigraphic architectures alsohas signi¢cant implications for hydrocarbon prospectivity.The subsidence history of a sedimentary basin is the pri-mary control on the maturation history of hydrocarbons(Allen & Allen, 2005). Despite the presence of excellentstructural traps on the edge of many foreland basins,source rocks are commonly ‘overcooked’ due to the rapidsubsidence near the deformation front; this is particularlyproblematic for pro-foreland basins, with the notableexception of the Zagros thrust belt (Koop & Stoneley,1982). The problem of overcooked source rocks isenhanced in post-orogenic settings when the basin isinverted in response to the reduction of the orogenic load.In examples such as the North Alpine Foreland Basin, thesuccession has been eroded and exhumed by over 1km inthe last 5Myr in response to the cessation of deformationand increased erosion rates in the mountain belt (Ceder-bom et al., 2004). Retro-foreland basins may also containsigni¢cant hydrocarbon reserves such as the AquitaineBasin (Bourrouilh et al., 1995). Hence, understanding thegeodynamic context of a foreland basin in terms of it beinga retro- or pro-foreland basin aids prediction of sourcerock maturation, and potentially reservoir architecture.
Finally, such a clear distinction between peripheral fore-land basin types based on the asymmetry of the tectonicforcing raises the question ofwhether this has implicationsfor understanding retro-arc foreland basins (Jordan,1995).To a ¢rst order, the boundary conditions that charac-terise continent/continent collision appear similar toocean/continent collision, i.e. the underthrusting or sub-duction of one lithosphere beneath another. Based on this,it is tempting to suggest that the model predictions for ret-ro-foreland foreland basins should be similar to those forretro-arc foreland basins. However, there are some cleardi¡erences that may play a signi¢cant role in distinguish-ing the controls on these basin types.The marked density
r 2008 The Authors. Journal compilation r 2008 The Authors,Basin Research, 10.1111/j.1365-2117.2008.00366.x 15
Pro- vs. retro-foreland basins

contrast between oceanic and continental lithosphere is astrong driver of subduction leading to steeper subductionangles (Royden, 1993), enhanced melting (Pearce & Peate,1995), and greater impact on mantle circulation and hence,dynamic topography (Burgess et al., 1997). Enhanced melt-ing a¡ects rheology, and hence the mechanical growth ofthe mountain belt (Willett et al., 1993), and dynamic subsi-dence due to mantle £ow is superimposed on the isostaticsignal, greatly enhancing the wavelength of subsidence ofthe retro-arc basin (Burgess et al., 1997). Therefore, webelieve that retro-foreland and retro-arc foreland basinsshould be di¡erentiated and that more work is needed todetermine their contrasting characteristics.
CONCLUSIONS
In this paper,we have described how the asymmetrical for-cing of orogenic systems by the underthrusting of oneplate relative to the other results in contrasting forelandbasins. Speci¢cally,
Subsidence histories of pro-foreland basins comprise alinear component driven by thrust wedge growth, and anaccelerating component driven by the advection of the basintowards the thrust wedge. In contrast, retro-foreland basinsonly subside in response to the growth of the thrust wedge,and hence are linear during the growth phase, and have notectonic driver during steady-state. On a plot of subsidencethrough time, pro-foreland basin subsidence will be convex-upward, whereas retro-foreland basins are concave (Fig.9c).
Pro-foreland basins are characterised by a basin ¢ll thatrecords only the recent history of the mountain belt; therecorded interval is given by the width of the basin dividedby the plate convergence rate. In contrast, retro-forelandbasins preserve the full stratigraphic record of mountaingrowth, but only a condensed record of steady-state devel-opment of a mountain belt (Fig.9b).
Pro-foreland basins record basin onlap of the cratonicmargin equal to the rate of plate convergence plus a com-ponent driven by outward growth of the thrustwedge. Ret-ro-foreland basins record a relatively small amount ofonlap driven solely by thrust wedge growth. During stea-dy-state (i.e. with no growth), retro-foreland basins recordlittle or no onlap, whereas pro-foreland basins record on-lap equal to plate convergence rate (Fig.9b).
These conclusions are supported by ¢eld examples.Classic examples of pro-foreland basins include theAppa-lachian foredeep, the Himalayan foredeep, the NorthAlpine Foreland Basin, the Ebro Basin (south Pyrenees)and the west Taiwan basin. Examples of retro-forelandbasins include the SouthWestland Basin (New Zealand),The Po Basin (southern European Alps) and the AquitaineBasin (north Pyrenees).
ACKNOWLEDGEMENTS
We would like to thank Brian Horton, Guy Simpson andan anonymous reviewer for constructive reviews and Ray
Ingersoll for discussions on terminology.M.N.was fundedbyEPSRCgrantGR/T11753/01as part of theNANIAproject.
REFERENCES
Allen, P.A.&Allen, J.R. (2005)Basin Analysis, 2nd edn. Black-well Publishing, Oxford.
ALLEN, P.A., HOMEWOOD, P. & WILLIAMS, G.D., eds. (1986)Foreland Basins: An Introduction. Foreland Basins. InternationalAssociation of Sedimentologists. Blackwell Scienti¢c Publica-tions, Oxford.
Beaumont, C. (1981) Foreland Basins. Geophys. J. R. Astronom.Soc., 65, 291^329.
Beaumont, C., Kamp, P.J.J., Hamilton, J. & Fullsack, P.(1996) The continental collision zone, South Island, NewZealand: comparison of geodynamical models and observa-tions. J. Geophys. Res.-Solid Earth, 101, 3333^3359.
Beaumont, C., Mun� oz, J.A., Hamilton, J. & Fullsack, P.(2000) Factors controlling the alpine evolution of the CentralPyrenees inferred from a comparison of observations and geo-dynamical models. J. Geophys. Res.-Solid Earth, 105, 8121^8145.
BIRD, K.J. & MOLENAAR, M.C., eds. (1992) The North Slope Fore-land Basin, Alaska. Foreland Basins and Fold Belts. AmericanAssociation of PetroleumGeologistsMemoirs,Tulsa.
Bourrouilh,R.,Richert, J.P. & Zolnai,G. (1995) The NorthPyrenean Aquitaine Basin, France ^ evolution and hydrocar-bons.AAPGBull., 79, 831^853.
Burbank, D.W., Beck, R.A. &Mulder,T., eds. (1996) The Himala-yan Foreland Basin. TheTectonic Evolution of Asia CambridgeUniversity Press.
Burgess, P.M.,Gurnis,M. &Moresi, L. (1997) Formation ofsequences in the cratonic interior of North America by inter-action between mantle, eustatic, and stratigraphic processes.Geol. Soc. Am. Bull., 109, 1515^1535.
Carrapa,B.,Bertotti,G.&Krijgsman,W. (2003) Subsidence,stress regime and rotation(s) of a tectonically active sedimen-tary basin within the Western Alpine Orogen: the tertiaryPiedmont Basin (AlpineDomain,NW Italy). In:TracingTectonicDeformation Using the Sedimentary Record (Ed. byT. McCann &A. Saintot). 208, 205^227.The Geological Society of London,London.
Cederbom, C.E., Sinclair,H.D., Schlunegger, F. & Rahn,M.K. (2004)Climate-induced rebound and exhumation of theEuropean Alps.Geology, 32(8), 709^712, doi: 10.1130/G20491.1.
Choukroune, P. (1989) The Ecors Pyrenean deep seismic pro-¢le re£ection data and the overall structure of an OrogenicBelt.Tectonics, 8, 23^39.
Covey, M. (1986) The evolution of Foreland Basins to steadystate: evidence from the Western Taiwan Foreland Basin. In:Foreland Basins (Ed. by P.A. Allen & P. Homewood), Spec. Publ.Int. Assoc. Sedimentol. 77^90. Blackwell, Oxford.
Crampton, S.L.&Allen, P.A. (1995) Recognition of forebulgeunconformities associated with early-stage Foreland Basindevelopment ^ example from the North Alpine Foreland Ba-sin.AAPGBull., 79, 1495^1514.
Dahlen,F.A.&Suppe, J. (1988)Mechanics, growth and erosionofMountain Belts. In: Processes in Continental Lithospheric Defor-mation (Ed. by S.P. Clark, B.C. Burch¢el & J. Suppe),Geol. Soc.Amer. Spec. Pap 218, 161^178.
Dahlen, F.A., Suppe, J. &Davis,D. (1984) Mechanics of Fold-and-Thrust Belts and Accretionary Wedges ^ cohesive cou-lomb theory. J. Geophys. Res., 89, 87^101.
r 2008 The Authors. Journal compilation r 2008 The Authors,Basin Research, 10.1111/j.1365-2117.2008.00366.x16
M. Naylor andH. D. Sinclair

Davis,D., Suppe, J. &Dahlen, F.A. (1983) Mechanics of Fold-and-Thrust Belts and Accretionary Wedges. J. Geophys. Res.,88, 1153^1172.
DeCelles, P.G. & Giles, K.A. (1996) Foreland Basin systems.Basin Res., 8, 105^123, doi: 10.1046/j.1365-2117.1996.01491.x.
Desegaulx, P. & Brunet, M.F. (1990) Tectonic subsidence ofthe Aquitaine Basin since cretaceous times. Bull. Soc. Geol.France, 6, 295^306.
Desegaulx, P., Kooi, H. & Cloetingh, S. (1991) Conse-quences of Foreland Basin development on thinned continen-tal lithosphere ^ application to the Aquitaine Basin (SWFrance). Earth Planet. Sci. Lett., 106, 116^132.
Dickinson,W.R. (1974) Plate tectonics and sedimentation. In:Tectonics and Sedimentation (Ed. by W.R. Dickinson), Spec. Publ.22,1^27.Society ofEconomicPaleontologists andMineralogists,Los Angeles.
Flemings, P.B. & Jordan,T.E. (1989) A synthetic stratigraphicmodel of Foreland Basin development. J. Geophys. Res.-SolidEarth Planets, 94, 3851^3866.
Ford, M. (2004) Depositional wedge tops: interaction betweenlow basal friction external Orogenic wedges and £exural fore-land basins. Basin Res., 16, 361^375, doi: 10.1111/j.1365-2117.2004.00236.x.
Garfunkel, Z. & Greiling, R.O. (2002) The implications ofForeland Basins for the causative tectonic loads. EGUStephanMueller Spec. Publ. Ser., 1, 3^16.
Haddad, D. & Watts, A.B. (1999) Subsidence history, gravityanomalies, and £exure of the Northeast Australian Margin inPapua NewGuinea.Tectonics, 18, 827^842.
Homewood, P., Allen, P.A. & Williams, G.D. (1986) Dy-namics of the Molasse Basin of Western Switzerland. In: Fore-land Basins (Ed. by P.A. Allen & P. Homewood). 8, 199^219.International Association of Sedimentologists, BlackwellScienti¢c Publications, Oxford.
Johnson, D.D. & Beaumont, C. (1995) Preliminary resultsfrom a planform kinematic model ofOrogen evolution, surfaceprocesses and the development of Clastic Foreland BasinStratigraphy. In: Stratigraphic Evolution of Foreland Basins(Ed. by S.L. Dorobek & G.M. Ross), Spec. Publ. 52, 3^24.Society of Economic Paleontologists and Mineralogists,Los Angeles.
Jordan, T.A. (1995) Retro-arc foreland and related basins. In:Tectonics of Sedimentary Basins (Ed. by C.J. Busby & R.V. Inger-soll), 331^363. Blackwell Science, Oxford.
Jordan,T.E. (1981) Thrust loads and Foreland Basin evolution,Cretaceous,WesternUnited-States.AAPGBull.,65, 2506^2520.
Kamp,P.J.J.,Green,P.F.&Tippett, J.M. (1992)Tectonic archi-tecture of the Mountain Front-Foreland Basin transition,South Island, New Zealand, assessed by ¢ssion track analysis.Tectonics, 11, 98^113.
Kamp, P.J.J. & Tippett, J.M. (1993) Dynamics of Paci¢c PlateCrust in the South Island (New-Zealand) zone of oblique con-tinent-continent convergence. J. Geophys. Res.-Solid Earth, 98,16105^16118.
Karner,G.D.&Watts,A.B. (1983)Gravity-anomalies and £ex-ure of the lithosphere at mountain ranges. J. Geophys. Res., 88,449^477.
Koop, W.J. & Stoneley, R. (1982) Subsidence history of theMiddle-East Zagros Basin, Permian to recent. Philos.Trans. R.Soc. Lond. Ser. A-Math. Phys. Eng. Sci., 305, 149^168.
Lihou, J.C. & Allen, P.A. (1996) Importance of inherited riftmargin structures in the Early North Alpine Foreland Basin,Switzerland.Basin Res., 8, 425^442.
Lin,A.T.,Watts,A.B.&Hesselbo, S.P. (2003) Cenozoic strati-graphy and subsidence history of the South China SeaMarginin theTaiwan region.BasinRes.,15, 453^478, doi: 10.1046/j.1365-2117.2003.00215.x.
Miall, A.D. (1995) Collision-Relate Foreland Basins. BlackwellScience, Oxford.
Molnar, P., Anderson, H.J., Audoine, E., Eberhart-Phil-lips, D., Gledhill, K.R., Klosko, E.R., McEvilly, T.V.,Okaya,D., Savage,M.K., Stern,T.&Wu,F.T. (1999) Conti-nous deformation versus faulting through the continentallithosphere of New Zealand. Science, 286, 516^519.
Mun� oz, J.A. (1992) Evolution of a continental collision belt:ECORS-Pyrenees crustal balanced cross-section. In: ThrustTectonics (Ed. by K. McClay). 17, 235^246. Chapman & Hall,London.
Najman,Y., Pringle,M.,Godin, L. &Oliver,G. (2001) Dat-ing of the oldest continental sediments from the HimalayanForeland Basin.Nature, 410, 194^197, doi: 10.1038/35065577..
Naylor,M. & Sinclair, H.D. (2007) Punctuated thrust defor-mation in the context of doubly Vergent Thrust Wedges: im-plications for the localization of uplift and exhumation.Geology, 35, 559^562, doi: 10.1130/G23448A.1.
Naylor,M.,Sinclair,H.D.,Willett,S.D.&Cowie,P.A. (2005)A discrete element model for Orogenesis and AccretionaryWedge growth. J.Geophys. Res., 110, doi: 10.1029/2003JB002940.
Pearce, J.A. & Peate, D.W. (1995) Tectonic implications of thecomposition of volcanic arc magmas. Ann. Rev. Earth Planet.Sci., 23, 251^285, doi: 10.1146/annurev.ea.23.050195.001343.
Platt, J.P. (1988) The mechanics of frontal imbrication ^ a 1st-order analysis.Geol. Rundschau, 77, 577^589.
Pous, J.,Munoz, J.A.,Ledo, J.J.&Liesa,M. (1995) Partial melt-ing of subducted continental lower crust in the Pyrenees.J. Geol. Soc., 152, 217^220.
Quinlan,G.M.&Beaumont,C. (1984)Appalachian thrusting,lithospheric £exure, and the paleozoic stratigraphy of the east-ern interior of North-America.Can. J. Earth Sci., 21, 973^996.
Royden, L.H. (1993) Evolution of retreating subduction bound-aries formed during continental collision.Tectonics, 12, 629^638.
Simpson, G.H.D. (2006) Modelling interactions between Fold-Thrust Belt deformation, Foreland £exure and surface masstransport. Basin Res., 18, 125^143, doi: 10.1111/j.1365-2117.2006.00287.x.
Sinclair, H.D. (1997) Tectonostratigraphic model for under-¢lled peripheral Foreland Basins: an Alpine perspective.Geol.Soc. Am. Bull., 109, 324^346.
Sinclair,H.D. & Allen, P.A. (1992) Vertical versus horizontalmotions in theAlpineOrogenicWedge: stratigraphic responsein the Foreland Basin.Basin Res., 4, 215^232.
Sinclair, H.D., Coakley, B.J., Allen, P.A. & Watts, A.B.(1991) Simulation of ForelandBasin stratigraphy using a di¡u-sion-model of Mountain Belt uplift and erosion ^ an examplefrom the Central Alps, Switzerland.Tectonics, 10, 599^620.
Sinclair,H.D.,Gibson,M.,Naylor,M.&Morris,R.G. (2005)Asymmetric growth of the Pyrenees revealed through measure-ment andmodeling ofOrogenic £uxes.Am.J.Sci., 305, 369^406.
Sircombe, K.N. & Kamp, P.J.J. (1998) The South WestlandBasin: seismic stratigraphy, basin geometry and evolution of aForeland Basinwithin the Southern Alps Collision Zone, NewZealand.Tectonophysics, 300, 359^387.
Stockmal, G.S., Beaumont, C. & Boutilier, R. (1986) Geo-dynamic models of convergent margin tectonics ^ transitionfrom rifted margin to Overthrust Belt and consequences forForeland-Basin development.AAPGBull., 70, 181^190.
r 2008 The Authors. Journal compilation r 2008 The Authors,Basin Research, 10.1111/j.1365-2117.2008.00366.x 17
Pro- vs. retro-foreland basins

Tankard, A.J. (1986) On the depositional response to thrustingand lithospheric £exure: examples from the Appalachian andRocky Mountain Basins. In: Foreland Basins (Ed. by P.A. Allen& P. Homewood). 8, 369^392. International Association of Se-dimentologists, Blackwell Scienti¢c Publications, Oxford.
Turcotte,D.L.&Schubert,G. (2001) Section 3^17. In:Geody-namics Ed. by127. Cambridge, Cambridge University Press.
Van derVoo, R., Spakman,W. & Bijwaard,H. (1999) Tethyansubducted slabs under India. Earth Planet. Sci. Lett., 171, 7^20.
Verge¤ s, J. (1999) Estudi Geologic Del Vessant Sud Del PirineuOriental I Central. In: Evolucio Cinematica En 3d (Ed. by Col-Leccio MonografiesTecniques, 7, 194. Institut Cartogra¢cde Catalunya, Barcelona.
Verge¤ s, J., Marzo, M., Santaeula' ria, T., Serra-Kiel, J.,Burbank, D.W., Mun� oz, J.A. & Gime¤ nez-Montsant, J.(1998) Quanti¢ed vertical motions and tectonic evolution ofthe SE Pyrenean Foreland Basin. In: Cenozoic Foreland Basinsof Western Europe (Ed. by A. Mascle, C. Puigdefa' bregas, H.P.Luterbacher &M. Ferna' ndez), Spec. Publ. 134, 107^134. Geolo-gical Society of London.
Wheeler,H.E. (1964) Baselevel, lithosphere surface, and time-stratigraphy.Geol. Soc. Am. Bull., 75, 599^610.
Whipple, K.X. & Meade, B.J. (2006) Orogen response tochanges in climatic and tectonic forcing.Earth Planet. Sci. Lett.,243, 218^228, doi: 10.1016/j.epsl.2005.12.022.
Willett, S.D. (1992) Kinematics and dynamic growth andchange of a Coulomb Wedge. In: Thrust Tectonics (Ed. byK.McClay), pp.19^31. Chapman &Hall, London.
Willett, S.D., Beaumont,C.& Fullsack, P. (1993)Mechani-cal model for the tectonics of doubly Vergent CompressionalOrogens.Geology, 21, 371^374.
Willett, S.D. & Brandon, M.T. (2002) On steady states inMountain Belts. Geology, 30, 175^178, doi: 10.1130/0091-7613(2002)030h0175:OSSIMBi2.0.CO;2.
Willett,S.D.,Fisher,D.,Fuller,C.,En-Chao,Y.&Lu,C.Y.(2003) Erosion rates and orogenic-wedge kinematics inTaiwaninferred from ¢ssion-track thermochronometry. Geology, 31,945^948, doi: 10.1130/G19702.1.
Manuscript received 24 September 2007; Manuscript accepted 7May 2008.
APPENDIX A
The basis for this analysis is illustrated in Fig. 2c.This ¢rstorder analysis assumes that the gap between the slabs isminimised when the topography is shifted such that halfof the total topographic area is supported by each slab.
Given the total topographic area, we can calculate halfof that value:
Atopo ¼H2
2 tan aproþ H2
2 tan aretro
Ahalf ¼ Atopo=2 ¼H2
41
tan aproþ 1tan aretro
� �
Because the pro-wedge has a larger area than the retro-wedge, we equate half of the total area to a triangle withbase length l and slope angle apro:
Ahalf ¼l2 tan apro
2
) l ¼ffiffiffiffiffiffiffiffiffiffiffiffiffiffi2Ahalf
tan apro
s¼ H
ffiffiffiffiffiffiffiffiffiffiffiffiffiffiffiffiffiffiffiffiffiffiffiffiffiffiffiffiffiffiffiffiffiffiffiffiffiffiffiffiffiffiffiffiffiffiffiffiffiffiffiffiffiffiffiffiffiffiffiffi1
2 tan apro
1tan apro
þ 1tan aretro
� �s
The total width of the pro-wedge is L5H/tanapro,which is greater than l. Therefore the approximate hori-zontal separation dx between the ridge crest and the con-tact between the slabs, to minimise the gap between theslabs, is given by:
dx ¼ L� l ¼ Htan apro
� l
¼ H1
tan apro�
ffiffiffiffiffiffiffiffiffiffiffiffiffiffiffiffiffiffiffiffiffiffiffiffiffiffiffiffiffiffiffiffiffiffiffiffiffiffiffiffiffiffiffiffiffiffiffiffiffiffiffiffiffiffiffiffiffiffiffiffi1
2 tan apro
1tan apro
þ 1tan aretro
� �s !
APPENDIX B: FRAMES OF REFERENCE
The position of the pro-deformation front and pro-fore-land basin margin in a chronostratigraphic diagram (blacklines in Fig. 10) are di¡erent from those in the absoluteframe of reference (red lines in Fig. 10). In fact, the posi-tions of the pro-side chronostratigraphic fronts,Xpro
Chronostratare in a di¡erent frame of reference to the ret-ro-side chronostratigraphic fronts,X retro
Chronostrat.This is be-cause the pro-side chronostratigraphic fronts are
−500 −400 −300 −200 −100 0 100 200Position of chronostrat fronts (km)
Mod
el ti
me
(Myr
)
0
10
20
30
40
50
60
70
+vt
X chronostratpro
X chronostratretroXabsolute
pro
Fig.10. Demonstration of how the evolution of the basin marginsas measured relative to a point on the stable craton can betransformed into a stationary frame of reference, relative to thecentre of the mountain belt.The black lines show the position ofthe pro- and retro-deformation fronts and basin margins relativeto their respective stable cratons, as measured by the stratigraphicrecord.The red lines show the position of the pro-side deformationfront and basin margin relative to the core of the mountain belt.The conversion between the two requires knowledge of the totalamount of shortening that has occurred between the pro-sidecraton and the mountain belt. See online version for colour ¢gure.
r 2008 The Authors. Journal compilation r 2008 The Authors,Basin Research, 10.1111/j.1365-2117.2008.00366.x18
M. Naylor andH. D. Sinclair

measured with respect to a stable point on the pro-sidecraton while the retro-side chronostratigraphic fronts aremeasuredwith respect to a stable point on the retro-side cra-ton.Because the pro-side craton ismoving towards the retro-side craton at the regional convergence rate, the pro- and ret-ro-chronostratigraphic diagramsmust be in a di¡erent frameof reference.This is not the case in the absolute frame of re-ference,Xpro
AbsoluteandXretroAbsolute.Thus the mapping between the
absolute frame and the chronostratigraphic frame is:
XproChronostratðtÞ ¼ Xpro
AbsoluteðtÞ þ vt
X retroChronostratðtÞ ¼ X retro
AbsoluteðtÞðB1Þ
Assuming that the rate at which the position of the de-formation front, XDF and basin margin pinchout point,XM migrate are small with respect to the regional conver-gence rate, the stratigraphic duration of the pro-forelandbasin record and the depositional age of the sediments atthe bottom of awell at its deformation front are coincidentand given by the distance between its basin margins di-vided by the convergence rate:
tpro�basin �XM �XDF
vðB2Þ
The age of the deepest sediments youngs towards thecratonic basin margin, re£ected in the onlapping stratigra-phy. In contrast, the duration of the record held in the ret-ro-foreland basin is given by the duration of the growthphase which can be calculated by determining how long ittook to grow the entire system to steady-state:
tretro�basin �Asystem
vh0ðB3Þ
The age of the deepest sediments is given by the totalduration because growth of the system started.These old-est sediments are spread across the entire retro-forelandbasin, except in the small region of onlap associated withthe migration of the pinchout point.
Parameter List
Flexural parameters
E5 70GPa Young’s modulusu5 0.25 Poisson’s ratioTe5 20 km Elastic thickness
D ¼ ET3e =12ð1� u2Þ ¼ 5� 1022 Nm
Flexural rigidity
g5 9.8m s� 2 Acceleration due togravity
rmantle5 3300 kgm� 3 Mantle densityrcrust5 2700 kgm� 3 Crustal density
Dr5 rmantle� rcrust5 600 kg m� 3 Density contrast
a ¼ 4Dgðrmantle � rfilliÞ
� �1=4
¼ 76 km Flexural parameter
M05 0 Applied end bend-ing moment
w(x, t) De£ection of slabq(x) Distributed load
Tectonic boundary conditionsv5 5.0mmyr�1 Regional convergence rateh055.0 km Accreted layer thickness(Implicit assumption that the retro-side layerthickness is the same.)
Wedge and basin geometryapro51.51 The angle which the
pro-wedges make wrtto the horizontal
aretro5 2.51 The angle which theretro-wedges makewrt to the horizontal
rtopo5 r¢ll5 rcrust5 2700 kg m� 3Assume that the den-sity of the upper crustalmaterial is invariant.
Hmax5 3 km Height of drainagedivide at end of thegrowth phase
Atopo ¼H2
2 tan aproþ H2
2 tan aretro
Area under topo-graphic wedge
A¢ll Area above slabs andbeneath zero de£ec-tion datum, comprisesforeland basins androot of mountain belt
Asystem5Atopo1A¢ll Total cross-sectionalarea of the simulatedmountain belt
Aaccreted The total amount ofmaterial accreted fromthe underthrust plate
XM Position of basinmarginXDF Position of deforma-
tion fronttpro-basin Duration of pro-fore-
land basin recordtretro-basin Duration of retro-
foreland basin record
r 2008 The Authors. Journal compilation r 2008 The Authors,Basin Research, 10.1111/j.1365-2117.2008.00366.x 19
Pro- vs. retro-foreland basins