Pro Football Hall of Fame Youth/Education Football Hall of Fame 2014-2015 Educational Outreach...
48
Pro Football Hall of Fame Youth/Education Mathematics Activity Guide 2014-2015
Transcript of Pro Football Hall of Fame Youth/Education Football Hall of Fame 2014-2015 Educational Outreach...

Pro Football Hall of Fame
Youth/Education
Mathematics
Activity Guide 2014-2015

Pro Football Hall of Fame
2014-2015 Educational Outreach Program
Mathematics Table of Contents
Lesson Common Core Standards Page(s)
Attendance is Booming MD MA 1
Be an NFL Statistician MD MA 4
Buying and Selling at the Concession Stand NOBT MA 5
Driving the Field With Data MD MA 6
Finding Your Team’s Bearings GEO MA 7
Hall of Fame Shapes GEO MA 8
Jersey Number Math NOBT MA 9-10
Math Football NOBT MA 11
How Far is 300 Yards? MD MA 12-13
Number Patterns NOBT, MD MA 14-15
Punt, Pass and Snap NOBT, MD MA 16
Running to the Hall of Fame NOBT, MD MA 17
Same Data Different Graph MD MA 18-19
Stadium Design GEO MA 20
Surveying The Field MD MA 21
Using Variables with NFL Scorers OAT MA 22-24
What’s In a Number? OAT MA 25-26
Tackling Football Math OAT, NOBT, MC MA 27-36
Stats with Andre Reed RID MA 37-38
NFL Wide Receiver Math RID MA 39-40
NFL Scoring System OAT MA 41-42
Miscellaneous Math Activities MA 43
Answer Keys MA 44-46

Mathematics
ProFootballHOF.com Pro Football Hall of Fame Youth/EducationMA1
Goals/Objectives: Students will:
• Learn to use front end estimation and rounding.• Learn how to make a line graph.
Common Core Standards: Measurement and Data
Methods/Procedures:• The teacher can begin a discussion asking the students if they have ever been to an NFL
game or if they know anyone who has gone to one.• As a class the teacher will use the board or overhead projector to show samples of how
to round. Depending on the students’ abilities, the students can round to the nearest thousand, hundred, tenth, hundredth, etc.
• Once the teacher feels secure that the students can round numbers, the teacher will in-troduce front-end estimation. Remind the students that when doing front-end estimation they should take the fi rst number and turn everything else into a 0. Examples: 17,000 = 10,000; 22,000 = 20,000; 45.16 = 40
• Depending upon ability, students will do the worksheet independently, with a partner, or as a whole class. It can also be revised for older students to estimate the number of tick-ets sold, for example, in 1990 and 1989. It can also be adjusted to do subtraction prob-lems, such as to compute how many more tickets were sold in one year than in another. Once they have their answers they need to decide whether or not it makes sense.
• Students can also fi nd the landmarks of the data: median, mode, maximum, range, and median.
• Once done the students will take this information and turn it into a line graph. If students are unfamiliar with line graphs, it can be done as a class on the overhead. If you choose, you can assign different groups a type of graph to complete and the students can judge which one best shows the data. Some examples could be a bar graph or scatter plot.
Materials:• Estimation worksheet• Line graph worksheet• Overhead or chalkboard• Pencils
Assessment:• Student participation• Worksheets
Attendance Is Booming

MA2
Mathematics
ProFootballHOF.comPro Football Hall of Fame Youth/Education
How Many People Attended NFL
Games?
Directions: Use the following numbers that tell the average number of people who purchased tickets to NFL games during the regular season. Round the number and then use front-end esti-mation.
Year Average Attendance Rounding Front End Estimation
2012 65,074
2011 64,698
2010 64,978
2009 65,043
2008 66,625
2007 66,836
2006 66,666
2005 66,455
2004 66,409
2003 66,328
2002 66,755
2001 65,187
2000 66,078
1999 65,349
1998 64,020

Mathematics
ProFootballHOF.com Pro Football Hall of Fame Youth/EducationMA3
How Many People Attended NFL
Games?
Directions: Use the rounded numbers to make a line graph.
Graph Title: _______________________________
Amount Who
Attended
Year

MA4
Mathematics
ProFootballHOF.comPro Football Hall of Fame Youth/Education
Be an nfl statistician
Goals/Objectives: Students will:
• Create a graph of information obtained from a data set.• Analyze data recorded on a graph.• Calculate the mean, median, and mode of Super Bowl MVP’s by starting position.
Common Core Standards: Measurement and Data
Methods/Procedures:• Using Superbowl.com, have students record the starting position of each MVP from all
Super Bowl games. Students should record this information in a graph (bar, pie, line). Have students analyze the data as follows:* Find the position that is the mode of the data set.* Find the median of the data set.* Find the mean of the data set.* Find the mean of each position relative to the number of Superbowls.
Materials:• Super Bowl MVP’s information• Paper• Pen or pencil• Calculator (optional)• Colored pencil (optional)
Assessment:• Students will be assessed on accuracy of responses.

Mathematics
ProFootballHOF.com Pro Football Hall of Fame Youth/EducationMA5
Goals/Objectives: Students will:
• Develop their money skills• Practice addition, subtraction, and multiplication• Make change for purchases at a football concession stand• Write monetary units using the dollar sign and the decimal point
Common Core Standards: Number Operations in Base Ten
Methods/Procedures:• As a whole class or small group activity, have students create a menu board for a conces-
sion stand. The menu should include foods typically served at a football game such as hot dogs, popcorn, soda, Cracker Jacks, etc., and should include competitive pricing.
• Students should work in pairs so each student has a turn as the buyer and the seller. Make sure each pair of students has a copy of the menu board for the concession stand with the items for sale and prices on it. Pass out envelopes with varying amounts of play money in them. Give each student one envelope.
• Have each student complete a tally ticket, which asks questions about the possibilities af-forded them with their available money. Questions posed on the tally ticket could include the following:1. How much money do you have to spend at the game?2. If your family of four wants to buy hot dogs and drinks, how much will it cost for all of
you? How much change will you receive?3. Do you have enough money to buy one of each item on the menu board? How much
will it cost? How much change will you receive? *Partners should check one another’s tally ticket responses for accuracy.
• Have students role play the purchasing of food at the concession stand. The buyer should order items from the menu board. The seller should create a receipt for the buyer. Then, the buyer should pay the bill and the seller makes change if necessary. Each part-ner should check the monetary transactions performed for accuracy.
Materials:• Envelopes• Play money (assortment of bills and coins)• Materials for constructing a menu board• Tally Ticket
Assessment:• Student participation• Accuracy of answers on Tally Ticket• Accuracy of monetary transactions• Teacher observations of money skills, addition, subtraction and multiplication
Buying and Selling at the
Concession Stand

MA6
Mathematics
ProFootballHOF.comPro Football Hall of Fame Youth/Education
Driving the Field With Data
Goals/Objectives: Students will:
• Practice with units of measurements: yards, feet, inches.• Keep statistics for an individual player of their choice.
Common Core Standards: Measurement and Data
Methods/Procedures:• Students will use a replica of a football fi eld (drawn to scale, unless a trip to the high
school stadium can be arranged) and practice measuring.• Students will practice measuring ‘downs.’• Students will use the statistics of a player to see how the yardage is compiled.
Materials:• Rulers• Measuring tape• Pencils
Assessment:• Students will be able to explain what a football fi eld looks like and draw a replica of a
fi eld (yard markers, etc.)

Mathematics
ProFootballHOF.com Pro Football Hall of Fame Youth/EducationMA7
Finding YOur team’s bearings
Goals/Objectives: Students will:
• Understand the concept of bearings.• Comprehend the two types of information given on a compass:
1. Direction – North, East, South, West2. Bearings – degree measurements (North = 0 or 360 degrees, East = 90 degrees,
South = 180 degrees, and West = 270 degrees)
Common Core Standards: Geometry
Methods/Procedures:• Students need a protractor and a United States map showing major cities (All NFLCities
should be shown)• The teacher would give a lecture on the concept of bearings:• The directions on a compass – North, South, East and West also can be described by de-
gree measurements• North = 0 degrees and 360 degrees; East = 90 degrees; South = 180 degrees; West =
270 degrees• The teacher shows the students how to use the protractor to fi nd bearings.• Each student is assigned an NFL Team in which the students need to fi nd the bearings
their team will take to each game. For example: Cleveland Browns
A. Play at home against the Pittsburgh Steelers their second game – skipB. In their third game the Browns must travel to Baltimore – what is the bearing they must travel?C. In their fourth game the Browns must travel to Cincinnati – so for purposes of this exercise what is the bearing the team must travel from Baltimore to Cincinnati?D. In their fi fth game, the Browns must travel back home to play the New York Giants – so for purposes of this exercise what is the bearing the team must travel from Cincinnati to Cleveland?E. Etc.
Materials:• Access to the Internet• Access to NFL team websites at www.nfl .com (links to team sites are at the top of the page)• Map of the U.S.• Protractor, paper and writing tool
Assessment:• Students will keep track of the bearings for their team and be graded on this assignment.
Adaptation for primary grades:• Have students locate two cities on a large map. For example, Baltimore to Cleveland and then
instead of using bearings have the students estimate the approximate direction between the cardinal compass points.

MA8
Mathematics
ProFootballHOF.comPro Football Hall of Fame Youth/Education
Hall of Fame Shapes
Goals/Objectives: Students will:
• Locate and name planes and solid shapes: circle, square, triangle, diamond, oval, sphere, pyramid, cone, cylinder, cube
• Find planes and solid shapes in the environment• Sort objects by shape• Graph everyday objects• Write or dictate a sentence related to each shape that was located
Common Core Standards: Geometry
Methods/Procedures:• Students will review plane and solid shape names and the characteristics of each.• Students will locate real objects to match these shapes in their classroom, school build-
ing or home and match them to class models of these shapes. Pictures of familiar objects will be sorted, classifi ed and graphed by shape name.
• Teacher prepares name tags for groups, each depicting one plane and one solid shape.• Students will tour the Pro Football Hall of Fame to get an overview. During a shape scav-
enger hunt through the building, groups of students (those wearing the same shape name tags) will fi nd real objects that are the same as the plane and solid shape depicted on their tag.
• The chaperone accompanying each group of students will allow a group member to take a photo of each shape that was found on the shape scavenger hunt and will record the name of the object.
• Photos will be developed or printed. Chaperone will give teacher a list of what their group photographed. Each group of students will write or dictate a sentence about the shape, such as, “The ring is a circle.”
• If a fi eld trip to the Hall of Fame cannot be made, students should use the Hall of Fame’s website at Profootballhof.com to view its exhibits
Materials:• Models of shapes• Name tags depicting one plane and one solid shape• Disposable or digital camera for each group of 3-4 students• Paper/pencil for chaperone to record shape names
Assessment:• Teacher observation during the trip• The photo product from the shape scavenger hunt• The sentences written or dictated by the students

Mathematics
ProFootballHOF.com Pro Football Hall of Fame Youth/EducationMA9
Jersey number math
Goals/Objectives: Students will:
• Research Hall of Famers’ jersey numbers. Use the link• http://www.profootballhof.com/hof/jerseys-number.aspx• Solve basic addition and subtraction facts
Common Core Standards: Number Operations in Base Ten
Methods/Procedures:• Students will research Pro Football Hall of Famers’ jersey numbers.• Students will complete the Hall of Famer Jersey Math Worksheet• Students can fi nd a Hall of Famer’s jersey number for the answer.• This can be adapted to multiplication and division as well.
Materials:• Computer• Access to the Internet • Access to http://www.profootballhof.com/hof/jerseys-number.aspx• Hall of Famer Jersey Math Worksheet• Pen or Pencil
Assessment:• Accuracy of answers on Hall of Famer Jersy Math Worksheet.

MA10
Mathematics
ProFootballHOF.comPro Football Hall of Fame Youth/Education
Hall of Famer Jersey Math
Directions: Look up the Hall of Famers number. Use the Hall of Famers number to complete each equation.
Len Dawson Dave Casper Lou Groza
+ Troy Aikman + Bart Starr + Andre Tippett
Warren Sapp Dan Dierdorf Larry Csonka
+ Warren Moon + Mike Haynes + John Elway
George Blanda Terry Bradshaw Mike Ditka
- Guy Chamberlin - Wilber Henry - Charlie Sanders
Ozzie Newsome Jerry Rice Marshall Faulk
- Joe Montana - Jack Ham - Joe Namath
John Randle Bronko Nagurski Jack Youngblood
- Lou Creekmur + Joe Perry + Don Maynard

Mathematics
ProFootballHOF.com Pro Football Hall of Fame Youth/EducationMA11
Math football
Goals/Objectives: Students will:
• Practice math facts for review.• Create a fun way to practice math facts.
Common Core Standards: Number Operations in Base Ten
Methods/Procedures:• The class will be divided into two equal groups (teams).• Students will need pencil and paper.• Students from each team will be given a number that matches one other student from
the opposing team.• The teacher will choose a captain and quarterback from each team. There will be a coin
toss at the beginning to see which team will kickoff or receive.• The team that kicks will choose a card from the kickoff cards, which represents different
lengths of kicks. The ball will be marked on the overhead.• The teams will compete by working on the problems given by the teacher.• Once the problem is given, the teacher will wait 5-10 seconds and pull a number chip.
The players from each team that represents the number drawn will get to answer the problem. The person who answers fi rst gets a fi rst down or a block for their respective team.
• If the offensive team gets blocked 3 times, they must go to the 4th down cards or try for a fi eld goal (if they are inside the opposing team’s 40 yard line). Passing cards are allowed after every third play, as long as the offensive team has at least one fi rst down.
• Play continues until time runs out.• The team with the most points wins. If tied, the team with the most fi rst downs wins. If fi rst
downs are tied, then the winner is determined by most blocks.• Chalkboard is used to record points, fi rst downs and blocks.
Materials:• Paper, pencil, chalk & chalkboard, White Board or SMART Board• Overhead projector & football fi eld overhead• Math sheets & number chips• Cards for kickoff, 4th down pile and passing
Assessment:• Teacher observation• Teacher visually checks problems worked on paper.

MA12
Mathematics
ProFootballHOF.comPro Football Hall of Fame Youth/Education
How Far is 300 yards?
Goals/Objectives: Students will:
• Convert measurements between yards, feet, and inches.• Measure objects to the nearest inch, foot, and yard.
Common Core Standards: Measurement and Data
Methods/Procedures:• Students will use a ruler to determine how many inches there are in a foot.• Students will measure three items to the nearest inch i.e., their pencil, book, crayon, desk,
etc. Share with the class and explain how they obtained their results.• Students will then measure some objects to the nearest foot i.e., the White Board/SMART
Board, door, height, etc. Then students will compute how many inches that would be. Students will share their conversions and procedures with the class so the teacher can assess understanding.
• Students will then use a yardstick to measure several objects i.e., a counter, a carpet, or a table. Then students will convert the number of yards to the amount of feet and inch-es. Students will share answers with the class so the teacher can assess understanding. These results can be made into a table on the chalkboard.
• Students will then complete the worksheet provided on the following page with the table to convert the number of yards gained during the football game to inches and feet.
• After the students complete the worksheet, they may go outside to the playground or football fi eld and see how far the measurements they converted are.
• Older students can then compare their answers and discuss why there are different results. Was everyone precise with their measuring? Which measurements are accurate? Discuss how most measurements contain some error in them.
Materials:• Ruler with inches• Yard stick• Materials in the classroom to measure• Worksheet (easy or harder version)• Pencils
Assessment:• Class participation• Worksheet
Mathematics
ProFootballHOF.com Pro Football Hall of Fame Youth/EducationMA13
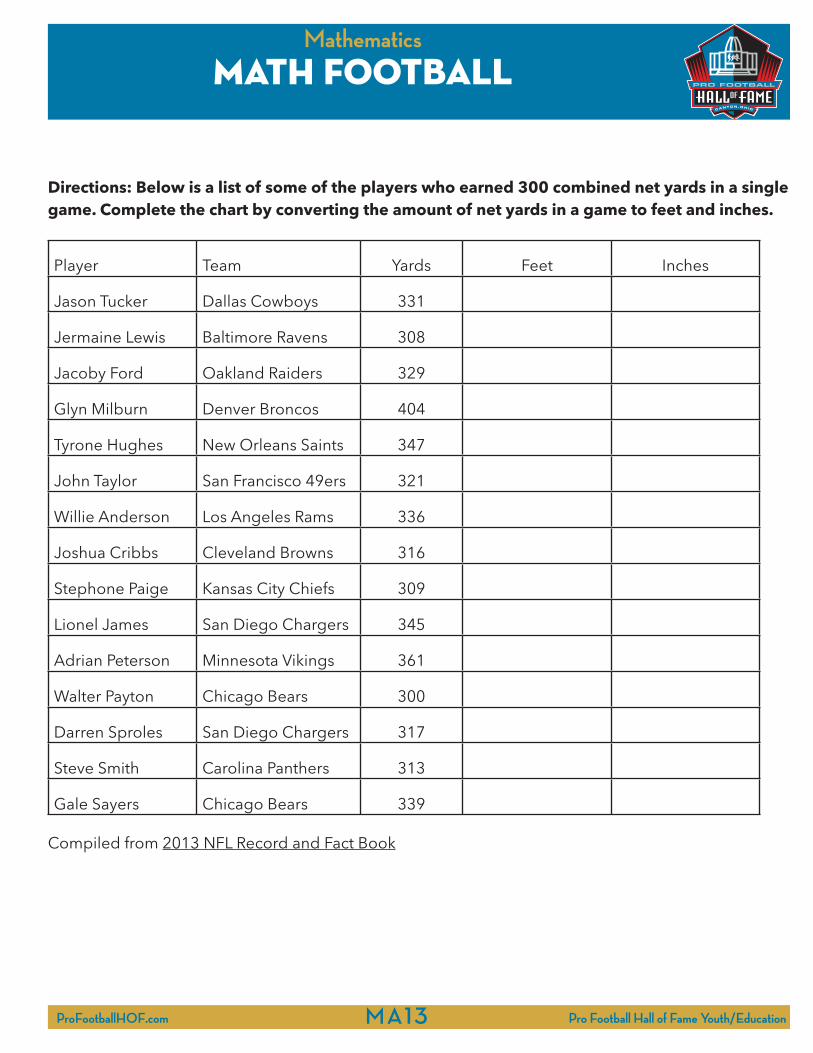
Directions: Below is a list of some of the players who earned 300 combined net yards in a single game. Complete the chart by converting the amount of net yards in a game to feet and inches.
Player Team Yards Feet Inches
Jason Tucker Dallas Cowboys 331
Jermaine Lewis Baltimore Ravens 308
Jacoby Ford Oakland Raiders 329
Glyn Milburn Denver Broncos 404
Tyrone Hughes New Orleans Saints 347
John Taylor San Francisco 49ers 321
Willie Anderson Los Angeles Rams 336
Joshua Cribbs Cleveland Browns 316
Stephone Paige Kansas City Chiefs 309
Lionel James San Diego Chargers 345
Adrian Peterson Minnesota Vikings 361
Walter Payton Chicago Bears 300
Darren Sproles San Diego Chargers 317
Steve Smith Carolina Panthers 313
Gale Sayers Chicago Bears 339 Compiled from 2013 NFL Record and Fact Book
Math football
MA14
Mathematics
ProFootballHOF.comPro Football Hall of Fame Youth/Education
Number patterns
Goals/Objectives: Students will:
• Students will determine number patterns from a given set of numbers
Common Core Standards: Number Operations in Base Ten; Measurement and Data
Methods/Procedures:• Students will be given a chart with the yardage gained from running backs in each
quarter of a game.• Students will look at the number in each quarter to determine the number pattern.• Students will then determine either how to continue the pattern or what number in the
pattern is missing.• Students will share the number operations they used to determine the pattern.
Materials:• Number Pattern Worksheet• Pencils
Assessment:• Completion of worksheet• Observation of process

Mathematics
ProFootballHOF.com Pro Football Hall of Fame Youth/EducationMA15
Number patterns
Directions: Fill-in the charts below by analyzing the numbers given to determine the numbers needed to complete each pattern. Running Back 1st Quarter 2nd Quarter 3rd Quarter 4th QuarterA 3 yards 6 yards 9 yardsB 15 yards 25 yards 30 yardsC 16 yards 20 yards 24 yardsD 28 yards 40 yards 64 yards
What is running back A’s number pattern?___________________________________
What is running back B’s number pattern?___________________________________
What is running back C’s number pattern?____________________________________
What is running back D’s number pattern?____________________________________
You may use the space below to show your work.
Running Back 1st Quarter 2nd Quarter 3rd Quarter 4th QuarterA 4.5 yards 8 yards 10.5 yardsB 12.2 yards 26.8 yards 34.1 yardsC 15.4 yards 17.1 yards 18.8 yardsD 28.6 yards 39 yards 59.8 yards
What is running back A’s number pattern?___________________________________
What is running back B’s number pattern?___________________________________
What is running back C’s number pattern?____________________________________
What is running back D’s number pattern?____________________________________
You may use the space below to show your work.

MA16
Mathematics
ProFootballHOF.comPro Football Hall of Fame Youth/Education
Punt, Pass and snap
Goals/Objectives: Students will:
• Learn the proper techniques of punting, passing and snapping a football. • Calculate the mean, median and mode of the class’s data for these three football skills.• Compare/contrast the three different sets of data.
Common Core Standards: Number Operations in Base Ten; Measurement and Data
Methods/Procedures:• Introduce and defi ne the three measures of central tendency: mean=average,
median=exact middle, mode=number occurring most often• Set up a chart for the class listing all students’ names, leaving blank sections to record the
distance each student throws, kicks and long-snaps the ball.• Teach students to execute all three skills, allow time for practice.• Have students take turns throwing the football as far as they can, recording the distance
each student throws in yards. Repeat this procedure with the kick and long snap.• Have students arrange the data on a visual chart, graph or number line in ascending
order, displaying individual statistics.• Instruct students to calculate the mean, median and mode for each of the 3 sets of data.• Guide students through a comparison of each set of data and discuss why they differ.
Materials:• Footballs • Paper • Pen/pencil • Clipboards• Chart paper • Whistle • Field marked off in yards
Assessment:• Participation in activity (observation)• Completion of mean, median and mode calculations• Quiz on defi ning each measure of central tendency and calculating each using a set of
data.

Mathematics
ProFootballHOF.com Pro Football Hall of Fame Youth/EducationMA17
running to the Hall of fame
Goals/Objectives: Students will:
• Create a scatter plot with information on attempts and yards gained.• Create a best fi t line which would show the slope of the line as the average yards per
carry.
Common Core Standards: Number Operations in Base Ten; Measurement and Data
Methods/Procedures:• Find information on attempts and yards gained for Hall of Fame running backs like Jim
Brown, Jim Taylor and Walter Payton.• Create a scatter plot using the x-axis for number of attempts and the y-axis for yards
gained.• Plot the (x,y) points of at least seven Hall of Fame running backs.• Create a best fi t line (straight line that represents these x,y data points).• Find a good slope Y2-Y1 of this best fi t line.
X2-X1• This should be the approximate yards per carry of these great running backs.
Materials:• Computers (Hall of Famer information on ProFootballHOF.com)• Graph paper• Rulers• Colored pencils• Calculators.• Sports books for reference like 2014 NFL Record and Fact Book.
Assessment:• Students will be able to show a best fi t line on a scatter plot graph. The average yards per
carry should be reasonable (slope of line calculated).

MA18
Mathematics
ProFootballHOF.comPro Football Hall of Fame Youth/Education
Same Data Different Graph
Goals/Objectives: Students will:
• Take data provided by the teacher and as a class, group or individual, compare differing representations of it to determine which representation best imparts the intended mes-sage or meaning.
Common Core Standards: Measurement and Data
Methods/Procedures:• This lesson can be undertaken prior to or after visiting the Pro Football Hall of Fame
or the Hall of Fame website at Profootballhof.com. Students will have held at least one discussion on professional football and various aspects of the sport to make certain all students are somewhat familiar with the game.
• The teacher will then provide the students with data from this activity guide or from the website (Profootballhof.com.) A good source in this activity guide is the page listing the current Super Bowl Champs, the Seattle Seahawks (page MA 35). This page has a column that lists which college each player attended. Students can use this data in their data representations (bar, pie etc.).
• At this point the instructor should decide whether to do this data representation as a class, group or individual. Doing one graphic representation (i.e. bar graph) of colleges attended by the winning Super Bowl team as a class is a great starting point for discussion and reference point.
• Students can be assigned to do another graph (i.e. pie) by fi lling in the proper ‘slice’ with college name as a transition to doing a representation without any assistance.
• If the teacher chooses individual or group work instead of class as a whole work, time should be set aside to present graphs and fi ndings to class.
• The class should come to a consensus or at the least discuss which graphic representation best imparts the information. The strong and weak points of each representation should be addressed.
Materials:• Access to the Internet• Access to HOF website at ProFootballHOF.com• Statistics to graph….i.e. Current Super Bowl Team Members’ Roster in Activity Book
Assessment:• Students will present to the class graphical representations and analysis of the data.• See examples on the following page.

Mathematics
ProFootballHOF.com Pro Football Hall of Fame Youth/EducationMA19
Same Data different graph
Example 1:
Ohio State Illinois Alabama Pitt
2 1 3 1
Example 2:
Super Bowl ICollege Team
Members Attended
Florida4
Oklahoma State3
Wake Forest1

MA20
Mathematics
ProFootballHOF.comPro Football Hall of Fame Youth/Education
Stadium Design
Goals/Objectives: Students will:
• Follow Directions and Create a New Football Stadium using knowledge of shapes and numbers.
Common Core Standards: Geometry
Methods/Procedures:• Students will work in pairs or small groups. (Building Teams)• Each team will review a list of requirements that the stadiums must have to be considered
complete.• Each team will plan and draw their stadium.• Each team will check to make sure they meet each requirement.
Materials:• Drawing paper for each pair or group• Pencils• Rulers• Checklists
Assessment:• Observation of team discussions• Completed stadium drawings

Mathematics
ProFootballHOF.com Pro Football Hall of Fame Youth/EducationMA21
Surveying The Field
Goals/Objectives: Students will:
• Design a survey, collect data and interpret data collected related to an ‘issue’ in professional football.
Common Core Standards: Measurement and Data
Methods/Procedures:• Prior to visiting to the Pro Football Hall of Fame or the Hall of Fame website
(Profootballhof.com), students will have held one (or more if necessary) discussion on professional football and the role it plays in the lives of individuals today.
• The teacher will guide the discussion to include ‘issues’ or concerns that students have thought of themselves or have read or seen in the media. An example might be the age that an individual should be before he can be drafted by an NFL team. Another could be the role that women play in the NFL. The possibilities are endless and students will have no problem compiling a signifi cant list of ‘issues.’
• At this point the instructor should decide whether this is an individual OR a group project.
• Once the make-up of the study’s members is decided, students need to write the survey question or issue in a coherent and statistically measurable format.
• After the instructor approves the format of the issue to be surveyed, students must collect data from an adequate audience population and a representative audience. Because this is part of the standard’s requirements and will be part of the instructor’s evaluation criteria, the audience and population of the audience is something the student(s) must determine.
• Once the survey has been completed, the student(s) must interpret the data with graphical displays. At this point, the instructor can determine in what form(s) and in what quantity of diverse graphic representations are necessary.
• The student(s) must include in their presentation variability as a factor, correlation and standard deviation.
• The presentation can be in the form of a class lecture by each student or group or in the form of a turn-in project. The use of the tri-fold science fair board is a great method of display for data and explanation of ‘issue.’
Materials:• Access to the Internet• Access to HOF website at ProFootballHOF.com• Optional science fair tri-folds
Assessment:• Students will present to the class or in report form to the instructor the results and
analysis of the data collected.
MA22
Mathematics
ProFootballHOF.comPro Football Hall of Fame Youth/Education
Using Variables with NFL Scorers
Goals/Objectives: Students will:
• Create number sentences with variables and then solve the variables using story prob-lems
Common Core Standards: Operations and Algebraic Thinking
Methods/Procedures:• The class will begin discussing how many points are usually scored in a football game.• The class will use the worksheets provided on the following pages to make number
sentences with variables and then solve the variables.
Materials:• Pencil• Worksheet
Assessment:• Classroom participation• Completion of worksheet

Mathematics
ProFootballHOF.com Pro Football Hall of Fame Youth/EducationMA23
Using Variables with NFL Scorers
Directions: For each problem write a number sentence to solve the problem and see how many points the top 10 NFL scorers made. Then fi nd out the variable by using another sheet of paper. Use the table to help you. The fi rst one has been done for you.
TYPE OF PLAY POINTSTouchdown 6Field Goal 3Extra Point 1
1. Gary Anderson has 2,434 points. He earned 820 extra points and no touchdowns. How many fi eld goals did he get? 538
Number sentence: (3 x F) + 820 = 2,434
2. Morten Andersen scored 2,544 points. He made 565 fi eld goals and no touchdowns. How many extra points did he score? ____________
Number sentence: ____________________________
3. George Blanda scored 2,002 points. He scored 9 touchdowns and 335 fi eld goals. How many extra points did he score? _______________
Number sentence: _____________________
4. Norm Johnson didn’t score any touchdowns in his 18 year career. He did score a total of 1,736 points. If he made 638 extra points, how many fi eld goals did he score? _________________
Number sentence: ________________________
5. Adam Vinatieri scored 1,867 points. He didn’t make any touchdowns, but he did score 413 fi eld goals. How many extra points did he score? ________
Number sentence: ________________________
6. Jason Hanson has played football for 21 years. He didn’t have any touchdowns but he did score 2,150 points. If he had 665 extra points, how many fi eld goals did he score? ____________
Number sentence: _________________________
7. John Kasay played football for 20 years. He did not score any touchdowns but he did score 461 fi eld goals and a total of 1,970 points. How many extra points did he get? __________________
Number sentence: _________________________

MA24
Mathematics
ProFootballHOF.comPro Football Hall of Fame Youth/Education
8. Jason Elam is the 7th top scorer in NFL history. He scored 1,983 points and didn’t score any touchdowns. If he made 675 extra points, how many fi eld goals did he score?___________________
Number sentence: _________________________
9. John Carney has played football for 23 years. During that time he scored 628 extra points and 478 fi eld goals. How many total points did he score? _______________
Number sentence: _________________________
10. Matt Stover has played in the NFL for 19 years. During that time he has scored 471 fi eld goals, 0 touchdowns, and a total of 2,004 points. Determine how many extra points he scored. ___________
Number sentence: _________________________
Compiled from 2013 NFL Record and Fact Book
Using Variables with NFL Scorers

Mathematics
ProFootballHOF.com Pro Football Hall of Fame Youth/EducationMA25
What’s In a Number?
Goals/Objectives: Students will:
• Find factors and multiples of players’ numbers• Identify numbers as prime and composite
Common Core Standards: Operations and Algebraic Thinking
Methods/Procedures:• The students should have familiarity with fi nding factors. The class should begin with a
review of how to fi nd factors of a number. For example, the factors of 50 would be: 1, 2, 5, 10, 25, 50. You may prefer for the students to list the factors like this: 1 * 50, 2 * 25, 5 * 10.
• Students will learn how to classify numbers whether they are prime or composite. A prime number has only two factors: 1 and itself. An example would be 5 because the only two numbers that multiply together to equal 5 would be 1 and 5. Composite numbers have 3 or more factors. For example 50 would be composite because it has 6 factors.
• Students will do some practice determining if a number is prime or composite. The teacher can hand each student a different number on an index card and the students can fi nd the factors and then place the card on the chalkboard either in the prime or composite category. Students can also count the letters in their fi rst or last name and determine if that number is prime or composite.
• The class should also talk about fi nding multiples of a number. So given the number 4, the multiples would be 4, 8, 12, 16, 20, etc.
• Once the class has practiced, they can work on the worksheet.
Materials:• Pencil• Worksheet• Index cards• Tape to place the index cards on the board
Assessment:• Class participation• Worksheet

MA26
Mathematics
ProFootballHOF.comPro Football Hall of Fame Youth/Education
what’s in a number
Directions: Use the number of each Hall of Famer to complete the worksheet.
Troy Aikman#8
The factors of 8 are:_______________________________Is the number 8 prime or composite?_______________________________Five multiples of 8 are:_______________________________
The factors of 53 are:_______________________________Is the number 53 prime or composite?_______________________________Five multiples of 53 are:_______________________________
The factors of 81 are:_______________________________Is the number 81 prime or composite?_______________________________Five multiples of 81 are:_______________________________
The factors of 63 are:_______________________________Is the number 63 prime or composite?_______________________________Five multiples of 63 are:_______________________________
The factors of 61 are:_______________________________Is the number 61 prime or composite?_______________________________Five multiples of 61 are:_______________________________
The factors of 75 are:_______________________________Is the number 75 prime or composite?_______________________________Five multiples of 75 are:_______________________________
The factors of 37 are:_______________________________Is the number 37 prime or composite?_______________________________Five multiples of 37 are:_______________________________
The factors of 60 are:_______________________________Is the number 60 prime or composite?_______________________________Five multiples of 60 are:_______________________________
Harry Carson#53
Dick Lane#81
Lee Roy Selmon#63
Doak Walker#37
Otto Graham#60
Bill George#61
David (Deacon)Jones#75
Mathematics
ProFootballHOF.com Pro Football Hall of Fame Youth/EducationMA27
Tackling Football Math
Goals/Objectives: Students will:
• Improve math skills by applying basic functions to the game of football.• Learn basic football facts and game terms.• Utilize statistics of NFL football players and teams for computing math problems.• Research statistics of selected NFL football players and teams for use as alternative
information in certain math problems.
Common Core Standards: Operations and Algebraic Thinking; Number Operations in Base Ten; Measurement and Data
Methods/Procedures:• Students will complete the math worksheets provided on the following pages related
to the game of football. They may work independently or with others. Feel free to make adaptations in players and teams to suit your students. Answers to the following worksheets are found in the back of this publication.* A Day at the Game (CCS: Number Operations in Base Ten)* How Old are They? (CCS: Number Operations in Base Ten)* Conversions in Football (CCS: Measurement and Data)* Super Bowl Numbers (CCS: Number Operations in Base Ten)* Top Active Rushers (CCS: Number Operations in Base Ten; Measurement and Data)* Super Bowl XLVII Thunder (CCS: Number Operations in Base Ten; Measurement and Data)* Miscellaneous Math Activities
Materials:• Pencil• Scrap paper for working problems• Calculators if permitted• Worksheets
Assessment:• Students will be assessed on accuracy of responses.

MA28
Mathematics
ProFootballHOF.comPro Football Hall of Fame Youth/Education
Directions: Complete the following problems, be sure to show all of your work on a seperate sheet of paper.
1. Tickets for the game are $62.00 each. A family of six attended the game on Sunday. What was the total cost of the tickets?
2. There are four quarters in a game, each lasting 15 minutes. What is the total number of minutes in a game? Convert the total minutes to seconds.
3. There are 53 members on one NFL team, but only 11 players are on the fi eld at one time. How many are still on the sideline?
4. The seating capacity for Cleveland Browns Stadium is 73,300. There were 66,528 in attendance for the game. How many empty seats were there?
5. Twenty-four game balls are used in every indoor NFL game. If one ball weighs 14 ounces, how many ounces do 24 balls weigh? Convert to pounds. Clue: 16 ounces = 1 lb.
6. Vendors were selling programs for $5.00 each throughout the stadium. If 20 vendors each sold 32 programs in one hour for fi ve hours, how many total programs did the vendors sell?
7. A family of three decided to buy some souvenirs while at the game. They purchased two pennants at $4.99 each, two hats at $24.99 each, one football at $19.99 and two programs at $5.00 a piece. How much did they spend?
8. Throughout the game they purchased snacks to eat. They bought 5 hot dogs at $3.00 each, 2 bags of peanuts and 2 bags of popcorn at $3.25 a piece, 4 soft drinks at 2.75 each and 2 ice cream cones at $3.25 each. What was the total?
9. The game kicked off at 1:05 p.m. and ended at 4:44 p.m.. How many hours and minutes did the game last?
10. If 90% of the seats in Ford Field, which holds 64,500, are fi lled for an NFL game, how many fans are there?
11. Your football team scored 18 points more than the previous high score of 56 points. What is their new high score?
12. On a series of downs, the football was spotted on your own 48-yard line. The quarterback passed for 15 yards, lost 9 yards when the quarterback was sacked, and then gained 17 yards on a halfback run. Where was the ball placed for the next down?
A Day at the game

Mathematics
ProFootballHOF.com Pro Football Hall of Fame Youth/EducationMA29
a day at the game
13. Your football team had a fi eld goal in the fi rst quarter, a touchdown plus an extra point in the second quarter, a touchdown but missed the extra point in the third quarter, and a safety in the fourth quarter. In the fourth quarter, the opposing team had 2 touchdowns followed by 2-point conversions for each touchdown. What was the fi nal score of the game?
14. Your football team had penalties of 15 yards, 5 yards, 15 yards, and 15 yards. The opposing team had 5 yards fewer than half that in penalties. What were the total yards lost for the game?
15. At the concession stand, the Booster Club makes a nickel profi t on each candy bar, a quarter on each box of popcorn, and $.40 for each beverage. If they sold 70 boxes of popcorn, 45 candy bars, and 107 beverages, what was their total profi t?
16. What is the area of a high school football fi eld from goal line to goal line (a football fi eld is 531/3 yards wide)?
17. Ticket sales were up this season by 17%. If last year’s totaled $12,000, what were this year’s sales?
18. The price of a student ticket was raised from $3.00 to $3.50 and the price of an adult ticket was raised from $5.00 to $5.50. If ticket sales for the fi rst game of the season were 210 student tickets and 748 adult tickets, what was the total additional revenue?
19. Football ticket sales bring in a profi t of $10,000 annually. New stadium lights and bleachers will cost $24,000, annual maintenance is $2,000 and $1,000 is needed for the replacement of equipment each year. Given the fi gures, how many years will it take to break even and begin making a profi t?
20. It is second down and 9-yards to go for the fi rst down. The quarterback is sacked for an 8-yard loss. On third down, how many yards are necessary to achieve a fi rst down?
21. The football game is scheduled to begin at 7:30 p.m. The pre-game show lasts 8 minutes. The band must report 10 minutes prior to the start of the pre-game show. What time must the band be present?
22. In the fourth quarter the clock says 1:59.04. The next 4 plays take 39.2 seconds, 15.85, 20.08, and 9.79 seconds off the clock. How much time is left?
23. The stadium lights are turned on at 6:40 p.m. and turned off 30 minutes after the game is over. If the game is over at 9:28 p.m., how many minutes of electricity will be charged by the utility company?

MA30
Mathematics
ProFootballHOF.comPro Football Hall of Fame Youth/Education
24. Given the following attendance statistics for your school’s 7 home games, fi nd the median for the attendance at the home games
Home Games Attendance#1 958#2 15,002#3 500#4 12,980#5 11,040#6 935#7 10,091
25. The kickoff return player fi elded 5 punts during the game. The fi rst, he caught at his own 8-yard line and returned it to his own 26-yard line. The second, he caught at the opponent’s 48-yard line and returned it to their 34-yard line. The third, he made a “fair catch” at his own 26-yard line. The fourth he fi elded at his own 12-yard line and scored a touchdown. The fi fth, he caught on his 28-yard line and was immediately tackled for no gain. What was his average punt return for this game?
26. What percentage of the fi eld has your team covered if they move the ball from their 20-yard line to their 40-yard line?
27. The defensive back intercepts the football at his own 5-yard line and runs to the opposing team’s 5-yard line before being tackled. How many yards did he gain on the interception?
28. The kicker made successful fi eld goals of 37 yards, 29 yards, 42 yards, 18 yards, 19 yards, 40 yards, 31 yards, and 20 yards. He missed fi eld goals of 50 yards and 46 yards. What was his percent of success?
29. In the fi rst game of the season, the fullback ran for 17 yards, 5 yards, 12 yards, 21 yards, -6 yards, 34 yards, 3 yards, -2 yards, 10 yards, 7 yards, 4 yards, 18 yards, 66 yards, and 2 yards. What was his average yards per carry for the game?
30. What is the difference between the tallest player on the team at 7’ 5/8” and the shortest player on the team at 5’6 3/4”?
A Day at the game

Mathematics
ProFootballHOF.com Pro Football Hall of Fame Youth/EducationMA31
Directions: Read the following paragraphs about two NFL stars. Then complete the charts to fi gure out each one’s age.
During his 17-year, 242-game career with the Miami Dolphins, Hall of Fame quarterback Dan Marino has earned the right to be called the most prolifi c passer in NFL history. At the time of his retirement Marino held four of the NFL’s major career passing records with 61,361 passing yards, 4,967 comple-tions, 8,358 passing attempts, and 420 passing touchdowns. Marino was selected to nine Pro Bowls during his illustrious career with the Dolphins. Thirteen times Marino passed for 3,000 yards or more in a single season, including six seasons in which he threw for 4,000 yards or more, and one season where he became the fi rst player in NFL history to throw for 5,000 yards in one season. Marino passed for 300 yards in a single game 63 times, and threw for 400 yards or more in a single game 13 times – both were NFL records when he retired. Use the steps below to fi gure out his age.
Step 1 ______ # of career completionsx ______ # of Pro Bowls= ______ total for step 1
Step 4 _______ # of career games+ _______ total for step 3= _______ total step 4
Step 7 _______ total step 6+ _______ # of 400-yard games= _______ total step 7
Step 2 ______ # of career passing yards- ______ total Step 1= ______ total for step 2
Step 5 ______ total step 4- ______ # of career touchdown passes= ______ total step 5
Step 8 _______ total of step 7+ ___8___= _______ Dan’s Age
Step 316,854- ______ total step 2= ______ total step 3
Step 6 _______ total step 5+ _______ # of 3,000-yd seasons= _______ total step 6
Hall of Fame quarterback John Elway became known as “Mr. Comeback” due to his 47 career fourth quarter comeback victories or ties. Elway was selected to nine Pro Bowls during his 16-year career with the Denver Broncos. Considered as one of the most versatile quarterbacks in NFL history Elway scrambled to a career rushing mark of 3,407 yards. His 51,475 career passing yards, along with 4,123 completions, place him fourth on the NFL’s all-time passing list. His 7,250 passing attempts are fourth all time in that category. Elway’s versatility is displayed by his 334 total career touchdowns (300 passing, 33 rushing, and 1 receiving). Elway led his team into fi ve Super Bowl appearances that included two NFL championships. Elway took home the Super Bowl MVPAward in the fi nal game of his career. Use the steps below to fi gure out his age.
Step 1______ # career passing yards/ ______ # Super Bowl starts= ______ total for step 1
Step 3_____ total for step 2- ______ total for step 1= ______ total for step 3
Step 5_____ total for step 4+ _____ # of Super Bowl MVP= _____ total of step 5
Step 2______ # of career attempts+ ______ # of career rushing yards= ______ total for step 2
Step 4_____ total career touchdowns(passing, rushing, receiving)- _____ fourth quarter comebacks+ _____ Pro Bowls= _____ total for step 4
Step 6_____ total for step 3- _____ total for step 5- __12_= _____ John’s age
How Old Are They?

MA32
Mathematics
ProFootballHOF.comPro Football Hall of Fame Youth/Education
Conversions in football
Directions: Complete the following problems, be sure to show all of your work on a seperate sheet of paper.
1. During his career, Barry Sanders rushed for 15,269 yards. How many feet is that? __________
2. Ed Reed of the Baltimore Ravens returned an interception for an NFL record 107 yards in 2008. How many inches is that? ______
3. Drew Brees passed for 5,177 yards in 2012. How many miles is that? ___________ *Hint: 1 mile = 1,760 yards Round to the nearest tenth.
4. Adrian Peterson of the Minnesota Vikings rushed for 2,097 yards in 2012. How many feet is that?__________
5. The Ravens have the ball on their own 25-yard line and they complete a 45-yard pass. They then lose 4 yards on the next play. What yard line are they on now?__________
6. Joe Flacco throws a 54-yard pass. How many inches did he throw? __________ How many centimeters?__________ Hint: 1 inch = 2.54 centimeters
7. A football fi eld measures 100 yards from goal line to goal line. A fi eld is 53 1/3 yards wide. Convert these measurements to feet. __________ _____________
8. Haloti Ngata of the Baltimore Ravens weighs 350 pounds. How much does he weigh in ounces? ____________
9. A game normally lasts 60 minutes. During a 16-game season, how many total minutes does one team play? ___________
10. There are seven offi cials on the fi eld for every NFL game. If 16 games are played each week, what is the total number of offi cials offi ciating throughout the NFL each week? ____________

Mathematics
ProFootballHOF.com Pro Football Hall of Fame Youth/EducationMA33
Super Bowl games are written with Roman numerals. The use of Roman numerals actually began with Super Bowl V. Use the chart to calculate past and future games.
Roman Numeral Chart1 2 3 4 5 6 7 8 9 10 50I II III IV V VI VII VIII IX X L
Example:X = 10
+ IX = 9Super Bowl 19
X=_____+V=_____
Super Bowl_____
X=_____+IV=_____
Super Bowl_____
V=_____+IV=_____
Super Bowl_____X=_____
+X=_____+III=_____
Super Bowl_____
X=_____+X=_____+VI=_____
Super Bowl_____
X=_____+V=_____+III=_____
Super Bowl_____X=_____
+X=_____+X=_____+V=_____
Super Bowl_____
X=_____+X=_____+X=_____+II=_____
Super Bowl_____
X=_____+X=_____+X=_____
+VII=_____Super Bowl_____
• Write the Roman numeral for Super Bowl 48 which will be played in East Rutherford, NJ. ___________
Super Bowl Numbers
MA34
Mathematics
ProFootballHOF.comPro Football Hall of Fame Youth/Education
super bowl thunder
Directions: Answer the following questions using the Baltimore Ravens’ rosteron the following page.
1. Who was the oldest player on the team?
2. What number was Torrey Smith?
3. How many wide receivers (WR) were there?
4. How many players had 10 or more years of NFL experience?
5. How many quarterbacks (QB) were listed?
6. Who was the only player to attend Lane College?
7. Who was the heaviest player on the team?
8. Who was the lightest player on the team?
9. What position did number 90 play?
10. Add up the total weight of all the running backs (RB/FB).

Mathematics
ProFootballHOF.com Pro Football Hall of Fame Youth/EducationMA35
Super Bowl thunder
Baltimore Ravens 2012 Roster Super Bowl XLVII Champions
Source: Super BowlXLVII Game Program

MA36
Mathematics
ProFootballHOF.comPro Football Hall of Fame Youth/Education
Top active rushers
Top Active RushersHeading into the 2012 Season
(1,000 or more attempts)
Player Attempts Yards Average Yards/Attempt1. Steven Jackson 2,395 10,1352. Adrian Peterson 1,754 8,8493. Frank Gore 1,911 8,8394. Willis McGahee 1,957 8,0975. Michael Turner 1,639 7,3386. Maurice Jones-Drew 1,570 7,2687. Chris Johnson 1,463 6,8888. Marshawn Lynch 1,452 6,1329. Cedric Benson 1,600 6,01710. DeAngelo Williams 1,169 5,784
*Source: National Football League
1. Who had the best average yards/carry?
2. Who had the lowest average yards/carry?
3. What is the total yards rushed by all ten running backs?
4. What is the total of attempts of all ten running backs?
5. What is the average yards/attempt of all ten running backs combined?

Mathematics
ProFootballHOF.com Pro Football Hall of Fame Youth/EducationMA37
Goals/Objectives: Students will:
• Order numbers from smallest to largest• Review the terms range, median, mode and mean.• Determine the range, median, mode of a list of numbers.• Read and interpret a chart
Common Core Standards: Represent and Interpret Data
Methods/Procedures:• Students will answer a set of questions based on a chart given to them representing Hall
of Famer Wide Receiver Andre Reed’s career receiving yards• If able to, create a graph using the data from the chart• If able to, using NFL.com and/or ProFootballHOF.com, fi nd another Hall of Famer’s statis-
tics, create a chart, and fi nd the range, mode, median and mean of the statistics
Materials:• Hall of Famer’s Statistics Chart• Calculator• Worksheet• Access to NFL.com and/or ProFootballHOF.com by computer
Assessment:• Students will be assessed on accuracy of reponses
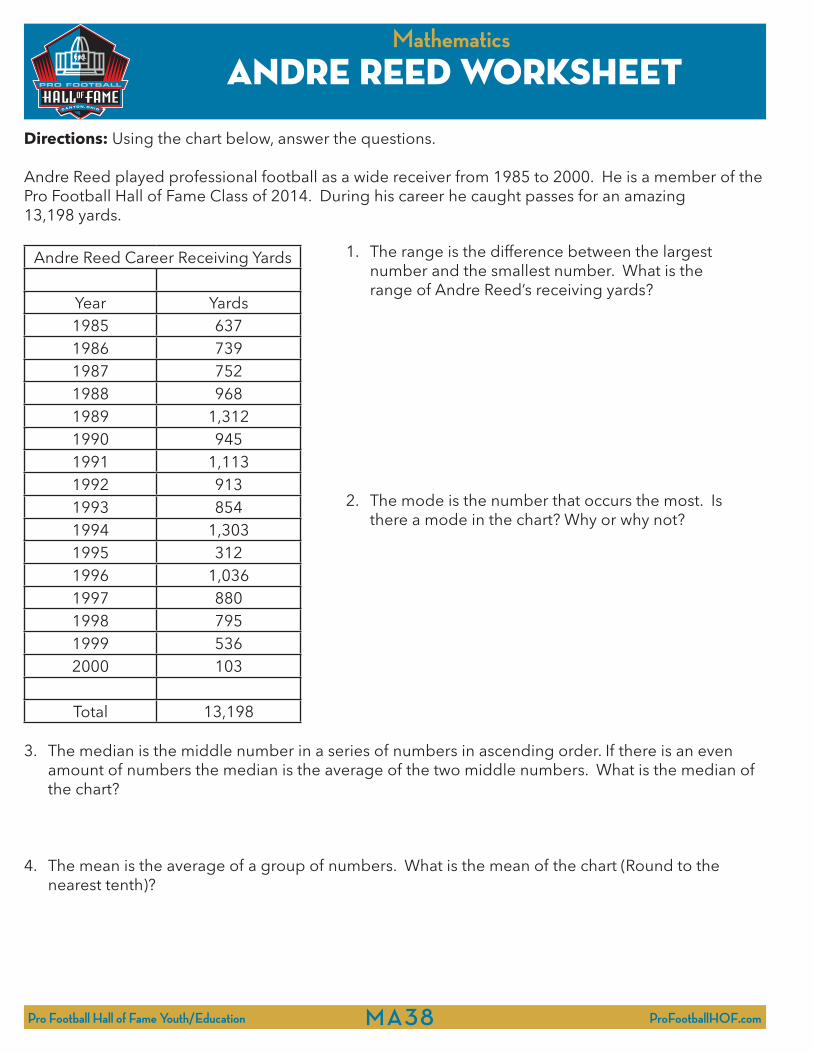
stats with andre reed
MA38
Mathematics
ProFootballHOF.comPro Football Hall of Fame Youth/Education
Directions: Using the chart below, answer the questions.
Andre Reed played professional football as a wide receiver from 1985 to 2000. He is a member of the Pro Football Hall of Fame Class of 2014. During his career he caught passes for an amazing 13,198 yards.
Andre Reed Career Receiving Yards
Year Yards1985 6371986 7391987 7521988 9681989 1,3121990 9451991 1,1131992 9131993 8541994 1,3031995 3121996 1,0361997 8801998 7951999 5362000 103
Total 13,198
3. The median is the middle number in a series of numbers in ascending order. If there is an even amount of numbers the median is the average of the two middle numbers. What is the median of the chart?
4. The mean is the average of a group of numbers. What is the mean of the chart (Round to the nearest tenth)?
1. The range is the difference between the largest number and the smallest number. What is the range of Andre Reed’s receiving yards?
2. The mode is the number that occurs the most. Is there a mode in the chart? Why or why not?
andre reed worksheet

Mathematics
ProFootballHOF.com Pro Football Hall of Fame Youth/EducationMA39
Goals/Objectives: Students will:
• Order numbers from smallest to largest• Review the terms range, median, mode and mean.• Determine the range, median, mode of a list of numbers.• Read and interpret a chart
Common Core Standards: Represent and Interpret Data
Methods/Procedures:• Students will answer a set of questions based on a chart depicting the leaders in the NFL
for receptions in the 2013-2014 NFL Season• If able, they can create a bar graph showing in graph form the number of receptions of
each NFL Wide Receiver• If able, use NFL.com and / or ProFootballHOF.com to fi nd other NFL Statistical Cate-
gory leaders and do the same process
Materials:• NFL Reception Leaders Chart• Calculator• Worksheet• Graph Paper (If doing bar graphs)• Access to NFL.com and / or ProFootballHOF.com by computer
Assessment:• Student will be assessed on accuracy of responses
NFL wide receiver math

MA40
Mathematics
ProFootballHOF.comPro Football Hall of Fame Youth/Education
Directions: Using the chart below, answer the questions.
Below is a chart that shows the top ten number of passes caught by wide receivers in the 2013 season.
WR Reception Leaders
PLAYER TEAM RECEPTIONSPierre Garcon WSH 113Antonio Brown PIT 110Andre Johnson HOU 109Julian Edelman NE 105Brandon Marshall CHI 100A.J. Green CIN 98Kendall Wright TEN 94Dez Bryant DAL 93Demaryius Thomas DEN 92Alshon Jeffery CHI 89
1. The range is the difference between the largest number and the smallest number. What is the range of the chart?
2. The mode is the number that occurs the most. Is there a mean in the chart? Why or why not?
3. The median is the middle number in a series of numbers in ascending order. If there is an even amount of numbers the median is the average of the two middle numbers. What is the median of the chart?
4. The mean is the average of a group of numbers. What is the mean of the chart?
NFL wide receiver math

Mathematics
ProFootballHOF.com Pro Football Hall of Fame Youth/EducationMA41
Goals/Objectives: Students will:
• Review addition facts• Practice problem solving skills• Read and interpret a chart
Common Core Standards: Operations and Algebraic Thinking
Methods/Procedures:• Students will answer a set of questions based on a chart given to them about how points
were given for touchdowns, fi eld goals, and point-after conversions throughout histo-ry
• If visiting the Hall of Fame, there is an interective chart where students can view this
Materials:• Scoring System Chart (If no visit)• Calculator• Worksheet
Assessment:• Student will be assessed on accuracy of responses
NFL scoring system

MA42
Mathematics
ProFootballHOF.comPro Football Hall of Fame Youth/Education
Directions: Using the chart below, answer the questions.
During your visit to the Pro Football Hall of Fame you saw an interactive chart that explained the devel-opment of the NFL scoring system. In 1892 scoring in football looked quite different than today. For example, a fi eld goal was worth more than a touchdown.
History of Scoring in the NFL
Type of Score Points Awarded
1892Field Goal 5 pointsTouchdown 4 pointsPoint After Touchdown 2 points
1897Point After Touchdown 1 point
1904Field Goal 4 points
1909Field Goal 3 Points
1912Touchdown 6 points
19942-Point Conversion 2 points
2. What would the score be if the game had been played in 1904?
1909? 1912? Today?
An 1892 game could have had a score like this…
Home - 31Visitor - 21
Home Field Goals = 5 for 25 pointsHome Touchdowns = 1 for 4 pointsPoint after touchdown =1 for 2 pointsHome total 31
Visitor Field Goals = 3 for 15 pointsVisitor Touchdowns = 1 for 4 pointsPoint after touchdown = 1 for 2 pointsVisitor total 21
1. Are they other ways the teams could have achieved the same scores? If so, please explain. If no, please explain-
NFL scoring system

Mathematics
ProFootballHOF.com Pro Football Hall of Fame Youth/EducationMA4 3
Miscellaneous Math Activiities
Teachers: The following are classroom mathematics activities for you and your students to enjoy. Feel free to adapt and make copies of these ideas to suit your classroom.
NERF FOOTBALL: Use a Nerf football to provide math practice. With a permanent marker draw puzzle pieces all over the ball and number each piece. When the student catches the football, they either add or multiply the numbers found under their fi ngers. You can be “all thumbs” and still enjoy!
WEEKLY ANALYZING: Assign each student a team or a player and have them keep track of their weekly statistics. Give weekly math problems to the students in order to practice various mathematics skills. Students can keep a journal of their fi ndings to compare with their classmates’ fi ndings.
FIELD FACTS: Take a trip to a football fi eld. Have the students practice using rulers, measuring tapes, and compasses by giving assignments related to the fi eld. How far is the end zone from the goal post? How many inches is the entire fi eld? How many yards across is a fi eld? You could even have the students play a game of catch – how far can they throw? Who can catch the farthest throw?
FOOTBALL FOLDER GAME: Using the inside of a fi le folder, draw the outlines of 10 footballs and then write a different number inside each one. Laminate the folder. Draw matching football shapes on poster board, add corresponding number of dots, laminate and cut out. To play, the student counts the number of dots on the football and places it on top of the matching numbered footballs on the fi le folder. You could also use this for multiplication and subtraction by adapting the numbers.
ROMAN NUMERAL FUN: Super Bowls are numbered by Roman numerals. Make a list of Roman numerals from one to fi fty. Multiply each number on your list by ten and write the products in Roman numerals.
The Hall of Fame welcomes any suggestions for classroom activities.Please share your thoughts and ideas by contacting the
Educational Programs Staff at (330) 456-8207 or e-mail [email protected].

MA44
Mathematics
ProFootballHOF.comPro Football Hall of Fame Youth/Education
Answer Key
How Far is 300 Yards?Jason Tucker - 993 feet, 11,916 inchesJermaine Lewis -924 feet, 11,088 inchesJacoby Ford - 987 feet, 11,844 inchesGlyn Milburn - 1,212 feet, 14,544 inchesTyrone Hughes - 1,041 feet, 12,492 inchesJohn Taylor - 963 feet, 11,556 inchesWillie Anderson - 1,008 feet, 12,096 inchesJoshua Cribbs - 948 feet, 11,376 inchesStephone Paige - 927 feet, 11,124 inchesLionel James - 1,035 feet, 12,420 inchesAdrian Peterson - 1,083 feet, 12,996 inchesWalter Payton - 900 feet, 10,800 inchesDarren Sproles - 951 feet, 11,412 inchesSteve Smith - 939 feet, 11,268 inchesGale Sayers - 1,017 feet, 12,204 inches
Using Variables With NFL Scorers1. Completed on worksheet.2. (565*3)+x=2,544 x=8493. (9*6)+(335*3)+x=2,002 x=9434. (3*x)+638=1,736 x=3665. (413*3)+x=1,867 x=6266. (3*x)+655=2,150 x=4957. (461*3)+x=1,970 x=5878. (3*x)+675=1,983 x=4369. (478*3)+628=x x=2,06210. (471*3)+x=2,004 x=591
How Many People Attended NFL Games2011 - 65,000 - 60,0002010 - 65,000 - 60,0002009 - 65,000 - 60,0002008 - 67,000 - 60,0002007 - 67,000 - 60,0002006 - 67,000 - 60,0002005 - 66,000 - 60,0002004 - 66,000 - 60,0002003 - 66,000 - 60,0002002 - 66,000 - 60,0002001 - 65,000 - 60,0002000 - 66,000 - 60,0001999 - 65,000 - 60,0001998 - 64,000 - 60,0001997 - 62,000 - 60,000
What’s in a Number?#8: Factors: 1, 2, 4, 8 Composite Multiples: 8,16, 24,32, 40, etc.#61: Factors: 1 & 61 Prime Multiples: 61, 122, 183, 244, 305, etc.#53: Factors: 1 & 53 Prime Multiples: 53, 106, 159, 212, 265, etc.#75: Factors: 1, 3, 5, 15, 25, 75, Composite Multiples: 75, 150, 225, 300, 375, etc.#81: Factors: 1, 3, 9, 27, 81 Composite Multiples: 81, 162, 243, 324, 405, etc.#37: Factors: 1 & 37 Prime Multiples: 37, 74, 111, 148, 185, etc.#63: Factors: 1, 3, 7, 9, 21, 63 Composite Multiples: 63, 126, 189, 252, 315, etc.#60: Factors: 1, 2, 3, 4, 5, 6, 10, 12, 15, 20, 30, 60 Composite Multiples: 60, 120, 180, 240, 300, etc.
A Day At The Game1. $372.002. 60 minutes, 3,600 seconds3. 42 players4. 6,772 empty seats5. 336 ounces, 21 pounds6. 3,200 programs7. $ 89.958. $ 45.509. 3 hours, 39 minutes10. 58,050 fans11. 74 points12. Opposing team’s 29-yard line13. 18 to 1614. 70 yards15. $62.5516. 5,333 1/3 square yards or 48,000 square feet17. $14,04018. $479

Mathematics
ProFootballHOF.com Pro Football Hall of Fame Youth/EducationMA4 5
19. Four years20. 1721. 7:12 PM22. 0:34.12 or 34.12 seconds23. 198 minutes24. 10,09125. 30 yards (the fair catch does not count against him, thus, total yards is divided by 4 instead of 5)26. 20%27. 90 yards28. 80%29. 13.64 yards per carry30. 1’5 7/8”
How Old are They?Dan Marino:Step 1 – 44,703Step 2 – 16,658Step 3 – 196Step 4 – 438Step 5 – 18Step 6 – 31Step 7 – 44Step 8 – 52
John Elway:Step 1 – 10,295Step 2 – 10,657Step 3 – 362Step 4 – 296Step 5 – 297Step 6 – 53
Conversions in Football1. 45,807 feet2. 3,852 inches3. 2.94 miles4. 6,291 feet5. 34 yard line of opposing team6. 1,944 inches, 4,937.76 centimeters7. 300 feet long, 160 feet wide8. 5,440 ounces9. 960 minutes10. 112 offi cials
Super Bowl Numbers15, 14, 923, 26, 1835, 32, 37XLVIII
Super Bowl Thunder1. Ray Lewis, 5-15-752. 823. 64. 95. 26. Jacoby Jones7. Bryant McKinnie - 354 lbs.8. Justin Tucker - 180 lbs.9. Defensive End10. 913 lbs.
Top Rushers1. Adrian Peterson 5.042. Cedric Benson 3.763. 75,347 yards4. 16,910 attempts5. 4.46
Andre Reed1. 1,2092. No. There are no repeated numbers3. 867 4. 824.9
NFL WR1. 242. No. There are no repeated numbers3. 994. 100.3
Scoring System1. Answers will vary2. See Below: 1904: Home 25 - Visitors 17 1909: Home 20 - Visitors 14 1912: Home 22 - Visitors 16 Today: Home 22 - Visitors 16
Answer Key

MA4 6
Mathematics
ProFootballHOF.comPro Football Hall of Fame Youth/Education
Number PatternsRunning Back 1st Quarter 2nd Quarter 3rd Quarter 4th QuarterA 3 yards 6 yards 9 yards 12 yardsB 15 yards 20 yards 25 yards 30 yardsC 12 yards 16 yards 20 yards 24 yardsD 28 yards 40 yards 52 yards 64 yards
What is running back A’s number pattern?___________+3________________________
What is running back B’s number pattern?___________+5________________________
What is running back C’s number pattern?___________+4_________________________
What is running back D’s number pattern?___________+12_________________________
Running Back 1st Quarter 2nd Quarter 3rd Quarter 4th QuarterA 4.5 yards 8 yards 10.5 yards 15 yardsB 12.2 yards 19.5 yards 26.8 yards 34.1 yardsC 13.7 yards 15.4 yards 17.1 yards 18.8 yardsD 28.6 yards 39 yards 49.4 yards 59.8 yards
What is running back A’s number pattern?________________+3.5___________________
What is running back B’s number pattern?________________+7.3___________________
What is running back C’s number pattern?________________+1.7____________________
What is running back D’s number pattern?________________+10.4____________________
Answer Key