PRIVATE SCHOOL CHOICE: THE EFFECTS OF RELIGION AND RELIGIOSITY
45
PRIVATE SCHOOL CHOICE: THE EFFECTS OF RELIGIOUS AFFILIATION AND PARTICIPATION Danny Cohen-Zada Department of Economics, Ben-Gurion University, Beer-Sheva 84105, Israel William Sander Department of Economics, DePaul University, Chicago, IL 60604 May 2007 Abstract. In this paper, we quantify the religious factor in private education in the United States by estimating a Random Utility Model of school-choice in which households choose among public, private-nonsectarian, Catholic and Protestant schools. In our model households differ not only in their income levels but also in their religion and religiosity levels. The model is then estimated using multinomial logit and multinomial probit regressions of attendance at different types of private schools using individual data from the General Social Survey. We find that both religion and religiosity have important effects on the demand for the different types of private schools. Further, it is shown that if religiosity is not taken into account (the usual case), the effect of religion on demand is biased. Our results imply that previous studies on the treatment effect of Catholic schools that have not taken into account the selection of high- religiosity youth into Catholic schools overestimate the positive influence of Catholic schools. Keywords: School choice; demand for schooling; religious education JEL classification: J15, I20, Z12. Acknowledgements: We are grateful to Christopher Jepsen, Moshe Justman, and Evelyn Lehrer for their helpful comments and suggestions.
Transcript of PRIVATE SCHOOL CHOICE: THE EFFECTS OF RELIGION AND RELIGIOSITY

PRIVATE SCHOOL CHOICE: THE EFFECTS OF RELIGIOUS AFFILIATION AND PARTICIPATION
Danny Cohen-Zada Department of Economics, Ben-Gurion University, Beer-Sheva 84105, Israel
William Sander Department of Economics, DePaul University, Chicago, IL 60604
May 2007
Abstract. In this paper, we quantify the religious factor in private education in the United States by estimating a Random Utility Model of school-choice in which households choose among public, private-nonsectarian, Catholic and Protestant schools. In our model households differ not only in their income levels but also in their religion and religiosity levels. The model is then estimated using multinomial logit and multinomial probit regressions of attendance at different types of private schools using individual data from the General Social Survey. We find that both religion and religiosity have important effects on the demand for the different types of private schools. Further, it is shown that if religiosity is not taken into account (the usual case), the effect of religion on demand is biased. Our results imply that previous studies on the treatment effect of Catholic schools that have not taken into account the selection of high-religiosity youth into Catholic schools overestimate the positive influence of Catholic schools. Keywords: School choice; demand for schooling; religious education
JEL classification: J15, I20, Z12.
Acknowledgements: We are grateful to Christopher Jepsen, Moshe Justman, and Evelyn Lehrer for their helpful comments and suggestions.

I. Introduction
Most private elementary and secondary school students in the United States attend
parochial schools. Non-religious private schools only account for about 17% of private
school enrollment (United States Department of Commerce, 2006). Religious values in
the demand for private schooling are clearly important although they have not received
much consideration in studies on private schools. Parents send their children to religious
schools in part to help preserve a religious identity and instill religious values (Cohen-
Zada, 2006). Further, participants in voucher programs in Milwaukee and Cleveland
have overwhelmingly chosen religious schools. If we want to better understand why
parents choose private schools and what effect voucher programs might have it is
important to pay more attention to the religious factor in private education.
Yet, most of the empirical and theoretical studies on private schooling have not
directly taken into account the effects of religion and religiosity. Some exceptions include
a study by Campbell, West, and Peterson (2005) which considers the effects of religion
and religiosity on participation in a voucher program and Sander (2005) which considers
the effect of Catholic religiosity on the demand for Catholic schooling. Also, Figlio and
Stone (2001) adjust for religious participation in a study on private school cream-
skimming. Most estimates of the demand for private schools tend to at best adjust for
Catholic religion (or a proxy for Catholic religion). Non-Catholic religious effects and
the effects of religiosity have usually not been considered. Further, the broader effects of
religion at the aggregate level that Cohen-Zada and Justman (2003 and 2005) and
Ferreyra (2005) show are usually not considered in either empirical or theoretical studies
(Rangazas 1995, Epple and Romano, 1996; Glomm and Ravikumar 1998). Also, the
2
different determinants of demand for different types of religious schooling have not been
considered. The focus is usually on Catholic schools or private schools although there is
substantial heterogeneity within the private school sector.
In this paper, we first present a theoretical model of school-choice in which
households can choose between public, Catholic, Protestant and non-sectarian private
schooling. In our model, households differ not only in their income levels but also in their
religion and religiosity levels. The model is used to derive the probability that a
household attends various types of schooling. We then estimate this probability using
multinomial logit and multinomial probit regressions. Finally, we illustrate the
importance of quantifying the religious factor in private education for public policy. It is
shown that households with a higher probability of attending private schools would be
more affected by a voucher program than households with a lower probability.
For the empirical section, we use the General Social Survey (GSS), a dataset that
has not been used very often in studies on private schooling. Both household and
community-level effects of religion and religiosity on the demand for private schooling
are considered.1 Probit and multinomial logit estimates of the demand for private
schools, Catholic schools, Protestant schools, and non-sectarian private schools are
undertaken. It is shown that both religion and religiosity have important effects on the
demand for private, Catholic, Protestant, and non-sectarian schools. However, when
religiosity is not taken into account, the effect of religion on demand is biased. For
Catholic schools, the share of Catholics in the local population is also demonstrated to be
an important determinant of demand. It is also shown that as the percentage of African- 1 The present paper, which emphasizes religious differentiation, ignores the detrimental impact of cultural differences on productivity (Lazear, 1999) and its implications for education policy (Gradstein and Justman, 2000, 2002, 2005).
3

Americans increase in an area, there is “flight” to private and Protestant schools. This is
less an issue with Catholic schools. Further, we find that blacks are more likely to opt for
Catholic schools all other things being equal while they are less likely to opt for
Protestant schools even though blacks are disproportionately Protestant. Finally, our
findings indicate that non-sectarian private schools tend to be more elitist in the
population that they serve relative to Catholic schools and Protestant schools.
Our finding that religiosity has a substantial and significant positive effect on the
demand for private schooling also bears on research that estimates the treatment effect of
Catholic schools. In numerous studies researchers try to control for selection by first
estimating the probability of attending a Catholic (private) school. The predicted
probabilities from the first stage are then used to estimate the treatment effect of Catholic
(private) school attendance on student outcomes. Most of these studies fail to control for
religiosity in estimating the probability of attending a Catholic or private school (Evans
and Schwab 1995, Sander 1996; Neal, 1997; Dee 2005, among others). Other research
indicates that children who grow up in homes with more religious involvement tend to
have better educational outcomes (Parcel and Geschwender 1995, Elder and Conger
2000, Regnerus 2000, Muller and Ellison 2001, Bankston and Zhou 2002, Regnerus and
Elder 2003, Glanville et. al 2006, among others) implying that studies on Catholic school
effects have tended to over-estimate the treatment effect of Catholic schools.
The paper is organized as follows. First, a brief overview of related research is
given. Second, a theoretical model of private school choice is presented. Third, the
empirical models and data sources are reviewed. Fourth, the empirical results are
presented. Fifth, the importance of quantifying the religious factor in private education to
4

the analysis of voucher programs is illustrated. The paper closes with a discussion of the
findings.
II. Related Literature: A Thumbnail Sketch
Numerous studies have investigated the demand for private schooling, most of
which have not considered religious effects beyond the effect of being Catholic. Studies
that show a positive Catholic religion effect on private school attendance include Long
and Toma (1988), West and Palsson (1988), and Downes and Greenstein (1996). Several
studies use ethnic background as a proxy for Catholic religion to estimate private school
choice. These studies include Lankford and Wycoff (1992), Hamilton and Macauley
(1991), Chiswick and Koutroumanes (1996), and Hofrenning and Chiswick (1999). Some
of the key non-religious factors that are found to be significant in these studies include
positive income (and the variability of income), parents’ education, and central city
effects, as well as negative tuition and public school quality effects.
Another branch of literature has focused on the effects of attending private schools
on educational attainment and academic achievement rather than on the demand for
private schooling. To some extent, this literature has suggested that parents choose
private schools for their children if they are superior to public schools. Most of these
studies focus on Catholic schools because they account for the largest share of the private
school sector. Early studies by Coleman, Hoffer, and Kilgore (1982) and Coleman and
Hoffer (1987) suggested that Catholic schools have positive effects on test scores and
high school graduation rates. Since these studies, there have been numerous attempts to
estimate private school effects taking into account selection (e.g., Evans and Schwab,
5

1995; Grogger and Neal, 2000; Jepsen, 2003; Neal, 1997; Sander, 1996; Sander and
Krautmann, 1995). The most recent contribution to this literature concludes that Catholic
high schools have a large effect on high school graduation rates, especially for minorities,
but no effect on test scores (Altonji, Elder, and Taber, 2005). These studies try to control
for the possibility of positive selection into Catholic schools by first estimating the
probability of attending a Catholic school and then using the predicted probability of
Catholic school attendance to estimate the treatment effect of Catholic schools on student
achievement. However, they fail to control for religiosity in the first stage selection
equation. In this case, if students in Catholic schools are relatively more religious than
students in public schools and religiosity has a positive effect on student outcomes, then
the treatment effect that researchers find are likely to be biased upward. Thus, it is
important to consider how both religion and religiosity affects school choice.
Indeed, many studies show that both religion and religiosity have important effects
on economic outcomes (Chiswick 1986 and 1988, Freeman 1986, Lehrer 1999, 2004a
and 2004b, Gruber 2005, among others). These studies show that there is a systematic
pattern of differences by religious affiliation in educational attainment, and that higher
levels of religiosity tend to be associated with more favorable educational outcomes. A
related literature has developed causal mechanisms for the connection between religious
involvement among youth and beneficial outcomes in many areas including education,
mental health, and substance use (Waite and Lehrer, 2003).
Yet another line of research has considered the effects of “white flight” to private
schools. This literature shows that white parents are more likely to send their children to
private schools as the concentration of African-American children in public schools
6

increases (Chiswick and Koutroumanes 1996; Fairlie and Resch, 2002). Betts and Fairlie
(2001) show that immigrants also increase “flight” to private schools. Coleman, Hoffer,
and Kilgore (1982) also examined the related issue of segregation and educational
opportunity in schooling. They found that Catholic schools lessened inequality in
educational opportunity while public schools and other private schools increased it.
Although the effects of religion and religiosity have not generally been the focus of
empirical studies on the demand for private schooling, there are a few studies where they
are considered. Using 1963-64 survey data, Greeley and Rossi (1966) show that parents’
religiosity had a large effect on Catholic school enrollment. Sander (2005) also shows
this to be the case.
Cohen-Zada and Justman (2005) follow another line of research on the religious
factor in private education by calibrating the distribution of households' religiosity in a
model of school choice where parents choose among public, private non-sectarian, and
religious schools. They then simulate how household income and the size of vouchers
affect the demand for private schools. In another study, Cohen-Zada and Justman (2003)
show that the share of Catholics in the local population has a concave effect on the
demand for private schools. The reasons that Catholic population density might affect
the demand for Catholic schools include the effects of density on costs through scale
economies and tuition subsidies and the effects of the concentration of Catholics in public
schools on the demand for Catholic schooling. For example, an increase in the
percentage of Catholic students in public schools might reduce the demand for Catholic
schools if Catholic parents prefer that their children attend school with other Catholics
(Cohen-Zada, 2006).
7

III. Formal Analysis 2
Basic definition of the model
An empirical model of how households choose among school alternatives should
be grounded upon a theoretical model that describes the factors that affect school-choice.
In this section we posit a rational model of school choice in which each household
evaluates its utility from each type of schooling and chooses the alternative that
maximizes its utility.
Consider an economy with a fixed population of households of measure one,
indexed by i, each household comprising one parent and one child. The economy consists
of two religious groups: Catholics and Protestants of measures r and 1 - r, respectively.3
Each household is characterized by the group to which it belongs, by its level of
religiosity zi, and by its after-tax income yi. Each child attends a public school, Catholic
school, Protestant school, or non-sectarian private school.
Household utility depends on consumption of a numeraire good c, on the academic
quality of their children's education x, on the religious orientation of the school given the
household religion and religiosity levels, and on unobservables captured by a stochastic
term, ε . We set the utility function to be equal to
( ) ( ) ( )( ) ( )⎪⎩
⎪⎨⎧
−+−+⋅
+⋅++−+⋅=
schoolreligiousnonifxca
schoolreligiousifzRxcazxcU
JiSii
JiSi
JS
JSii
iii εα
εβα
ln)1(ln
ln)1(ln,, , (1)
2 The formal analysis builds on previous efforts by Cohen-Zada and Justman (2005). 3 To simplify the model we ignore households who belong to other religions and households that do not belong to any religion. In our dataset, only 4.5% of the households reported they do not belong to any religion.
8

where denotes the utility or disutility that a household of denomination J = (CA,
PRT) with zi = 0 derives from the religious environment in religious schooling of type S =
(CS, PS). For example, reflects the utility that a Catholic household with zi = 0
derives from the religious environment in Catholic schooling. We assume
that , which means that each household with zi = 0 derives greater utility (or
less disutility) from the religious environment in religious schooling of its denomination
than from religious schooling of another denomination.
JSR
CACSR
JJS
JJS RR ≠>=
The matrix { }JSβ reflects the effect of religiosity on the utility that households
derive from each type of religious schooling. Two assumptions are made on the elements
of the matrix β. First, we assume that , which implies that religiosity increases
the utility that households derive from the religious schooling of their denomination.
Second, we assume that
0>=J
JSβ
JJS
JJS ≠>= ββ . That is, the effect of religiosity on household
utility is greater when the school belongs to the denomination of the household than when
it belongs to another denomination. These restrictions leave space for to be either
positive or negative. A positive value of
JJS≠β
JJS≠β implies that among households who
belong to denomination J, religiosity increases the utility they derive from religious
schooling of type . On the other hand, a negative value of implies that as
households of denomination J are more religious, they derive less utility from a religious
school of type .
JS ≠ JJS≠β
JS ≠
Public education is available free of charge to all households at an exogenous
uniform quality x . Private schools, religious and non-religious, are available as
alternatives to public schooling, and can be purchased from a competitively-priced
9

private sector at any desired quality. Thus, households can choose to forgo free public
education and instead buy religious education or non-sectarian private education.
We assume that each religious group operates a religious school and that the cost
per unit of quality in each religious school depends negatively on the share of the
religious group in the local population. This assumption is supported by Hoxby (1994)
who provides evidence that Catholic secondary schools receive more revenues from non-
tuition sources and consequently charge lower tuitions in localities where the share of
Catholics is higher. In addition, she mentions several other reasons why the price of a
denominational school depends negatively on the relative share of the denomination in
the local population. First, denominational schools reduce their costs by sharing facilities
and personnel services with the church. The supply of these facilities and personnel
services become more available as the share of the denomination in the local population
grows. Second, as the share of a religious group in the population grows, the density of
the group's religious schools increases thus reducing transportation costs to the school.
The price (cost per unit of quality) of Catholic schooling is then
, (2A) 1γ−= rpCS
and in Protestant schooling it is
. (2B) 2)1( γ−−= rpPS
According to these functions, as the share of each denomination in the local
population grows the price of its denominational schools decreases. In addition, these
functions reflect the idea that scale effects are more pronounced when the share of the
10

religious group in the population is relatively small. That is, school's costs decreases
more rapidly when the share of the religious group in the local population increases from
0% to 5% than when it grows from 40% to 45%.
On the other hand, the price of non-sectarian private schooling, pNS , is exogenous
and does not depend on the religious composition of the community. Thus, we set
. (2C) ppNS =
School Choice
Consider how households choose between public, Catholic, Protestant, and non-
sectarian private schooling to maximize utility. A household of group J that chooses
public education receives free schooling of quality x . Therefore, it spends all its
disposable income on consumption, ii yc = . Denoting by the non-stochastic
component of the utility function of a household of denomination J from a school of type
S, equation (1) then implies that the utility of a household that sends its child to a public
school equals
JSV
( ) ( ) J
iGiJ
iGJ
GJ
G xyaVW εαε +−+⋅=+= ln)1(ln .
(3)
A household that chooses a Catholic school solves:
( ) ( ) ( )
iCS
JiCSi
JCS
JCSiiiii
ypxctszRxcasxcUMax
=⋅++⋅++−+⋅=
..ln)1(ln,, εβα
,
and has indirect utility
11

[ ] J
iCSiJ
CSJCSiCS
JiCS
JCS
JCS zRypaVW εβαααε +⋅+++−⋅−+⋅=+= )ln(/)1(ln)1()ln( . (4)
Similarly, a household that sends its child to a Protestant school solves:
( ) ( ) ( )
iPS
JiPSi
JPS
JPSiiiii
ypxctszRxcasxcUMax
=⋅++⋅++−+⋅=
..ln)1(ln,, εβα
.
Its utility is then
[ ] JiPSi
JPS
JPSiPS
JiPS
JPS
JPS zRypaVW εβαααε +⋅+++−⋅−+⋅=+= )ln(/)1(ln)1()ln( . (5)
Finally, a household that sends its child to a non-sectarian private school solves:
( ) ( ) ( )
iNS
JiNSiiiii
ypxctsxcasxcUMax
=⋅++−+⋅=
..ln)1(ln,, εα
,
and derives utility
[ ] J
iNSiNSJiNS
JNS
JNS ypaVW εαααε ++−⋅−+⋅=+= )ln(/)1(ln)1()ln( . (6)
We assume that the error terms in the utility functions are identically and independently
distributed across individuals according to the double exponential with zero mean and
variance equal to (McFadden, 1974). In this case, the probability that a household
of religion J will send its child to a Catholic school is
2/6 π
( )
( ) ( ) ( ) ( )JNS
JPS
JCS
JG
JCSJ
CS VVVVV
expexpexpexpexp
+++=π ; (7A)
12
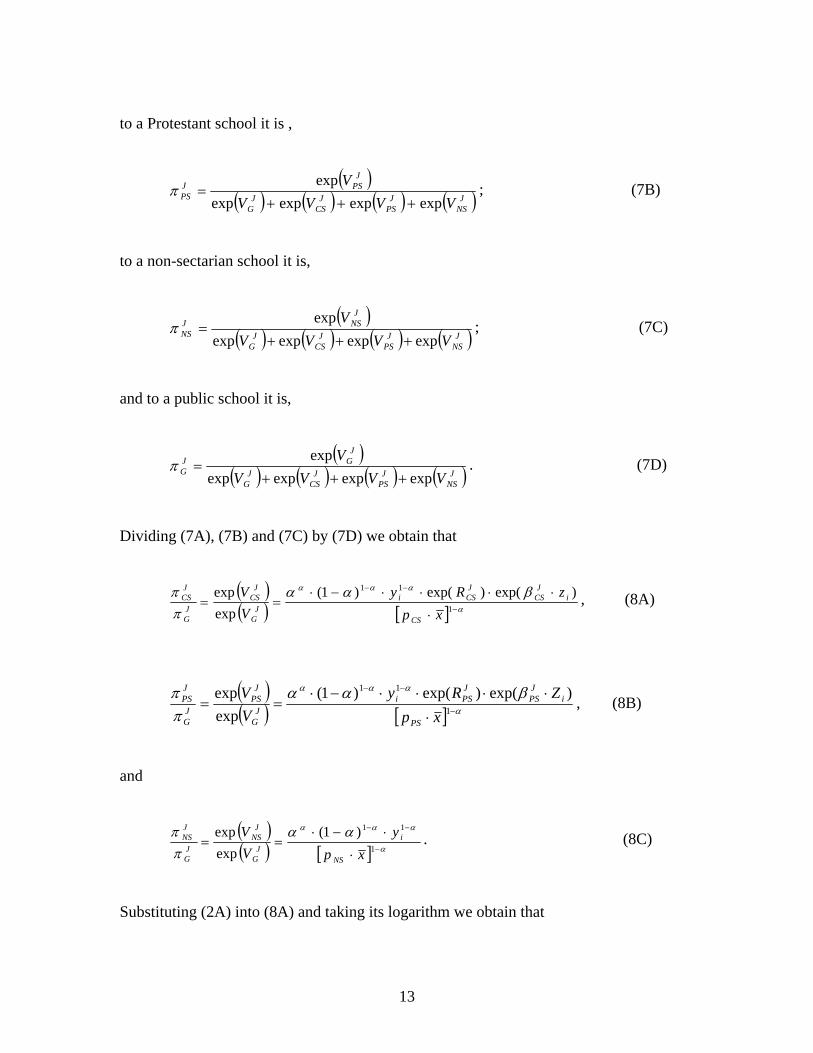
to a Protestant school it is ,
( )( ) ( ) ( ) ( )J
NSJ
PSJ
CSJ
G
JPSJ
PS VVVVV
expexpexpexpexp
+++=π ; (7B)
to a non-sectarian school it is,
( )( ) ( ) ( ) ( )J
NSJ
PSJ
CSJ
G
JNSJ
NS VVVVV
expexpexpexpexp
+++=π ; (7C)
and to a public school it is,
( )( ) ( ) ( ) ( )J
NSJ
PSJ
CSJ
G
JGJ
G VVVVV
expexpexpexpexp
+++=π . (7D)
Dividing (7A), (7B) and (7C) by (7D) we obtain that
( )( ) [ ] α
ααα βααππ
−
−−
⋅
⋅⋅⋅⋅−⋅== 1
11 )exp()exp()1(expexp
xpzRy
VV
CS
iJ
CSJCSi
JG
JCS
JG
JCS , (8A)
( )( ) [ ] α
ααα βααππ
−
−−
⋅
⋅⋅⋅⋅−⋅== 1
11 )exp()exp()1(expexp
xpZRy
VV
PS
iJPS
JPSi
JG
JPS
JG
JPS , (8B)
and
( )( ) [ ] α
ααα ααππ
−
−−
⋅
⋅−⋅== 1
11)1(expexp
xpy
VV
NS
iJ
G
JNS
JG
JNS . (8C)
Substituting (2A) into (8A) and taking its logarithm we obtain that
13

xrzRyf iJ
CSJCSi
J
G
CS ln)1()ln()1()ln()1()(log 1 ⋅−−⋅−⋅+⋅++⋅−+=⎟⎟⎠
⎞⎜⎜⎝
⎛ααγβαα
ππ . (9A)
Equation (9A) then presents explicitly the factors that affect the odds-ratio to attend a
Catholic rather than a public school among Catholics and among Protestants. It shows
that:
a) income has a positive concave effect on the probability of attending Catholic rather than public schools;
b) the share of Catholics in the population has a positive concave effect on the probability of attending Catholic rather than public education because it reduces the price of Catholic schools;
c) among Catholics, religiosity has a positive effect on the probability of attending Catholic rather than public schools;
d) among Protestants, the effect of religiosity on the probability of attending Catholic rather than public schools depends on the sign of . If is positive, religiosity increases the probability that a Protestant household will send its child to Catholic rather than public schools. On the other hand, if is negative, religiosity decreases the probability among Protestants of attending Catholic rather than public schools.
PRTCSβ PRT
CSβ
PRTCSβ
Similarly, substituting (2B) into (8B) and taking its logarithm yields
xrzRyf iJPS
JPSi
J
G
PS ln)1()1ln()1()ln()1()(log 2 ⋅−−−⋅−⋅+⋅++⋅−+=⎟⎟⎠
⎞⎜⎜⎝
⎛ααγβαα
ππ
. (9B)
Equation (9B) introduces the determinants of the odds-ratio to attend Protestant rather
than public schooling among Catholics and among Protestants. It shows that:
a) among Protestants, religiosity increases the probability of attending Protestant rather than public schools;
14

b) among Catholics, the probability of attending Protestant rather than public schools depends on the sign of : If , Catholics who are more religious are more likely to choose Protestant rather than public schooling, while if Catholics who are more religious are less likely to choose Protestant rather than public schooling.
CAPSβ 0>CA
PSβ0<CA
PSβ
We next analyze the effect of household religion on the probability of attending Catholic
rather than public schools. For this purpose, we first specify equation (9A) separately for
Catholics and for Protestants and obtain
xrzRyf iCACS
CACSi
CA
G
CS ln)1()ln()1()ln()1()(log 1 ⋅−−⋅−⋅+⋅++⋅−+=⎟⎟⎠
⎞⎜⎜⎝
⎛ααγβαα
ππ (10A)
xrzRyf iPRTCS
PRTCSi
PRT
G
CS ln)1()ln()1()ln()1()(log 1 ⋅−−⋅−⋅+⋅++⋅−+=⎟⎟⎠
⎞⎜⎜⎝
⎛ααγβαα
ππ (10B)
Subtracting (10B) from (10A) we obtain the effect of being Catholic on the probability of
attending Catholic rather than public schools
( iPRT
CSCACS
PRTCS
CACS
PRT
G
CS
CA
G
CS ZRR ⋅−+−=⎟⎟⎠
⎞⎜⎜⎝
⎛−⎟⎟
⎠
⎞⎜⎜⎝
⎛ββ
ππ
ππ loglog ) . (11)
Equation (11) shows that the effect of being Catholic on the probability of attending
Catholic rather than public schools depends on the level of religiosity. As ,
the effect of being Catholic on the probability of attending Catholic rather than public
schools is larger for higher values of zi . Thus, failing to control for religiosity would
yield an average Catholic effect that is lower than the effect of religious Catholics and
higher than the effect of non-religious Catholics. Thus, correct estimation of the
PRTCS
CACS ββ >
15

probability of attending Catholic rather than public schooling among the whole
population should include interaction terms between each religion and religiosity. Such
estimations may take the form:
⎩⎨⎧
+⋅−⋅++⋅+⋅⋅+⋅⋅+⋅+
=⎟⎟⎠
⎞⎜⎜⎝
⎛
i
iiii
G
CS
xarayatsoteszaCatholiczaCatholicaa
εππ
ln)ln()ln(tanPr
log65
43210 . (12)
We next show that the specification of equation (12) is consistent with our theoretical
model and try to relate each of its coefficients to the parameters of the model. In equation
(12), a1 captures the effect of being Catholic at zi = 0, which implies that
0loglog0,00,1
1 >−===
⎟⎟⎠
⎞⎜⎜⎝
⎛−
==
⎟⎟⎠
⎞⎜⎜⎝
⎛= PRT
CSCACS
ZCA
G
CS
ZCA
G
CS RRaππ
ππ
. (13)
Similarly, a2 captures the increase in the Catholic effect when zi increases by one. This is
represented in our model by the positive parameter in equation (10A). That is, CACSβ
0loglog00 ,11,1
2 >===
⎟⎟⎠
⎞⎜⎜⎝
⎛−
==
⎟⎟⎠
⎞⎜⎜⎝
⎛=
+
CACS
ZZCA
G
CS
ZZCA
G
CSii
a βππ
ππ
. (14)
Then, we interpret a3 in the terms of our model using equation (10B):
PRTCS
ZZPRT
G
CS
ZZPRT
G
CSi
a βππ
ππ
===
⎟⎟⎠
⎞⎜⎜⎝
⎛−
==
⎟⎟⎠
⎞⎜⎜⎝
⎛=
+ 00 ,11,1
3 loglog (15)
16

Finally, the coefficient of the logarithm of income is α−=14a ; the coefficient of the
Catholic share in the population is )1(15 αγ −⋅=a ; and the coefficient of the quality of
public schooling is )1(6 α−−=a .
Substituting equations (13), (14) and (15) into (12) we obtain the correct
specification for estimating the probability of attending Catholic rather than public
schools among the whole population which is consistent with our theoretical model:
( )
⎩⎨⎧
+⋅−−⋅−⋅+⋅−++⋅⋅+⋅⋅+⋅−+
=⎟⎟⎠
⎞⎜⎜⎝
⎛
ii
iPRTCSi
CACSi
PRTCS
CACS
G
CS
xrytoteszCatholiczCatholicRRa
εααγαββ
ππ
ln)1()ln()1()ln()1(tanPr
log1
0 , (16)
where >0, >0 and can be either positive or negative. PRT
CSCACS RR − CA
CSβ PRTCSβ
Following the same steps as outlined above, we obtain that the implied specification
for the probability to attend Protestant rather than public schools in the whole population
in the terms of our model is
( )
⎩⎨⎧
+⋅−−−⋅−⋅+⋅−++⋅⋅+⋅⋅+⋅−+
=⎟⎟⎠
⎞⎜⎜⎝
⎛
ii
iPRTPSi
CAPSi
PRTPS
CAPS
G
PS
xrytoteszCatholiczCatholicRRa
εααγαββ
ππ
ln)1()1ln()1()ln()1(tanPr
log2
0 , (17)
where < 0, >0 and can be either positive or negative. PRT
PSCAPS RR − PRT
PSβ CAPSβ
Finally, substituting (2C) into (8C) and taking its logarithm yields
pxyf iG
NS ln)1(ln)1()ln()1()(log ⋅−−⋅−−⋅−+=⎟⎟⎠
⎞⎜⎜⎝
⎛αααα
ππ . (18)
That is, as both public and non-sectarian private schooling do not include any religious
instruction in their curriculum, religion and religiosity are not expected to have any effect
17

on the odds ratio to choose between non-sectarian private schooling and public schooling.
The only factors that affect the choice between non-sectarian private schooling and public
schooling are household income, which increases the probability of attending non-
sectarian private schooling rather than public schooling, and the quality of the public
schools which decreases this probability.
Equations (16), (17) and (18) present the factors that affect school-choice between
all types of schooling.
Proposition 1
The following factors affect school-choice between Catholic, Protestant, non-sectarian
and public schooling:
1) Choice between all types of private schooling and public schooling
a) Income has a positive effect on the probability of attending all types of private schooling rather than public schooling.
b) The quality of the local public schools has a negative effect on the probability of attending all types of private schooling rather than public schooling.
2) Choice between Catholic and public schooling (Equation (16))
c) Catholic religion increases the probability of attending Catholic rather than public schooling.
d) The interaction term between Catholic religion and religiosity has a positive effect on the probability of attending Catholic rather than public schooling.
e) The share of Catholics in the local population has a positive concave effect on the probability of attending Catholic rather than public schooling.
18

3) Choice between Protestant and public schooling (Equation (17))
f) Catholic religion decreases the probability of attending Protestant rather than public schooling.
g) The interaction term between Protestant and religiosity has a positive effect on the probability of attending Protestant rather than public schooling.
h) The share of Protestants in the population has a positive concave effect on the probability of attending Protestant rather than public schooling.
In the next section we estimate equations (16), (17) and (18) simultaneously using
both multinomial logit and multinomial probit regressions.
IV. Empirical Models and Data
We estimate the probability of attending a private school (all types), a Catholic
school, a Protestant school or a non-sectarian private school. All of the estimates are
relative to attending public schools. In the data set, information is available on whether
respondents send (sent) their children to Catholic schools, Protestant/Christian schools,
other non-Christian religious schools, and private non-sectarian schools. Particular
attention is given to attendance at Catholic schools and Protestant schools because they
account for the largest shares of the private school population. We do not estimate
attendance at non-Christian religious schools because the sample is too small.
First, we undertake a probit estimate of the probability of attending a private school.
The right-hand variables include religion (relative to non-fundamentalist protestant), an
interaction term between attendance at religious services and religion (Catholics,
fundamentalist Protestants, and non-fundamentalist Protestants), household income
(measured categorically relative to income of $110,000 and over), education of the
respondent (relative to high school graduate), age of the respondent, African-American,
19

Hispanic, region (relative to west), population density, percent Catholics in the
population, percent African-American in the population, percent Hispanic in the
population, and whether the respondent lives in one of the 100 largest central cities in the
United States. In addition, following the theoretical model, we also include in the
estimation the share of Catholics in the population squared to allow the share of Catholics
in the population to have a concave effect on the probability of attending Catholic rather
than public schooling.4 The income variables are defined as follows: “Income 1”
indicates household with income less than $8,000; “Income 2” indicates income of
$8,000 to $17,499; “Income 3” indicates income of $17,500 to $24,999; “Income 4”
indicates income of $25,000 to $39,999; “Income 5” indicates income of $40,000 to
$59,999; “Income 6” indicates income of $60,000 to $89,999; and “Income 7” indicates
income of $90,000 to $109,000. The density variables are for the sampling areas (called
primary sampling units). They are either metropolitan statistical areas or non-
metropolitan counties.
Second, we undertake two multinomial logit estimates of attending a Catholic
school, Protestant school, non-sectarian private school, or a public school (the omitted
category). In the second case, we exclude the religiosity variables. We do this to show
the effects of omitted variable bias if religiosity is excluded. Using multinomial logit for 4 While the theoretical multinomial logit specification (equation 16) defines the odds-ratio of attending Catholic rather than public schooling as a function of the logarithm of %Catholic, we preferred to allow for concavity in our estimation by including a squared term of %Catholic rather than by taking its logarithm. The reason for this is that a squared term for %Catholic allows the share of Catholics in the population, above a critical point, to have a negative effect on the probability of attending Catholic rather than public schooling. Although in our model the share of Catholics in the population affects school-choice only through scale effects and thus predicts a positive effect of %Catholic on the probability of attending Catholic rather than public schooling, %Catholic may also reduce the demand for Catholic schooling if Catholic parents prefer that their children attend school with other Catholics (Cohen-Zada, 2005). In this case, one could expect that when the share of Catholics in the population is high enough and scale effects become less important, %Catholic would have a negative effect on the probability to attend Catholic rather than public schooling. Indeed, we found that by adding a squared term for %Catholic we better predict choice between Catholic and public schools than if we only take a logarithm term of %Catholic.
20

the estimation has both advantages and disadvantages. One advantage is that it allows us
to make a direct link between the theoretical model and the estimated one. Yet, it is
widely recognized that a potentially important drawback of the multinomial logit model
is the independence from irrelevant alternatives property. According to this property, one
assumes that the ratio of the probabilities of choosing between two alternatives is
independent of the existence and attributes of any other alternative. For example,
households' choice between public and Catholic schools does not depend on the existence
of non-sectarian private schooling. We deal with this concern by first testing the validity
of the IIA assumption using the Hausman and McFadden (1984) test and also by
comparing the results to those obtained from a multinomial probit estimation.
Last, we present predicted probabilities of attending Catholic schools, Protestant
schools, non-sectarian private schools, and public schools for typical Catholic
households, fundamentalist Protestant households, and black fundamentalist Protestant
households. The predicted probabilities are based upon the multinomial logit and
multinomial probit regressions with adjustments for religiosity.
One of the shortcomings in our study is that it is possible that participation in
religious services is not completely exogenous. For example, parents who send their
children to religious schools might attend church more often than they would otherwise.
It is probably more plausible that some parents might join a certain church (synagogue,
mosque, etc.) so that they can send their children to a school that is associated with it,
especially if the school is subsidized by the religious institution. This does not
necessarily increase religious participation by parents. In our sample, 59% of parents
attend religious services almost every week or more if they are sending (or have sent)
21

their children to religious schools. For parents less than 40 years old, 51% attend
religious services regularly if their children attended (or have attended) religious schools.
For older parents who are sending or have sent (more likely as parent’s age increases)
their children to religious schools, rates of church attendance tend to increase (61% for
parents 50+ and 66% for parents 60+). If attendance by parents was a result of religious
schooling, older parents with older children who attended religious schools might be less
likely to attend religious services regularly. Although this is not rigorous evidence that
endogeneity is not a problem, it does suggest that it is more plausible that higher rates of
religious participation by parents are a determinant of the demand for religious schooling
and less a result of it. More attention might be given to this issue in future research.
Household data from the National Opinion Research Center’s General Social
Survey are combined with aggregate data on the sample area. The GSS is a cross-
sectional national survey that has been carried out since 1972. The sample is limited to
respondents who are at least eighteen years old and live in a non-institutional setting. For
1998 and 2000, questions were asked of respondents with children older than five years
regarding the type of school they were sending (or sent) their children. The possible
responses were public school, home school, Catholic school, Christian/Protestant school,
other (non-Christian) religious school, and non-sectarian private school. We excluded
respondents who home schooled their children, a very small percentage.
The GSS is a useful data set for this study because data are also available on the
respondent’s religion and religiosity as measured by attendance at religious services.
However, one of the shortcomings in the data set is that information on tuition is not
available. Summary statistics for the data set are provided below (Table 1). In Table 2,
22
data are arrayed on attendance at religious services for all respondents, Catholic
respondents, and Protestant respondents. Respondents were given nine possible
responses from never to more than once per week. For Catholics and Protestants, about
one in three attends at least weekly. About one in three respondents regardless of their
religious affiliation (including none) attend once or twice per year or less. Table 3
presents attendance at religious services for each type of schooling. It shows that those
who choose Catholic and Protestant schooling attend religious services more often than
those who choose public schooling or non-sectarian schooling.
The individual data from the GSS database were combined with aggregate
demographic variables on the sample area. These variables were constructed from several
resources. First, county-level data on the population, Hispanic population, African-
American population, and on the density of population, were taken from the County and
City Data Book (2000). Second, data on the number of Catholic members in each county
were taken from the Religious Congregation and Membership in the United States
(2000). Finally, all of these variables were aggregated to the PSU level according to the
county composition of each PSU.
V. Empirical Results
A probit estimate of private school attendance is presented in Table 4. This
estimate shows the probability of attending any type of private school relative to a public
school. The results show that the religion of the respondent is not significant. However,
Catholic religiosity (Catholic x Attend) and fundamentalist Protestant religiosity
(Fundamentalist x Attend) have significant positive effects on attendance. While previous
23

studies focused on the effect of religion on school choice, our results show that
respondent’s religiosity as measured by participation is a more important determinant of
school choice. The three lowest income variables have significant negative effects on
attendance. That is, households with very low income levels cannot afford paying tuition
to private schools and are thus much less likely to send their children to them. Higher
levels of education have a positive effect on the probability to send a child to private
schools. One explanation for this result is that given the income of the household, more
educated parents attribute greater importance to better schooling relative to less educated
parents. Finally, the share of African-Americans in the local population, central city, and
age are also associated with higher levels of attendance.
A multinomial logit estimate of Catholic school attendance, Protestant school
attendance, and non-sectarian private school attendance is presented in Table 5. Public
school attendance is the omitted category. For Catholic school attendance, the results
indicate that Catholic religion and Catholic religiosity (Attend x Catholic) have
significant positive effects on attendance. The share of Catholics in the population has a
significant concave effect on the probability of attending a Catholic school, which peaks
when the share of Catholics in the population is about 27%. This result is consistent with
Cohen-Zada (2006) that shows that the share of Catholics in the population may reduce
the demand for Catholic schools if Catholic parents prefer that their children attend
schools with other Catholics. Family income is mostly not significant apart from a
significant negative effect for the lowest income category. Since tuition in Catholic
schools is subsidized households with relatively low-income levels can sometimes afford
sending their children to Catholic schools (except for households with very low income
24

levels). Parent’s education indicates a significant positive effect of some college and a
significant negative effect of high school dropout. The college graduate coefficient is not
significant. Black, age, and central city are shown to have significant positive effects.
The only religion variable that is significant for Protestant schools is a positive
effect for fundamentalist religiosity (Attend x Fundamentalist). The other significant
results include positive effects of college graduate and the share of African-Americans in
the population and negative effects of “Income 2”, age, and African-American. Non-
sectarian private schools, other religion, no religion, and nonfundamentalist Protestant
religiosity (Attend x Nonfundamentalist) are found to significantly increase attendance.
All of the income coefficients below “Income 7” have significant negative effects on
attendance while college graduates are significantly more likely to send their children to
non-sectarian schools. In this equation the income effect and the effect of college
graduates are much stronger than in the Catholic school attendance equation and the
Protestant school attendance equation. This indicates that non-sectarian private schools
tend to be more elitist in the population that they serve than Catholic schools and
Protestant schools. Finally, the other significant coefficients include positive African-
American and central city effects.
As mentioned earlier, multinomial logit has the property of independence from
irrelevant alternatives. Under this property, the ratio of probabilities for any two
alternatives is the same whether or not there are other alternatives. Hausman and
McFadden (1984) suggest testing if this property holds in a particular dataset by
estimating the model on a subset of the alternatives. If IIA holds then the estimated
coefficients obtained on the subset of alternatives will not be significantly different from
25

those obtained on the full set of alternatives. Hausman and McFadden (1984) also
provide a statistic for this test. Applying their test we find that IIA is not violated in our
estimation. In order to further illustrate that in our estimation the ratio of probabilities for
two school-alternatives does not depend on the existence of a third school-alternative we
report the results of a multinomial logit regression eliminating the non-sectarian private
school alternative. The results are presented in Table 6. It shows that the ratio of
probabilities between Catholic schooling and public schooling and between Protestant
schooling and public schooling is not affected by the existence of non-sectarian private
schooling.
To further show that our results are not driven by the IIA assumption we also run a
multinomial probit regression. The results are very similar to those obtained by the
multinomial logit estimation. Table 7 reports the marginal effects, multiplied by 100, of
each of the right-hand side variables on the probabilities of attending each type of
schooling for the multinomial logit and probit regressions. It shows that the two
estimation procedures yield very similar results and that the religious variables are even
slightly more significant under the multinomial probit regression.
Multinomial logit estimates of attending Catholic, Protestant, or non-sectarian
private schools relative to pubic schools without the religiosity adjustments are presented
in Table 8. The key changes in the results from Table 5 include Catholic religion
increasing in size and significance as a determinant of Catholic school attendance,
Catholic religion becoming negative and significant as a determinant of Protestant school
attendance, and fundamentalist becoming positive and significant as a determinant of
Protestant school attendance. These results are consistent with what we showed in the
26

theoretical model (i.e., that the effect of the religion variables becomes stronger when one
fails to control for religiosity).
Table 9 shows how religiosity affects the probability of attending Catholic schools,
Protestant schools, non-sectarian private schools, and public schools. The predicted
probabilities are generated from the multinomial logit and probit regressions presented
above (Table 7). The probabilities are for a typical Catholic household.5 The results
show that church attendance has a large effect on the probability of attending a Catholic
school. Catholics who attend church at least weekly are about as likely to send their
children to Catholic schools as they are to send them to public schools. Catholic
attendance at religious services is not strongly related with Protestant school attendance
or non-sectarian school attendance.
For the typical Protestant fundamentalist household, Protestant school attendance is
also shown to increase with church attendance (Table 10). However, the magnitude of
the relationship is not as strong as was the case for Catholics and Catholic schools:
Protestant fundamentalists who attend church at least weekly are more than twice as
likely to attend public schools as Protestant schools. The probability that fundamentalist
Protestants attend Catholic schools or non-sectarian private schools is not strongly related
to attendance at religious services.
Finally, in Table 11 data are presented on the probability of Catholic school
attendance, Protestant school attendance, non-sectarian private school attendance, and
public school attendance for a typical black fundamentalist Protestant family. The results
5 We set the quantitative variables of the typical household equal to their values at the mean: Age = 52, Percent Black in the population = 13.15%, Percent Catholic in the population = 20.94%, Percent Hispanic in the population = 10.29, and Density of population = 0.59. We set the dummy variables according to the categories that are most frequent: Income category 4 ($25,000 - $40,000), Non-Hispanic, White, Region = North.
27

show that both Catholic school attendance and Protestant school attendance increases
with religiosity. It is interesting to note that the relationship between Protestant church
attendance and private school attendance is about the same for Catholic schools and
Protestant schools—about one in ten with weekly church attendance send their children
to Catholic schools or Protestant schools. Non-sectarian private school attendance is
very low regardless of church attendance.
VI. Vouchers
In this section we illustrate the importance of quantifying the religious factor in
private education for assessing school-choice programs. Consider, for example, a
universal voucher program of value available for use in both religious and non-
sectarian private schools.
0v
In this case a household that chooses public education still have the utility level
given by equation (3). A household that choose a Catholic school now solves:
( ) ( ) ( )
0
0..ln)1(ln,,
vpxvypxcts
zRxcasxcUMax
CS
iCS
JiCSi
JCS
JCSiiiii
≥⋅+=⋅+
+⋅++−+⋅= εβα ,
and has indirect utility 6
[ ] JiCSi
JCS
JCSiCS
JiCS
JCS
JCS zRvypaVW εβαααε +⋅++++−⋅−+⋅=+= )ln(/)1(ln)1()ln( 0 (4')
6 As this indirect utility is correct only for households with income level higher than a
threshold income0vpx CS ≥⋅
0)1/( vyi ⋅−= αα . Below this threshold income households do not supplement the
voucher and thus the deterministic part of the indirect utility function is ( ) ( CSi pvya /ln)1(ln 0 )α−+⋅ . We concentrate here on households with income above this threshold income.
28

Similarly, a household that sends its child to a Protestant school derives utility
[ ] JiPSi
JPS
JPSiPS
JiPS
JPS
JPS zRvypaVW εβαααε +⋅++++−⋅−+⋅=+= )ln(/)1(ln)1()ln( 0 (5')
and a household that chooses non-sectarian private schooling derives utility
[ ] JiNSiNS
JiNS
JNS
JNS vypaVW εαααε +++−⋅−+⋅=+= )ln(/)1(ln)1()ln( 0 (6')
Following the same steps as in the basic model we obtain for example an equation that
determines the factors that affect the relative probability of attending Catholic rather than
public schooling
( )( )
( )[ ] αα
αα βααππ
iCS
iiJ
CSJCS
JG
JCS
JG
JCS
yxpvyzR
VV
⋅⋅
+⋅⋅⋅⋅−⋅== −
−
1
1 )exp()exp()1(expexp , (8A')
Differentiating with respect to the amount of the voucher we obtain: J
GJCS ππ /
( )[ ] ( )vyyxp
zRv i
JG
JCS
iCS
iJ
CSJCS
JG
JCS
+⋅=
⋅⋅
⋅⋅⋅−⋅=
∂∂
−
−
ππβααππ
αα
αα
1
1 )exp()exp()1(/ (19)
This result implies that the impact of a voucher program on the relative probabilities of
attending Catholic rather than public schooling is larger among households with
originally higher probability of attending Catholic schools.
In order to check whether a voucher program is expected to have a different effect on
households with different religiosity levels we differentiate equation (19) with respect to
zi and obtain
29

( )[ ] ( )
0)exp()exp()1(/
1
1
>+⋅
⋅=
⋅⋅
⋅⋅⋅⋅−⋅=
∂∂∂
−
−
vyyxpzR
zv iJG
JCS
JCS
iCS
JCSi
JCS
JCS
i
JG
JCS
πβπββααππ
αα
αα
That is, a voucher program is expected to have a larger effect on households who are
more religious. Furthermore, the effect of religiosity on the probability of attending
Catholic rather than public schooling estimated from the basic model without
vouchers, , also reflects how much stronger the effect becomes of a given voucher on
the probability of attending Catholic rather than public schooling as religiosity level
increases. Of course, similar patterns exist also with respect to Protestant schooling and
non-sectarian private schooling.
JCSβ
VII. Discussion
One of the key results in this study is that both religion and religiosity have
important effects on the demand for private schools. If religiosity is not taken into
account, the measurement of the effect of religion is seriously biased. Further, the effects
of religion and religiosity vary depending upon the type of private school in question. It
was shown that Catholic religiosity increases the demand for Catholic schools and has no
effect on the demand for other types of private schooling. Fundamentalist Protestant
religiosity increases the demand for Protestant schools and has no effect on the demand
for other types of private schooling. Non-fundamentalist Protestant religiosity increases
the demand for non-sectarian private schools and has no effect on the demand for other
types of private schooling. It was also shown that households with no religion were more
likely to choose non-sectarian private schools for their children. These results suggest
that religiosity is a key factor that affects who attends private schools and who might
30

respond to voucher initiatives. The latter point is supported by related research
(Campbell, West, and Peterson, 2005).
Other aspects of religion also bear upon who goes to private schools. It was shown
that the share of Catholics in the population has a concave effect on the likelihood of
attending Catholic schools. Further, it was shown that African-Americans, a
disproportionately Protestant group, were more likely to attend Catholic schools and less
likely to attend Protestant schools. One of the probable reasons for the Catholic result is
that Catholic schools have been more open to minority students relative to other private
schools (see Coleman, Hoffer, and Kilgore, 1982). The most recent data puts the
minority share in Catholic education at 27.1% in the United States (McDonald, 2005). In
big cities like Chicago, the minority share is higher—37% in the Chicago Archdiocese.
Of the blacks in Chicago Catholic schools, three out of four are not Catholic (Office of
Catholic Schools, 2006). This would also help to explain our result that a larger black
population results in more “flight” to Protestant schools and non-sectarian private schools
than it does to Catholic schools.
Another result of interest is that a more favorable family background in terms of
income and parents’ education is positively associated with the probability that children
attend non-sectarian private schools. These factors were less associated with the demand
for Catholic and Protestant schools. One reason for this in the case of Catholic schools is
that they are subsidized. However, recent data indicate that declines in subsidies and
increases in costs are resulting in a decline in the ability of Catholic schools to support
students from modest economic backgrounds (Sander, 2005).
31

In summary, this paper contributes to a better understanding of the demand for
private schooling, which is necessary in order to analyze how policy programs might
affect school choice. It distinguishes between different types of private schooling and
shows that households tend to send their children to private schools belonging to their
denomination. Our main finding that religiosity has a strong and significant effect on the
demand for private schooling implies that previous studies on Catholic/private schooling
effects have tended to overestimate the positive influence of Catholic (private) schooling.
The reason for this is that the effects of Catholic and other religious schooling are
confounded with the effects of religiosity.
Although this paper adds to our knowledge about private schooling, more work on this
topic is warranted. As noted above, more attention could be given to the possibly
endogeneous relationship between parents’ church attendance and private schooling.
Other measures of religiosity might be tried including contributions, religious beliefs, and
so on. Finally, more attention could be given to differences for more types of religious
schools like Lutheran schools, Christian schools, Jewish schools, and so on.
32

References
Altonji, J. G., T. E. Elder, and C. R. Taber. 2005. “Selection on Observed and Unobserved Variables: Assessing the Effectiveness of Catholic Schools.” Journal of Political Economy 113: 151-184.
Bankston, C. and M. Zhou. 2002, "Social capital and immigrant children's achievement." Schooling and Social Capital in Diverse Cultures, Volume 13, 13-139.
Betts, J.R. and R.W. Fairlie. 2001. “Explaining Ethnic, Racial, and Immigrant Differences in Private School Attendance.” Journal of Urban Economics 50: 26-51.
Broughman, S.P. and L.A. Colaciello. 1999. Private School Universe Survey: 1997-1998. Washington, D.C.: U.S. Government Printing Office.
Campbell, D., M. West and P. Peterson. 2005. "Participation in a national, means-tested school voucher program." Journal of Policy Analysis and Management 24(3): 523-541.
Chiswick, B.R. 1986. “Labor Supply and Investments in Child Quality: A Study of Jewish and non-Jewish Women.” Review of Economics and Statistics 68: 700-703.
Chiswick, B.R. 1988. “Differences in Education and Earnings Across Racial and Ethnic Groups: Tastes, Discrimination, and Investments in Child Quality.” Quarterly Journal of Economics 103: 571-597.
Chiswick, B.R. and S. Koutroumanes. 1996. “An Econometric Analysis of the Demand For Private Schooling,” in S.W. Polachek (Ed.) Research in Labor Economics 15: 209-237.
Cohen-Zada, D. and M. Justman. 2003. “The Political Economy of School Choice: Linking Theory and Evidence.” Journal of Urban Economics 54: 277-308.
Cohen-Zada, D. and M. Justman. 2005. “The Religious Factor in Private Education.” Journal of Urban Economics 57: 391-418.
Cohen-Zada, D. 2006. "Preserving religious identity through education: Economic analysis and evidence from the US.", Journal of Urban Economics 60: 372-398.
Coleman, J.S. and T. Hoffer. 1987. Public and Private High Schools. New York: Basic Books.
Coleman, J.S., T. Hoffer, and S. Kilgore. 1982. High School Achievement. New York: Basic Books.
Dee, T. 2005. "The effect of Catholic schooling on civic participation." International Tax and Public Finance 12: 605-625.
Downes, T.A. and S Greenstein. 1996. “Understanding the Supply Decisions of Nonprofits: The Location of Private Schools.” RAND Journal of Economics 27:365-390.
Elder, G. and R.D. Conger. 2000.Children of the land: Adversity and Success in Rural America. Chicago: University of Chicago Press.
33
Epple, D. and Romano, R. E., 1996, Ends against the middle: Determining public service provision when there are private alternatives, Journal of Public Economics 62, 297-325.
Evans, W.N. and R.M. Schwab. 1995. “Finishing High School and Starting College: Do Catholic Schools Make a Difference?” Quarterly Journal of Economics 110: 941-974.
Fairlie, R.W. and A.M. Resch. 2002. “Is There ‘White Flight’ into Private Schools: Evidence from the National Educational Longitudinal Survey.” Review of Economics and Statistics 84: 21-33.
Ferreyra, M. 2005. "Estimating the effects of private school vouchers in mulit-district economies., Forthcoming in the American Economic Review.
Figlio, D.N. and J.A. Stone. 2001. “Can Public Policy Affect Private School Cream Skimming?” Journal of Urban Economics 49: 240-266.
Freeman, R.B. 1986. “Who Escapes? The Relation of Churchgoing and Other Background Factors to the Socioeconomic Performance of Black Male Youths from Inner-City Tracts,” in R.B. Freeman and H.J. Holzer (Eds) The Black Youth Employment Crisis. Chicago: The University of Chicago Press.
Glanville. J. L., Sikkink, D. and Edwin, H. 2006. "Religious involvement and educational outcomes: The role of social capital and extracurricular participation." Forthcoming in Sociological Quarterly.
Glomm, G. and Ravikumar, B., 1998, Opting out of publicly provided services: A majority voting result, Social Choice and Welfare 15, 187-199.
Gradstein, M. and Justman, M., 2000, Public education, social capital and growth, European Economic Review 44, 879-890.
Gradstein, M. and Justman, M., 2002, Education, social cohesion and economic growth, American Economic Review, 1192-1204.
Gradstein, M. and Justman, M., 2005, The melting pot and school-choice, Journal of Public Economics 89, 871-896.
Greeley, A.M. and P.H. Rossi. 1966. The Education of American Catholics. Chicago:Aldine Publishing Company.
Grogger, J. and D. Neal. 2000, "Further evidence on the effects of Catholic Secondary schooling." Brookings-Wharton Papers on Urban Affairs 2000: 151-193.
Gruber, J. 2005. “Religious Market Structure, Religious Participation, and Outcomes: Is Religion Good for You?” Advances in Economic Analysis and Policy 5: Issue 1.
Hamilton, B.W. and M. Macauley. 1991. “Determinants and Consequences of the Private-Public School Choice.” Journal of Urban Economics 29: 282-294.
Hausman, J. and McFadden, D. 1984. "Specification tests for the multinomial logit model." Econometrica 52: 1219-1240.
34

Hofrenning, S.K. and B.R. Chiswick. 1999 . “A Method for Proxying a Respondent’s Religious Background: An Application to School Choice Decisions.” Journal of Human Resources 34: 193-207.
Hoxby, C. 1994."Do private schools provide competition for public schools?" NBER Working Paper Serious No. 4978.
Jepsen, C. 2003. “The Effectiveness of Catholic Primary Schooling.” Journal of Human Resources 38: 928-941.
Jones, D., Doty, S., Grammich, C., Horsch, J., Houseal, R., Lynn, M., Marcum, J., Sanchargrin K. and Taylor, R., 2000, Religious Congregations & Membership in the United States 2000, Glenmary Research Center, Nashville, Tennessee.
Lankford, H. and J. Wyckoff. 1992. “Primary and Secondary School Choice Among Public and Religious Alternatives.” Economics of Education Review 11L 317-337.
Lazear, E., 1999. “Culture and Language.” Journal of Political Economy 107: S95-S126.
Lehrer, E.L. 2004a. “Religion as a Determinant of Economic and Demographic Behavior in the United States.” Population and Development Review 30: 707-726.
Lehrer, E.L. 1999. “Religion as a Determinant of Educational Attainment: An Economic Perspective.” Social Science Research 28: 358-379.
Lehrer, E.L. 2004b. “Religiosity as a Determinant of Educational Attainment: The Case of Conservative Protestant Women in the United States.” Review of Economics of the Household 2: 203-219.
Long, J.E. and E.F. Toma. 1998. “The Determinants of Private School Attendance.” The Review of Economics and Statistics 70: 458-479.
McDonald, D. 2005. Annual Report on Catholic Elementary and Secondary Schools. Washington, D.C.: National Catholic Education Association.
McFadden, D. 1974. "Conditional logit Analysis of Qualitative choice behavior." In P. Zabramka (ed.), Frontiers in Econometrics. New York: Academic Press, 105-142.
Muller, C. and C.G. Ellison. 2001. "Religious involvement, social capital, and adolescents' academic progress: Evidence from the National Educational Longtidunal Study of 1988." Sociological Focus 34: 155-183.
Neal, D. 1997. “The Effects of Catholic Secondary Schooling on Educational Attainment.” Journal of Labor Economics 15: 98-123.
Office of Catholic Schools. 2006. Annual Report 2006. Chicago: Office of Catholic Schools.
Parce., T. and L.E. Geschwender. 1995. "Explaining southern disadvantage in verbal facility among young children." Social Forces 73: 841-874.
Rangazas, P., 1995, Vouchers and voting: An initial estimate based on the median voter model, Public Choice 82, 261-279.
35

Regnerus, M. 2000. "Shaping schooling success: Religious socialization and educational outcomes in urban public schools." Journal for the Scientific Study of Religion 39: 363-370.
Regnerus, M and G.H. Elder. 2003. "Staying on track in school: Religious influences in High- and Low- risk settings. The Journal for the Scientific Study of Religion 42: 633-649.
Sander, W. 1996. “Catholic Grade Schools and Academic Achievement.” Journal of Human Resources 31: 540-548.
Sander, W. 2005. “Catholics and Catholic Schooling.” Education Economics 13: 257- 268.
Sander, W. and A.C. Krautmann. 1995. “Catholic Schools, Dropout Rates, and Educational Attainment.” Economic Inquiry 33: 217-233.
U.S. Census Bureau. 2000. County and City Data Book. Washington, D.C.: U.S Government Printing Office.
U.S. Department of Commerce. 2006. Statistical Abstract of the United States: 2006. Washington, D.C.: U.S. Government Printing Office.
U.S. Department of Education, 2001, Private School Survey: 1999-2000, National Center for Educational Statistics, Common Core of Data, Washington, DC, US.
Waite, L.J. and E.L. Lehrer. 2003. “The Beneftis from Marriage and Religion in the United States: A Comparative Analysis.” Population and Development Review 29: 255-275.
West, E.G. and H. Palsson. 1988. “Parental School Choice of School Characteristics Estimates Using State-Wide Data.” Economic Inquiry 26: 725-740.
36

Table 1 Summary Statistics
Variable Mean Standard Deviation
Private School 12.9% 33.5 Catholic School 7.1% 25.7
Protestant School 3.1% 17.3 Non-Sectarian School 2.7% 16.2
Income 1 7.5% 26.4 Income 2 13.2% 33.8 Income 3 9.7% 29.6 Income 4 17.6% 38.1 Income 5 16.2% 36.8 Income 6 12.7% 33.3 Income 7 3.9% 19.3
Income Missing 8.3% 27.6 College Graduate 21.0% 40.8
Some College 26.3% 44.0 High School Dropout 19.9% 39.9
Age 51.7 years 15.4 African-American 17.0% 37.6
Hispanic 5.3% 22.4 Catholic 23.5% 42.4
Fundamentalist Protestant 32.8% 47.0 Other Protestant 27.6% 44.7 Other Religion 2.6% 0.16
No Religion 10.1% 30.1 Attend x Catholic 95.7 215
Attend x Fundamentalist 151.9 268 Attend x Other Protestant 107.5 221
East 19.7% 40.0 West 17.6% 38.1 North 24.8% 43.2
Central City 22.1% 41.5 Density (1000s) 0.59/square mile 0.67
Catholics 20.8% 14.4 African-Americans 13.1% 11.9
Hispanics 10.3% 11.5 N 2,447
37

Table 2 Distribution of Attendance at Religious Services by Religion
Attendance All Catholic Fundamentalist Protestant
Non-Fundamentalist Protestant
Never 18.2% 13.2% 10.6% 14.5% Less Than Once/Year
7.7% 7.7% 7.2% 7.8%
Once or Twice/Year 10.7% 13.2% 8.5% 11.2% Several Times/Year 12.4% 12.9% 11.3% 13.6%
Once/Month 7.2% 6.6% 7.7% 8.7% Two or Three Times/Month
8.9% 8.0% 9.3% 12.0%
Nearly Weekly 6.0% 4.9% 7.2% 8.1% Weekly 19.9% 29.4% 20.9% 17.3%
More Than Once/Week
9.1% 4.2% 17.2% 6.7%
All 100% 100% 100% 100%
Table 3 Distribution of Attendance at Religious Services by School Type
Attendance Catholic Protestant Public Non-sectarian Never 7.5% 7.9% 19.4% 18.2%
Less Than Once/Year 2.9% 3.9% 8.4% 3.0%
Once or Twice/Year 5.7% 5.3% 11.5% 4.5%
Several Times/Year 10.9% 14.5% 12.4% 12.1%
Once/Month 3.4% 5.3% 7.4% 13.6% Two or Three Times/Month 6.9% 7.9% 9.1% 9.1%
Nearly Weekly 8.0% 7.9% 5.8% 7.6% Weekly 43.1% 27.6% 17.8% 16.7%
More Than Once/Week 11.5% 19.7% 8.4% 15.2%
All 100% 100% 100% 100%
38
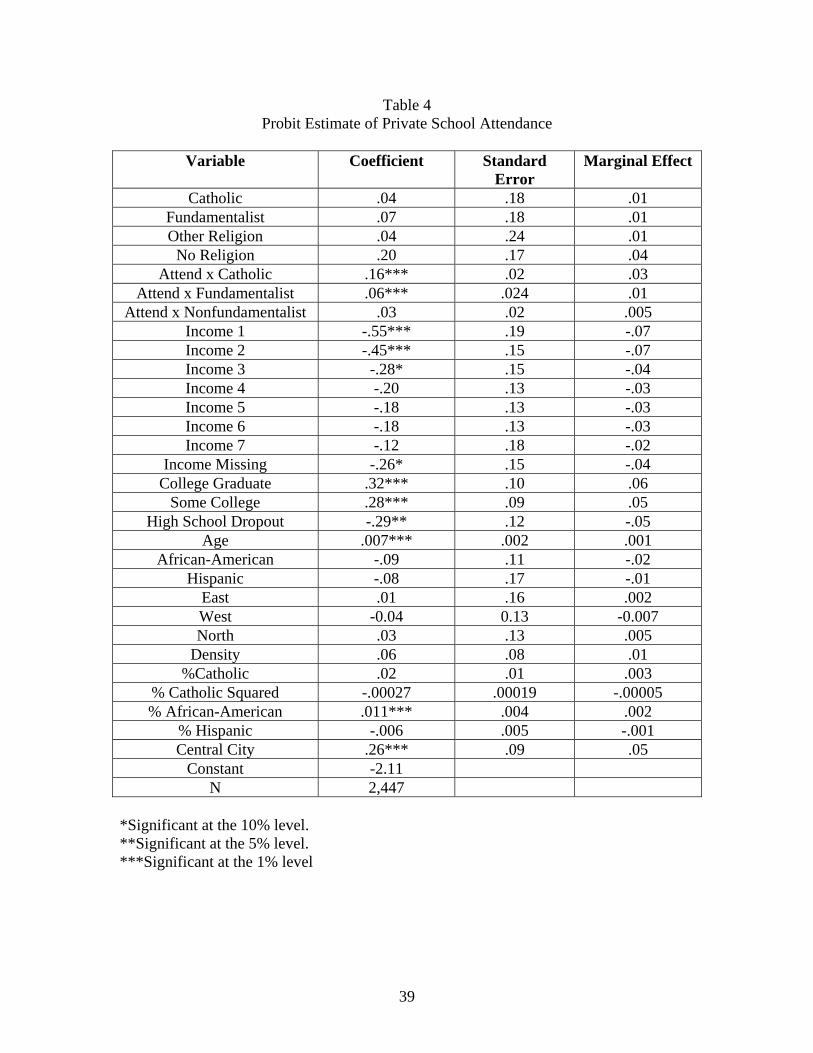
Table 4 Probit Estimate of Private School Attendance
Variable Coefficient Standard
Error Marginal Effect
Catholic .04 .18 .01 Fundamentalist .07 .18 .01 Other Religion .04 .24 .01
No Religion .20 .17 .04 Attend x Catholic .16*** .02 .03
Attend x Fundamentalist .06*** .024 .01 Attend x Nonfundamentalist .03 .02 .005
Income 1 -.55*** .19 -.07 Income 2 -.45*** .15 -.07 Income 3 -.28* .15 -.04 Income 4 -.20 .13 -.03 Income 5 -.18 .13 -.03 Income 6 -.18 .13 -.03 Income 7 -.12 .18 -.02
Income Missing -.26* .15 -.04 College Graduate .32*** .10 .06
Some College .28*** .09 .05 High School Dropout -.29** .12 -.05
Age .007*** .002 .001 African-American -.09 .11 -.02
Hispanic -.08 .17 -.01 East .01 .16 .002 West -0.04 0.13 -0.007 North .03 .13 .005
Density .06 .08 .01 %Catholic .02 .01 .003
% Catholic Squared -.00027 .00019 -.00005 % African-American .011*** .004 .002
% Hispanic -.006 .005 -.001 Central City .26*** .09 .05
Constant -2.11 N 2,447
*Significant at the 10% level. **Significant at the 5% level. ***Significant at the 1% level
39

Table 5 Multinomial Logit Estimate of Catholic, Protestant, and Non-Sectarian School
Attendance with Religiosity Catholic Protestant Non-Sectarian
Coefficient Standard Coefficient Standard Coefficient Standard Catholic .80* .46 -.79 .98 -.02 1.1
Fundamentalist -.69 .67 .38 .54 .69 .77Other Religion -.89 1.08 -0.63 1.09 1.25* 0.73
No Religion -.01 .55 -.48 .63 1.65*** .60Attend x Catholic .32*** .05 -.17 .25 .03 .18
Attend x Fundamentalist
.13 .09 .13** .06 .11 .09
Attend x Nonfundamentalist -.01 .08 .02 .09 .19** .09
Income 1 -.94* .53 -.68 .72 -2.03* 1.09Income 2 -.64* .38 -1.38** .70 -.93* .54Income 3 -.33 .39 -.52 .56 -.96* .55Income 4 -.35 .35 .06 .44 -.95** .44Income 5 .19 .32 -.44 .48 -1.21** .48Income 6 -.42 .37 .20 .44 -1.00** .43Income 7 -.08 .45 -.64 .81 -.30 .54
Income Missing -.18 .36 -.73 .70 -1.14* .59College Graduate .16 .26 .56 .35 1.43*** .38
Some College .68*** .23 .50 .32 .39 .42High School
Dropout -.81*** .33 .06 .44 -.73 .61
Age .03*** .01 -.018* .009 .01 .01African-American .77*** .29 -1.06*** .41 -.44 .43
Hispanic .03 .35 -.77 1.06 -.90 1.07West -.22 .37 -.39 .48 .49 .47East .35 .43 -.81 .72 -.35 .63
North .20 .35 .30 .40 -.70 .55Density .03 .19 .12 .34 .46 .30
%Catholic .06** .03 .06 .04 -.06 .04% Catholic
Squared -.001** .0005 -.001 .001 .0011 .0007
% African-American .011 .013 .026** .011 .028** .01
% Hispanic -.009 .01 -.003 .02 -.01 .02Central City .71*** .23 .06 .34 .55* .31
Constant -6.3 -3.5 -4.8 N 2,447
*Significant at the 10% level. **Significant at the 5% level. ***Significant at the 1% level. Note: The estimates are relative to public school attendance.
40

Table 6 Multinomial Logit Estimate of Catholic and Protestant schooling relative to Public
schooling, with and without non-sectarian schooling
With non-sectarian alternative Without non-sectarian alternative
Catholic Protestant Catholic Protestant Coeff. StD Coeff. StD Coeff. StD Coe StD
Catholic .80 .46 -.79 .98 0.80 0.46 -.79 .98 Fundamentalist -.69 .67 .38 .54 -0.70 0.67 .37 .54 Other Religion -.89 1.0 -0.63 1.09 -0.91 1.1 -0.65 1.09
No Religion -.01 .55 -.48 .63 -0.01 0.55 -.47 .63 Attend x Catholic .32 .05 -.17 .25 0.32 0.05 -.17 .25 Attend x Funda .13 .09 .13 .06 0.13 0.09 .14 .06 Attend x nfunda -.01 .08 .02 .09 -0.01 0.08 .01 .09
Income 1 -.94 .53 -.68 .72 -0.94 0.53 -.69 .72 Income 2 -.64 .38 -1.38 .70 -0.63 0.38 -1.38 .70 Income 3 -.33 .39 -.52 .56 -.34 .39 -.53 .57 Income 4 -.35 .35 .06 .44 -.36 .35 .09 .44 Income 5 .19 .32 -.44 .48 .18 .32 -.46 .48 Income 6 -.42 .37 .20 .44 -.40 .38 .21 .44 Income 7 -.08 .45 -.64 .81 -.10 .45 -.63 .81
Income Missing -.18 .36 -.73 .70 -.19 .36 -.73 .70 College Graduate .16 .26 .56 .35 .15 .26 .56 .35
Some College .68 .23 .50 .32 .67 .23 .50 .32 High School Dropout -.81 .33 .06 .44 -.82 .33 .07 .44
Age .03 .01 -.018 .009 .03 .01 -.018 .009 African-American .77 .29 -1.06 .41 .77 .29 -1.07 .41
Hispanic .03 .35 -.77 1.06 .03 .35 -.79 1.06 West -.22 .37 -.39 .48 -.20 .37 -.39 .48 East .35 .43 -.81 .72 .34 .43 -.84 .72
North .20 .35 .30 .40 .19 .35 .28 .40 Density .03 .19 .12 .34 .02 .19 .12 .34
%Catholic .06 .03 .06 .04 .06 .03 .06 .04 % Catholic Squared -.001 .00 -.001 .001 -.001 .0005 -.001 .001 % African-American .011 .01 .026 .011 .011 .013 .026 .011
% Hispanic -.009 .01 -.003 .02 -.009 .01 -.004 .02 Central City .71 .23 .06 .34 .71 .23 .07 .34
Constant -6.3 -3.5 -6.3 -3.4 N 2,447 2,447
Note: The estimates are relative to public school attendance.
41

Table 7
Marginal effects on the probabilities to attend each type of schooling for the multinomial Logit and Probit regressions
Catholic Protestant Public Non-sectarian LOGIT PROBIT LOGIT PROBIT LOGIT PROBIT LOGIT PROBIT
Catholic 3.2 3.1 -1.0 -1.1 -2.1 -1.8 -0.05 -0.2
Fundamentalist -2.0 -2.0 0.6 0.6 0.4 -0.2 1.0 1.6
Other Religion -2.0 -2.2 -0.7 -0.9 -0.3 -1.2 3.0 4.2
No Religion -0.1 -0.2 -0.7 -0.8 -3.5 -4.3 4.3 5.3*
Attend x Catholic 1.0*** 1.5*** -0.3 -0.3 -0.8* -1.3*** 0.03 0.1
Attend x Funda 0.4 0.4 0.2* 0.2* -0.7** -0.8** 0.1 0.1
Attend x nfunda -0.05 -0.09 0.02 0.00 -0.2 -0.2 0.2** 0.3**
Income 1 -2.0** -2.4** -0.8 -0.9 4.1*** 4.6*** -1.3*** -1.4***
Income 2 -1.6** -1.8 -1.3*** -1.6*** 3.7*** 4.3*** -0.8** -1.0**
Income 3 -0.9* -0.8 -0.6 -0.8 2.3** 2.6 -0.8** -1.0**
Income 4 -1.0 -1.1 0.1 0.09 1.7 2.1 -0.9** -1.1***
Income 5 0.7 0.9 -0.6 -0.8 1.0 1.1 -1.0*** -1.3***
Income 6 -1.1 -1.4 0.4 0.5 1.6 2.0 -0.9*** -1.1***
Income 7 -0.2 0.4 -0.7 -0.8 1.2 1.0 -0.3 -0.5
Income Missing -0.5* -0.2 -0.8 -1.0 2.2* 2.3 -0.9*** -1.1***
College Graduate 0.4 0.3 0.9 1.5 -4.1*** -5.2*** 2.8** 3.5***
Some College 2.4** 3.0** 0.8 1.0 -3.7*** -4.5*** 0.5 0.5
High School Dropout -2.1*** -2.8*** 0.1 0.4 2.6** 3.1** -0.7 -0.7
Age 0.1*** 0.1*** -0.03** -0.04** -0.09*** -0.09*** 0.01 0.02
African-American 3.2** 3.5** -1.2*** -1.5*** -1.5 -1.3 -0.5 -0.6
Hispanic 0.2 0.1 -0.8 -1.1 1.5 2.00. -0.8 -1.1
West -0.6 -0.6 -0.5 -0.8 0.4 0.4 0.7 -1.0
East 1.3 1.4 -1.0 -1.1 0.1 0.2 -0.4 -0.4
North 0.7 0.6 0.5 0.5 -0.4 -0.2 -0.8 -0.9
Density 0.07 0.2 0.2 -0.06 -0.8 -1.0 0.6 0.9*
%Catholic 0.2** 0.2* 0.09 0.1 -0.2* -0.3 -0.08 -0.1
% Catholic Squared -0.00** -0.00** -0.00 -0.00 0.00* 0.00* 0.00* 0.00*
% African-American 0.03 0.05 0.04** 0.05** -0.1** -0.1** 0.03** 0.04*
% Hispanic -0.03 -0.05 -0.00 -0.00 0.05 0.07 -0.02 -0.02
Central City 2.7** 3.2** 0.04 -0.03 -3.4*** -3.9** 0.8 0.8
N 2,447
*Significant at the 10% level. **Significant at the 5% level. ***Significant at the 1% level. Note: Marginal effects of multinomial probits and logits multiplied by 100.
42

Table 8 Multinomial Logit Estimate of Catholic and Protestant School Attendance without
Religiosity Catholic Protestant Non-Sectarian
Coefficient Standard Coefficient Standard Coefficient Standard
Catholic 2.43*** .26 -1.36** .64 -.70 .53Fundamentalist .06 .32 1.01*** .29 .42 .34Other Religion -0.80 1.04 -0.69 1.05 0.44 0.76
No Religion .11 .47 -.51 .57 .84** .40Income 1 -.97* .52 -.74 .72 -2.10* 1.08Income 2 -.59 .37 -1.44** .70 -.98* .54Income 3 -.35 .38 -.53 .56 -.96* .54Income 4 -.41 .34 .04 .44 -.98** .44Income 5 .18 .31 -.44 .47 -1.2** .48Income 6 -.38 .36 .23 .44 -.97** .43Income 7 -.02 .44 -.64 .81 -.27 .54Income -.003 .35 -.74 .70 -1.15* .59College
Graduate .31 .25 .65** .34 1.53*** .38
Some College .61*** .22 .53* .32 .46 .42High School
Dropout -1.08*** .32 .03 .44 -.78 .61
Age .04*** .01 -.016* .009 .013 .01African-
American .90*** .29 -0.99*** .41 -.35 .43
Hispanic .12 .34 -.70 1.1 -.79 1.1West -0.18 .36 -.42 .48 .43 .47East .40 .42 -.83 .72 -.27 .62
North .28 .34 .30 .40 -.65 .54Density -.10 .18 .09 .34 .42 .30
%Catholic .06* .03 .06 .04 -.07 .04% Catholic
Squared -.001** .0005 -.001 .001 .0013* .0007
% African-American
.012 .013 .027** .012 .028** .013
% Hispanic -.007 .01 -.002 .02 -.012 .02Central City .59*** .22 .06 .34 .55* .31
Constant -6.5 -3.6 -4.0 N 2,447
*Significant at the 10% level. **Significant at the 5% level. ***Significant at the 1% level. Note: The estimates are relative to public school attendance.
43

Table 9 Predicted Probabilities of Type of School for Catholics by Church Attendance
Attendance Catholic
School Protestant
School Non-Sectarian Private School
Public School
LOGIT PROBIT LOGIT PROBIT LOGIT PROBIT LOGIT PROBIT Never 8.4% 7.8% 3.5% 4.0% .3% 0.1% 87.8% 88.1%
Less Than Once/Year 11.3% 10.8% 2.9% 3.4% .3% 0.1% 85.5% 85.7%
Once or Twice/Year 15.0% 14.6% 2.3% 2.7% .3% 0.1% 82.4% 82.6%
Several Times/Year 19.5% 19.2% 1.9% 2.1% .3% 0.1% 78.3% 78.6%
Once/Month 25.1% 24.4% 1.5% 1.6% .3% 0.1% 73.2% 73.8% Two or Three Times/Month 31.6% 30.4% 1.2% 1.2% .2% 0.1% 67.1% 68.3%
Nearly Weekly 38.8% 36.9% .9% 0.8% .2% 0.1% 60.1% 62.2% Weekly 46.6% 43.7% .6% 0.6% .2% 0.1% 52.5% 55.7%
More Than Once/Week 54.6% 50.7% .5% 0.4% .2% 0.1% 44.8% 48.9%
Table 10 Predicted Probabilities of Type of School for Protestant Fundamentalists by Church
Attendance
Attendance Catholic School
Protestant School
Non-Sectarian Private School
Public School
LOGIT PROBIT LOGIT PROBIT LOGIT PROBIT LOGIT PROBIT Never 1.9% 2.1% 11.1% 10.0% .5% 0.4% 86.5% 87.6%
Less Than Once/Year 2.1% 2.3% 12.5% 11.1% .5% 0.4% 84.9% 86.2%
Once or Twice/Year 2.3% 2.5% 14.0% 12.4% .6% 0.5% 83.1% 84.7%
Several Times/Year 2.6% 2.7% 15.6% 13.7% .7% 0.5% 81.1% 83.1%
Once/Month 2.8% 2.9% 17.4% 15.1% .8% 0.6% 79.0% 81.5% Two or Three Times/Month 3.1% 3.1% 19.3% 16.5% .8% 0.7% 76.7% 79.7%
Nearly Weekly 3.4% 3.4% 21.4% 18.1% .9% 0.7% 74.3% 77.8% Weekly 3.8% 3.6% 23.6% 19.8% 1.0% 0.8% 71.7% 75.8%
More Than Once/Week 4.1% 3.9% 26.0% 21.5% 1.0% 0.8% 68.9% 73.8%
44

Table 11 Predicated Probability of Type of School for Black Protestant Fundamentalists by Church
Attendance
Attendance Catholic School
Protestant School
Non-Sectarian Private School
Public School
LOGIT PROBIT LOGIT PROBIT LOGIT PROBIT LOGIT PROBIT Never 4.3% 5.1% 4.1% 3.9% .4% 0.3% 91.3% 90.8%
Less Than Once/Year 4.8% 5.5% 4.6% 4.4% .4% 0.3% 90.2% 89.8%
Once or Twice/Year 5.4% 6.0% 5.2% 5.0% .4% 0.3% 89.0% 88.7%
Several Times/Year 6.0% 6.5% 5.9% 5.6% .5% 0.4% 87.6% 87.5%
Once/Month 6.7% 7.1% 6.6% 6.3% .5% 0.4% 86.2% 86.2% Two or Three Times/Month 7.5% 7.7% 7.4% 7.1% .6% 0.4% 84.6% 84.8%
Nearly Weekly 8.3% 8.3% 8.3% 7.9% .6% 0.5% 82.8% 83.3% Weekly 9.2% 8.9% 9.3% 8.8% .7% 0.5% 80.9% 81.8%
More Than Once/Week 10.1% 9.5% 10.3% 9.8% .8% 0.6% 78.8% 80.1%
45