Private Multi-Cloud Architectural Solutions for NRDC Data ...
106
University of Nevada, Reno Private Multi-Cloud Architectural Solutions for NRDC Data Streaming Services A thesis submitted in partial fulfillment of the requirements for the degree of Master of Science in Computer Science and Engineering by Xiang Li Dr. Frederick C. Harris, Jr., Co-Advisor & Dr. Sergiu Dascalu, Co-Advisor December, 2020
Transcript of Private Multi-Cloud Architectural Solutions for NRDC Data ...

University of Nevada, Reno
Private Multi-Cloud Architectural Solutions
for NRDC Data Streaming Services
A thesis submitted in partial fulfillment of therequirements for the degree of Master of Science
in Computer Science and Engineering
by
Xiang Li
Dr. Frederick C. Harris, Jr., Co-Advisor&
Dr. Sergiu Dascalu, Co-Advisor
December, 2020
c© by Xiang LiAll Rights Reserved

THE GRADUATE SCHOOL
We recommend that the thesis
prepared under our supervision by
Xiang Li
Entitled
Private Multi-Cloud Architectural Solutions for NRDC Data Streaming Services
be accepted in partial fulfillment of the requirements
for the degree of
MASTER OF SCIENCE
Dr. Frederick C. Harris, Jr., Co-Advisor
Dr. Sergiu M. Dascalu, Co-Advisor
Dr. Scotty Strachan, Graduate School Representative
David W. Zeh, Ph.D., Dean, Graduate School
December, 2020

i
Abstract
Cloud computing has experienced huge growth in both commercial and research
applications in recent years. In order to maximize computing efficiency, virtual ma-
chines are collocated on the same processors. In this research, OpenStack was studied
as a potential platform to migrate the aging Nevada Research Data Center infrastruc-
ture that was built on Microsoft Server 2012. This data center hosted virtual machines
that ingested data from remote towers and made the data available to environmental
researchers through a web portal. The NRDC ultimately had a storage failure and
a temporary hybrid infrastructure was set up to prevent data loss. Comparisons of
the visual management interfaces, licensing cost, and license type were made between
OpenStack and Windows Server. The Windows Server virtualization interface was
susceptible to information overload and lacked the security features included with
the OpenStack interface. Performance comparisons were done on instance launching
and deletion for the OpenStack test cluster to study the effects image and instance
resources. There were differences found for real and sys timings for launch timings us-
ing the OpenStack Command line interface (CLI). However, no differences were found
between the two instance types when launched or deleted using the Python applica-
tion programming interface (API). These timings could have possibly been skewed
by several outliers. Performance differences between the CLI and Python API was
also tested. The Python API performed better than the CLI for real, sys, and user
API call timings, but worse for the backend spawn, build, delete on hypervisor, and
deallocation of network resources timings.

ii
Dedication
I dedicate this thesis to Ashley for her love and support when I needed it most.
To my parents, whose sacrifices enabled all the opportunities I’ve had in life.
To my friends and colleagues for providing me with constant encouragement and
much needed distraction.

iii
Acknowledgments
I would like to thank my committee Dr. Harris, Dr. Dascalu, and Dr. Strachan
for their invaluable guidance and encouragement through the long and certainly never
easy journey that was my graduate studies. They pushed me to accomplish things I
never thought I could and for that I am eternally grateful. I also want to thank Chase
Carthen, Ajani Burgos, and Jake Wheeler for putting in the hard work of setting up
and modifying the test hardware whenever I asked.
This material is based in part upon work supported by the National Science
Foundation under grant number(s) IA-1301726. Any opinions, findings, and conclu-
sions or recommendations expressed in this material are those of the author(s) and
do not necessarily reflect the views of the National Science Foundation.

iv
Contents
Abstract i
Dedication ii
Acknowledgments iii
List of Tables vi
List of Figures vii
1 Introduction 11.1 Introduction . . . . . . . . . . . . . . . . . . . . . . . . . . . . . . . . 11.2 Problem Outline . . . . . . . . . . . . . . . . . . . . . . . . . . . . . 31.3 Solution Outline . . . . . . . . . . . . . . . . . . . . . . . . . . . . . . 4
2 Background 7
2.1 Nevada Research Data Center . . . . . . . . . . . . . . . . . . . . . . 72.2 Hypervisors and Hardware Virtualization . . . . . . . . . . . . . . . . 9
2.3 Cloud Computing . . . . . . . . . . . . . . . . . . . . . . . . . . . . . 11
2.3.1 Introduction . . . . . . . . . . . . . . . . . . . . . . . . . . . . 112.3.2 Cloud Deployment Models . . . . . . . . . . . . . . . . . . . . 12
2.4 OpenStack Approach . . . . . . . . . . . . . . . . . . . . . . . . . . . 13
2.4.1 OpenStack Distributed Architecture . . . . . . . . . . . . . . . 14
2.4.2 Identity . . . . . . . . . . . . . . . . . . . . . . . . . . . . . . 16
2.4.3 Networking . . . . . . . . . . . . . . . . . . . . . . . . . . . . 16
2.4.4 Compute . . . . . . . . . . . . . . . . . . . . . . . . . . . . . . 17
2.4.5 Storage . . . . . . . . . . . . . . . . . . . . . . . . . . . . . . 21
2.4.6 Image . . . . . . . . . . . . . . . . . . . . . . . . . . . . . . . 22
2.4.7 Web Dashboard . . . . . . . . . . . . . . . . . . . . . . . . . . 242.5 Other Technologies . . . . . . . . . . . . . . . . . . . . . . . . . . . . 25
2.5.1 Ansible . . . . . . . . . . . . . . . . . . . . . . . . . . . . . . 252.5.2 Terraform . . . . . . . . . . . . . . . . . . . . . . . . . . . . . 262.5.3 Globus Data Transfer . . . . . . . . . . . . . . . . . . . . . . . 272.5.4 RAID . . . . . . . . . . . . . . . . . . . . . . . . . . . . . . . 282.5.5 Ceph . . . . . . . . . . . . . . . . . . . . . . . . . . . . . . . . 29

v
2.5.6 Vagrant . . . . . . . . . . . . . . . . . . . . . . . . . . . . . . 31
3 Related Work 32
4 NRDC Streaming Data Services 40
4.1 Hardware . . . . . . . . . . . . . . . . . . . . . . . . . . . . . . . . . 404.2 Software . . . . . . . . . . . . . . . . . . . . . . . . . . . . . . . . . . 424.3 Virtual Architecture . . . . . . . . . . . . . . . . . . . . . . . . . . . 434.4 Network . . . . . . . . . . . . . . . . . . . . . . . . . . . . . . . . . . 46
5 Setting Up OpenStack Infrastructure 47
5.1 Hardware . . . . . . . . . . . . . . . . . . . . . . . . . . . . . . . . . 475.2 Software . . . . . . . . . . . . . . . . . . . . . . . . . . . . . . . . . . 475.3 Deploying OpenStack . . . . . . . . . . . . . . . . . . . . . . . . . . . 49
5.4 Installing a service . . . . . . . . . . . . . . . . . . . . . . . . . . . . 50
5.5 Horizon Dashboard . . . . . . . . . . . . . . . . . . . . . . . . . . . . 515.6 Keystone . . . . . . . . . . . . . . . . . . . . . . . . . . . . . . . . . . 52
5.7 Glance . . . . . . . . . . . . . . . . . . . . . . . . . . . . . . . . . . . 535.8 Compute . . . . . . . . . . . . . . . . . . . . . . . . . . . . . . . . . . 55
5.9 Networking . . . . . . . . . . . . . . . . . . . . . . . . . . . . . . . . 57
5.10 Storage . . . . . . . . . . . . . . . . . . . . . . . . . . . . . . . . . . . 59
5.11 Terraform . . . . . . . . . . . . . . . . . . . . . . . . . . . . . . . . . 61
6 Setting Up Hybrid Infrastructure 63
6.1 Transfer of Old Data . . . . . . . . . . . . . . . . . . . . . . . . . . . 636.2 Hardware . . . . . . . . . . . . . . . . . . . . . . . . . . . . . . . . . 636.3 Software . . . . . . . . . . . . . . . . . . . . . . . . . . . . . . . . . . 64
7 Comparison of Approaches 66
7.1 Interface Comparison . . . . . . . . . . . . . . . . . . . . . . . . . . . 66
7.2 Timing Comparisons . . . . . . . . . . . . . . . . . . . . . . . . . . . 67
7.2.1 Performance analysis of OpenStack CLI versus The Python In-terface . . . . . . . . . . . . . . . . . . . . . . . . . . . . . . . 70
7.2.2 Effects of image resources on performance . . . . . . . . . . . 72
7.3 Storage Backend Comparison . . . . . . . . . . . . . . . . . . . . . . 79
7.4 Other Considerations . . . . . . . . . . . . . . . . . . . . . . . . . . . 80
8 Conclusions and Future Work 818.1 Conclusions . . . . . . . . . . . . . . . . . . . . . . . . . . . . . . . . 818.2 Future Work . . . . . . . . . . . . . . . . . . . . . . . . . . . . . . . . 84
References 86
vi
List of Tables
7.1 The two flavors used for testing. One used for CirrOS image and onefor the Windows 10 image. . . . . . . . . . . . . . . . . . . . . . . . . 70
7.2 T-test results for OpenStack CLI versus Python interface for instancelaunching. Top table corresponds to t-statistics and p-values for theCirrOS image and flavor. Bottom table represents the Windows 10image and flavor. Real, User, and Sys time correspond to the APIcall, while Spawn and Build time correspond to the background Open-Stack processes. CPU time is the total time the CPU spent executingthe launch command and is the result of user plus sys time. the P-values <0.05 are deemed to be statistically significant differences. . . 72
7.3 T-test results for OpenStack CLI versus Python interface for instancedeletion. Top table corresponds to t-statistics and p-values for the Cir-rOS image and flavor. Bottom table represents the Windows 10 imageand flavor. As opposed to Spawn and Build times, for deletion, thereare Hypervisor for deletion on hypervisor and Network for networkresource deallocation timings. . . . . . . . . . . . . . . . . . . . . . . 73
7.4 T-test results for instance launching times. The top table is timingsfrom the CLI version and the bottom table is for the Python ver-sion. The independent variable is the type of instance launched: thelightweight CirrOS versus the heavier Windows 10 instance. Real,User, and Sys time correspond to the API call, while Spawn and Buildtime correspond to the background OpenStack processes. CPU timeis the total time the CPU spent executing the launch command and isthe result of user plus sys time. the P-values <0.05 are deemed to bestatistically significant differences. . . . . . . . . . . . . . . . . . . . . 76
7.5 T-test results from launch timings of Windows 10 instance with 2 GBof RAM vs. Windows 10 instance with 8 GB of RAM. The top tablewas from using the CLI and the bottom table was from launches usingthe Python API. . . . . . . . . . . . . . . . . . . . . . . . . . . . . . 78
7.6 T-test results from deletion timings of Windows 10 instance with 2 GBof RAM vs. Windows 10 instance with 8 GB of RAM. The top tablewas from using the CLI and the bottom table was from deletions usingthe Python API. . . . . . . . . . . . . . . . . . . . . . . . . . . . . . 78
7.7 T-test results for instance deletion times. The independent variable isthe type of instance launched: the lightweight CirrOS versus the heav-ier Windows 10 instance. P-values <0.05 are deemed to be statisticallysignificant differences. . . . . . . . . . . . . . . . . . . . . . . . . . . . 78

vii
List of Figures
1.1 Multiple users with room sized ENIAC [8] . . . . . . . . . . . . . . . 2
1.2 Modern server racks where each one is many times more powerful thanENIAC [22] . . . . . . . . . . . . . . . . . . . . . . . . . . . . . . . . 2
2.1 Environmental sensor station out in Snake Range. Major componentsare labeled. Photo taken by Scotty Strachan [67]. . . . . . . . . . . . 8
2.2 Data flow from the site sensors through the NSL network on to theNRDC servers which is then accessed by researchers through NRDC-DataNet . . . . . . . . . . . . . . . . . . . . . . . . . . . . . . . . . . 9
2.3 A typical OpenStack four node architecture consisting of a controllernode, network node, compute node, and storage node. Services residingon each node are shown. The required networking interfaces to providemanagement and instance traffic are shown as well [58]. . . . . . . . . 15
2.4 In the provider network Neutron architecture, OpenStack networksconnect directly to physical networking infrastructure and utilizes itsolely for all communication between nodes, VMs, and the internet. [90] 18
2.5 The self-service network Neutron architecture uses VXLAN, or otheroverlay protocols to create virtual networks on top of the physical net-working infrastructure. Communication can be done on either thephysical external network or the overlay network. [91] . . . . . . . . . 19
2.6 Different types of OpenStack storage. The first column describes ephem-eral storage, while the other columns represent the three types of persis-tent storage that can be used with OpenStack. Rows represent variouscomparisons between the different storage types including how eachstorage is accessed, their function, and typical usage [94]. . . . . . . . 23
2.7 The Instance View of the Horizon web interface showing the instancesfor the current user. A drop down menu on the right under Actionsallows the user to perform adminstration tasks on each instance suchas shutting down or restarting the instance. The menu on the left sideallow the user to navigate between different views such as network andimage. . . . . . . . . . . . . . . . . . . . . . . . . . . . . . . . . . . . 25
2.8 RAID 60 consist of multiple RAID 6 arrays (2 depicted in this figure)nested within a RAID 0 configuration. [63] . . . . . . . . . . . . . . . 29

viii
2.9 From top to bottom, the clients can interact with storage from Cephvia the RBD for block storage, RADOS GW for object storage, orCephFS for file storage. The librados layer provides an interface forRADOS and the other services (including RBD, RADOS GW, andCephFS). The RADOS layer is the foundation performs managementtasks on the OSDs, monitors (MON), and metadata server (MDS) inthe case of CephFS [29]. . . . . . . . . . . . . . . . . . . . . . . . . . 31
3.1 Total migration time in seconds as a function of increasing memorytransfer rounds for 3 VMs. There are diminishing returns with in-creasing rounds. Only a few transfer rounds are required. [16] . . . . 33
3.2 Table showing performance comparisons of three virtualization plat-forms: Ubuntu Enterprise Cloud (UEC), Xen Cloud Platform (XCP),and Proxmox Virtual Environment (PVE). Common benchmarks, iden-tified in the third column, were used to test various functionality.Thumbs up in the last 3 columns means the platform performed thebest, a thumbs down means the platform ranked the worst out of thethree, and blank space represents the platform performed in the middle[50]. . . . . . . . . . . . . . . . . . . . . . . . . . . . . . . . . . . . . 36
3.3 Graph of average deployment time of virtual machine comparison be-tween OpenStack and CloudStack with varying hard disk sizes. [54]. . 38
4.1 The physical hardware of the NRDC. Hardware consists of four com-pute servers, labeled Virtual1-1 to Virtual 1-4. A storage server, aninfiniBand switch, and two routers. . . . . . . . . . . . . . . . . . . . 41
4.2 Hyper-V manager allows the user to select any physical server in thecluster. VMs can be connected to from here as well. . . . . . . . . . . 43
4.3 A Diagram of the core VMs in the NRDC virtual infrastructure orga-nized by host virtual server. Not all servers are represented. . . . . . 45
5.1 The log in page for the Horizon dashboard. This is the page thatHorizon presents once the dashboard address is entered into a webbrowser. . . . . . . . . . . . . . . . . . . . . . . . . . . . . . . . . . . 52
5.2 An example of a client environmental script used for identity authen-tication through Keystone. Instead of having to type this informationevery time the OpenStack CLI is used, the user simply has to run thefile name before launching the CLI. In addition to a username andpassword combination, the script must include project and domain toenable multi-tenant cloud infrastructure. . . . . . . . . . . . . . . . . 53
5.3 Usage chart of resources available on the OpenStack infrastructure dis-played as pie charts. Usage is shown for compute, volume (storage),and network resources. . . . . . . . . . . . . . . . . . . . . . . . . . . 56
5.4 The network topology as shown in Horizon web dashboard. The exter-nal provider network is connected to the internal self service networkthrough a virtual router. Five VMs are attached to the self servicenetwork. . . . . . . . . . . . . . . . . . . . . . . . . . . . . . . . . . . 59
5.5 An OpenStack Nova flavor declared in TCL. Infrastructure componentsare declared in a resource block with a variety of parameters specificto each resource. This allows administrators to have a high level viewof the infrastructure in one location and make modifications as neededdirectly to the TCL files. . . . . . . . . . . . . . . . . . . . . . . . . . 62

ix
7.1 The main interface of the Windows Hyper-V Manager from which it ispossible to perform administrative tasks on the virtual infrastructure [57] 68
7.2 The main page for the Horizon web interface showing an virtual re-source usage. The menu on the left hand side organizes the differenceOpenStack services. . . . . . . . . . . . . . . . . . . . . . . . . . . . . 68
7.3 Left: VM state showing the instance is being built. Right: VM stateshowing the instance is active. The user is able to perform other tasksthrough the CLI while the VM is still being built, but the instance isnot ready to use yet. . . . . . . . . . . . . . . . . . . . . . . . . . . . 69
7.4 Bar graph of the means of CLI vs. Python for all launch timings. Thelines protruding from the bars are the standard deviations. The CLIperformed faster in the API call timings, but worse for the backendspawn and build timings. . . . . . . . . . . . . . . . . . . . . . . . . . 73
7.5 Bar graph of the means of CLI vs. Python for instance deletion timings.Much like the launch timings, the CLI performed better for API calls,but worse for the backend delete on hypervisor and delete on network. 74
7.6 Violin plots of instance launch timings using the CLI comparing CirrOSand Windows 10 instances. . . . . . . . . . . . . . . . . . . . . . . . . 76
7.7 Strip plots of instance launch timings using the CLI comparing CirrOSand Windows 10 instances. Most timings had significant overlapping. 77

1
Chapter 1
Introduction
1.1 Introduction
The field of computer science has a cyclical nature. In it’s infancy, not only the
exorbitant monetary cost of building a computer, but even space required proved
prohibitive for the conception of ubiquitous use of personal computers. ENIAC (Elec-
tronic Numerical Integrator and Computer), the first general purpose computer, oc-
cupied 135m2 (1, 500ft2) of space using 40 cabinets that were each 2.4 meters (8 feet)
tall [26]! Due to these constraints, early mainframe computers were designed to reside
in a central location and be used by numerous users serviced by dedicated operators
and programmers (Figure 1.1) [12]. However, access was congested by other users’
jobs as limited processing capabilities could not match demand. As silicon manufac-
turing improved, computer hardware became cheap, powerful commodity, and thus
computing became more distributed. Especially with the rise of the personal com-
puter(PC), the computing market shifted to favor a one to one ratio between users
and computers. Most recently, portable devices such as laptops, smart cellphones,
and tablets have become preferred. Consumers today typically own more than one
device. With the ever increasing ratio of computers to users, coupled with powerful
hardware, efficiency starts to becomes a problem. Most computers are underutilized.
While this may not be a big deal for the individual user, in data centers and other
large computing server farms, the under utilization adds up to dramatic waste of
resources (Figure 1.2).

2
Figure 1.1: Multiple users with room sized ENIAC [8]
Figure 1.2: Modern server racks where each one is many times more powerful thanENIAC [22]

3
Virtualization of hardware arose as a solution to this problem. With virtualiza-
tion, multiple virtual machines (VMs) can be run on top of a single physical ma-
chine. This led to better utilization of processors and other hardware and less dead
time [101]. Virtualization has enabled what we now call cloud computing. It has
become economically practical to combine workloads and return to centralized com-
puting. As of this writing, the computing paradigm has reverted back to centralized
computing, especially in high performance computing applications [103]. According
to RightScale, 94% of respondents used some form of cloud computing in their en-
terprise [62]. Cloud computing has become a huge multibillion dollar industry with
some of the biggest software companies: Apple, Microsoft, Google, and Amazon hav-
ing major stakes. An added beneficial consequence to this model is the reduction in
maintenance cost of infrastructure. Virtualization means multiple departments can
share the same servers and no longer have to hire separate administration personnel.
One IT department can handle computing resources for the whole company. Mod-
ern infrastructure deployment automation tools have further reduced the need for
administrative staff and thus made cloud computing more practical and accessible.
While cloud computing may seem attractive for all applications, it is not without
drawbacks. One problem is the sharing of cache between VMs residing on the same
physical processor which can cause contention. High CPU utilization may seem more
efficient on the surface, however, there are hidden costs associated with increased
degradation. CPUs could have higher failure rates and need to be replaced more
frequently. Even with power considerations, there is only so much energy usage
that can be saved through consolidation of VMs. There is a saturation point when
execution starts to slow down and more power may be required due to increased usage
time. These problems are further discussed in a survey by Zoltan Adam Mann [43].
1.2 Problem Outline
The Nevada Research Data Center (NRDC) is described in Chapter 2. The primary
motivation for this work began due to the age of the infrastructure’s hardware com-

4
ponents. Specifically, the spinning hard disks were getting old and the inevitable
failure of the disks was imminent. In addition, the rapid pace at which software be-
comes obsolete led us to consider infrastructure updates using modern technologies.
The NRDC data streaming infrastructure was most recently updated in 2012. Al-
though it has only been eight years, many of the administrative methods have become
obsolete in favor of easier and better methods. The NRDC previous infrastructure
utilized several VMs running on separate physical systems. This does not have the
advantage of cloud operating systems such as OpenStack which was just created when
NRDC services were being built. OpenStack virtualizes all physical compute nodes
together so that VM migration is much simpler. Administration for Windows Server
involves using the remote desktop client software to connect to each physical node as
needed. This type of administration does not scale well with increasing number of
physical nodes. Tracking down problems to one virtual machine can take inconvenient
amounts of time. OpenStack, on the other hand, enables servicing the infrastructure
as a whole through a convenient web interface hosted on a controller node by default.
Some of the NRDC services had not been working for awhile and it was difficult to
track down the root cause. We also preferred to use Linux based systems, and most
students learned on Linux, which made administration tasks unfamiliar for most of
the student administrators. Although storage was implemented as a RAID array, new
technologies in software storage systems such as Ceph, which is discussed in Chap-
ter 2, are more fail-safe than RAID systems [29]. Finally, towards the end of the
OpenStack development we describe, the physical disks in the old system failed and
some data capture functions were no longer working. This prompted the development
of a quick parsimonious fix.
1.3 Solution Outline
Our proposed solution is to leverage new cloud technologies, specifically the Open-
Stack framework, and other supporting technologies. We planned to migrate NRDC
streaming services onto the OpenStack platform. OpenStack is an open source solu-

5
tion that provides a cloud operating system for hardware virtualization. OpenStack is
vendor agnostic and highly modular. These qualities make OpenStack very adaptable
and ideal for our application. OpenStack supports Windows images and VMs, so cur-
rent VMs should be able to be migrated over without large modifications. OpenStack
has virtualized networking so that network layout can also be migrated over. In addi-
tion, OpenStack is widely used and developed, over 100 developers for the Keystone
module alone, so support is easy to locate and plentiful [19]. The documentation is
also very well written. Management can be performed via a web interface that is
accessible from anywhere on the network behind our campus firewall, so there is no
security risk of having users SSH or, in the case of the current NRDC, using remote
desktop protocol (RDP) to connect directly with infrastructure nodes. The interface
is more intuitive in OpenStack. OpenStack also enables using such technologies as
software defined storage and software defined networking (SDN) [101].
Open source is attractive because there are no licensing fees and plenty of third
party support for integration with other tools. One of the biggest problems of the
old infrastructure was that since the infrastructure architect no longer worked for
the university, there were holes in the knowledge of how the system was built and
operated. The infrastructure has been maintained by graduate students since the
architects departure. Graduate students are not permanent positions, so it takes a
great deal of effort to keep training new administrators each time one graduates. The
new system must be one that is relatively easy to learn. This was key in the decision to
use Terraform since the infrastructure is then described in code using an easy to read
configuration language. Provisioning of resources is handled automatically by the
Terraform backend, unlike Ansible where one must also determine how infrastructure
is realized [9]. In order to make changes, the administrator just has to change the
values corresponding to changes instead of manually deleting and re-configuring it.
This is ideal for this application as a new administrator should be able to read the
configuration code files to learn the architecture. Also this paradigm enables version
control which is useful for research purposes requiring frequent changes. This was not

6
possible in the Windows architecture; diagrams had to be hand-made to describe the
architecture.
However, due to hardware failure before the OpenStack infrastructure was com-
plete, we had to quickly switch to a different method. This is the hybrid approach
using various virtualization technologies hosted on the University private cloud. Due
to storage failure, one of the main tasks was transferring the data into the new hard-
ware. Data was around 30 Terabytes (TB). Data was sent over a Grid File transfer
protocol (GridFTP) service, specifically, Globus. Globus has a intuitive web inter-
face to perform all management actions including starting transfers and monitoring
transfers. There were some issues with maintaining connectivity, possibly due to fail-
ing networking components in the old hardware, that made the process slower than
expected. A temporary cluster composed of bare metal compute and storage server
was constructed to prevent data loss.
The rest of this thesis is structured as follows: Chapter 2 provides background
knowledge integral to understanding the material of this work. It includes a primer
on cloud computing, the OpenStack framework, as well as other software technolo-
gies used. An exploration and evaluation of similar works related to infrastructure
setup for modern streaming data services is located in Chapter 3. Next the outgoing
infrastructure is described in Chapter 4. This is followed by the description of con-
structing the OpenStack infrastructure in Chapter 5. Chapter 6 details the hybrid
infrastructure that was ultimately implemented due to hardware failures. Then, a
comparison of all three approaches is made in Chapter 7. Finally Conclusions as well
as Future Work are contained in Chapter 8.

7
Chapter 2
Background
2.1 Nevada Research Data Center
The Nevada Research Data Center (NRDC) handles scientific data streaming from a
variety of projects and is administered by The Cyber Infrastructure Lab. The mis-
sion is to provide multidisciplinary scientists all over the world with easily accessible
environmental data. This data is vital for climate research as well as other geological
research projects. Stations, like the one in Figure 2.1, are spread out all over remote
sections of Nevada. Data is captured using the data logger software suite LoggerNet
created by Campbell Scientific [65] and streamed via a radio based IP network run by
the Nevada Seismological Laboratory (NSL) [51] onto hosted servers which make the
backbone of the NRDC infrastructure. Figure 2.2 shows the flow of communication
from the sensor site ultimately to the end user. LoggerNet is installed on both the
embedded computer at the stations as well as VMs in the servers. These sensors cap-
ture data such as relative humidity, solar radiation, barometric pressure, temperature,
wind, among other measurements. Sensor measurements are taken with frequencies
from every day to every 10 minutes. In addition to these measurements, there are
also webcams capturing images as well as providing live streams in several sensor
locations. This amounts to a large amount of data being transmitted to the NRDC
servers. It is integral that infrastructure is able to handle this amount of traffic and
be able to scale with the addition of new sensor stations.
The NRDC also provides vital services in transporting, aggregating, and dissem-

8
Figure 2.1: Environmental sensor station out in Snake Range. Major components arelabeled. Photo taken by Scotty Strachan [67].

9
Figure 2.2: Data flow from the site sensors through the NSL network on to the NRDCservers which is then accessed by researchers through NRDCDataNet
inating these raw data sets from LoggerNet. Quality control, data management, and
visualization are non trivial tasks that must be performed for ease of analysis by re-
searchers. There has been recent work done in this field for the NRDC data by other
researchers [67, 48, 49]. Data is actively being used in various research projects across
Nevada. These include the NV Solar Nexus Project which aims to study the impacts
of solar energy generation on the environment, the economy, and water resources [52].
The Walker Basin Project which aims to understand the effects of drought and cli-
mate variability on the geography to assist policy decisions [71]. Other projects not
listed here can be found on the NRDC website under the projects tab [100].
Data is accessible to researchers through a web portal which can be found by nav-
igating from the main NRDC web page [99]. Researchers are able to search through
archived videos organized by sensor name and location. In addition, there is an in-
teractive map based search for webcam images as well as for the other numerical
data.
2.2 Hypervisors and Hardware Virtualization
Virtualization is the underlying technology that enables the methods described in
this work. Fundamentally, virtualization is the abstraction of physical hardware into
virtual versions [101]. This technique can be used on all hardware including storage
disks, networking components, memory, and CPUs. Hardware can be used much
10
more efficiently as multiple VMs are able to share hardware resources as described
in Chapter 1. Through virtualization OpenStack is able to implement such features
as live migration, which involves migrating VMs to other hosts in order to service
hardware without downtime. Network virtualization enables the software defined
networking (SDN) paradigm.
The need for hardware virtualization arose from the needs of virtual machine
platform developers; they found difficulty in implementing software virtualization
without significant overhead [61]. AMD and Intel independently resolved this issue
for the x86 processor architecture and released AMD-v and Virtualization Technol-
ogy (VT-x) respectively. Only Intel VT-x will be discussed in this paper because
Intel Xeon CPUs were used throughout this project. VT-x consists of a set of virtual
machine extensions (VMX) that aid in processor hardware virtualization for multiple
VMs [20]. Transitions between the virtual machine monitor and guest OS is handled
through VMX for performance gains over the use of complex software transitions.
Flex priority is a processor extension that improves interrupt handling by eliminating
most VM exists due to gest task priority registers access which reduces overhead and
improves I/O throughput [61]. Intel also supports live migration with VT FlexMi-
gration technology that enables building virtualization pools to facilitate migrations
across all Intel servers with compatible processors. VT-x also uses virtual processor
IDs (VPID) to associate a VM ID with cache lines in the CPU hardware. This allows
the CPU to selectively flush VM cache lines and avoid the need to reload cache lines
for VMs that were not migrated. A feature called Real Mode allows guests to operate
without the overhead and complexity of an emulator. Uses include guest boot and re-
sume. For memory performance, Intel implemented the Extended Page Table which
is a separate set of page tables specifically used by guest operating systems, thus
eliminating page-table virtualization. For direct access of hardware resources such as
video cards, there is Intel VT for directed I/O (VT-d); VMs have the option to use
virtual hardware or direct pass through. This is not an exhaustive list of features
implemented in Intel VT. All VT features discussed previously as well as others can

11
be found in an Intel white paper written by Marco Righini [20].
Running in the layer above the hardware is the hypervisor or virtual machine
monitor. The hypervisor encapsulates the operating system of virtual systems and
provides the same input, output, and behavior as that of physical hardware [56].
Physical resources are decoupled from logical states. This abstraction allows multi-
ple VMs, optionally with different operating systems, to run simultaneously on one
physical machine. VMs access all hardware resources through the hypervisor. From
the perspective of the VM OS, virtual resources are treated as real physical resources.
Therefore VMs do not need specialized operating systems to run on top of a hyper-
visor.
2.3 Cloud Computing
2.3.1 Introduction
According to the National Institute of Standard and Technology (NIST), Cloud com-
puting is a paradigm that enables ubiquitous, on-demand network access to a shared
pool of computing resources such as networking, servers, storage, applications, and
services [45]. This paradigm is focused on distributed computing and abstraction of
physical resources. Most computer users only exploit a fraction of available processing
power at any given time, especially as computers get more and more powerful. There-
fore it makes sense to consolidate users and tasks onto the same physical hardware
in order to get higher utilization efficiency. Each physical server is able to effectively
act as multiple virtual servers. This multiplication of available computing resources
enables customers to scale up or down their computing resources based on their needs
in real time [11]. Elastic computing means that clients do not need to buy hardware
based on peak needs, they simply pay their cloud provider for the resources when
they need it and scale back down when they don’t. Companies are able to spend less
on capital costs of setting up cloud infrastructure as well as maintenance costs such
as electricity.

12
Nowadays, many organizations chose to make their own cloud system or use
one of the many cloud providers such as Google, Amazon, and Microsoft. Some
advantages of this paradigm include processing cost reduction, energy savings, lower
carbon emissions, and less IT resources required. For most users cloud computing
abstracts the physical resources away from software services. There are three main
subdivisions of abstraction; Infrastructure as a service (IaaS), platform as a service
(PaaS), and software as a service (SaaS). IaaS is the most basic level of services
offered. This includes VMs, load balances, block storage, firewalls and networking
services [38]. The next layer of abstraction, PaaS, a computing platform is built
on top of infrastructure offering APIs, operating systems, development environments,
program execution environments, and web servers. As opposed to IaaS, PaaS users do
not control or administer VMs, storage systems, or networks [44]. In the highest level,
SaaS providers only allow users to install and operate application software. Google
Docs is an example of this type of product. With each layer beginning with IaaS,
followed by PaaS, and finally SaaS, the administration overhead is lowered, while
ease of use is increased. This comes at the cost of decreased flexibility and control
for the customer. There is no single best scheme for every application so a careful
analysis must be performed of each different abstraction model to find one that suits
a customer’s needs.
2.3.2 Cloud Deployment Models
Cloud computing deployments can be classified into four different architectures. These
classifications are public, community, private, and hybrid clouds [37]. A private cloud
is provisioned by a single entity who controls all aspects of their cloud system [45].
This is the most flexible deployment model since the organization has full control over
hardware, architecture, and users. On the other end of the spectrum, public cloud
infrastructure are provisioned for use by the general public by a cloud provider [45].
Users are limited by the hardware of the provider and are subject to interference from
other users which can cause performance issues [69]. Community cloud deployments

13
are in between private and public. They are used exclusively by multiple organiza-
tions with a shared concern [45]. For example, as a collaboration between different
universities [70]. As its name implies, hybrid clouds have features of two or more
of the deployments described previously. These infrastructures may exist as unique
entities but are controlled by a single technology such as OpenStack, so that appli-
cations can work seamlessly across clouds [45]. One particular use case for such a
deployment would be for handling bursts of usage. A cloud consumer would be able
to offload computing work to a public cloud provider to prevent loss of service from
their own private infrastructure. This is more economical than purchasing additional
servers that would otherwise be underutilized during the majority of operation time.
2.4 OpenStack Approach
OpenStack is an open source cloud computing framework developed jointly by NASA
and Rackspace. It is often referred to as a cloud operating system providing an all
in one solution for IaaS deployments [29]. OpenStack is a modular system composed
of a collection of several distinct modules; each performing their own function. Open
source is ideal for university applications as there are no software licensing costs,
which can be in the thousands for enterprise level software. The OpenStack Founda-
tion provides very detailed documentation and enables other developers to contribute
via an API for all their products. From this collaboration, there have been many
open source tools developed that work with OpenStack such as Ansible and Ceph.
These software are discussed later in this section. OpenStack provides an abstraction
layer for all hardware and software thus being vendor agnostic, thus giving superior
portability [69]. Developers utilize the OpenStack API layer to create software that
works with OpenStack. This design decision simplifies development for both the ven-
dors and OpenStack. Each entity can develop their products independently. Users
are free to choose from a number of vendors and are able to switch between different
ones at any time without having to redesign their infrastructure architecture. User
interaction can be accomplished through a command line interface (CLI), the pro-

14
gramming API, or a web interface. OpenStack is installed on top of a linux operating
system.
OpenStack has several main services that are required for every deployment.
These are identity, image, compute, network, and placement. Each service is handled
by a seperate module. Module descriptions are discussed in the following sections.
Additional components used in this infrastructure are Cinder for storage and Horizon
which provides a web based management dashboard. Modules utilize a database back-
end to store information [93]. Configuration is stored in text files on corresponding
physical nodes. Although it is possible to install all services on one physical node for
testing, such as is used for devstack [98], typically a production deployment includes
at least one controller node and one compute node. Optional nodes for networking
and storage are recommended.
Users are confined by separate projects, which is a subdivision for resources such
as networking and compute [77]. Each project is unable to see the resources or usage
of other projects, with the exception of the administrator role. Using the popular
hotel metaphor, OpenStack is a hotel of resources and projects can likened to the
tenants of the hotel [10]. Like towels and sheets, each tenant has their own and do
not share with tenants in other rooms.
2.4.1 OpenStack Distributed Architecture
There are two models of distributed computing that operate on the opposite ends of
the spectrum; mesh and hub-and-spoke. Data and control are distributed on the node
level without a central authority in the mesh model. Concurrency is difficult in this
model. Hub-and-spoke models utilize a central authority through which all data and
control passes through. Naturally this model does not scale as well as mesh and has
reduced reliability due to the use of a central node. OpenStack has characteristics of
both models. It uses a central API point to provide an interface for each service, but
each service functions independently. Control is handled by a central node called the
controller while allocating components are distributed to the nodes that are hosting

15
Figure 2.3: A typical OpenStack four node architecture consisting of a controllernode, network node, compute node, and storage node. Services residing on each nodeare shown. The required networking interfaces to provide management and instancetraffic are shown as well [58].
them. For example, in the provisioning of a VM, while the controller node gives
instructions to the compute node, actual provisioning is performed by the compute
node [10].
There are several types of physical nodes that can be employed by OpenStack.
The controller node orchestrates communication between all services of OpenStack.
Redundant controller nodes can be used for high availability. An optional, but recom-
mended network node controls all the traffic flow of nodes. This node is important in
implementing SDN routing. External and internal networks are administered through
this node. Compute nodes host and boot VMs. Hypervisors are installed on these
nodes. Options for hypervisors range from Windows Hyper-V to KVM for linux.
Lastly, the storage node services storage options for VMs and shared file storage.
Storage can come in the form of hard disk hosted directly onto storage node or more
distributed solutions such as Ceph clusters. Figure 2.3 shows a four node architecture
with the services running on each node.

16
2.4.2 Identity
The identity service is implemented by the Keystone project [83]. Keystone man-
ages a catalog of all OpenStack components and users [44]. The main function of
Keystone is to provide authentication and access control for the OpenStack cloud.
Tokens are dispensed for verification purposes by providing user name and password
credentials. Tokens include a list of roles available to specified user. Users are orga-
nized into groups, which belong to domains. Domains are namespaces that represent
the highest level of container for projects, users, and groups [82]. Authorization is
defined by roles that are granted at the domain or project level. Users and groups
are assigned roles. The organization can be simplified into two categories: services
and endpoints [44]. Services are OpenStack components such as: Nova, Neutron,
and Glance. Each provides an endpoint through which users can access the corre-
sponding API. Endpoints are the destination URL where services can be accessed.
Each endpoint can be either internal, public, or administration. Up to three different
endpoints can be assigned to each service. As a testament to it’s importance, this
service is the first to be installed and configured in an OpenStack cloud, as every
other service requires Keystone.
2.4.3 Networking
The networking service is called Neutron. Neutron is vital for Software Defined
Networking (SDN) options in the OpenStack cloud, providing networking as a service
(NaaS). Although a distinct networking node is recommended, Neutron services can
be installed on the controller node. SDN is the abstraction of lower level components
of networking [40]. This is accomplished through separating the communication and
management functions [10]. Decisions about where data will go are made in the
management layer while packets are forwarded through the communication plane
to their destination. This architecture enables OpenStack users to create virtual
networking infrastructure. This can be advantageous for some applications as it
allows network management to be separate from physical hardware which provides

17
added flexibility. OpenStack SDN relies on an overlay network for tunneling on top
of the physical network.
Services are provided to Neutron through the use of plug in agents. These can
include interfacing with native Linux network mechanisms, and SDN controllers [81].
Agents interact with neutron through the use of drivers in order to maintain vendor
neutrality. Drivers fall into two categories; type drivers and mechanism drivers. Type
drivers are used for technical definitions of different types of networks. Whereas
mechanism drivers define how to access an OpenStack network of a certain type. It
takes details from the type driver and make sure it is properly applied.
OpenStack provides two networking options. The simpler option is to deploy
Networking services which are bridged to the physical network, referred to as the
provider network as shown in Figure 2.4. Routing services (layer 3) are handled
solely on the physical infrastructure. VLAN is used to segment different networks.
This requires the administrator to know more details about the underlying network.
The other solution uses virtual routing to handle layer 3 services. These use
technologies such as Virtual Extensible LAN (VXLAN) which enables layer 2 tun-
neling networks on layer 3 networks [87]. Virtual networks are routed to physical
networks via Network Address Translation (NAT). Bridge networks are used to link
VM internal traffic to the external physical network. Neutron is able to provide both
layer 2 and layer 3 services in this networking type. Internal networks of different
VMs can be seperated through the use of different namespaces. This solution is called
a self-service network. Architecture is shown in Figure 2.5. This type enables Load
balancing as a service (LBaaS) and Firewall as a service (FWaaS).
2.4.4 Compute
The Nova module of OpenStack handles all tasks related to instance management
throughout its entire life cycle [101]. These tasks include allocating virtual CPUs
and memory, creating VMs, starting VMs, stopping VMs, and destroying VMs. Nova
interacts with several other OpenStack services. It works with Keystone for authen-

18
Figure 2.4: In the provider network Neutron architecture, OpenStack networks con-nect directly to physical networking infrastructure and utilizes it solely for all com-munication between nodes, VMs, and the internet. [90]

19
Figure 2.5: The self-service network Neutron architecture uses VXLAN, or otheroverlay protocols to create virtual networks on top of the physical networking infras-tructure. Communication can be done on either the physical external network or theoverlay network. [91]
20
tication, Glance for image services, and Horizon for user administration through a
web dashboard [74]. Nova manages all virtual resources such as processors, memory,
block devices, etc. [44]. It uses the placement API to track an inventory and usage
of virtual resource providers [88].
Management aspects of Nova are installed on the controller node, while separate
compute nodes host VMs. These management services are in charge of processing
user API calls and coordination between compute nodes which hosts the VMs. For
added security and improved scaling, nova-conductor which is installed on the con-
troller, mediates database access by compute nodes. Nova agents are installed on
the compute nodes. These agents interact with the hypervisors installed on compute
nodes that are used by the VMs. It is important to note that Nova is independent
from the hypervisor and merely provides an interface between the hypervisor and
OpenStack [101]. Nova supports a variety of hypervisors through the implementa-
tion of vendor drivers including: KVM (Kernel-based Virtual Machine, used by linux
based VMs), LXC (Used to run linux based containers), Hyper-V (Microsoft server
virtualization software developed for Windows based machines, but also supports
Linux and FreeBSD VMs), and more that are found on the hypervisor information
page from OpenStack.org [78]. Nova is able to scale very well with increasing com-
pute needs. New physical nodes can be added simply by installing the Nova API and
registering on the controller through Keystone. It is not required to re-configure the
entire infrastructure. Removing physical nodes, such as for replacement, is similarly
easy. For large scale deployments, OpenStack also provides Nova Cells that shard
compute nodes into pools called cells that each have their own message queue and
database [85]. In a typical OpenStack cluster, there will be at minimum two cells.
Cell0 is a special cell that holds information on all instances that are not scheduled.
This is used for instances that had unsuccessful launches. Then, at least one cell
starting from cell1 is designated for all running instances.
OpenStack stores instance templates into its database as flavors. Flavors specify
the virtual hardware to be used by instances. This includes number of virtual CPUs,

21
memory, storage, as well as which image to use. A list of available flavors can be
listed using the OpenStack CLI. Flavors are added through the OpenStack CLI, the
Python API, or through the Horizon web dashboard. Flavors can be made public, so
that all tenants can use them, or private for single tenant use.
2.4.5 Storage
OpenStack uses two general types of storage [94]. Ephemeral storage is temporary
and used for launching VMs that do not need to store any data. Once this VM is shut
off, the storage is returned back to a storage pool and any changes are not saved. This
is the default method of launching instances through the compute project. Persistent
storage is the opposite. Volumes exist independently of VMs and do not return to the
pool once their host VMs are shut down or removed. OpenStack storage is further
classified into block, object, and file [94]. Storage management services can optionally
be installed on a separate device for availability benefits in case main controller node
is down.
Block storage is handled by OpenStack Cinder [73]. Persistent storage via virtual
drives that are allocated to VMs using this module. These volumes can be switched
between different VMs with data on them preserved. Block storage can be simplified
as an allocation of the underlying physical block device. File systems can be created
on these devices, just as on traditional block devices. Cinder is of course vendor
agnostic, so multiple back ends are supported, from physical hardware residing on
the storage node to networked storage options such as Ceph.
Object storage is implemented by OpenStack Swift. Object storage is an ab-
straction above block level storage. As it’s name implies, data are treated as binary
objects and not just blocks of memory. In addition to the data itself, each object
also contains metadata. Objects are not bound by physical devices and exist inde-
pendently of each other which gives it the advantage of being able to be stored in
a distributed manner with replication. These properties make object storage ideal
for distributed cloud architectures. Swift, by default, uses three replications [101].
22
Popular uses of objects are in the storage of media such as images, music, videos.
VM images can also be stored as objects instead of in a file system [94].
The last type of storage is file based storage. Manila is the module name that
provides this service. The shared file system is persistent and can be attached to
multiple client machines [94]. This type of storage lets users store data in a hierar-
chical file system much like operating a traditional PC. Data is stored in files which
are organized into folders. This service can be used to store shared data. User in-
teraction is accomplished by mounting remote file systems, or shares as is referred
to by OpenStack, onto their instances [94]. Shares can be accessed by multiple users
simultaneously. Like other OpenStack services, Manila supports multiple back ends
implemented through drivers made by the respective vendors.
Figure 2.6 summarizes a few of the differences between each type of storage
offered by OpenStack.
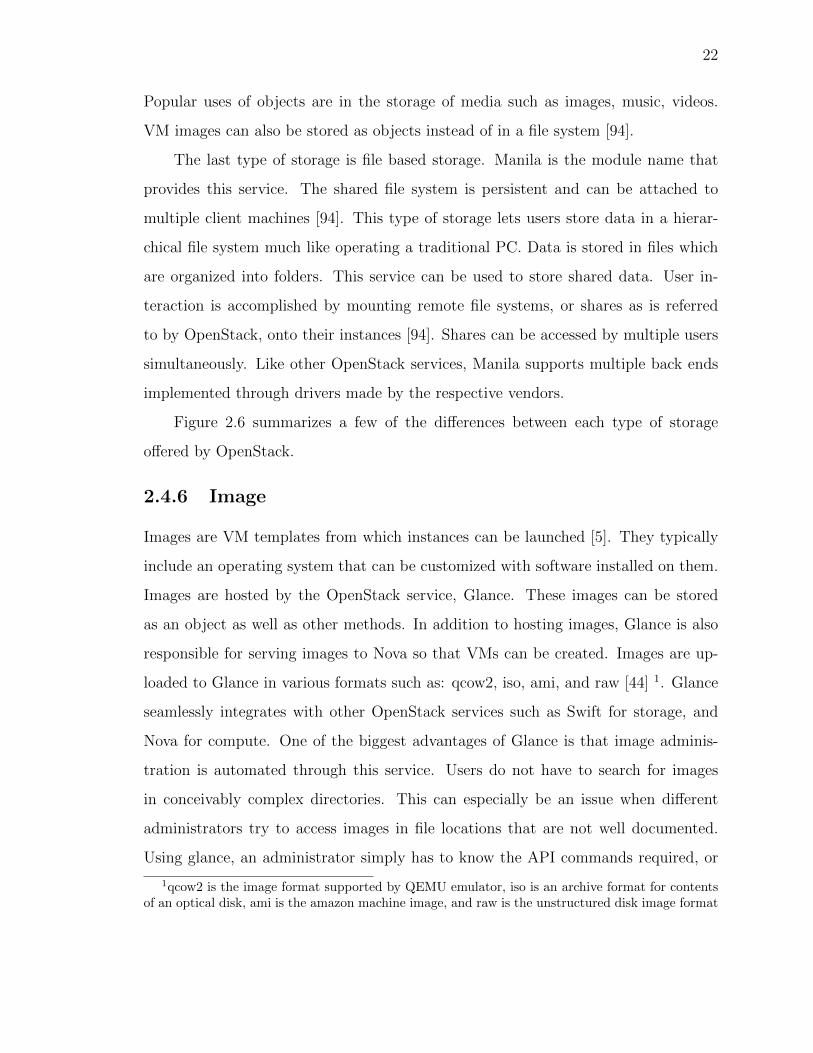
2.4.6 Image
Images are VM templates from which instances can be launched [5]. They typically
include an operating system that can be customized with software installed on them.
Images are hosted by the OpenStack service, Glance. These images can be stored
as an object as well as other methods. In addition to hosting images, Glance is also
responsible for serving images to Nova so that VMs can be created. Images are up-
loaded to Glance in various formats such as: qcow2, iso, ami, and raw [44] 1. Glance
seamlessly integrates with other OpenStack services such as Swift for storage, and
Nova for compute. One of the biggest advantages of Glance is that image adminis-
tration is automated through this service. Users do not have to search for images
in conceivably complex directories. This can especially be an issue when different
administrators try to access images in file locations that are not well documented.
Using glance, an administrator simply has to know the API commands required, or
1qcow2 is the image format supported by QEMU emulator, iso is an archive format for contentsof an optical disk, ami is the amazon machine image, and raw is the unstructured disk image format

23
Figure 2.6: Different types of OpenStack storage. The first column describes ephem-eral storage, while the other columns represent the three types of persistent storagethat can be used with OpenStack. Rows represent various comparisons between thedifferent storage types including how each storage is accessed, their function, andtypical usage [94].

24
use the web interface rovided by Horizon. For most OpenStack users, Glance does
not even need to be accessed since it is integrated into other services. For example,
launching a VM through Nova does not require the user to first call Glance to retrieve
the images required; Nova will handle it automatically.
2.4.7 Web Dashboard
OpenStack offers the option to access their dashboard through a web interface with a
graphical user interface (GUI). Horizon is the module that implements this functional-
ity. Through this dashboard, a user can perform administration tasks like launching
VMs, uploading images to Glance, and network administration. About 70-80% of
OpenStack functionality can be realized from Horizon [44]. Users interact with the
GUI through a point and click interface with text boxes to fill in required informa-
tion Figure 2.7. There are also pie charts displaying how much of available resources
are allocated. Volume and object store tabs are used for administration of storage
services. Keystone services such as creating SSH key pairs or creating new tenants
can be performed in the Identity tab. Horizon also supports connecting to instances
from the web interface. Either a terminal window or even a full GUI can be displayed
in the web browser window. Connections use the VNC protocol or the SPICE proto-
col [75]. The use of a GUI simplifies administration tasks as the user is not required
to memorize or look up command line function names.
Level of access in the dashboard is controlled via user roles. The administrator
user is able to view infrastructure of all other tenants and has more freedom to create
virtual networking components like routers and external networks. Whereas a less
privileged user is restricted to only creating subnets for their instances. Users log into
the dashboard using a username and password.
The web server and horizon services are hosted on the controller node [84]. A
web based dashboard is advantageous as it can be accessed anywhere that is in the
same network as the controller node without having to install software other than a
web browser. In our application, the web dashboard could be accessed any device

25
Figure 2.7: The Instance View of the Horizon web interface showing the instancesfor the current user. A drop down menu on the right under Actions allows the userto perform adminstration tasks on each instance such as shutting down or restartingthe instance. The menu on the left side allow the user to navigate between differentviews such as network and image.
within the university’s subnet, which made administration easier by only requiring a
web browser to connect.
2.5 Other Technologies
2.5.1 Ansible
Ansible is a IT automation tool with an open source license that is maintained by
Red Hat. It was created to simplify system administration in the spirit of the DevOps
movement, where developement teams are merged with operations for more efficient
product delivery and maintenance [28]. Michael DeHaan, the creator of Ansible,
wanted to combine functionality of several common tools for configuration manage-
ment, server deployment, and ad hoc task execution into one ecosystem [28]. Ansible
accomplishes automation of common to complex administration tasks without the
need for a central agent. Instead, Ansible connects to remote client systems using
SSH, so the host running Ansible is arbitrary and flexible. Although Ansible can
support password usage, SSH is generally regarded as being more secure due to the
difficulty in cracking SSH private keys. Since most tasks are automated and only
the Ansible service is connecting to target systems, there is a reduced risk of admin-

26
istrators making mistakes and unwanted changes. The aim of Ansible is to model
IT infrastructure as a system of inter-related parts instead of each system existing
independently [60]. Target systems are defined in the inventory file. Target systems
can be grouped together by roles or any other arbitrary classification. This enables
Ansible to automate administration of heterogenous infrastructures using only one
inventory file. Tasks are specified in configuration files, called playbooks, written in
the YAML Ain’t Markup Language (YAML). YAML is very human readable and easy
to learn [36]. A benefit of using configuration files is the ease of migrating virtual
infrastructure to different hardware. Instead of the painstaking manual process of
configuring new systems, the administrator just has to run the Ansible scripts. Many
system administrators are familiar with shell scripting, Ansible acknowledges this by
allowing the use of shell commands verbatim [28].
2.5.2 Terraform
Terraform by HashiCorp is an orchestration tool that configures the infrastructure
using a declarative language called Hashicorp Configuration Language (HCL) [30].
Orchestration tools are used for creating servers and other infrastructure components,
such as virtual networks. Just like Ansible, Terraform uses a client only architecture
and depends on the cloud providers API to perform tasks so no there are no additional
software dependencies. Terraform interacts with the OpenStack through a provider
API using the HCL language [32].
For declarative type tools, code is written that describes the desired end state of
infrastructure and the tool will determine how to reach that end state. Procedural
type tools such as Ansible and Chef require code to describes how the infrastructure
will be realized [9]. The advantage of using a declarative type tool is that changes to
infrastructure simply require updates to the code to describe the end state. For exam-
ple, if an administrator wanted to increase the number of running instances from 10 to
20, they just change the code to the new number, 20. If the same thing were changed
with a procedural type tool, then instead of having 20 servers, it would provision 20
27
additional servers for a total of 30. Procedural tools do not delete old infrastructure
described unless specifically told to do so. New scripts must be written every time a
modification needs to be made, rendering old code essentially useless. Care must be
taken to track the state of infrastructure which could require an additional tool. In
contrast, Terraform code represents the current state of infrastructure and is highly
reusable [9]. The Terraform architecture is particularly well suited for the constant
adjustments made to virtual infrastructure for research and testing.
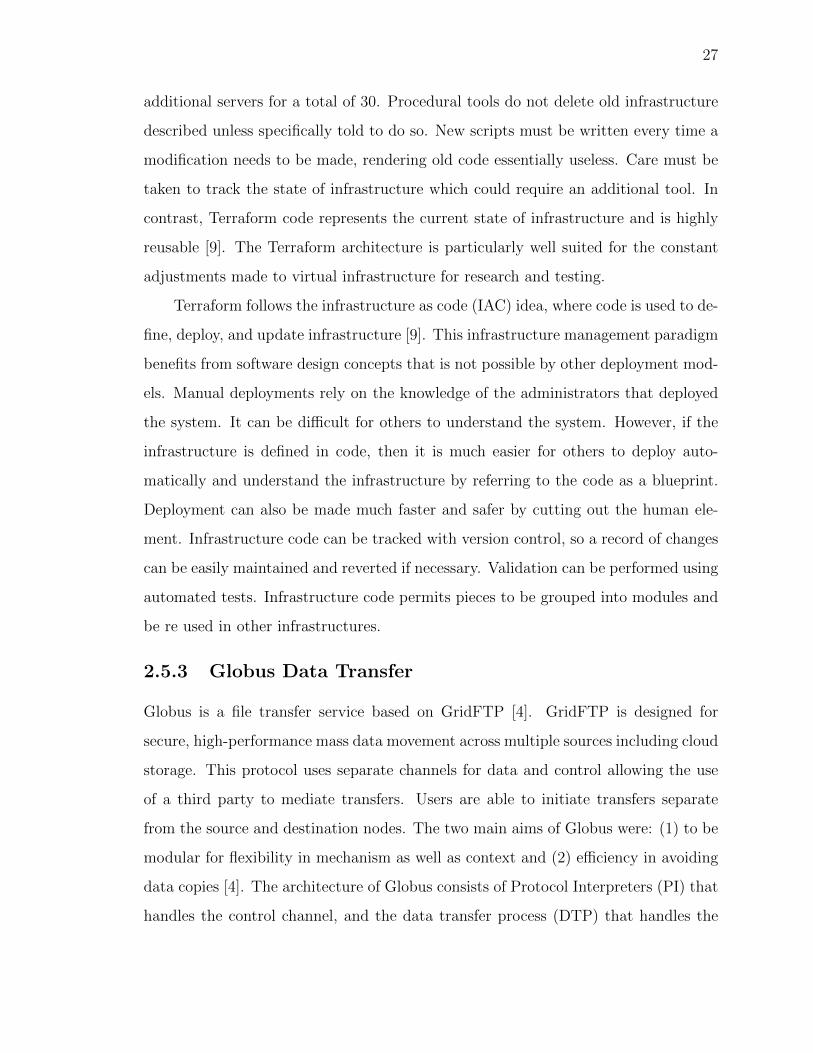
Terraform follows the infrastructure as code (IAC) idea, where code is used to de-
fine, deploy, and update infrastructure [9]. This infrastructure management paradigm
benefits from software design concepts that is not possible by other deployment mod-
els. Manual deployments rely on the knowledge of the administrators that deployed
the system. It can be difficult for others to understand the system. However, if the
infrastructure is defined in code, then it is much easier for others to deploy auto-
matically and understand the infrastructure by referring to the code as a blueprint.
Deployment can also be made much faster and safer by cutting out the human ele-
ment. Infrastructure code can be tracked with version control, so a record of changes
can be easily maintained and reverted if necessary. Validation can be performed using
automated tests. Infrastructure code permits pieces to be grouped into modules and
be re used in other infrastructures.
2.5.3 Globus Data Transfer
Globus is a file transfer service based on GridFTP [4]. GridFTP is designed for
secure, high-performance mass data movement across multiple sources including cloud
storage. This protocol uses separate channels for data and control allowing the use
of a third party to mediate transfers. Users are able to initiate transfers separate
from the source and destination nodes. The two main aims of Globus were: (1) to be
modular for flexibility in mechanism as well as context and (2) efficiency in avoiding
data copies [4]. The architecture of Globus consists of Protocol Interpreters (PI) that
handles the control channel, and the data transfer process (DTP) that handles the

28
access and movement of data. Globus is able to exploit multiple TCP streams for
parallel data transfer for much greater transfer rates than FTP. Even in single stream,
Globus was shown by Allcock et al. [4] to perform favorably to FTP and much better
with striped 2 data in a storage cluster.
2.5.4 RAID
Redundant Arrays of Inexpensive Disks (RAID) is a data storage strategy created to
increase reliability and decrease cost by using inexpensive commodity hard disks [55].
In this method, a storage array is divided into reliability groups each with their own
set of extra disks containing redundant data. Upon disk failure, data can be recovered
from these extra disks. There are several different schemes possible with RAID, each
denoted by the word RAID followed by a number, e.g. RAID 0. Schemes differ
in performance and reliability. RAID 0 is the fastest mode and uses data striping
which is splitting data between multiple drives [39]. However, in this scheme, data is
lost during disk failure as there is no extra redundancy disks. In RAID 1, all disks
are fully mirrored, thus requiring a pairs of disks. When one disk fails, the data is
immediately available from the mirror disk. In RAID 5, data is striped across all
disks in array along with a parity block for each data block on the same stripe. Data
can be rebuilt onto replacement drives in case of failure. RAID 6 is similar to RAID
5, but has an additional parity block for each data block. RAID 6 can support up to
two disk failures without data loss. Levels can also be nested together. For example
RAID 60 would be a RAID 0 striped across multiple RAID 6 sub-arrays as depicted
in Figure 2.8.
RAID has been the most popular choice for failure tolerant storage systems for
years [29]. However, there are unfavorable trade offs. The RAID rebuild process
can be lengthy, taking hours to days to repair a single 4 TB or 6 TB disk [29]. It
also requires extra hardware such as hot spare disks to accommodate failures. This
2Striped data is data that is broken into pieces and spread across different physical nodes in astorage cluster.

29
Figure 2.8: RAID 60 consist of multiple RAID 6 arrays (2 depicted in this figure)nested within a RAID 0 configuration. [63]
storage architecture becomes more and more dangerous as hot spares become used
up. RAID requires the use of identical disks, so upgrades mean replacing the whole
physical infrastructure. Typically enterprise level systems require RAID controllers,
which are expensive and are a single point of failure. There is a scaling limit, above
which no disks can be added to the RAID group. New shelves can be added, but the
extra load on the RAID controller comes with a performance trade off. RAID 5 can
survive one disk failure, while RAID 6 can survive two failed disks. However, above
two, there is no way to ensure data reliability without requiring many extra disks for
nested architectures.
2.5.5 Ceph
Ceph is a cloud storage service and is one of the most popular storage vendors among
the OpenStack community [10]. Storage devices are spread across a cluster network
which features distributed file system and application software [34]. Ceph provides
storage as a service, abstracting the implementation from the client. This type of
approach is referred to as software defined storage. Hardware interactions are han-
dled through the operating system so one benefit of software defined storage is that
it is hardware agnostic and mixing of different hardware in a single cluster is possi-
ble. Ceph uses an algorithm called Controlled Replication Under Scalable Hashing

30
(CRUSH) [41]. This Data placement occurs through the use of a hashing algorithm
which enables massive scaling without bottlenecks associated with lookup tables [24].
Also, since this scheme does not require centralized metadata, there is no single point
of failure. Ceph uses erasure coding for recovery. Data is regenerated algorithmically
and thus require less space than replication methods [29]. However, replication is also
supported. Ceph stores fragments of data as objects distributed over the entire clus-
ter. Data type does not matter. The Reliable Autonomic Distributed Object Store
(RADOS) layer is responsible for this object storage scheme as well as data repli-
cation, failure detection, recovery, migration, and rebalancing to other nodes [29].
Copies of data never reside on the same disk and must reside in different failure zones
defined by the CRUSH map for increased data reliability. Networked Ceph clusters
can spread over different geographical locations for increased reliability. The librados
layer provides access to RADOS and also interfaces with the services that provides
the supported storage types.
Block storage, object storage, and file storage are all supported. Persistent block
storage is serviced by RADOS block devices (RBD) which stripes data across mul-
tiple object storage devices (OSDs). OSDs are responsible for handing actual read
and writes to storage media. There is a one to one relationship between physical
disks and OSDs. At least three OSDs are required for redundancy and high avail-
ablility [14]. The RADOS gateway interface (RGW) provides an interface for clients
to connect with Ceph object store. The RGW is compatible with cloud services
such as OpenStack Swift and Amazon S3 [29]. For file storage, CephFS provides a
POSIX-compliant file system. CephFS requires a Ceph metadata server (MDS) that
keeps track of file hierarchy and stores metadata. However, MDS does not serve data
directly to clients so there is still not a single point of failure. All three services are
implemented as native interfaces to librados [29].
The last two modules to discuss are the ones used for management. The monitor
maintains various state maps such as: OSD map, CRUSH map, and MDS. These
maps enable Ceph inter-daemon coordination. The Ceph manager keeps track of

31
Figure 2.9: From top to bottom, the clients can interact with storage from Cephvia the RBD for block storage, RADOS GW for object storage, or CephFS for filestorage. The librados layer provides an interface for RADOS and the other services(including RBD, RADOS GW, and CephFS). The RADOS layer is the foundationperforms management tasks on the OSDs, monitors (MON), and metadata server(MDS) in the case of CephFS [29].
the current cluster state and runtime metrics. It also exposes this information to a
web based ceph dashboard and REST API [14]. The architecture is summarized in
Figure 2.9.
2.5.6 Vagrant
Vagrant is a server templating tool that enables administrators to create portable
images of the server infrastructure. This makes deployment onto different hardware
easier and collaboration between multiple administrators. Disposable complex virtual
systems can be created and tested through the use of automated scripts [31]. Users
only have to write code once to deploy systems, so testing different configurations
become less time consuming.

32
Chapter 3
Related Work
In order to prevent service loss from failed hardware from occuring again, failover
restoration and live migration were important topics to consider. Yamato, Nishizawa,
Nagao, and Sato performed a study of restoration methods of virtual resources in
OpenStack [102]. According to the authors, failure management is one of the func-
tions that is lacking in OpenStack. In particular, there are no ways to restore multiple
types of virtual resources uniformly. Their novel approach utilizes a Pacemaker, a
high availability resource manager, to detect physical server failure. Pacemaker sends
a notification to the virtual resource arrangement scheduler which identifies a physi-
cal server that has capacity to accommodate virtual resources from the failed server.
Unlike other failover methods, this one does not require standby nodes. They imple-
mented a virtual resource arrangement scheduler to handle both physical server and
VM failures. Pacemaker was used to detect a physical server failure and notifies the
virtual resource arrangement manager. Upon physical server failure, corresponding
virtual resources are identified and get redistributed to other physical nodes. On VM
failure, a physical server is identified to be the target of relaunching VM. They per-
formed experiments on restoring logical routers and VMs. In both cases they found
speed ups in restoration time.
Cerroni and Esposito investigated the performance of VM live migration on a
production QEMU-KVM system and proposed a new model for increased migration
performance [16]. Live migration is a research topic of high interest as it minimizes
service interruptions when virtual resources need to be migrated to another physi-

33
cal server. Requirements for achieving this include consistency in network, storage,
and memory between the migration origin and destination. The authors created a
geometric programming optimization model for memory copying. They used two key
parameters in their model, downtime and total migration time. Optimal solutions
were determined, through simulations, for the trade off between the two variables.
Results show that downtime can be reduced up to two order of magnitude while in-
creasing number of transfer rounds. There was diminishing returns on total migration
time with increasing number of transfer rounds. More transfer rounds decreased mi-
gration time as page dirtying rate increases up to a saturation point due to the power
law relationship between dirtying rate and migration time. This indicated that there
is an optimal number of transfer rounds. Experimental results of total migration time
with increasing memory transfer rounds are show in Figure 3.1. Their model was able
to return the minimum total migration time by optimally allocating bit rates across
multiple VMs to be migrated. Cerroni and Esposito concluded that live migration
should always be used when multiple VMs are to be migrated.
Figure 3.1: Total migration time in seconds as a function of increasing memorytransfer rounds for 3 VMs. There are diminishing returns with increasing rounds.Only a few transfer rounds are required. [16]

34
M. Dias de Assuncao, da Silva Veith, and Buyya [21] surveyed streaming data so-
lutions using public cloud providers such as Amazon Web Service (AWS) and Google
Cloud Data Flow. Amazon uses Firehose for delivering data. The advantage in using
these cloud software solutions rather than building a private cloud infrastructure is
the additional functionality offered by tools. For example Amazon CloudWatch in-
tegration is able to monitor details about bytes transferred, success rate, time, and
other analytics. However, costs can get quite high as users are charged for time and
resources. The Google Cloud Dataflow is able to execute Etract, Transform, and
Load (ETL) tasks (both batch and continuous processing). Included are automatic
optimizations such as data partitioning, parallelization of worker code, and optimiza-
tion of aggregation operations or fusing transforms in execution graph. Azure also
offers streaming services called Azure Stream Analytics (ASA). Similarly, Saif and
Wazir performed a survey on public cloud big data tools from the following enter-
prise vendors: Amazon, Google, IBM, and Microsoft Azure [64]. Three tools were
analyzed for each class: big data analytics, big data storage, and big data warehouse.
There were over 30 different comparisons across the three classes of tools including
supported operating systems, billing model, storage type, data storage size limits,
and supported data format. Results were conveniently summarized in a table so that
administrators may use it as a quick reference to decide on which vendor to use.
Segec, Uramova, Moravcık, Kontsek, and Drozdova outlined their process of
designing an OpenStack based cloud architecture for a department at the University
of Zilina [68]. This cloud was used by faculty and students for research and teaching
purposes. They started design with a reference architectural framework specifies what
a cloud service should provide. The architecture is broken up different views. The
user view consists of all different kinds of users in the cloud from cloud customer to
the cloud provider and how resources are allocated and shared between users. The
functional view divides desired functionality into four layers: user, access, service, and
resource. Layer descriptions are provided in original paper. A fifth class of multi-layer
functions is also specified. The software viewpoint describes the software in order to

35
realize the functionality listed in the user view. It is composed of an implementation
view and a deployment view.
A comparison of several different linux based virtualization cloud platforms was
performed by Farrukh Nadeem and Rizwan Qaiser [50]. These were: Ubuntu Enter-
prise Cloud, Xen Cloud Platform, and Proxmox Virtual Environment. Default hy-
pervisors were used which were in order from above: KVM, Xen, and OpenVz. The
authors chose to study infrastructure as a service. Cloud environments were built
on each platform. They evaluated performance based on response to user requests,
hardware utilization efficiency, and application performance. Common benchmarks
such as Apache benchmark for web request responses to evaluate user request and
RAMspeed for memory bandwidth were used. They concluded that Proxmox Virtual
Environment performed the best for both CPU intensive applications and database
applications. Ubuntu Enterprise Cloud was the best choice for data intensive appli-
cations that access data through native file systems and have a high ratio of data
read/write operations to CPU operations. There was no platform that excelled in
all categories. An optimal platform choice depends on the application. Figure 3.2
is a table summarizing the results of benchmark testing and comparisons between
the platforms. For each benchmark operation and metric, a thumbs up was given to
the platform that performs the best, a thumbs down for the platform that performed
the worst, and a blank space represents performance between the two extremes. The
study was expanded in 2018 with a performance analysis of the hypervisors used [3].
Hypervisors were evaluated using the same benchmarks used in the previous study.
Ubuntu 16.04 was installed as a guest operating system on each hypervisor running
on the same physical hardware. Performance was compared to a bare metal im-
plementation as a baseline. The results of the updated study indicated that KVM
outperformed the others for CPU and memory intensive tasks. Xen performed the
best for database and storage tasks. These new findings differ from the earlier study.
This seems to suggest that there has been much optimization work done on KVM
and Xen in the three years between studies, or that there are differences in the cloud

36
infrastructure software that outweigh performance benefits of the hypervisor alone.
Figure 3.2: Table showing performance comparisons of three virtualization platforms:Ubuntu Enterprise Cloud (UEC), Xen Cloud Platform (XCP), and Proxmox VirtualEnvironment (PVE). Common benchmarks, identified in the third column, were usedto test various functionality. Thumbs up in the last 3 columns means the platformperformed the best, a thumbs down means the platform ranked the worst out of thethree, and blank space represents the platform performed in the middle [50].
A recent 2019 study by Jiang et al. [35] compared energy efficiency among four
hypervisors and a container engine. These were VMware ESXi, Microsoft Hyper-V,
KVM, Xenserver, and Docker. These hypervisors and container engine were chosen
because they are widely deployed in current data centers. A multitude of different
hardware architectures were examined from server racks to desktops to laptops. This
choice was made to examine use cases for all sizes of cloud infrastructures. Energy
efficiency was examined in three orthogonal parameters: hardware, hypervisor, and
workload. Different work loads were observed to have different power consumption.
Consumption also varied among different hypervisors. However, no single hypervi-
sor prevailed as the top performer for all workload levels across all hardware. No

37
dependency was found between power consumption with hardware or workload level
among the distribution of hypervisors. Container virtualization was surprisingly not
more energy efficient than hypervisor virtualization despite it being considered more
lightweight. From the research comes the valuable insight that there are many factors
that influence power consumption and data center designers have to carefully consider
which hypervisor to use depending on hardware and workload.
Chen et al. discusses the evolution of Cloud Operating systems, such as Open-
Stack and Windows Server Manager, out of the necessity for increasing access of cloud
technologies [17]. Like a traditional OS, a cloud OS provides abstractions in the form
of APIs for cloud developers. The cloud OS is also responsible for management of
distributed computing resources. Traditional operating systems do not treat a cloud
applications as a single logical unit spanning multiple hardware systems and only
provide basic communication tools. Communication coordination between hardware,
which can number in the thousands, quickly becomes complex in all except the most
basic cloud applications. Therefore, a cloud OS is needed to abstract lower level
communication. Management also becomes easier as a cloud administrator does not
have to manage each physical system individually. Single system OSes could not scale
with cloud applications.
Chen et al. [17] goes on to discuss the impetus for evolution of cloud OS which is to
improve efficiency and developer experience. The goal for efficiency improvements is
to minimize wasted computing power. Developer experience improvements are those
that improve user friendliness of programming and management interfaces. These
two facets are often regarded as conflicting. For example, low level interfaces are
generally better for performance, but are not as user friendly as a highly abstracted
interface. The evolution of cloud OSes will require finding optimal trade offs between
the two.
Platform comparisons of OpenStack and Cloudstack were compared by Parad-
owski, Liu, and Yuan in 2014 [54]. Before this study, most cloud computing research
has focused on specific issues, but there was none that analyzed whole platform per-

38
formance. Mutual hypervisor was used for fair comparison. Platforms were deployed
as virtual instances running in Oracle VM VirtualBox on a common host machine.
Storage was implemented as a single 100 GB virtual disk to both VMs. In instance
deployment tests, OpenStack outperformed CloudStack by about 6 seconds (25%)
faster. A bar graph of average deployment time is shown in Figure 3.3. This was
consistent across three different test instances launched with varying CPU and RAM
allocations. Instance deletion times were closer with less than a second of difference
between the two, with OpenStack slightly outperforming CloudStack. Deployments
and deletions also utilized less CPU resources on the host machine using OpenStack
by 2-4%. Although OpenStack outperformed CloudStack in this particular study,
CloudStack could have caught up in the years that have passed since then.
Figure 3.3: Graph of average deployment time of virtual machine comparison betweenOpenStack and CloudStack with varying hard disk sizes. [54].
Andreetto et al. consolidated two OpenStack based private clouds [6]. One
infrastructure was a scientific IaaS cloud for researchers associated with an Italian
national lab (Cloud Area Padovana) and the other was a scientific cloud belonging to
a university (University of Padovana Cloud). The motivation was to eliminate unnec-

39
essary redundancies, reduce administration manpower, and to promote information
sharing between different researchers from both groups. Infrastructure was used for
data storage and other tasks related to research. Merging was accomplished by first
reconfiguring Cloud Area Padovana into the new cloud called CloudVeneto.it. Then,
users and resources from the university cloud were migrated over to CloudVeneto.it
because it was the smaller infrastructure. Networks had to be reconfigured; each
project was assigned it’s own subnet. Multiple storage backends were used including
Ceph, iSCSI, and EquaLogic.

40
Chapter 4
NRDC Streaming Data Services
4.1 Hardware
The NRDC cluster hardware consists of four SGI Rackable C2110G-RP5 compute
nodes from which all VMs are hosted. Servers feature Intel Xeon E5-2670 8 core with
16 logical processors at 2.60 GHz. Systems were installed with 64 GB of memory. A
fifth physical server, SGI MIS, is connected to several storage disks, both solid state
and hard disks, and hosts the shared storage services. The Disks are setup as RAID
6+0 with three groups. Originally, a RAID 0 backup storage server was included, but
that server had failed by the start of this project. The lack of a backup storage was
ones of the primary motivations for the migration of the NRDC.
The networking hardware consists of three components. Physical hardware and
networking components are shown in a diagram in Figure 4.1. All nodes are con-
nected through an InfiniBand switch which enables high throughput, low latency
internal traffic. This was to reduce bottleneck potential for data ingestion and long
term storage operations. Two routers connect the cluster to the external network.
One router is labeled mickroTik-UNR-EPSCOR Figure 4.1 which connects to the
university network. The other is connected to the Nevada Seismological Laboratory
(NSL) research network. The cluster is composed of two server racks located in a
climate controlled server room on the university’s campus. Naturally, this increases
the risk of failure due to the non distributed architecture. OpenStack was attractive
because it adds a virtualization layer and allows live migration.

41
Figure 4.1: The physical hardware of the NRDC. Hardware consists of four computeservers, labeled Virtual1-1 to Virtual 1-4. A storage server, an infiniBand switch, andtwo routers.

42
Sensor towers have embedded internet connected devices that transmit data back
to the data center. They feature a multitude of environmental data sensors such as
temperature, humidity. Some sensors have cameras capable of taking photos and
streaming video accessible via the NRDC website.
4.2 Software
All physical systems were using Microsoft Windows Server 2012R2 Datacenter oper-
ating system. Windows offers a performance version of their server OS called Server
Core that only has a limited GUI, however, the full installation was used in the
NRDC. Hyper-V was the hypervisor used that abstracts the hardware layer for VMs
that reside on them. Windows supports server management through both a GUI man-
agement interface and a command line interface (CLI) through Windows PowerShell.
Microsoft SQL server was used for the database service. Administration of virtual
servers was performed by connecting to any physical system in the cluster through
the Remote Desktop Protocol (RDP). From there, it was possible to connect to any
VM in the cluster through the Hyper-V manager program. VMs were organized by
the server they resided on. Host servers could be selected from a text box, which
would then display all VMs on that server. Figure 4.2 shows the Hyper-V manager
window with the four host servers. Additionally, there wass a server monitor program
from which individual services can be started and stopped on each VM. Most VMs
integral to the production services of the NRDC were using the Windows Server 2012
operating system. There were several VMs that used the Ubuntu OS. These were
associated with a research project and were not involved in key functionality of the
NRDC.
Networked storage is provided by a distributed file system (DFS). A dedicated
VM is in charge of managing the namespace and access to the DFS for all other VMs.
Administration is performed through a DFS manager software that is part of Win-
dows Server. This storage is accessible by all VMs in the cluster. Files can also be
viewed by using RDP to connect to the storage server directly. Sensor towers commu-

43
Figure 4.2: Hyper-V manager allows the user to select any physical server in thecluster. VMs can be connected to from here as well.
nicate measurement data back to the VMs using the Campbell Scientific LoggerNet
application. Video stream data is received via a software called siteProxy. All web
services are built using the Microsoft .NET framework. This includes the camera
service that streams images and video from the sensors available through the web
page. Administration of these services was performed using the Internet Information
Services (IIS) Manager.
4.3 Virtual Architecture
The infrastructure was designed to pull data from remote sensors and curate them
into an optimal format for long term storage and intuitive organization. A diagram
showing the core NRDC VMs, the storage structure, and the host hardware is shown
in Figure 4.3. Not all servers are listed in the diagram. The database was designed
to be intuitive. There are two types of schema; one for measurement data and an-
other for infrastructure. The measurement database relates climate sensor raw data
to information such as units, measurement quality, and accuracy. Infrastructure data
relates physical devices and hardware used to take the measurements described pre-
viously. For example, this would relate data by tower ID, sheds, or repeaters. Sensor
data is fetched and ingested by the data retrieval server hosted within the NRDC
Virtual 1-1 server. This communication is faciliated by the LoggerNet remote soft-
ware installed on the sensors and the LoggerNet Server software on the data retrieval
VM. This service automatically retrieves data at various intervals. After retrieval,
44
the data is put into a directory on the DFS for long term storage. The Data Curation
Server on NRDC Virtual 1-2 is responsible for the curation and management of raw
sensor data from the Retrieval Server. It packages XML data together at various time
intervals and zips them together for storage in the SENSOR and GIDMIS databases.
The data aggregator, which runs on the Data curator, takes data out of the databases
and makes a copy in the comma separated values (CSV) format. It also stores these
in an FTP directory on the DFS. Snapshots and backups for VMs are also stored
in the shared DFS directory. The Data One server used to handle data replication
before the backup database failed.
A domain controller VM manages user access to the NRDC nodes. Users that
have an account on the SENSOR domain are able to connect to all other NRDC VMs
using the same credentials. There is a backup secondary domain controller in case
of failure. There is a source control server and several development VMs used in the
initial development of the NRDC. Several Ubuntu VMs are hosted on Virtual 1-4
that were used in another project.
Various VMs are critical to the functionality of the web services of the NRDC.
The web server, not listed in Figure 4.3, hosts the IIS server for the sensor.nevada.edu
web page. A seperate server acts as the certificate authority for IIS. A gateway
server routes traffic to the internet and serves up web pages. The server monitor
on NRDCVirtual 1-3 hosts an unlisted web interface for administration of NRDC
services. This was a custom created graphical interface. The monitor displays the
health and status of important functions such as data import and ingestion. Services
can be started and stopped from here without the need to connect through RDP.
Access to the management interface is controlled by prompting for administrator
credentials upon connection to the domain. The Webcam Server has the siteProxy
software running that retrieves camera images and video stream. siteProxy stores
a copy of images onto the DFS as files. The web service calls the siteProxy API to
display video feeds on the website and retrieves images. The web server also hosts the
web site interface from which researchers can access the sensor data and camera feeds.

45
Figure 4.3: A Diagram of the core VMs in the NRDC virtual infrastructure organizedby host virtual server. Not all servers are represented.

46
4.4 Network
There are three major networks that make up the NRDC. An internal network utiliz-
ing the InfiniBand switch is used for VM to VM traffic and all other internal commu-
nication between physical nodes. The DFS traffic is routed through this switch for
high throughput and low latency performance. One router, the UNR-EPSCOR router
labeled in Figure 4.3, connects the VMs with the internet. Researchers access web ser-
vices through the university domain. The NSL router, described in Section 4.1, routes
traffic from the sensor towers to the NRDC. Sensor towers are connected to a much
larger wireless network of sensors and cameras spanning the western United States.
Data acquisition VMs are connected to this network so that they may pull data off of
the sensor into the data center. Sensor towers are not connected to any other NRDC
network. VMs in the NRDC can have multiple network interfaces depending on their
function.

47
Chapter 5
Setting Up OpenStackInfrastructure
5.1 Hardware
The OpenStack test hardware infrastructure consisted of one controller node, seven
compute nodes, and a storage node. The controller node used a 6 core, 12 thread
Intel Xeon X5675 @ 3.07 GHz CPU. It had two Broadcom NetXtreme II BCM5709
Gigabit Ethernet cards. This node featured 94 GB of physical memory. Compute
nodes were Dell PowerEdge R610 Rack mount chassis with Intel Xeon X5675 6 core,
12 thread CPUs running at 3.07 GHz. Compute nodes had 48 GB of RAM and 500
GB of local storage. The storage node contains twelve Seagate ST10000NM0016-1T
drives (10 TB disks @ 15000 RPM). The storage node is a Supermicro Super Server
with 64 GB of memory. The processor was a 6 core, 12 thread Intel Xeon CPU
E5-2630 v3 at 2.40 GHz.
For networking, the infrastructure had one switch that connected all the nodes
into a local network. Nodes were also connected to the external university network
through a router.
5.2 Software
All nodes are using Ubuntu Server 16.04 LTS as the operating system. The graphic
less version was installed to reduce resource overhead of OS services. A Linux oper-

48
ating system was chosen for cost savings, widespread use in cloud server applications,
and capability with OpenStack, Ceph, and other open source tools. Unfortunately,
Windows Server is not an officially supported operating system for OpenStack. The
default package manager, Advanced Package Tool (APT), was used to install all other
software dependencies. Python 2.7 was installed as OpenStack services are written in
Python. Python 3 is also supported, but Python 2.7 was used in this project. Open-
Stack also includes a convenient Representational State Transfer (REST) Python API
for automating administration tasks using Python scripts.
Network Time Protocol (NTP) had to be installed on every node in the clus-
ter for synchronization. RabbitMQ is the message broker used for communication
between nodes for operation coordination and status information [59]. OpenStack
services store information in a MySQL database. The database back end used for the
open source MySQL database is MariaDB [25]. Keystone uses memcached to cache
authentication tokens [46]. For management of distributed data such as distributed
key locking and configurations, OpenStack uses etcd [23]. The web dashboard is
hosted on the controller node using Apache HTTP server. Keystone also uses HTTP
as a front end to other services. The middleware is provided by Python Web Server
Gateway Interface (WGSI).
Compute nodes used the KVM hypervisor because this is the default installed
virtualization module included in the Linux kernel. Although KVM is the most popu-
lar hypervisor used in the community according to an official user survey, OpenStack
is compatible with numerous others [72]. In order to use KVM, virtualization had to
be enabled first in the BIOS. This enables virtualization features of the Intel Xeon
CPUs described in Section 2.2. Nova services can be installed without these features,
but instances cannot be launched and will generate an error stating KVM could not
be used. Errors and other helpful runtime information can be found in nova log files
in /var/log/ directory on the compute nodes. The controller node also has logs for
the nova services residing on it. Logs are organized into different folders for each
OpenStack module. The log was integral in tracking down failures throughout this

49
research. Physical machines had to be rebooted in person to access the BIOS menu
to enable Intel VT-x. After this was enabled, KVM status was checked using the
kvm-ok command in the terminal. Instances were able to be launched after KVM
was confirmed to work.
5.3 Deploying OpenStack
OpenStack can be deployed using MAAS, a tool that creates a virtual layer over bare
metal hardware, and Juju, a tool to deploy and configure everything else. There is
also an official OpenStack-Ansible playbook for deployment. However for this project,
installation was performed manually by following along with the installation guide.
This was done in lieu of using automation tools to gain a deeper understanding of the
installation process and the architecture of OpenStack services through building the
infrastructure piece by piece. This method enabled the greatest level of customization.
Debugging was also simplified. It was relatively easy to fix errors after each step
compared to tracking down errors in steps abstracted by a deployment tool.
The Rocky OpenStack release was used for this cluster. This was the most recent
OpenStack release at the start of the research. Installation of the OpenStack software
and dependencies were handled using the APT package manager which comes bundled
with Ubuntu. Due to the quick release schedule of six months, the cloud archive
OpenStack Rocky repository had to be added to APT to ensure correct versions of
each service was installed. The Nova version installed on the compute node using
APT default repositories was not compatible with the other services installed on the
controller. Nova could not be launched and the error was traced back to a Nova
version not supported by the Rocky release. This problem was fixed after the correct
nova version for Rocky was installed.
After installation, setup was performed using the OpenStack CLI. The first node
to be installed was the controller node as this was were the management services were
installed to. Next the compute nodes were installed followed by the storage node.
In a typical production cluster, the Neutron service would be installed on a separate

50
network node, but for this test cluster, networking was installed on the controller
node.
Additional settings are set in corresponding configuration files. For example,
setting the controller node IP for compute nodes is done in nova.conf. The installation
guide details the majority of configuration options needed for a bare minimum working
stack. Configuration files are commented with brief descriptions of each parameter
and additional details can be found on the OpenStack website.
The network, instances, and images were setup using a combination of the CLI
and through the Graphical user interface (GUI) of the dashboard service. Once the
functionality was verified, a Terraform version of the infrastructure was made. The
storage backend was implemented using the Linux Logical Volume Manager (LVM) on
the compute nodes. Instances used for testing did not require more than a fraction of
available storage on the host compute nodes. It was simple to implement the storage
on there for initial testing. Eventual storage was planned to be provided by using
a Ceph backend on the storage node. Cinder, Glance, and other OpenStack storage
services would use the Ceph drivers to access the storage.
5.4 Installing a service
The installation process of each OpenStack service followed the same general proce-
dure. First new services were registered to Keystone so that the other pre-existing
services were aware of the API endpoints for the new one. This process was performed
using the OpenStack CLI. A username and password were created for each service.
The service entity is then created so that it may be added to the Keystone catalog
of services. Next the endpoints are created. For this project three endpoints were
created for each service; a public one, an internal one, and an administrative one.
Endpoints enable access by users and other services.
A MariaDB database was created for each service to store service related data.
The databases were hosted on the controller node. Services residing on other physical
nodes were configured to use the management network to access the controller for

51
databases. User names and passwords were generated for each service to access the
corresponding database. Privileges were granted through the MariaDB CLI using the
SQL language.
The package and dependencies for each service were then installed using APT.
Options were set in the necessary configuration files denoted by the .conf file exten-
sion. This included hard coding database and Keystone service credentials to access
the corresponding services. Although these files were protected through Linux user
permissions, hard coding credentials is typically discouraged. In a production de-
ployment, OpenStack can use the Castellan key manager API to implement a secret
store to protect these plain text secrets [89]. However, for this project, credentials
were simply hard coded as the additional security of using a secret store was deemed
unnecessary for the minimal prototype infrastructure used for testing. Once config-
urations modification was complete, a database sync operation was run to populate
the database with the new settings. Finally, services were restarted through the CLI
and a verify operation was performed to ensure the newly added service was correctly
installed.
5.5 Horizon Dashboard
Horizon provides a convenient web dashboard that can be accessed with only a web
browser. The only other OpenStack service required for Horizon is Keystone; all
other are optional. Horizon was built using the Django framework and thus required
Django 1.11 or 2.0 for OpenStack Rocky [96]. After installation through APT, the
/etc/openstack-dashboard/local settings.py file was modified to enable access
to services on the controller node. User access was controlled by specifying hosts
under the allowed hosts section. There were several other modifications made accord-
ing to the Horizon installation documentation [79]. To finalize installation the HTTP
host, apache 2, was reloaded and functionality was verified by connecting to the dash-
board through a web browser. The web address was http://controller/horizon.
Access is limited to only the hosts specified in the configuration file. The style

52
of Horizon could optionally be customized through the use of a CSS file stored
in /usr/share/openstack-dashboard/openstack dashboard/static/dashboard/
scss/ [76].
Horizon was setup to connect to VMs through a console in the browser using
the VNC protocol. To access the dashboard, the controller IP address is input into
a web browser. This presented the login in screen as shown in Figure 5.1. Project
credentials were input to go to the management interface. Administrator credentials
unlocked options not available to other users. These enabled control over the whole
infrastructure including the addition of new users. OpenStack services are organized
in a drop down menu on the left side of the interface.
Figure 5.1: The log in page for the Horizon dashboard. This is the page that Horizonpresents once the dashboard address is entered into a web browser.
5.6 Keystone
The controller node hosts the Keystone service. This service was integral for all other
nodes to be able to synchronize, identify, and communicate with each other. It also

53
provides authentication and authorization to services and tenants. Therefore, Key-
stone was the first service installed. Like other services, Keystone stored information
in the MariaDB database. Database access is enabled through the use of integrated
drivers. The Apache HTTP server and mod wsgi were installed so that Keystone
could serve identity requests through the web interface.
After installation is finished, an administrative user and a less privileged demo
user were created. Keystone controls access using domains, projects, users, and roles
as outlined in Section 2.4.2. An authentication token was requested using the Open-
Stack CLI. User credentials were stored into a client environment script, also known
as an OpenRC file. Using the script, the user simply has to run a single command.
An example for the admin user is shown in Figure 5.2. Project and domains must be
specified in the script file to separate tenants from each other. Credentials must be
provided before the OpenStack CLI could be accessed for security against unautho-
rized access. Administrator credentials are needed to access certain CLI commands
such as creating other users or service endpoints.
Figure 5.2: An example of a client environmental script used for identity authenti-cation through Keystone. Instead of having to type this information every time theOpenStack CLI is used, the user simply has to run the file name before launching theCLI. In addition to a username and password combination, the script must includeproject and domain to enable multi-tenant cloud infrastructure.
5.7 Glance
The Glance service is also installed on the controller node. Installation follows
the structure described in Section 5.4. The module was listed as glance-api in the

54
APT repository. For verification, a minimal Linux image called CirrOS was down-
loaded [66]. The administrator OpenRC had to be sourced to add images to glance.
The OpenStack CLI was used to add the CirrOS image to Glance. Image addition
was verified by calling the image list command to confirm that the new image had
been added.
Images were uploaded to Glance using three methods for this project. The first
method was calling the image create command from the OpenStack CLI. The inputs
to this were a image file, a disk format, container format, and visibility to other
tenants. The qcow2 disk format was used because this was the format supported
by QEMU. No container format was used, so the raw option was used. Visibility
determines which OpenStack tenants are able to view the image. This was set to
public; however, in a production environment this would probably set to private for
security. The second method was using the Horizon web dashboard. Horizon features
a GUI interface to upload an image file and create a Glance image from it. The third
method was using Terraform to declare the location of the image file and parameters
of the desired image. Images appeared in Glance once the Terraform apply command
was run. Two types of images were uploaded to Glance to reflect the two operating
systems used in the NRDC; Windows Server 2012 and Ubuntu 18.04 LTS.
The controller also hosts the databases for each service. The binding address
must be set to the IP of the controller node on the management interface so that
other nodes can access the database. Databases are created for each service as the
first step of installation. These house data that each service references and uses.
For example, nova will store information relating to instances in these databases.
Keystone uses a database to store identity information for each user and group. The
controller is also where NTP and RabbitMQ are installed. Typically a separate node
is dedicated for Neutron networking, but for the test stack, Neutron is installed on
the controller.

55
5.8 Compute
The compute service is responsible for hosting the VMs using the KVM hypervisor
installed on the compute nodes. KVM is the default hypervisor in the Linux kernel
since the 2.6.20 release [53]. Four databases were created for this service. One for
each of the following: nova, nova-api, nova-cell0, and placement. Several services do
not require databases such as: nova-novncproxy, nova-conductor, and nova-scheduler.
Services associated with management were installed on the controller node. The
nova-api accepts user requests and provide the orchestration necessary to process
them. The nova-scheduler then takes requests from the queue and determines which
compute node to put them on. The placement-api keeps a record of how hardware
resources are used. Nova-novncproxy was installed to provide web browser access
through Horizon using the VNC proxy. Integral to the web console, was the nova-
consoleauth which provided token authentication for the VNC proxy. After instal-
lation, the configuration files were edited according to the installation guide. Some
notable configurations were to set up the VNC and Glance sections with the controller
IP on the management interface so that compute nodes could access these services
through the controller. The database was synced with configuration updates next.
Then cell1 was created for future running instances. The nova-manage database was
synced once more and the cells were listed to ensure the registration was successful.
Finally as a last step on the controller node, all nova services installed were restarted.
Only one module, nova-compute, was installed on the compute nodes. This was
the worker daemon that interacts with the hypervisor to start and stop VMs. For
configuration, VNC and Glance were set up to point to the controller for service.
After configuration, nova-compute was restarted. Then, several commands were run
from the controller node to complete setup. First, a compute service list command
was run using administrator credentials to check whether the compute node was
successfully added to the database. Next, a discover hosts command was run to
register the new compute node. Then the compute services are listed to make sure the

56
nova-compute, nova-conductor, nova-scheduler, and nova-consoleauth were working
correctly. A catalog list was then ran to confirm connectivity of Keystone, Glance,
Nova, and placement. Lastly, a nova-status upgrade check was performed to check
cells and placement APIs.
Usage of compute resources were visualized via pie charts in Horizon. Figure 5.3
shows the usage graph from the test infrastructure.
Figure 5.3: Usage chart of resources available on the OpenStack infrastructure dis-played as pie charts. Usage is shown for compute, volume (storage), and networkresources.
A networking service agent is installed that connects instances to virtual networks
and provides firewall services using security groups.
Insert in what flavors I am using. These flavors were chosen based on the
resources allocated to VMs in the NRDC infrastructure. These were made to be a
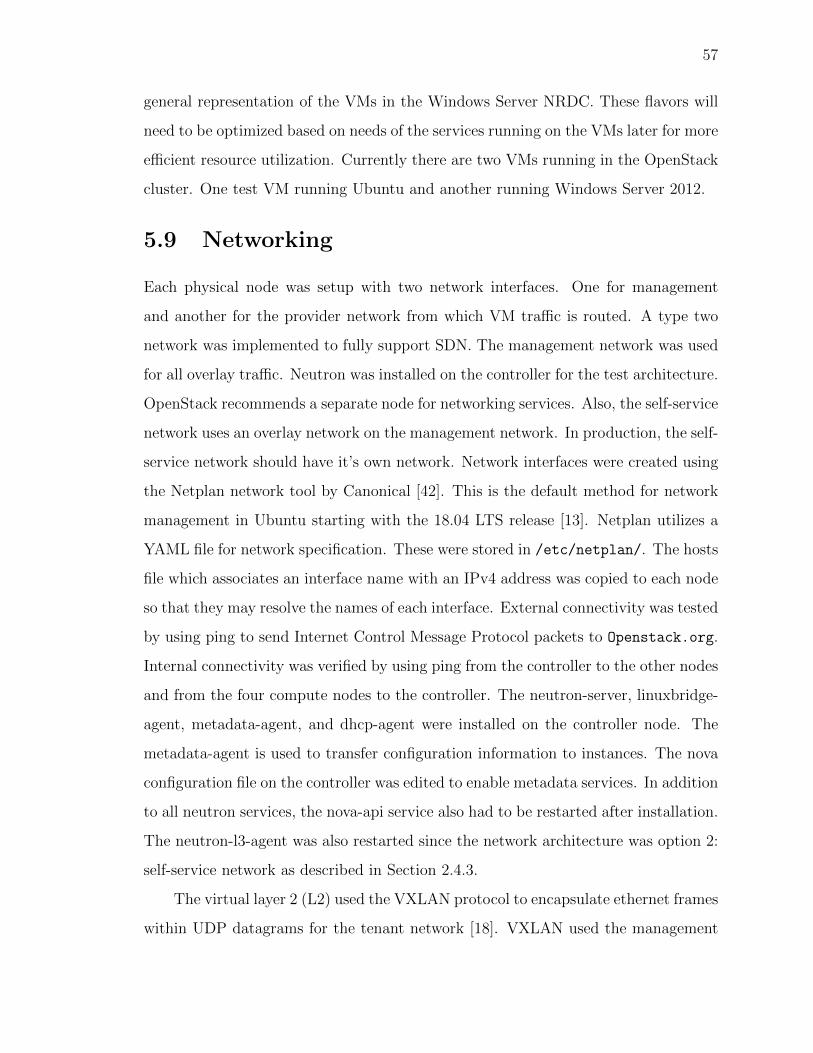
57
general representation of the VMs in the Windows Server NRDC. These flavors will
need to be optimized based on needs of the services running on the VMs later for more
efficient resource utilization. Currently there are two VMs running in the OpenStack
cluster. One test VM running Ubuntu and another running Windows Server 2012.
5.9 Networking
Each physical node was setup with two network interfaces. One for management
and another for the provider network from which VM traffic is routed. A type two
network was implemented to fully support SDN. The management network was used
for all overlay traffic. Neutron was installed on the controller for the test architecture.
OpenStack recommends a separate node for networking services. Also, the self-service
network uses an overlay network on the management network. In production, the self-
service network should have it’s own network. Network interfaces were created using
the Netplan network tool by Canonical [42]. This is the default method for network
management in Ubuntu starting with the 18.04 LTS release [13]. Netplan utilizes a
YAML file for network specification. These were stored in /etc/netplan/. The hosts
file which associates an interface name with an IPv4 address was copied to each node
so that they may resolve the names of each interface. External connectivity was tested
by using ping to send Internet Control Message Protocol packets to Openstack.org.
Internal connectivity was verified by using ping from the controller to the other nodes
and from the four compute nodes to the controller. The neutron-server, linuxbridge-
agent, metadata-agent, and dhcp-agent were installed on the controller node. The
metadata-agent is used to transfer configuration information to instances. The nova
configuration file on the controller was edited to enable metadata services. In addition
to all neutron services, the nova-api service also had to be restarted after installation.
The neutron-l3-agent was also restarted since the network architecture was option 2:
self-service network as described in Section 2.4.3.
The virtual layer 2 (L2) used the VXLAN protocol to encapsulate ethernet frames
within UDP datagrams for the tenant network [18]. VXLAN used the management

58
network interface for all traffic. The linux bridge mechanism driver was implemented
in the neutron network. L2 agent was installed on the compute node to provide con-
nectivity. The configuration file for L2 agent was located in /etc/neutron/plugins/
ml2. The linux bridge mechanism driver was specified here. On agent restart, the
configuration file must be passed. Connectivity was verfied by pinging an external
webpage, Openstack.org was used, as well as the other nodes.
Layer 3 (L3) agents enable virtual routers and floating IPs. The driver used for
L3 was linuxbridge to create a bridge between the external network and the virtual
one. Linuxbridge was configured to use the provider network interface on the compute
nodes. The OpenStack CLI was used to create virtual networking infrastructure for
the instances. An external network and one subnet was made so that instances could
connect to the internet. An internal network with one subnet for the instances was
also created. A virtual router was created to act as the external gateway for the
instances. Only the administrator account has privileges to create virtual routers.
The router required the subnet of the instances and the external gateway of the
provider network to function. Networks could be added by name or ID.
OpenStack DHCP services had to be disabled; the DNS server of the university
physical network was used for name resolution. When OpenStack DHCP was enabled,
nodes lost network connectivity. This error was repeatable with DHCP enabled, but
when it was disabled, connectivity was restored and instances were able to access
both the internal network and the internet. A pool of floating IP addresses were
created that could be assigned to instances so that they may have an address for
internet connectivity. Instances with assigned floating IPs were tested by pinging
the OpenStack.org web domain. Floating IPs could be assigned either through the
Horizon dashboard or using the OpenStack CLI.
Neutron has security features in the form of firewall rules. Two sets of rules, one
for ingress and one for egress govern the traffic permitted in the network. By default
instance security groups do not allow any traffic at all and each type of traffic must
be added. VMs are assigned to security groups who share the same set of security

59
rules. These rules were specified by an IP protocol, port numbers, and IP ranges [44].
For example, to allow ping to work, the Internet Control Message Protocol was the
IP protocol, port numbers and IP ranges were set to any. An ingress rule was also
created for TCP on port 22 used for SSH. Once the networking was confirmed to work,
a Terraform script describing the networking infrastructure was created to facilitate
ease of network modifications and enable version control. Credentials were carefully
excluded from version tracked Terraform code for security.
The virtual networking infrastructure was visualized in the Horizon dashboard
in Figure 5.4. The virtual router connects the two networks together. An alternative
graph based view can also be visualized in Horizon.
Figure 5.4: The network topology as shown in Horizon web dashboard. The externalprovider network is connected to the internal self service network through a virtualrouter. Five VMs are attached to the self service network.
5.10 Storage
The Cinder API was installed in order to use persistent block storage in the deploy-
ment. Cinder-api and cinder-scheduler were installed on the controller node. The
cinder-api component processed API requests and communicated with cinder-volume
which resided on the storage node and interacted directly with the storage backend

60
for read and write requests. The cinder-scheduler module is useful for multi-node
storage where the scheduler would select the optimal node to place volumes on. This
is analogous to the nova-scheduler for VM placement. A cinder-backup daemon was
used for VM volume backups. A multitude of different backup storage backends
could be used as long as an OpenStack vendor driver existed. The Nova-api had to
be restarted using systemctl to be able to use Cinder for volume storage. On the
storage node, LVM was used for providing block storage to the OpenStack cluster.
Ceph will be used in the final production version of the new NRDC infrastructure,
but for the time being as the Ceph backend was being worked on, LVM was used.
LVM volumes were created directly on the storage node using pvcreate to create the
physical volume and vgcreate to create the LVM volume group. The cinder-backup
component was installed on the block storage node. Cinder-volume is able to be
installed on Windows.
This service interacted with the storage backend. Initially, this was simply using
the block storage of the compute nodes which were provided through the Linux Logical
Volume Manager (LVM). Eventually, the infrastructure will include resources served
by Ceph. A test Ceph cluster was in the works before the NRDC started failing
and thus Ceph was not fully integrated into the OpenStack system. The plan was
to use the disks in the storage physical node to make a Ceph cluster. A vagrant
virtual environment was created that had a virtual ceph cluster set up. A virtual
node running the devstack single node OpenStack test stack was part of this vagrant
environment. The idea was to test the setup of Cinder to use the Ceph backend first
using a Vagrant virtual environment before installing Ceph on the physical system.
Compared to directly testing on the physical hardware, virtual environments are safer
in case of serious bugs since they do not effect the host system. The environment can
simply be deleted and a previous version launched again. A vagrant file was created
with two virtual disks to emulate a multidisk storage server. Oracle VirtualBox was
used as the hypervisor to host the VM. The official ceph ansible script was used to
install Ceph on these nodes. Vagrant was able to run this script on VM creation.

61
Then, the cinder API would use the Ceph backend drivers.
The nova configuration file had to be edited on the controller to be able to use
block storage. Cinder-Volumes handles read and write requests. Other back ends
are also possible. Cinder-backup is for backups implemented with other drivers. The
scheduler must be installed to read requests from the message queue.
Although share file storage was not implemented in this project, this was a func-
tionality that was included in the NRDC Windows Server based infrastructure and
would be desired in the OpenStack based version. This shared file system would
store data ingested from the remote sensors. OpenStack provides shared file storage
through the Manila project. Manila is able to use a Ceph backend for storage as well
through a NFS Ceph implementation.
5.11 Terraform
The Terraform installation archive was downloaded from the internet using wget,
which retrieves files from the internet in the command line. The download was then
unzipped and placed into /usr/local/bin so that the program could be accessed in
the command line. The installation was verified by running terraform version in the
terminal.
Once all OpenStack components were verified to work from following the instal-
lation documentation and using the CLI, a Terraform version of the infrastructure
was created. Since Terraform uses a declarative language, the process of modifying
the infrastructure was greatly simplified. Details of infrastructure component cre-
ation and deletion were abstracted by the Terraform tool. As a security feature of
Terraform, user credentials were stored in a separate script that was not version con-
trolled for obvious reasons. OpenStack objects are specified as resources in TCL.
Files were organized in a hierarchical structure, with the top main.tf file calling each
OpenStack service as a separate module. Variables for files such as the image files for
Glance were declared in main.tf in the root module. Child modules inherit from the
root module so any variables declared in the root were available to OpenStack service

62
modules. For example, if the image files were moved, then only the main.tf folder
has to be modified and not the Glance module. Infrastructure objects were organized
into resources inside each individual module. The syntax for a compute flavor which
is inside the Nova module is shown in Figure 5.5.
Figure 5.5: An OpenStack Nova flavor declared in TCL. Infrastructure componentsare declared in a resource block with a variety of parameters specific to each resource.This allows administrators to have a high level view of the infrastructure in onelocation and make modifications as needed directly to the TCL files.
First, an IaaS provider, OpenStack for this project, had to be specified to Ter-
raform so that it knows which API to use. User credentials had to be provided as
well so that Terraform could have access to create and destroy infrastructure compo-
nents as needed. After resources are all declared in the respective modules, an init
command had to be run to initialize Terraform inside the working directory. A verify
operation could be run in the terminal to check the infrastructure code for errors
before run time. Then, an apply command is executed which starts the process of
creating or destroying OpenStack resources. The infrastructure modifications were
verified through the OpenStack CLI or the Horizon dashboard.

63
Chapter 6
Setting Up Hybrid Infrastructure
6.1 Transfer of Old Data
Due to a disk failure, the health of the NRDC storage system was at a critical state.
The data had to be moved to an alternative storage location before data loss occurred
from additional disk failure due to correlated failures of RAID storage. This indeed
happened not long after the data was backed up. First the data was archived and
compressed for faster and more efficient transportation. A majority of the data was
in small text files which corresponded to the data output from the remote sensors.
It is more efficient to transfer a smaller number of small files compared to lots of
small files due to the metadata and transfer negotiation that needs to happen for
each file. This was confirmed by testing Globus transfers with a few small files.
The total transfer of all NRDC data was estimated to take months. Therefore, the
data was archived into a ZIP format and then compressed into a LZMA 2 format.
LZMA 2 is a common lossless compression algorithm with good compression rates
using a dictionary scheme [2]. The data was compressed from 36 TB to 10 TB. Total
transfer time over Globus took two weeks. The data was transferred to a storage
node. Specifications of this node are described in the next section.
6.2 Hardware
As this is a work in progress, the hardware is in flux, however, the following hardware
is used for the current system at the time of writing. The storage server is a Super-

64
micro X10SRi-F server with 62 GB of RAM. The server has two server CPUs which
are Intel Xeon E5-2630 v3 running at 2.4 GHz. Each processor has 8 cores with two
threads per core. There are a total of thirteen 9.1TB disks. One is set up as a hot
swap, while the other 12 are configured as RAID 60.
The infrastructure currently has one compute node which is a Supermicro SVR2019
ESS 1809.2 with 32GB of RAM. There is one CPU on this rack server the Intel E-2236
running at 3.4 GHz. This CPU has 6 cores with two threads each. The server has a
1 TB hard drive for local storage. The storage and compute nodes are connected to
the university research network.
6.3 Software
The storage server was implemented using Zettabyte File System (ZFS). ZFS is unique
in that it manages all aspects of storage from the physical devices to the file system.
It features an integrated software RAID, referred to as RAID-Z, that has several
advantages over hardware RAID systems. RAID-Z uses copy on write to ensure
atomic writes which solves the write hole problem that plagues RAID-5 [33]. This
phenomenon occurs because RAID does not have atomic writes so inconsistent data
can occur if there is a power disruption in the middle of an update. RAID-Z also
supports partial striping for writes that are smaller than the number of disks. This
results in greater flexibility than full-stripe writes. Finally, ZFS uses a 128-bit file
system that responds better to scaling. Ceph is also able to utilize ZFS backend as
a volume provider, which is important for future development and integration with
Ceph infrastructure [15].
Total failure of the old NRDC infrastructure happened so suddenly that the
compute server had to be set up with great haste as a parsimonious bare-metal server.
The services of the old NRDC were triaged. Currently, only the data acquisition
service using LoggerNet is running on the hybrid compute node. It was vital that
no incoming data from the remote sensor towers was lost so this service was set
up first. As long as the data is preserved and saved in the storage node, the new

65
NRDC infrastructure could be designed and set up without worry. The vision for the
infrastructure is to use a microservices architecture for efficiency and modularity. In
this architecture, each service is self contained and implemented as a container. This
reduces the complexity and makes it easier to administrate and debug. The hybrid
infrastructure will be built and deployed piece by piece instead of designing and
deploying all services at once. This is to decrease the time to make the infrastructure
minimally functional so that researchers can once again access the data through the
web portal. The next service to be re-implemented will be the webcam servers. The
last integral piece is the database. The hybrid infrastructure is still in the early stages
of design and constantly in flux.
66
Chapter 7
Comparison of Approaches
7.1 Interface Comparison
OpenStack remote administration can be done through a web browser by connect-
ing to the Horizon dashboard hosted on the controller. Horizon is mainly tested on
FireFox and Chrome, but other browsers such as Safari and Microsoft Edge are also
supported [95]. The NRDC Windows Server based infrastructure included a cus-
tom designed web monitor with administrative functionality for individual services
discussed in Section 4.3. Compared to the OpenStack Horizon dashboard, the func-
tionality of the web monitor is very limited. Modifications to the virtual infrastructure
such as starting and stopping instances or launching new ones had to be performed
through directly connecting to a physical node in the cluster using RDP. While Open-
Stack requires direct connections to install new features, many virtual infrastructure
tasks such as launching instances, creating flavors, uploading images, and creating
network components can be performed through the Horizon web dashboard. Direct
connections introduce a security risk as inadvertent changes to the host system are
possible. There is a potential that running services could be compromised. Therefore,
direct connections should be minimized. In this regard, OpenStack offered a more
secure solution compared to the NRDC Windows environment. Microsoft does offer
an online dashboard solution through their System Center datacenter management
suite, but it requires the purchase of a separate license not included with Windows
Server and was not incorporated into the original NRDC infrastructure. There are

67
also third party tools that enable web administration such as Hv manager which has
limited trial functionality with additional features unlocked with purchase of the full
license [7]. Although unnecessary for the current needs of the NRDC infrastructure,
OpenStack Horizon also offers tenant isolation for multi-tenant environments. Access
to Horizon is controlled by user accounts, which can be separated by tenant so that
users in one group cannot see the infrastructure and resources of others.
Figure 7.1 shows the main page of the Windows Hyper-V Manager used in the
NRDC infrastructure. This is the equivalent graphical interface to the OpenStack
Horizon interface, except it is not accessible from a web browser. The Hyper-V
Manager manages different resources such as compute, storage,a and network through
separate tools that are opened from the main Hyper-V interface. This can be seen
on the right side of Figure 7.1, under the Actions section. There are buttons to
launch Virtual Switch manager and Virtual SAN Manager for networking and storage
respectively. A list of physical servers are listed on the rightmost window. Upon
selection of a physical server, virtual machines are displayed in the top window. The
Hyper-V interface has many more buttons and icons than the OpenStack Horizon
interface. Hyper-V Manager could be more overwhelming for new users and inhibit
usability.
Horizon also offers more visualization options for resource usage.
7.2 Timing Comparisons
Instance launch and deletion performance timings were gathered to study the effects
of various parameters discussed in subsequent sections. Instance launch time can be
used as a proxy to measure migration and dynamic scalability performance as these
two processes involve launches and deletions [1]. For systems with large amounts of
VMs, instance launch time can have a dramatic effect on performance.
Timing data for the OpenStack infrastructure was gathered using both the Open-
Stack CLI and the Python interface to compare the differences between the two. A
bash script was written for the OpenStack CLI version and a Python script was

68
Figure 7.1: The main interface of the Windows Hyper-V Manager from which it ispossible to perform administrative tasks on the virtual infrastructure [57]
Figure 7.2: The main page for the Horizon web interface showing an virtual resourceusage. The menu on the left hand side organizes the difference OpenStack services.

69
written for the Python interface version. Both scripts had the same functionality of
launching or deleting instances through the OpenStack Nova service. Three timings
were gathered for each launch or delete event that corresponded to the API run time.
The CLI launching script used the Linux time package which output real, user, and
system (sys) time. The real time corresponded to the period of time elapsed from the
start of execution to the termination of the executed command. User time described
the CPU time taken by the executed command. Sys time is the CPU time used by
the system on behalf of the command [27]. Sys and user times were added together
to describe the total time used by the CPU. This was denoted as CPU time in the
reported data. Timings in the Python script were provided by two libraries that
mimicked the output of the Linux time library, so that the two interfaces could be
accurately compared. The Python time library was used to capture real time, and
the resource library for user and sys times. An elapsed time was calculated from the
timestamps before and after the launch function in both scripts. Setup code for the
launches were excluded from the timings because it was an asymmetric process. The
Python version required additional setup steps involved with instantiating OpenStack
module objects, whereas this process was abstracted by the CLI.
Figure 7.3: Left: VM state showing the instance is being built. Right: VM stateshowing the instance is active. The user is able to perform other tasks through theCLI while the VM is still being built, but the instance is not ready to use yet.
The OpenStack architecture was designed such that the console returns control
to the user after the API call was finished but the instance itself was still being built
and unavailable for use. The timings described previously only capture the time that
the API call took but not the total build time for the instance. This is evident by
the status of the instances as shown in Figure 7.3. The server list command could

70
CirrOS Windows 10vCPU 1 2RAM 64 MB 2 GBDisk 1 GB 20 GBImage Size 12.13 MB 9.16 GB
Table 7.1: The two flavors used for testing. One used for CirrOS image and one forthe Windows 10 image.
be called while the instance is still in the building phase. Instances in this state
cannot be accessed or perform any real work so these API timings are insufficient to
represent the performance of the whole process. Fortunately, there are four additional
timings that were accessed from the Nova logs on the compute servers. For launching,
there were spawn and build times. Spawn time refers to the time taken to create the
guest on the hypervisor while build time refers to the whole process, which includes
scheduling and allocation of network resources [92]. For the deletion process, spawn
and build times were replaced with delete on hypervisor and time taken to deallocate
network resources assigned to the instance.
Instances were launched and deleted in batches of five. This number was lim-
ited by the resources of the compute node. Scripts were run from the controller
node, which then automatically communicates with the compute nodes to perform
the actual spawning or deletion processes. Two different images were used for test-
ing; Windows 10 and CirrOS. The flavors corresponding to the images is shown in
Table 7.1.
7.2.1 Performance analysis of OpenStack CLI versus ThePython Interface
In addition to the visual based OpenStack Horizon dashboard, there are two main
administration interfaces to the OpenStack infrastructure. The first is the OpenStack
CLI which enables management through a terminal emulator. The source code reveals
that the CLI is implemented using the Python API [97]. The CLI is essentially
a wrapper for the Python API; trading ease of use for a reduction in functionality.

71
Timings were compared between the two interfaces to determine which version should
be used for the best performance as decided by the shortest timing. Both the Windows
10 and CirrOS instances were tested. For each instance type, timings were compared
between the CLI and the Python script. T-testing was used to determine if there
were any statistically significant differences between timings for the two interfaces.
Table 7.2 is the results from instance launch and Table 7.3 is the results from instance
deletion.
Statistically significant differences were found between the two interfaces for all
timings across both instance types and for both instance launch and deletion. Ex-
tremely low p-values indicate a high confidence that these differences exist. Figure 7.4
and Figure 7.5 summarize the timing differences between the CLI and python APIs
through a bar graph of the means with the standard deviations. For both instance
launch and deletion, the Python interface performed better for the API call timings:
real, user, sys, and CPU and worse for the backend spawn, build, delete on hypervi-
sor, and delete on network timings. These differences are most likely caused by the
additional overhead of the CLI version. The CLI instance launch and deletion code
has numerous parsing steps to process user input arguments and invoke the necessary
Python methods. This parsing was obviously not included in the rival Python script.
However, the worse performance of the Python version for backend processes
was unexpected. The Python versions took about double the time for spawning
and building even though the OpenStack CLI calls the same server create function
from the Compute API that was used in the Python launch script. Intuitively, the
performance should be the same between the two scripts, since the backend process
should be the same. Differences were much smaller for instance deletion, but the same
trend is still present. The official documentation does not have much information
on how the backend timings are recorded, only defining the processes as discussed
previously. It is unclear what the origin of the performance discrepancy is. There
could be optimizations that are present in the CLI version, but the source code does
not reveal any obvious answers. Further research is needed to determine the cause of

72
CirrOS Real User Sys Spawn Build CPUt-statistic 17.65 40.86 7.184 -7.273 -7.542 33.87p-value 6.65E-20 5.18E-33 1.39E-08 1.05E-08 4.60E-09 5.36E-30
Windows Real User Sys Spawn Build CPUt-statistic 18.58 36.68 8.701 -7.425 -7.567 31.73p-value 1.14E-20 2.82E-31 1.41E-10 6.60E-09 4.26E-09 5.88E-29
Table 7.2: T-test results for OpenStack CLI versus Python interface for instancelaunching. Top table corresponds to t-statistics and p-values for the CirrOS imageand flavor. Bottom table represents the Windows 10 image and flavor. Real, User,and Sys time correspond to the API call, while Spawn and Build time correspond tothe background OpenStack processes. CPU time is the total time the CPU spent exe-cuting the launch command and is the result of user plus sys time. the P-values <0.05are deemed to be statistically significant differences.
this performance decrease.
The CLI is recommended to be used, at least for instance launching. Even though
the Python launch script had better API times, adding the real time to the spawn
or build times in the CLI case yields faster launches overall. The CLI can be called
directly from the terminal and does not require the additional setup steps associ-
ated with the Python interface. The Python API should be used if programmatic
administration of the virtual infrastructure is required or if finer control is needed.
7.2.2 Effects of image resources on performance
The effects of instance resource allocation was compared to determine if instances
with more resources and heavier operating systems would result in longer launch
or deletion times. CirrOS, a lightweight Linux distribution, was compared against
Windows 10 which was the more heavyweight operating system. The two instance
types also differed in the flavors used. Table 7.1 shows the differences between the
two flavors used. Windows 10 was chosen as it was a carryover from the old NRDC
infrastructure. To minimize compatibility issues of integral NRDC services, Windows
10 will most likely be used in the future infrastructure as well. CirrOS was chosen
because it is an extremely lightweight (<15 MB) Linux distribution. The drastic

73
CirrOS Real User Sys Hypervisor Network CPUt-statistic 27.55 27.92 9.076 -8.469 -2.545 43.14p-value 1.02E-26 6.24E-27 4.70E-11 2.79E-10 0.0151 6.87E-34
Windows Real User Sys Hypervisor Network CPUt-statistic 26.42 25.94 12.71 -4.569 -2.53 43.03p-value 4.64E-26 8.98E-26 2.96E-15 5.06E-05 0.01567 7.54E-34
Table 7.3: T-test results for OpenStack CLI versus Python interface for instancedeletion. Top table corresponds to t-statistics and p-values for the CirrOS image andflavor. Bottom table represents the Windows 10 image and flavor. As opposed toSpawn and Build times, for deletion, there are Hypervisor for deletion on hypervisorand Network for network resource deallocation timings.
Figure 7.4: Bar graph of the means of CLI vs. Python for all launch timings. Thelines protruding from the bars are the standard deviations. The CLI performed fasterin the API call timings, but worse for the backend spawn and build timings.

74
Figure 7.5: Bar graph of the means of CLI vs. Python for instance deletion timings.Much like the launch timings, the CLI performed better for API calls, but worse forthe backend delete on hypervisor and delete on network.
juxtaposition of the two instance types was expected to exaggerate any performance
differences if any exist. Twenty launch and deletes were tested for each instance type
in batches of 5. Both the CLI and Python interfaces were tested to see if trends
persisted across interface type.
Hypothesis testing was performed on each timing using t-tests. For instance
launching, the results are summarized in Table 7.4 for both CLI and Python interfaces.
From the table, statistically significant differences between the Windows 10 instances
and the CirrOS instances were found only for real and sys timings when using the
OpenStack CLI.
The real time is influenced by other processes running at the same time. This
could be a potential source of error that manifested the results of the t-test. A violin
plot of the real time, the first panel on the left of Figure 7.6, shows a large range for
the CirrOS instances. This indicates that the spread is very large which means there
was a lot of variance between each launch. Other processes running while the launch
command was executed could be the source of this variance. Figure 7.7 is a strip plot

75
representation of the data which shows exactly how disperse the data was for real
time, especially for the CirrOS instance. The majority of launches overlapped for the
real timing as seen by the shape of the probability densities in the interquartile range
of the violin plots. This trend is also visualized in the strip plots in Figure 7.7.
Sys time, however, corresponds only to the time used by a single command so
it is not affected by other processes running concurrently on the CPU. It is a better
indicator of real performance differences. The violin plots of the timings used for the
t-test, shown in in Figure 7.6, provide more evidence that the timing differences could
be due to errors. It should be noted that the total CPU time for the CLI launch,
calculated from user and sys time, revealed no differences between the Windows 10
and CirrOS instances.
The corresponding violin plot for the real time indicates that a large part of the
interquartile ranges for both instance types are overlapping. The range for the CirrOS
real time was also very large. The sys timing also displays a similar trend. The peaks
of the kernel density estimations are almost perfectly overlapping. A majority of the
data points are very close to each other with some values in the Windows 10 timings
trending higher, thus shifting the average and causing the t-test to give a small p-
value. Figure 7.7 is a strip plot showing all of the data points for each timing. The
graphs for real and sys timings show that data points are closely clusters with a few
outliers. Adding more data points would reduce statistical noise and possibly cause
the t-test results to change in favor of the null hypothesis.
Furthermore, the API calls returned control to the user before instances are in
the running state, as shown in Figure 7.3. This observation implies that API calls
do not capture the whole instance processing time and may no be indicative of real
performance. To capture the whole picture, the backend spawning and build processes
must be analyzed. For all cases tested, there was no differences found for these timings
as seen in Table 7.4 for instance launching.
An additional test was performed to study the effects of memory allocation. The
image was kept constant as a control in this test. The Windows 10 image was used to

76
CLI Real User Sys Spawn Build CPUt-statistic 2.455 1.301 -2.178 1.084 1.309 -0.4867p-value 0.0188 0.2011 0.0357 0.2853 0.1984 0.6292
Python Real User Sys Spawn Build CPUt-statistic -0.349 0.5782 -0.8786 7.37E-03 0.03749 -0.3946p-value 0.729 0.5665 0.3851 0.9942 0.9703 0.6953
Table 7.4: T-test results for instance launching times. The top table is timings fromthe CLI version and the bottom table is for the Python version. The independentvariable is the type of instance launched: the lightweight CirrOS versus the heavierWindows 10 instance. Real, User, and Sys time correspond to the API call, whileSpawn and Build time correspond to the background OpenStack processes. CPUtime is the total time the CPU spent executing the launch command and is the resultof user plus sys time. the P-values <0.05 are deemed to be statistically significantdifferences.
Figure 7.6: Violin plots of instance launch timings using the CLI comparing CirrOSand Windows 10 instances.

77
Figure 7.7: Strip plots of instance launch timings using the CLI comparing CirrOSand Windows 10 instances. Most timings had significant overlapping.
more realistically represent the NRDC instances. Both launch and deletion processes
were timed. A modified version of the Windows flavor outlined in Table 7.1 was
created where the only difference was an increase of allocated RAM to 8 GB from
2 GB. 10 instances were launched and compared against prior launch timing using
the unmodified flavor. Results are summarized in Table 7.5 for the launch timings
and Table 7.6 for deletion timings. The top tables are using the CLI and the bottom
tables are using the Python API. No differences were found in any of the timings.
Based of this evidence, RAM allocation does not have an effect on instance launch or
deletion performance.
Hypothesis testing of the test cases using the Python API did not reveal differ-
ences for any timings. Results are tabulated in the bottom table of Table 7.4. All p
values were greater than 5% so the null hypothesis could not be rejected. Therefore,
resource allocation did not appear to have any effect on performance when using this.
This suggested that the differences found in the OpenStack CLI version were due to
factors other than instance resource and image size; either from differences between
the CLI and Python API, or alternative sources of errors.
The deletion process was tested using the same methodology to the launch tim-

78
CLI Real User Sys Spawn Build CPUt-statistic -1.565 -0.9082 0.4688 -1.764 -1.642 -0.0848p-value 0.135 0.3756 0.6448 0.0947 0.1179 0.9333
Python Real User Sys Spawn Build CPUt-statistic 0.097 -1.157 1.446 0.1952 0.2758 0.7602p-value 0.9238 0.2623 0.1653 0.8474 0.7859 0.457
Table 7.5: T-test results from launch timings of Windows 10 instance with 2 GB ofRAM vs. Windows 10 instance with 8 GB of RAM. The top table was from usingthe CLI and the bottom table was from launches using the Python API.
CLI Real User Sys Hypervisor Network CPUt-statistic 0.112 -1.588 1.568 -1.701 0.0626 0.34p-value 0.912 0.1296 0.1342 0.1062 0.9508 0.7378
Python Real User Sys Hypervisor Network CPUt-statistic 0.4185 0.1826 1.349 -2.052 -0.1523 1.288p-value 0.6805 0.8572 0.1942 0.055 0.8806 0.214
Table 7.6: T-test results from deletion timings of Windows 10 instance with 2 GB ofRAM vs. Windows 10 instance with 8 GB of RAM. The top table was from usingthe CLI and the bottom table was from deletions using the Python API.
CLI Real User Sys Hypervisor Network CPUt-statistic 1.164 -0.4572 0.2704 -0.9022 0.04744 -0.3214p-value 0.2516 0.6501 0.7883 0.3726 0.9624 0.7487
Python Real User Sys Hypervisor Network CPUt-statistic -0.656 -2.125 4.509 0.7429 0.6606 -0.242p-value 0.5158 0.04012 6.08E-05 0.4621 0.5129 0.81
Table 7.7: T-test results for instance deletion times. The independent variable is thetype of instance launched: the lightweight CirrOS versus the heavier Windows 10instance. P-values <0.05 are deemed to be statistically significant differences.

79
ings. Instead of spawn and build times, the deletion tests had delete on hypervisor
and deallocation of resource timings. These were also found within the Nova logs on
the compute nodes. Results of hypothesis testing are summarized in Table 7.7. Un-
like the launch time, there were no significant differences found in any of the timings.
This is expected as the scheduling to release virtual resources should not have an
effect on performance. Differences were expected in delete on hypervisor as it should
take more time to release more resources for the Windows 10 instances, however this
was not observed.
7.3 Storage Backend Comparison
Although performance measurements could not be captured due to failure of the
NRDC RAID system, there are several features of Ceph that make it attractive for
application to the NRDC. The most significant is resiliency to disk failure. The NRDC
storage infrastructure was a Distributed File System (DFS) with physical disks ar-
ranged as RAID 6+0 for redundancy and failure tolerance. Apart from the disad-
vantages related to scalability and hardware heterogeneity discussed in Section 2.5.4,
one of the main disadvantages of RAID is the increased failure rate of subsequent
disks after the first failed disk. This phenomenon is known as correlated failures and
is caused by the fact that at the point of the first failure, the other disks are ap-
proaching their end of lives as well. Since the disks must be identical in RAID, they
also have identical wear durabilities. Therefore, there is an increased chance of data
becoming unrecoverable due to multiple disk failures. This was observed first hand
in the NRDC infrastructure, where the whole storage system was unusable only a
few months after a single disk failed. Fortunately, the data was replicated elsewhere
before total failure occurred. Compared to RAID, Ceph is more space efficient since
it is able to leverage erasure coding for redundancy as discussed in Section 2.5.5.
Ceph also supports heterogeneous disks since it treats physical disks as logical
volumes. This is opposed to RAID which requires the same disks in the cluster. As
storage technology changes over the years, it can be difficult to replace disks in a

80
RAID setup if it is using discontinued products. Meanwhile, Ceph is able to accept
arbitrary disks which simplifies upgrades and replacements.
7.4 Other Considerations
A major factor for non-profit research groups is the capital cost associated with
constructing and maintaining virtual infrastructure. OpenStack has an open source
license so all functionality of OpenStack is offered free of charge. Microsoft offers a
free evaluation edition of Windows Server that is limited in features. A full license
of Windows Server 2019 Edition costs $501 USD for the cheapest Essentials edition
and up to $6,155 USD for the most expensive Datacenter license [47]. These prices
are per physical processing core, so prices can be quite high for even a modest server
infrastructure. If the OpenStack server, consisting of 1 controller node, 7 compute
nodes, and 1 storage node all with 6 core CPUs were fully licensed with Windows
Server 2019, it would cost between $27,054 USD for the cheapest license and $332,370
USD for the most expensive one.
OpenStack also has a very rapid release schedule of six months. New features
are added at a rapid pace. Being Open source, there is much integration with other
products like Terraform, Ansible, and Ceph. Developers are free to build their own
tools using the Python API if there are features they desire but do not already exist.
The community is also very large and there are many places to look for help and
support. If all else fails, the source code can be analyzed for answers.

81
Chapter 8
Conclusions and Future Work
8.1 Conclusions
This research was an exploration of an OpenStack based virtual infrastructure to
replace the aging NRDC which used Microsoft Server. The NRDC cluster operated
as a data streaming service that captures environmental data from remote sensors and
makes it available to researchers through a web portal. The motivation behind this
migration was that the NRDC was using aging hardware that needed to be replaced.
There had also been many innovations and technological shifts in cloud computing
since the initial construction of the infrastructure. It was the perfect time to upgrade
the NRDC onto more modern solutions. OpenStack was considered because it is
open source so there are no capital costs and there is a wide community of support.
Being open source, there are many products that integrate well with OpenStack and
there is always the option to develop software solutions when one does not exist. The
goal of this thesis is to provide insight into the setup and decision making process
of building an OpenStack infrastructure. The thesis research encompassed control,
compute, networking, and storage elements.
This thesis started off with an introduction into the origins of cloud computing
and why it has become so widespread in recent years as well as the motivations behind
this project. The NRDC infrastructure was introduced followed by a discussion about
the primary enabling technology called virtualization. The OpenStack architecture
and the key services: Keystone, Neutron, Nova, Glance, Cinder, Swift, and Manila

82
were outlined in detail.
A test cluster was constructed using 1 controller node, 7 compute nodes, and 1
storage node. They were networked together using a switch and had outside connec-
tivity through a router. Only the controller node and 1 compute node were installed
with the OpenStack services for testing as this was the bare minimum requirements.
The installation of Nova onto the first compute node can be repeated to other com-
pute nodes with relative ease. As the storage was not required for testing, it was
not set up to be used. OpenStack services were installed manually to gain a deeper
understanding of the components and how they interplay. This also simplified debug-
ging as errors could be tracked down after each step compared to using a deployment
tool. Once the services were installed, virtual networking was configured to enable
software defined network for flexibility. A subnetwork for VMs was created that con-
nected to the internet through a virtual router. Windows and Ubuntu test instances
were launched as a preliminary check of compatibility with NRDC instances which
used the aforementioned operating systems. The Horizon dashboard was set up so
that administration could be performed through a accessible visual interface from a
web browser. Once basic functionality was confirmed, a Terraform script describing
the infrastructure was created so that the infrastructure was readable and could be
easily replicated for future research.
The old NRDC hardware failed before the OpenStack was ready for migration, so
a hybrid architecture was built to house data backups and to prevent data loss from
the streaming sensor towers. Data from the old NRDC was backed up to another
storage server before total failure. Transfers were accomplished using the Globus file
transfer program. 10 TB of compressed data was transferred in two weeks. One bare
metal server was set up with LoggerNet to keep storing incoming data from sensor
towers.
A qualitative comparison of the visual interfaces of the two infrastructure types
were compared. Specifically, the OpenStack Horizon web dashboard was compared
to the Microsoft Hyper-V Manager interface. Quantitative analysis was performed on

83
OpenStack instance launching and deletion timings. Instance launch timings can be
used to approximate the performance of server migration and dynamic load balancing.
This provides insight into how to optimize the migration of the old NRDC. Timings
were gathered through the use of scripts to eliminate timing variance from human
input. Three timings corresponding to the API calls were timed, these were: real,
user, and sys. Four timings were collected that corresponded to the backend processes
of launch and deletion. These were spawn and build for instance launching, and delete
on hypervisor and network deallocation for deletion.
First, the CLI was compared against the Python API. T-testing confirmed that
there was real difference between the two interfaces. The CLI performed worse for
the real, user, and sys timings but much better for the backend processes. This
behavior was unexpected because the source code indicated that the CLI is built
using the Python API. Since the Python and CLI versions share the same Python
backend, the spawn, build, delete on hypervisor, and network deallocation timings
were expected to be indistinguishable. Analysis of the source code did not reveal
any clear answers. Perhaps there were subtle optimizations that resulted in the faster
timings. For instance launching, the spawn and build processes made up the majority
of the total timing of the instance launch process. The CLI is recommended to be
used since it performed much better in those two operations. For instance deletion,
the timing differences were smaller, with the exception of real time where the Python
version outperformed the CLI by more than five times. The Python API would be
the better choice here from a purely performance standpoint, but the consistency of
using the CLI for both launch and deletion might outweigh the performance benefit.
Other than performance, the CLI trade off for abstraction is that it is not as flexible
or has as deep of functionality as the Python API. If these features are desired, then
the Python API should be chosen.
Next, the effects of resource allocation and image size on launch and deletion was
tested. A lightweight CirrOS image was compared against a Windows 10 image. The
Windows 10 used a flavor that allocated more virtual CPUs, more RAM, and more

84
storage than the cirrOS. Both interfaces were used for this testing as well. T-tests
showed that there were no differences except for the real and sys launch times when
using the CLI. The real time is influenced by background processes that are running
concurrently, so it could be an explanation for the differences. The kernel density
revealed that the majority of timings between the two instance types were indeed
overlapping. The sys time however is not affected by other processses, but the kernel
density indicates that the data points collected are mostly overlapping. Increasing
the sample size could make these differences disappear.
Because of these differences, an additional test was performed on the Windows
10 image using flavors that differed in the amount of RAM allocation. The original
Windows 10 flavor using 2 GB of RAM was compared against a flavor with 8 GB.
All other parameters were held constant. There were differences found in any case
for these tests which is further evidence that there was no effect of virtual resource
allocation on launch or deletion performance. Assuming there are enough virtual
resources to accommodate all desired instances, there appears to be minimal gains
from optimization of flavors or image footprints.
The RAID storage backend of the old NRDC was compared to the planned Ceph
storage that is to be used in the OpenStack cluster. Several main advantages of Ceph
over hardware RAID is discussed. The comparison section ends with a discussion of
other advantages of the open source model of OpenStack versus the profit model for
Windows Server.
8.2 Future Work
The current OpenStack cluster does not have any storage services running. All in-
stances use local volumes on the compute node. Ceph needs to be installed onto the
storage node and configured with the OpenStack storage services: Cinder, Swift, and
Manila. Testing needs to be done to determine the performance and functionality of
OpenStack storage. The OpenStack database service, Trove, needs to be bring back
the database service of the Windows Server NRDC back online.

85
The cause of the performance differences between the OpenStack CLI and Python
API for backend timings is still unknown. Further research needs to be done to
determine the root cause of this. For resource allocation and image type testing,
more samples need to be collected to see if differences found in the real and sys time
were due to a small sample size or other random errors. Instance launching and
deletion testing should be repeated on a Windows Server infrastructure to determine
any performance differences between the two platforms. A Powershell script would
need to be developed to compare to the CLI bash script.
Once all necessary OpenStack components are verified to work, the old NRDC
images need to be launched on the OpenStack cluster to determine if any modifica-
tions need to be made in order to run. Then instances can be migrated over to the
OpenStack and checked to ensure the same functionality as the old NRDC cluster.
The virtual architecture can then be described in code via a Terraform configura-
tion file for easier management and readability. After original NRDC functionality
is online, a microservices architecture could be explored to increase efficiency and
modularity.
Provisioning automation would be another area of research. While Terraform
can be used to deploy virtual networking and compute resources, it cannot install
the OpenStack services onto the physical servers. There are two popular tools that
can accomplish this: Ansible and Juju. The trade offs between the two need to be
studied to determine which one should be used for the production cluster. There are
official Ansible [86] and Juju [80] OpenStack documentation for setup.
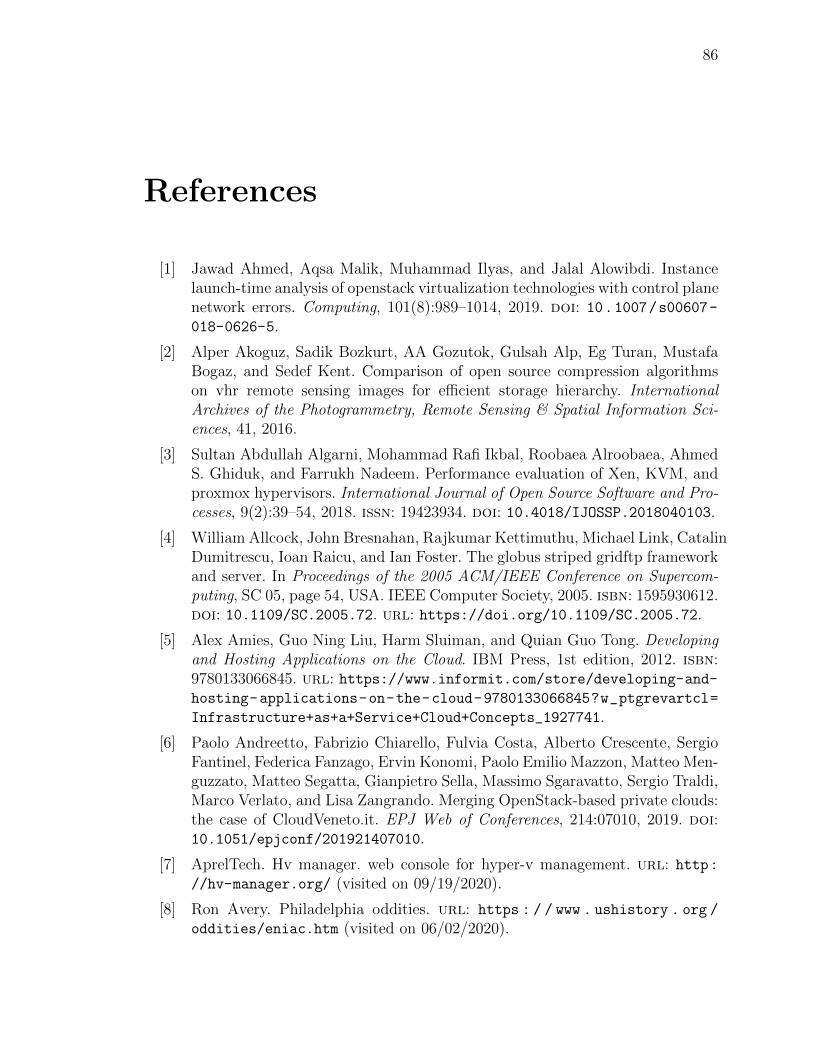
86
References
[1] Jawad Ahmed, Aqsa Malik, Muhammad Ilyas, and Jalal Alowibdi. Instancelaunch-time analysis of openstack virtualization technologies with control planenetwork errors. Computing, 101(8):989–1014, 2019. doi: 10.1007/s00607-018-0626-5.
[2] Alper Akoguz, Sadik Bozkurt, AA Gozutok, Gulsah Alp, Eg Turan, MustafaBogaz, and Sedef Kent. Comparison of open source compression algorithmson vhr remote sensing images for efficient storage hierarchy. InternationalArchives of the Photogrammetry, Remote Sensing & Spatial Information Sci-ences, 41, 2016.
[3] Sultan Abdullah Algarni, Mohammad Rafi Ikbal, Roobaea Alroobaea, AhmedS. Ghiduk, and Farrukh Nadeem. Performance evaluation of Xen, KVM, andproxmox hypervisors. International Journal of Open Source Software and Pro-cesses, 9(2):39–54, 2018. issn: 19423934. doi: 10.4018/IJOSSP.2018040103.
[4] William Allcock, John Bresnahan, Rajkumar Kettimuthu, Michael Link, CatalinDumitrescu, Ioan Raicu, and Ian Foster. The globus striped gridftp frameworkand server. In Proceedings of the 2005 ACM/IEEE Conference on Supercom-puting, SC 05, page 54, USA. IEEE Computer Society, 2005. isbn: 1595930612.doi: 10.1109/SC.2005.72. url: https://doi.org/10.1109/SC.2005.72.
[5] Alex Amies, Guo Ning Liu, Harm Sluiman, and Quian Guo Tong. Developingand Hosting Applications on the Cloud. IBM Press, 1st edition, 2012. isbn:9780133066845. url: https://www.informit.com/store/developing-and-hosting-applications-on-the-cloud-9780133066845?w_ptgrevartcl=
Infrastructure+as+a+Service+Cloud+Concepts_1927741.
[6] Paolo Andreetto, Fabrizio Chiarello, Fulvia Costa, Alberto Crescente, SergioFantinel, Federica Fanzago, Ervin Konomi, Paolo Emilio Mazzon, Matteo Men-guzzato, Matteo Segatta, Gianpietro Sella, Massimo Sgaravatto, Sergio Traldi,Marco Verlato, and Lisa Zangrando. Merging OpenStack-based private clouds:the case of CloudVeneto.it. EPJ Web of Conferences, 214:07010, 2019. doi:10.1051/epjconf/201921407010.
[7] AprelTech. Hv manager. web console for hyper-v management. url: http://hv-manager.org/ (visited on 09/19/2020).
[8] Ron Avery. Philadelphia oddities. url: https : / / www . ushistory . org /
oddities/eniac.htm (visited on 06/02/2020).

87
[9] Yevgeniy Brikman. Terraform: Up and Running. O’Reilly Media, Inc., 1st edi-tion, 2016.
[10] V. K. Bumgardner. OpenStack in Action. 2016, page 358. isbn: 9781617292163.url: https://www.manning.com/books/openstack-in-action.
[11] Rajkumar Buyya, Yogesh Simmhan, Luis Miguel Vaquero, Marco A S Netto,Maria Alejandra Rodriguez, Carlos Varela, Hai Jin, Albert Y Zomaya, S NSrirama co, M A Rodriguez, R Calheiros, B Javadi, De Capitani di Vimercati,P Samarati, A Y Zomaya, Satish Narayana Srirama, Giuliano Casale, RodrigoCalheiros, Blesson Varghese, Erol Gelenbe, Bahman Javadi, Adel NadjaranToosi, Ignacio M Llorente, Sabrina De Capitani di Vimercati, Pierangela Sama-rati, Dejan Milo-jicic, Rami Bahsoon, Marcos Dias de Assuncao, Omer Rana,Wanlei Zhou, Wolfgang Gentzsch, and Haiying Shen. A Manifesto for Fu-ture Generation Cloud Computing: Research Directions for the Next Decade.ACM Computing Surveys, 51(5), 2018. doi: 10.1145/3241737. url: https://doi.org/10.1145/3241737.
[12] Martin Campbell-Kelly and Daniel D. Garcia-Swartz. From Mainframes toSmartphones : A History of the International Computer Industry. Critical Is-sues in Business History. Harvard University Press, 2015. isbn: 9780674729063.url: https://unr.idm.oclc.org/login?url=https://search.ebscohost.com/login.aspx?direct=true&db=e025xna&AN=1004302&site=ehost-
live&scope=site.
[13] Canonical Ltd. Bionicbeaver/releasenotes - ubuntu wiki. url: https://wiki.ubuntu.com/BionicBeaver/ReleaseNotes#netplan.io (visited on 08/24/2020).
[14] Ceph authors and contributors. Intro to Ceph - Ceph Documentation. url:https://docs.ceph.com/docs/master/start/intro/ (visited on 04/15/2020).
[15] Ceph authors and contributors. ZFS. url: https://docs.ceph.com/en/latest/dev/ceph-volume/zfs/ (visited on 12/09/2020).
[16] Walter Cerroni and Flavio Esposito. Optimizing Live Migration of MultipleVirtual Machines. IEEE Transactions on Cloud Computing, 6(4):1096–1109,October 2018. issn: 2168-7161. doi: 10 . 1109 / TCC . 2016 . 2567381. url:https://ieeexplore.ieee.org/document/7469358/.
[17] Zuo Ning Chen, Kang Chen, Jin Lei Jiang, Lu Fei Zhang, Song Wu, Zheng WeiQi, Chun Ming Hu, Yong Wei Wu, Yu Zhong Sun, Hong Tang, Ao Bing Sun,and Zi Lu Kang. Evolution of Cloud Operating System: From Technology toEcosystem. Journal of Computer Science and Technology, 32(2):224–241, 2017.issn: 10009000. doi: 10.1007/s11390-017-1717-z.
[18] Cisco. VXLAN Overview: Cisco Nexus 9000 Series Switches. Technical report,2013. url: https://www.cisco.com/c/en/us/products/collateral/
switches/nexus-9000-series-switches/white-paper-c11-729383.html
(visited on 08/26/2020).

88
[19] Contributors to openstack/keystone github. url: https : / / github . com /
openstack/keystone/graphs/contributors (visited on 12/18/2020).
[20] Intel Corporation. Intel R©Virtualization Technology (VT) in Converged Ap-plication Platforms. Technical report, 2007. url: https://www.intel.com/content/dam/www/public/us/en/documents/white-papers/virtualization-
tech-converged-application-platforms-paper.pdf (visited on 08/11/2020).
[21] Marcos Dias de Assuncao, Alexandre da Silva Veith, and Rajkumar Buyya.Distributed data stream processing and edge computing: A survey on resourceelasticity and future directions. Journal of Network and Computer Applica-tions, 103(November 2017):1–17, 2018. issn: 10958592. doi: 10.1016/j.jnca.2017.12.001. arXiv: 1709.01363. url: https://doi.org/10.1016/j.jnca.2017.12.001.
[22] dsparks. 12 Steps to Make Your IT Infrastructure More Secure: Audit YourServers. url: https://www.stratospherenetworks.com/blog/12-steps-make-infrastructure-secure-audit-servers/ (visited on 12/10/2020).
[23] etcd Authors. etcd : Home. url: https://etcd.io/ (visited on 12/09/2020).
[24] Nick Fisk. Mastering Ceph: Redefine your storage system. Pakt Publishing,second edition, 2019. isbn: 9781789610703.
[25] MariaDB Foundation. Mariadb server: the open source relational database.url: https://mariadb.org/ (visited on 08/06/2020).
[26] Paul A. Freiberger and Michael R. Swaine. Eniac, October 2018. url: https://www.britannica.com/technology/ENIAC.
[27] GEEKUNIVERSITY. Measuring time of program execution — linux. url:https : / / geek - university . com / linux / measure - time - of - program -
execution/ (visited on 10/13/2020).
[28] Jeff Geerling. Ansible for DevOps. Leanpub, 2018.
[29] Michael Hackett, Vikhyat Umrao, Nick Fisk, and Karan Singh. Ceph: De-signing and Implementing Scalable Storage Systems. Pakt Publishing, 1st edi-tion, 2019. url: https://learning.oreilly.com/library/view/ceph-designing-and/9781788295413/?ar.
[30] HashiCorp. HCL. url: https://github.com/hashicorp/hcl (visited on04/14/2020).
[31] HashiCorp. Introduction to Vagrant. url: https://www.vagrantup.com/intro (visited on 04/16/2020).
[32] HashiCorp. OpenStack Provider. url: https://www.terraform.io/docs/providers/openstack/index.html (visited on 04/14/2020).
[33] Brian Hickmann and Kynan Shook. Zfs and raid-z: the uber-fs?

89
[34] Yuan Yuan Hu, Lu Wang, and Xiao Dong Zhang. Cloud Storage Virtual-ization Technology and its Architecture. Applied Mechanics and Materials,713-715:2435–2439, 2015. doi: 10.4028/www.scientific.net/amm.713-
715.2435.
[35] Congfeng Jiang, Yumei Wang, Dongyang Ou, Youhuizi Li, Jilin Zhang, JianWan, Bing Luo, and Weisong Shi. Energy efficiency comparison of hypervi-sors. Sustainable Computing: Informatics and Systems, 22:311–321, 2019. issn:22105379. doi: 10.1016/j.suscom.2017.09.005. url: https://doi.org/10.1016/j.suscom.2017.09.005.
[36] Omar Khedher and Chandan Dutta Chowdhury. Mastering OpenStack. PaktPublishing, second edition, 2017.
[37] Charalampos Gavriil Kominos, Nicolas Seyvet, and Konstantinos Vandikas.Bare-metal, virtual machines and containers in OpenStack. In 2017 20th Con-ference on Innovations in Clouds, Internet and Networks (ICIN), pages 36–43. IEEE, March 2017. isbn: 978-1-5090-3672-1. doi: 10.1109/ICIN.2017.7899247. url: http://ieeexplore.ieee.org/document/7899247/.
[38] Krishan Kumar and Manish Kurhekar. Economically Efficient Virtualizationover Cloud Using Docker Containers. In 2016 IEEE International Conferenceon Cloud Computing in Emerging Markets (CCEM), pages 95–100. IEEE, Oc-tober 2016. isbn: 978-1-5090-4573-0. doi: 10.1109/CCEM.2016.025. url:http://ieeexplore.ieee.org/document/7819678/.
[39] LaCie. RAID Technology White Paper. Technical report, LaCie. url: https://www.lacie.com/files/lacie-content/whitepaper/WP_RAID_EN.pdf.
[40] Guohua Li, Xinhua Jin, Rongxu Xu, Yinghua Bian, Hyungjin Lee, and Sang B.Lim. Implement of multiple sdn controllers with openstack neutron network forhpc service. English. International Information Institute (Tokyo).Information,19(6):2027–2032, June 2016. url: http://unr.idm.oclc.org/login?url=https://search-proquest-com.unr.idm.oclc.org/docview/1812898752?
accountid=452. Copyright - Copyright International Information InstituteJun 2016; Document feature - Illustrations; ; Last updated - 2016-08-22.
[41] Xiao Y. Liang and Zhang C. Guan. Ceph crush data distribution algorithms.English. Applied Mechanics and Materials, 596:196–199, July 2014. url: http://unr.idm.oclc.org/login?url=https://search-proquest-com.unr.
idm.oclc.org/docview/1545891792?accountid=452. Copyright - CopyrightTrans Tech Publications Ltd. Jul 2014; Last updated - 2018-10-06.
[42] Canonical Ltd. Netplan — backend-agnostic network configuration in yaml.url: https://netplan.io/ (visited on 08/21/2020).
[43] Zoltan Adam Mann. Allocation of virtual machines in cloud data centersasurvey of problem models and optimization algorithms. ACM Comput. Surv.,48(1), August 2015. issn: 0360-0300. doi: 10.1145/2797211. url: https://doi.org/10.1145/2797211.

90
[44] Andrey Markelov. Certified OpenStack Administrator Study Guide. 2016. isbn:9781484221242. doi: 10.1007/978-1-4842-2125-9.
[45] Peter Mell and Timothy Grance. The NIST Definition of Cloud Comput-ing: Recommendations of the National Institute of Standards and Technology.Technical report 800-145, Computer Security Division, Information Technol-ogy Laboratory, National Institute of Standards and Technology, Gaithers-burg, MD 20899-8930, September 2011. url: https://nvlpubs.nist.gov/nistpubs/Legacy/SP/nistspecialpublication800- 145.pdf (visited on11/04/2020).
[46] memcached. Memcached - a distributed memory object caching system. url:https://www.memcached.org/ (visited on 08/06/2020).
[47] Microsoft. Pricing and licensing for windows server 2019. url: https://www.microsoft.com/en-us/windows-server/pricing#OneGDCWeb-Content\-
PlacementWithRichBlock-8bra924 (visited on 12/08/2020).
[48] Andrew Munoz, Frederick C Harris Jr, and Sergiu Dascalu. Nrdc data visu-alization web suite. In Gordon Lee and Ying Jin, editors, Proceedings of 35thInternational Conference on Computers and Their Applications, volume 69 ofEPiC Series in Computing, pages 32–39. EasyChair, 2020. doi: 10.29007/rkqh. url: https://easychair.org/publications/paper/pGCR.
[49] Hannah Munoz, Connor Scully-Allison, Vinh Le, Scotty Strachan, Fredrick CHarris, and Sergiu Dascalu. A mobile quality assurance application for thenrdc. In 26th International Conference on Software Engineering and Data En-gineering, SEDE, volume 2017, 2017.
[50] Farrukh Nadeem and Rizwan Qaiser. An Early Evaluation and Comparisonof Three Private Cloud Computing Software Platforms. Journal of ComputerScience and Technology, 30(3):639–654, 2015. issn: 10009000. doi: 10.1007/s11390-015-1550-1.
[51] Nevada Seismological Laboratory staff. Nevada seismological laboratory. url:http://www.seismo.unr.edu/ (visited on 12/10/2020).
[52] nvsolarnexus. Solar energy water environment nexus in nevadanvsolarnexus —nshe nsf solar nexus project. url: https://solarnexus.epscorspo.nevada.edu/ (visited on 12/09/2020).
[53] RedHat OpenShift Online. Kvm. url: https://www.linux-kvm.org/page/Main_Page (visited on 08/27/2020).
[54] Aaron Paradowski, Lu Liu, and Bo Yuan. Benchmarking the performanceof openstack and cloudstack. Proceedings - IEEE 17th International Sympo-sium on Object/Component/Service-Oriented Real-Time Distributed Comput-ing, ISORC 2014 :405–412, 2014. doi: 10.1109/ISORC.2014.12.
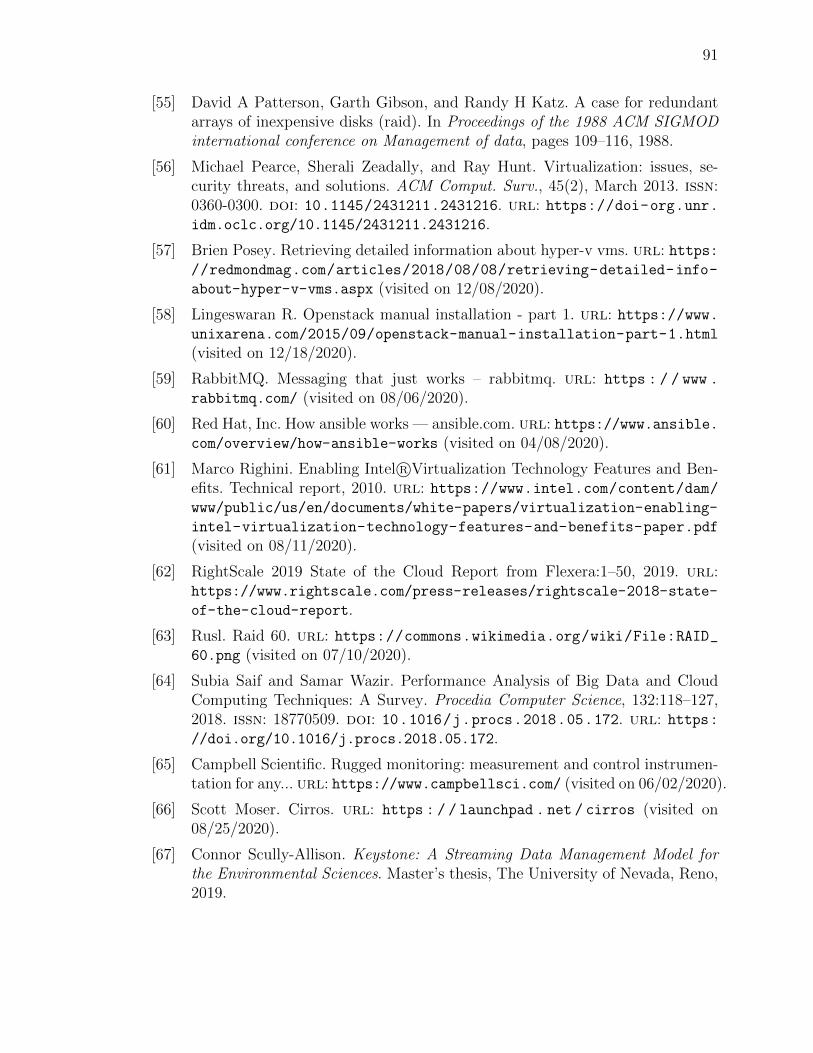
91
[55] David A Patterson, Garth Gibson, and Randy H Katz. A case for redundantarrays of inexpensive disks (raid). In Proceedings of the 1988 ACM SIGMODinternational conference on Management of data, pages 109–116, 1988.
[56] Michael Pearce, Sherali Zeadally, and Ray Hunt. Virtualization: issues, se-curity threats, and solutions. ACM Comput. Surv., 45(2), March 2013. issn:0360-0300. doi: 10.1145/2431211.2431216. url: https://doi-org.unr.idm.oclc.org/10.1145/2431211.2431216.
[57] Brien Posey. Retrieving detailed information about hyper-v vms. url: https://redmondmag.com/articles/2018/08/08/retrieving-detailed-info-
about-hyper-v-vms.aspx (visited on 12/08/2020).
[58] Lingeswaran R. Openstack manual installation - part 1. url: https://www.unixarena.com/2015/09/openstack-manual-installation-part-1.html
(visited on 12/18/2020).
[59] RabbitMQ. Messaging that just works – rabbitmq. url: https : / / www .
rabbitmq.com/ (visited on 08/06/2020).
[60] Red Hat, Inc. How ansible works — ansible.com. url: https://www.ansible.com/overview/how-ansible-works (visited on 04/08/2020).
[61] Marco Righini. Enabling Intel R©Virtualization Technology Features and Ben-efits. Technical report, 2010. url: https://www.intel.com/content/dam/www/public/us/en/documents/white-papers/virtualization-enabling-
intel-virtualization-technology-features-and-benefits-paper.pdf
(visited on 08/11/2020).
[62] RightScale 2019 State of the Cloud Report from Flexera:1–50, 2019. url:https://www.rightscale.com/press-releases/rightscale-2018-state-
of-the-cloud-report.
[63] Rusl. Raid 60. url: https://commons.wikimedia.org/wiki/File:RAID_60.png (visited on 07/10/2020).
[64] Subia Saif and Samar Wazir. Performance Analysis of Big Data and CloudComputing Techniques: A Survey. Procedia Computer Science, 132:118–127,2018. issn: 18770509. doi: 10.1016/j.procs.2018.05.172. url: https://doi.org/10.1016/j.procs.2018.05.172.
[65] Campbell Scientific. Rugged monitoring: measurement and control instrumen-tation for any... url: https://www.campbellsci.com/ (visited on 06/02/2020).
[66] Scott Moser. Cirros. url: https : / / launchpad . net / cirros (visited on08/25/2020).
[67] Connor Scully-Allison. Keystone: A Streaming Data Management Model forthe Environmental Sciences. Master’s thesis, The University of Nevada, Reno,2019.

92
[68] Pavel Segec, Jana Uramova, Marek Moravcık, Martin Kontsek, and MatildaDrozdova. Architecture design in private Cloud Computing. In 2019 17thInternational Conference on Emerging eLearning Technologies and Applica-tions (ICETA), pages 709–714, 2020. isbn: 9781728149677. doi: 10.1109/iceta48886.2019.9040070.
[69] Nicolas Serrano, Gorka Gallardo, and Josune Hernantes. Infrastructure as aService and Cloud Technologies. IEEE Software, 32(2):30–36, March 2015.issn: 0740-7459. doi: 10.1109/MS.2015.43. url: http://ieeexplore.
ieee.org/document/7057553/.
[70] P. Sai Sheela and Monika Choudhary. Deploying an OpenStack cloud com-puting framework for university campus. In 2017 International Conference onComputing, Communication and Automation (ICCCA), pages 819–824. IEEE,May 2017. isbn: 978-1-5090-6471-7. doi: 10.1109/CCAA.2017.8229908. url:http://ieeexplore.ieee.org/document/8229908/.
[71] Scotty Strachan, Constance Millar, Franco Biondi, and David Charlet. Walkerbasin hydroclimate. url: http://sensor.nevada.edu/WalkerBasinHydro/(visited on 06/02/2020).
[72] The OpenStack project. Openstack docs: choosing a hypervisor. url: https://docs.openstack.org/arch-design/design-compute/design-compute-
hypervisor.html (visited on 08/09/2020).
[73] The OpenStack project. Openstack docs: cinder, the openstack block storageservice. url: https://docs.openstack.org/cinder/rocky/index.html(visited on 04/01/2020).
[74] The OpenStack project. Openstack docs: compute service overview. url: https://docs.openstack.org/nova/rocky/install/get-started-compute.html
(visited on 04/06/2020).
[75] The OpenStack project. Openstack docs: configure remote console access. url:https : / / docs . openstack . org / nova / rocky / install / get - started -
compute.html (visited on 07/28/2020).
[76] The OpenStack project. Openstack docs: customize and configure the dash-board. url: https : / / docs . openstack . org / horizon / rocky / admin /
customize-configure.html (visited on 09/02/2020).
[77] The OpenStack project. Openstack docs: glossary. url: https : / / docs .
openstack.org/doc-contrib-guide/common/glossary.html#p (visitedon 03/19/2020).
[78] The OpenStack project. Openstack docs: hypervisors. url: https://docs.openstack.org/nova/rocky/admin/configuration/hypervisors.html
(visited on 04/06/2020).

93
[79] The OpenStack project. Openstack docs: install and configure for ubuntu.url: https://docs.openstack.org/horizon/rocky/install/install-ubuntu.html (visited on 08/30/2020).
[80] The OpenStack project. Openstack docs: install juju. url: https://docs.openstack.org/project-deploy-guide/charm-deployment-guide/rocky/
install-juju.html (visited on 12/10/2020).
[81] The OpenStack project. Openstack docs: introduction. url: https://docs.openstack.org/neutron/rocky/admin/intro.html (visited on 03/19/2020).
[82] The OpenStack project. Openstack docs: keystone architecture. url: https://docs.openstack.org/keystone/rocky/getting-started/architecture.
html (visited on 03/19/2020).
[83] The OpenStack project. Openstack docs: keystone, the openstack identity ser-vice. url: https://docs.openstack.org/keystone/rocky/ (visited on03/16/2020).
[84] The OpenStack project. Openstack docs: log in to the dashboard. url: https://docs.openstack.org/horizon/rocky/user/log-in.html (visited on04/06/2020).
[85] The OpenStack project. Openstack docs: nova cells. url: https://docs.
openstack.org/kolla-ansible/latest/reference/compute/nova-cells-
guide.html (visited on 08/27/2020).
[86] The OpenStack project. Openstack docs: openstack-ansible documentation.url: https://docs.openstack.org/openstack-ansible/rocky/ (visitedon 12/10/2020).
[87] The OpenStack project. Openstack docs: overlay (tunnel) protocols. url:https://docs.openstack.org/ocata/networking-guide/intro-overlay-
protocols.html (visited on 03/29/2020).
[88] The OpenStack project. Openstack docs: placement api. url: https://docs.openstack.org/nova/rocky/user/placement.html (visited on 08/27/2020).
[89] The OpenStack project. Openstack docs: protecting plaintext secrets. url:https://specs.openstack.org/openstack/oslo-specs/specs/stein/
secret-management-store.html (visited on 08/23/2020).
[90] The OpenStack project. Openstack docs: provider network. url: https://docs . openstack . org / install - guide / launch - instance - networks -
provider.html (visited on 03/19/2020).
[91] The OpenStack project. Openstack docs: self-service network. url: https://docs.openstack.org/mitaka/install-guide-ubuntu/launch-instance-
networks-selfservice.html (visited on 03/19/2020).
[92] The OpenStack Project. Openstack docs: server concepts. url: https://
docs.openstack.org/api-guide/compute/server_concepts.html (visitedon 11/14/2020).

94
[93] The OpenStack project. Openstack docs: sql database. url: https://docs.openstack.org/install-guide/environment-sql-database.html (visitedon 03/19/2020).
[94] The OpenStack project. Openstack docs: storage concepts. url: https://docs.openstack.org/arch-design/design-storage/design-storage-
concepts.html (visited on 03/19/2020).
[95] The OpenStack Project. Openstack docs: supported browsers. url: https://docs.openstack.org/horizon/rocky/user/browser_support.html
(visited on 09/19/2020).
[96] The OpenStack project. Openstack docs: system requirements. url: https://docs.openstack.org/horizon/rocky/install/system-requirements.
html (visited on 08/30/2020).
[97] The OpenStack Project. Openstack/python-openstackclient. url: https://github.com/openstack/python-openstackclient (visited on 11/25/2020).
[98] The OpenStack Project. System for quickly installing an OpenStack cloudfrom upstream git for testing and development. url: https://opendev.org/openstack/devstack (visited on 06/12/2020).
[99] University of Nevada, Reno. Nccp data search. url: http://sensor.nevada.edu/SENSORDataSearch/ (visited on 06/02/2020).
[100] University of Nevada, Reno. Nevada Research Data Center: streaming datamanagement for sensor networks. url: http://www.sensor.nevada.edu/NRDC/ (visited on 06/02/2020).
[101] Sander van Vugt. Introduction to openstack. url: https://www.edx.org/course/introduction-to-openstack (visited on 03/10/2020).
[102] Yoji Yamato, Yukihisa Nishizawa, Shinji Nagao, and Kenichi Sato. Fast andReliable Restoration Method of Virtual Resources on OpenStack. IEEE Trans-actions on Cloud Computing, 6(2):572–583, April 2018. issn: 2168-7161. doi:10 . 1109 / TCC . 2015 . 2481392. url: https : / / ieeexplore . ieee . org /
document/7277013/.
[103] Andrew J. Younge and Geoffrey C. Fox. Advanced virtualization techniques forhigh performance cloud cyberinfrastructure. Proceedings - 14th IEEE/ACMInternational Symposium on Cluster, Cloud, and Grid Computing, CCGrid2014, (March 2015):583–586, 2014. doi: 10.1109/CCGrid.2014.93.


![[PROPOSED] CONSENT DECREE - NRDC](https://static.fdocuments.net/doc/165x107/620cff0a282b357906659994/proposed-consent-decree-nrdc.jpg)