Private Equity, Jobs and Productivity - UMD
56
Private Equity, Jobs and Productivity Steven J. Davis, John Haltiwanger, Ron Jarmin, Josh Lerner, and Javier Miranda * December 22, 2008 * University of Chicago; University of Maryland; U.S. Census Bureau; Harvard University; and U.S. Census Bureau. Davis, Haltiwanger, and Lerner are research associates with the National Bureau of Economic Research, and Davis is a Visiting Scholar at the American Enterprise Institute. We thank Paul Bailey and Kyle Handley for research assistance with this project and Per Stromberg for data on private equity transaction classifications. Participants in and advisory board members of the World Economic Forum’s Globalization of Alternative Investments project provided many helpful comments. The World Economic Forum, the Kauffman Foundation, Harvard Business School’s Division of Research, the Global Markets Initiative at the University of Chicago Booth School of Business and the U.S. Census Bureau provided generous financial support for this research. This document reports the results of research and analysis undertaken in part by U.S. Census Bureau staff. This work is unofficial and has not undergone the review accorded to official publications of these agencies. All results have been reviewed to ensure that no confidential information is disclosed. The views expressed in the paper are those of the authors and not necessarily those of the U.S. Census Bureau.
Transcript of Private Equity, Jobs and Productivity - UMD

Private Equity, Jobs and Productivity
Steven J. Davis, John Haltiwanger, Ron Jarmin, Josh Lerner, and Javier Miranda*
December 22, 2008
* University of Chicago; University of Maryland; U.S. Census Bureau; Harvard University; and U.S. Census Bureau. Davis, Haltiwanger, and Lerner are research associates with the National Bureau of Economic Research, and Davis is a Visiting Scholar at the American Enterprise Institute. We thank Paul Bailey and Kyle Handley for research assistance with this project and Per Stromberg for data on private equity transaction classifications. Participants in and advisory board members of the World Economic Forum’s Globalization of Alternative Investments project provided many helpful comments. The World Economic Forum, the Kauffman Foundation, Harvard Business School’s Division of Research, the Global Markets Initiative at the University of Chicago Booth School of Business and the U.S. Census Bureau provided generous financial support for this research. This document reports the results of research and analysis undertaken in part by U.S. Census Bureau staff. This work is unofficial and has not undergone the review accorded to official publications of these agencies. All results have been reviewed to ensure that no confidential information is disclosed. The views expressed in the paper are those of the authors and not necessarily those of the U.S. Census Bureau.

1. Introduction
The productivity effects of private equity are a matter of considerable
controversy. Much of the popular press, and many labor and political leaders,
characterize private equity as engaged mainly in financial engineering that delivers few
productivity gains or other benefits to the firms they acquire. Some critics go further and
claim that private equity harms the firms that they acquire and their workers. Even among
sympathetic observers, the mechanisms through which private equity groups improve
operations at portfolio firms often are seldom well articulated and well documented.
In this paper, we develop evidence about whether and how productivity changes
at firms that are targets of private equity transactions. We also provide evidence about the
joint behaviour of productivity, jobs, and worker earnings at private equity targets
compared to other firms. We build on our recent study of employment outcomes at firms
and establishments (i.e., individual offices, plants, and stores) that were targets of private
equity transactions in the United States from 1980 to 2005 (Davis et al., 2008). As in our
earlier study, we exploit detailed data on private equity transactions that we have
integrated with longitudinal micro datasets at the U.S. Census Bureau.
Specifically, we rely on the Longitudinal Business Database (LBD) to follow
employment at virtually all private equity-backed companies in the U.S., before and after
the private equity transactions, as well as at matching firms with similar observable
characteristics. We follow activity at the level of firms and establishments – i.e., specific
factories, offices and other distinct physical locations where business takes place. We
restrict attention to the manufacturing sector for the productivity part of our analysis,
because productivity measures are more widely available and of better quality for the

2
manufacturing sector. To measure productivity, we rely on micro data from the Annual
Survey of Manufactures (ASM).
We combine these Census Bureau data sources with data from CapitalIQ and
other sources to identify and characterize private equity transactions. We identify about
5,000 U.S. firms acquired in private equity transactions from 1980 to 2005 (“target
firms”) and about 250,000 U.S. establishments operated by these firms at the time of the
private equity transaction (“target establishments”). About 1,400 target firms and 14,000
target establishments are in the manufacturing sector. To construct controls, we match
each target establishment to other establishments in the transaction year that are
comparable in terms of industry, firm size, and firm age. We follow a similar approach
to controls for target firms.
To clarify the scope of our study, we consider later-stage changes in ownership
and control executed and partly financed by private equity firms. In these transactions,
the (lead) private equity firm acquires a controlling stake in the target firm and retains a
significant oversight role until it “exits” by selling its stake. The initial transaction usually
involves a shift toward greater leverage in the capital structure of the target firm and,
sometimes, a change in its management. We exclude management-led buyouts that do not
involve a private equity firm. We also exclude start-up firms backed by venture
capitalists.
Our ability to track both establishments and firms over time allows us to examine
three competing hypotheses about the effects of private equity on productivity at target
firms:
3
Hypothesis 1: Private equity groups do not systematically improve productivity at
target firms, because their main focus is to generate profits through leverage and other
tools of financial engineering. In fact, if the financial engineering leads management to
focus on debt service and short-term financial goals at the expense of operating
performance, or if it deprives management of the resources needed to enhance operations,
private equity transactions negatively affect productivity at target firms.
Hypothesis 2: Private equity groups raise productivity at target firms by working
with their managers to improve operations and realign incentives and by substituting
better executives. Under this hypothesis, most productivity gains at private equity targets
(relative to controls) involve improvements within continuing establishments rather than
divestitures and closures of underperforming units or, more generally, the reallocation of
resources across establishments.
Hypothesis 3: Private equity groups raise productivity at target firms by deciding
which facilities to retain, expand, sell off, shrink, or close. Under this hypothesis, most
productivity gains at private equity targets (relative to controls) arise from the
reallocation of factor inputs from less productive to more productive establishments.
Our previous study finds that, compared to controls, target firms exhibit
substantially greater rates of gross job destruction and gross job creation in the wake of
private equity transactions. We know from other research that a large fraction of
industry-level productivity gains reflects factor reallocation from less productive to more
productive establishments.* These observations suggest that perhaps private equity
transactions act as accelerants for this source of productivity gains. One possibility is
* See Foster, Haltiwanger, and Krizan (2001, 2006) and the references therein.

4
that private equity investors have a greater ability to identify underperforming units in
portfolio firms, a greater willingness to curtail their operations, or both. If so, then
cutting back at underperforming units can free up resources to expand activity at better
performing units and new facilities. This possibility is consistent with recent suggestions
by Jovanovic and Rousseau (2008), who argue that takeovers lead to a shift of firm
resources to more efficient uses and to better managers.
The main findings of our study can be summarized as follows:
1. Target manufacturing firms experience an intensification of job creation and job
destruction activity, establishment entry and exit, and establishment acquisition
and divestiture (all relative to controls) in the wake of private equity transactions.
The same patterns hold for private equity targets in the private sector as a whole.
2. At the time of private equity transactions, labor productivity is 3.7 log points
(3.8%) higher on average at continuing establishments of target firms than at
continuing establishments of comparable firms in the same industry and of similar
size and age. Two years later, the productivity gap between such continuing
establishments of target firms and comparable firms has widened to 5.1 log points
(5.2%). This increased gap is on an employment-weighted basis so it reflect both
within establishment effects as well as the effect of changing allocation of activity
across establishments within firms.
3. The probability of establishment shut-down falls with productivity for both
private equity targets and comparable firms, but the relationship is much steeper
for targets. In other words, target firms are much more likely to close
underperforming establishments, as measured by labor productivity.

5
4. In the first two years after private equity transactions, productivity grows on
average by about two percentage points more at target firms than at controls.
About 72 percent of this differential reflects greater productivity gains at
continuing establishments, including gains from accelerated reallocation of
activity among the continuing establishments of target firms. About 36 percent of
the differential reflects the productivity contribution of more establishment entry
and exit at target firms. A greater pace of acquisitions and divestitures at target
firms makes a small negative contribution to the differential in productivity
growth.
5. Cumulating the extra value-added implied by the differential in productivity
growth, the roughly 1,400 private equity transactions involving U.S.
manufacturing firms from 1980 to 2005 raised output by 4 to 15 billion dollars per
year as of 2007 (expressed in 2007 dollars), depending on whether and how
rapidly the productivity gains dissipate after the buyout.
6. Continuing establishments at target firms pay a wage premium, with average
earnings per worker 1.1% greater than continuing establishments at comparable
firms, at the time of private equity transactions. Two years later, average wages at
the continuing establishments of target firms are the same as at the continuing
establishments of comparable firms.. This changing gap is on employment-
weighted basis and thus reflects within establishment changes as well as changing
allocation across continuing establihshments.†
† Note that we know very little,at this point about the impact private equity transactions on wages for individual workers inside the establishments of target firms. Understanding the wage dynamics of private equity transactions requires the use of linked employer-employee datasets which is beyond the scope of this paper.
6
7. Both targets and controls tend to share productivity gains with workers in the
form of higher wages, but the relationship between productivity gains and wage
increases is slightly stronger at targets.‡
In the current economic climate, a special concern is whether leveraged
transactions have different effects in a severe downturn with limited credit
availability. For example, even if private equity investments have beneficial
productivity effects during our sample period as a whole, debt-heavy capital
structures at target firms may lead to unfavorable outcomes in a downturn
characterized by a sharp contraction in credit availability. We cannot yet investigate
outcomes in the current downturn, but we can investigate outcomes in earlier periods
that saw a recession and a contraction in credit availability. In this regard, we find the
following;
8. The positive productivity growth differential at target firms (relative to controls)
is larger in periods with an unusually high interest rate spread between AAA-rated
and BB-rated corporate bonds. The higher productivity growth at target firms
during periods of higher credit risk spreads reflects greater reallocation of activity
to more productive establishments and a higher rate of closure at less productive
ones.
These findings suggest that private equity firms are more prone to take difficult, but
productivity-enhancing, decisions to restructure businesses during a credit market crunch.
The paper proceeds as follows: In Section 2 we review previous studies that
consider the impact of private equity transactions on productivity outcomes. We then
‡ This pattern reflects cross sectional variation in growth rates across establishments. That is, the establishments with higher than average productivity growth have higher than average earnings per worker growth.

7
describe the construction of the data in Section 3. Section 4 describes our empirical
methodology. We present our main analyses in Section 5. The final section offers
concluding remarks and discusses directions for future work.
2. Previous literature
Economists have a longstanding interest in how ownership changes affect
productivity (e.g., Lichtenberg and Siegel (1987), Long and Ravenscraft (1993),
McGuckin and Nguyen (2001)). However, few empirical works explicitly consider the
impact of private equity on productivity. In this section, we review the existing large-
sample studies and then discuss several clinical studies of particular transactions.
A. Large-Sample Studies
Kaplan (1989a) focuses on public-to-private leveraged buyouts (LBOs) during the
1980s. In 48 firms for which he can obtain post-buyout financial information, he finds
increases in operating income (before depreciation) and net cash flow, as well as
reductions in capital expenditures. When normalized by assets or sales to control for post-
buyout asset sales, the increases in income and cash flow are between 20% and 50%. He
interprets these findings as consistent with Jensen (1989), who argues that the
combination of incentives, control and leverage imposed by private equity significantly
enhances operating performance at target firms.
The analysis closest in spirit to our study is Lichtenberg and Siegel (1990) who
use Census Bureau data to examine changes in productivity at the manufacturing plants
of 131 firms undergoing buyouts between 1981 and 1986. They find more rapid

8
productivity growth at these plants post-buyout than at other plants in the same industries,
even though buyout plants were already more efficient before the transaction.
Interestingly, they find no significant productivity changes in the 38 LBOs that occurred
in 1981 and 1982, a recessionary period, while the post-1982 LBOs had a strong positive
impact.
Two other studies examine private equity transactions in Great Britain,
historically the second-largest market for buyout activity. Amess (2003) examines 78
buyouts of entire British firms between 1986 and 1997, and Harris, Siegel and Wright
(2005) examine 979 buyouts of British firms between 1994 and 1998. The results in both
studies suggest that private equity transactions are associated with productivity
increases.§
These earlier studies share certain features. First, there is little effort to distinguish
among sources of productivity changes, i.e., how much of any gains reflect productivity
improvements within continuing establishments and how much reflects divestiture or
closures of underperforming establishments or, more generally, reallocation from less to
more productive establishments. Some of the studies seek to partly address this issue by
eliminating buyouts involving substantial asset sales, but it is unclear how this type of
sample restriction affects the results given the extent of “asset shuffling” by private
equity-backed and other firms. Such an approach is also unable to address the broader
§ These studies of British transactions also include management-led deals (which they term management buyouts). Some of these transactions may not have a financial sponsor playing a key role governing the firm, and thus may be quite different from traditional private equity transactions.

9
contribution of factor reallocation to productivity in the wake of private equity
transactions.
Second, previous U.S. studies consider a relatively modest number of deals in the
1980s. Since that time, the private equity industry has become much larger. Using
inflation-adjusted dollars, fundraising by US private equity groups was 36 times greater
in 1998 than in 1985 and more than 100 times greater in 2006.** The tremendous growth
in private equity activity allows us to examine a much larger sample. It also suggests that
earlier relationships might no longer hold because of increased competition for
transactions or greater operational orientation of many private equity groups.
Third, many previous studies restrict attention to whole-firm and public-to-private
transactions. Divisional buyouts, secondary buyouts and private equity investments in
firms that were already private may produce quite different results.
B. Clinical Studies
Another group of studies provide detailed descriptions and analyses of particular
private equity transactions. These studies find productivity effects and other outcomes in
particular transactions that may have broader implications. By our reading, these studies
deliver four sets of insights.
First, some private equity transactions generate limited or no productivity gains.
In several cases, and for various reasons, private equity groups sometimes fail to achieve
their goals for target firms. For instance, when Berkshire Partners bought Wisconsin
Central, it had an ambitious plan to increase productivity. However, technological
** http://www.venturexpert.com (accessed October 6, 2008).

10
problems arose soon after the buyout transaction and prevented the deployment of a
computerized control system that was crucial to the plan. Moreover, the original business
plan overlooked certain costs and greatly overestimated the target’s ability to cut
expenditures. As a result, the numbers in the ambitious business plan were never met
(Jensen, Burkhardt, and Barry (1990)). In other cases, such as the Revco transaction, a
crippling debt load, along with management disarray, a weak and inexperienced LBO
sponsor, and a disastrous midstream shift in strategy led to a failure to achieve
performance goals (Wruck (1989)). As these examples illustrate, some private equity
transactions fail in the sense of not achieving the goals of the private equity investors.
Positive productivity effects are unlikely in such cases.
Second, the Revco case also suggests that the primary source of private value
creation in at least some buyouts involves tax savings rather than operational
improvements. Consistent with this view, the large-sample study of Kaplan (1989b)
provides evidence that greater leverage and other organizational shifts imposed by private
equity investors can yield substantial tax savings that represents “an important source of
the wealth gains in leveraged buyouts.” If tax savings are the principal motive for private
equity transactions, there is no compelling reason to anticipate positive effects on
productivity at target firms and, as we suggested in the introduction, some reason to fear
negative productivity effects.
Third, many case studies find substantial productivity gains at target firms in the
form of improvements to existing operations. For instance, in the Hertz buyout, Clayton,
Dubilier and Rice addressed inefficiencies in pre-existing operations to help increase
profitability. Specifically, CD&R lowered overhead costs by reducing inefficient labor

11
expenses and cutting non-capital investments to industry standard levels, and more
closely aligned managerial incentives with return on capital (Luehrman (2007)).
Similarly, the buyout of O.M. Scott & Sons led to substantial operating improvements in
the firm’s existing operations, partly through powerful incentives offered to management
and partly through specific suggestions by the private equity investors (Baker and Wruck
(1989)). In examples like these, profitability increases and private value creation are
likely to go hand in hand with productivity gains.
Finally, in a number of other cases, private equity targets achieved substantial
efficiency improvements not by enhancing existing operations, but rather by divesting
units. Beatrice had acquired a large number of unrelated businesses as part of a
conglomerate strategy, many of which operated in segments in which it had little
expertise. Its private equity investor, Kohlberg, Kravis, and Roberts, divested many of
these laggard operations, leaving behind a core of well-integrated businesses (Baker
(1992)). Similarly, the buyout group that purchased Kaiser Steel shut down its outdated
and inefficient steel operations. The group focused its operational attention at Kaiser on
the firm’s coal mines, which it regarded as the “hidden jewel” in the firm. Little effort,
though, was devoted to improving the operations of mining facilities (Luehrman (1992)).
Greater profitability and private value creation are also likely to involve productivity
gains in these types of examples, though mainly through productivity-enhancing
reallocation rather than operational improvements within continuing units.
These case studies illustrate a wide range of motives for and effects of private
equity transactions. They can be used to support a variety of hypotheses about the
favorable or unfavorable economic impact of private equity. Our study can be seen as an

12
effort to determine which of these stories best characterizes the impact of private equity
transactions on average, especially with respect to productivity outcomes.
3. The sample
A. Identifying private equity transactions
To identify private equity transactions, we begin with the CapitalIQ database.
CapitalIQ has specialized in tracking private equity deals on a worldwide basis since
1999 and, through extensive research, attempts to “back fill” earlier transactions.†† We
download all recorded transactions in CapitalIQ that closed between January 1980 and
December 2005.
We impose two sample restrictions. First, we restrict attention to transactions that
entail some use of leverage. Many of the CapitalIQ transactions that do not involve
leverage involve venture capital rather than private equity investments in mature or later-
stage firms. To focus on private equity, we delete transactions not classified by CapitalIQ
as “going private,” “leveraged buyout,” “management buyout,” “platform,” or a similar
term. This approach excludes some private equity-backed “growth buyouts” and
“expansion capital” transactions that involve little or no leverage in the purchase of a
minority stake.‡‡ While such transactions do not fit the classic profile of leveraged
buyouts, they share other characteristics of private equity transactions.
†† Most data services tracking private equity transactions were not established until the late 1990s. The most geographically comprehensive exception, SDC VentureXpert, was primarily focused on capturing venture capital transactions until the mid-1990s. ‡‡ It also excludes private equity acquisitions of majority stakes without leverage. These deals typically involve very small targets and funds. The funds that carry out these transactions are often U.S. government-subsidized Small Business Investment Corporations, which are limited by regulators in their use of leverage. These no-leverage
13
Second, the CapitalIQ database includes a number of transactions that did not
involve a financial sponsor (i.e., a private equity firm). We eliminate these deals as well.
While transactions in which a management team takes a firm private using its own
resources are interesting, they are not the focus of this study. After restricting the sample
in these two ways, the resulting database contains about 11,000 transactions worldwide
and about 5,000 transactions for target firms in the United States.
We supplement the CapitalIQ data with data from Dealogic. In many cases,
Dealogic has better information about certain features of private equity transactions, such
as the multiple of earnings paid and the capital structure. It also frequently records
information on alternative names associated with the firms, add-on acquisitions, and
exits. We also draw on SDC databases and compilations of news stories to identify the
characteristics of the transactions and the nature of exits from the investments.
B. Integrating Data on Private Equity Transactions with the LBD
The LBD is a longitudinal database of U.S. establishments and firms with paid
employees. It is constructed from the Census Bureau’s Business Register and enhanced
with survey data collections (see Jarmin and Miranda (2002)). The LBD covers all
sectors of the economy and all geographic areas and currently runs from 1976 to 2005. In
recent years, it contains over 6 million establishment records and almost 5 million firm
records per year.
To merge data on private equity transactions with the LBD, we match the names
and addresses of the private equity portfolio firms (i.e., the targets) to name and address
buyout transactions are much smaller on an aggregated dollar-weighted basis than leveraged buyouts.

14
records in the LBD.§§ For each transaction identified in our CapitalIQ/Dealogic private
equity dataset, we search for a match to the LBD in a three-year window centered on the
transaction year. A three-year window helps us deal with timing differences between the
private equity data sources and the LBD, which records March values for most variables.
Once we match a target firm to the LBD, we use firm-establishment links in the
LBD to identify all establishments owned by the target firm at the time of the private
equity transaction. We then follow target firms and their establishments before and after
the private equity transaction.
Of the approximately eleven thousand target firms in our private equity sample, a
little more than half are not headquartered in the United States. After dropping foreign
firms, our dataset contains slightly more than 5,000 U.S. target firms acquired in private
equity transactions between 1980 and 2005.*** We currently match about 86% of these
targets to the LBD, which yields an analysis sample of about 4,500 target firms. This
sample of target firms serves as the basis for our earlier study of firm and establishment
employment outcomes at private equity targets and a portion of our analysis below.
Figure 1 shows the number of U.S. private equity targets by year and the number
that we currently match to the LBD. It is apparent from Figure 1 that the number of
transactions grew rapidly in the late 1990s. Figure 2a shows the amount of employment
accounted for by target firms in the transaction year. Firms that became private equity
§§ For some of the non-matched cases, we have been successful in matching the name of the seller in the CapitalIQ to the corresponding LBD firm. We plan to use such seller matches to fill out our matches of target firms, but the use of these matches requires us to determine which components of the seller firm are involved in the private equity transaction. *** Some foreign firms targeted in private equity transactions likely operate U.S. establishments. We will explore this issue and seek to capture U.S.-situated establishments operated by foreign-owned private equity targets in a future draft.
15
targets in 2005 alone account for about 2% of all employees in the nonfarm private
sector. Figure 2b shows the amount of employment accounted for by target
manufacturing establishments. While the magnitude in terms of number of jobs is much
smaller than in Figure 2a, the broad patterns are similar. Moreover, private equity targets
account for a larger fraction of manufacturing employment – almost 3 percent, for
example, in 2003 alone. Remarkably, nearly one-tenth of U.S. manufacturing workers
were employed in firms that became private equity targets from 2000 to 2005.
Our productivity analysis considers the subset of manufacturing establishments
covered by the Annual Survey of Manufacturers (ASM). Basic data items collected
about each manufacturing establishment in the ASM include employment, payroll,
materials usage, value added, detailed industry codes, employer identification numbers,
business name and information about location.††† Identifiers in the LBD files enable us
to compute growth rate measures for establishments and firms, to track entry and exit of
establishments and firms, and to identify changes in firm and establishment ownership.
The LBD defines firms based on operational control, and all establishments that are
majority owned by the parent firm are included as part of the parent’s activity measures.
Because the ASM oversamples larger manufacturing firms and establishments, we
present all analyses in this paper using sample weights that adjust for the propensity of a
given firm or establishment to be included in the ASM.
1. Methodology ††† Administrative revenue data can be appended to the LBD from 1994 onward. However, these data are recorded at the level of employer identification numbers and not necessarily at the establishment level. Establishment level sales data from the Economic Censuses are available every five years.
16
A. Key Choices in the Empirical Design
The Census data permit analysis at both the establishment and firm level. Our
first choice, thus, relates to the unit of analysis. In our empirical analysis, our unit of
analysis is typically the establishment, but we use the link to the parent firm to classify
the status of establishments. That is, we identify whether establishments are part of target
firms or controls. In addition, we identify whether an establishment is a continuing plant
within a firm, is being shutdown, is a newly opened “Greenfield” plant, has been
acquired or is being divested. We also use the link to the parent firm to aggregate our
establishment-level results to the firm level to quantify the differences in productivity
growth between targets and control firms. Second, we measure productivity by real value
added per worker, where value added is the value of output minus the cost of
intermediate inputs. Total factor productivity, an alternative measure frequently
encountered in the literature and that also accounts for capital servies, is more difficult to
compute using data available from the ASM and LBD.
A third key choice relates to the use of controls. Suitable controls are important
because the distribution of private equity transactions across industries and by firm and
establishment characteristics is not random. For example, practitioner accounts often
suggest that transactions are concentrated in industries undergoing significant
restructuring, whether due to regulatory action, foreign competition or technological
changes. In what follows, we control for detailed industry of the establishment
interacted with year – the four-digit Standard Industrial Classification (SIC) interacted
with year in the 1980-1997 period, and the six-digit North American Industrial

17
Classification (NAICS) interacted with year in the 1997-2005 period. This means we
control for more than four hundred industry effects per year in the manufacturing sector.
We know from our earlier study that target firms tend to be larger and older than
other firms in the same industry. Furthermore, many previous studies report that
productivity growth differs systematically with firm size and age. Motivated by these
observations, we also control for detailed firm age and firm size categories. For each
establishment, we measure the firm age and firm size of its parent firm. We measure firm
age by the age of its oldest establishment and firm size by number of employees of the
parent firm. We construct these measures using the full LBD, since it contains data for
the entire firm and not just its establishments in the manufacturing sector.
Figure 3 shows the employment distribution by firm age, firm size and industry
for private equity targets and the universe of manufacturing establishments. For targets,
we use all the establishments operating in manufacturing for the target firm. Using the
establishment-level data, we classify each establishment into a firm age, firm size and
detailed industry category. We then tabulate the share of employment in each of the
categories for both targets and the universe of manufacturing establishments. It is
apparent that targets are indeed older, much larger and have a different distribution of
employment across industries.‡‡‡ Our statistical analyses control for these factors so that
we compare targets to other firms in the same industry that are also similar in terms of
size and age.
‡‡‡ The industry codes in Figure 3 are SIC codes and the patterns for the industry distributions reflect only the years 1980-2001. In our empirical analysis, we control for detailed industry codes interacted with year at the SIC level from 1980-2001 and NAICS codes from 2002-2005.
18
Another key choice relates to the time frame of our analysis. Tracking
productivity performance for many years after private equity transactions has clear
attractions. For instance, a five-year horizon corresponds to the typical holding period of
portfolio firms by private equity groups (Stromberg, 2008). In addition, research on
productivity dynamics in new plants and firms finds evidence of important learning and
selection effects over at least the first five years. At the same time, we must confront
some practical issues. First, firms get reorganized over time through mergers,
acquisitions, and divestitures, as well as whole-firm changes in ownership. Second,
establishments exit the ASM sample over time through panel rotation, and the ASM is
our source of establishment-level productivity measures.§§§ Third, a large share of all
private equity transactions occurred in the last few years of the period covered by our
data. In light of these practical considerations, we focus our analysis on the first two
years after buyout transactions. Our earlier work (Davis et. al. (2008)) finds considerable
restructuring of target firms in the first two years post buyout, suggesting that a two-year
horizon captures much of the action.
We classify plants operated by the target firm as of the event year into three
groups, depending on whether the plant continues operations under the target’s
ownership, continues operations but is divested, or is shut down. Similarly, we classify
plants operated by the target firm two years later into those that have remained in
operation under the target’s ownership since the event year, those acquired by the target
§§§ Although we rely on the ASM for establishment-level productivity measures, we are careful to define all entry, exit, acquisition and divestiture events using the full LBD. We use propensity score weights to account for sample rotation in our statistical analyses. The propensity score model uses an interacted model of variables including detailed industry interacted with year, multi-unit status, size and age effects.

19
after the event year, and plants that are newly opened by the target firm after the event
year. We use the same type of classification of establishments in control firms.
B. Measuring Productivity and Decomposing Productivity Growth Differentials
We compute real value-added per worker at establishment e in year t as****
VAet = real value-added
Yet = real gross output
Met= real materials (including energy), and
TEet= total employment.
To obtain productivity for firm i, we aggregate over its establishments according to
where set is the employment share of establishment e, and etω is (log) value added per
worker.††††
One of our chief goals is to quantify the contribution of continuing plants, exits,
divestitures, entrants, and acquisitions to firm level productivity growth. Classifying
**** We use CES-NBER industry level deflators from the NBER Productivity Database (www.nber.org) updated through 2005. †††† We use employment as the activity weight because the employment-weighted average of labor productivity growth across production units closely approximates standard industry-level measures of labor productivity growth (see, Baily, Hulten and Campbell (1992) and Foster, Haltiwanger and Krizan (2001)).
( / ) ( ) / , whereet et et et et etVA TE Y M TEω = = −
,it et ete i
P s ω∈
=∑
20
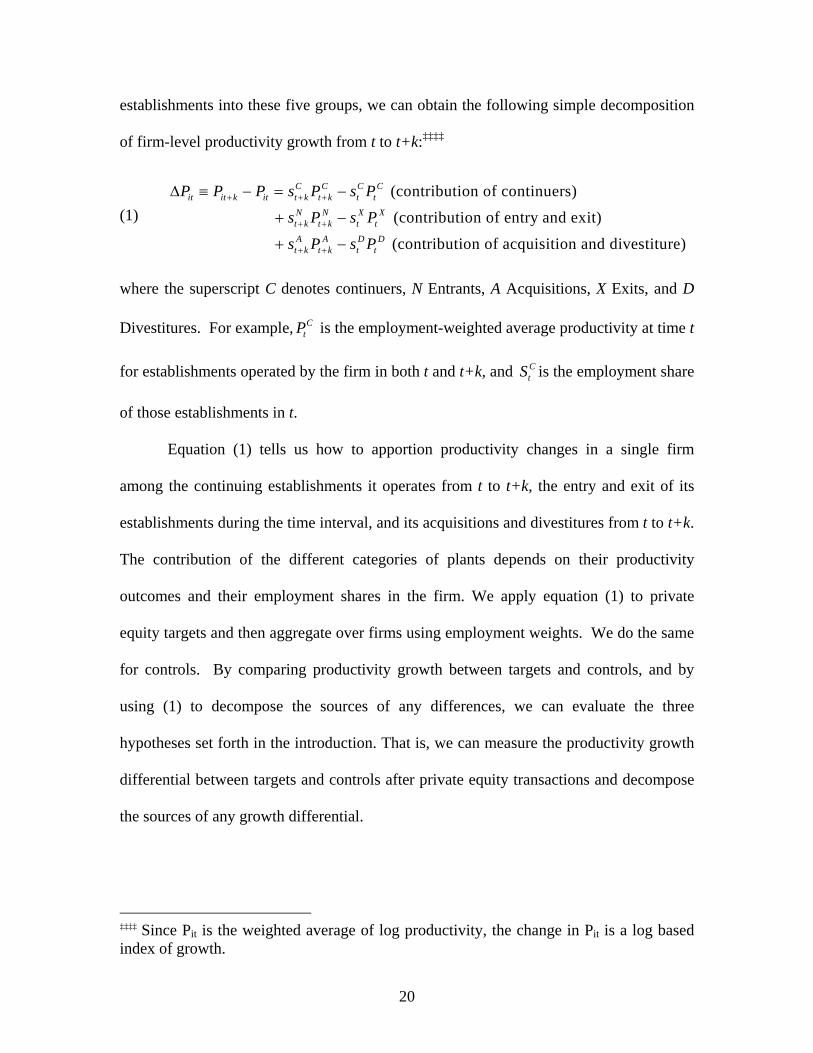
establishments into these five groups, we can obtain the following simple decomposition
of firm-level productivity growth from t to t+k:‡‡‡‡
(1)
where the superscript C denotes continuers, N Entrants, A Acquisitions, X Exits, and D
Divestitures. For example, CtP is the employment-weighted average productivity at time t
for establishments operated by the firm in both t and t+k, and CtS is the employment share
of those establishments in t.
Equation (1) tells us how to apportion productivity changes in a single firm
among the continuing establishments it operates from t to t+k, the entry and exit of its
establishments during the time interval, and its acquisitions and divestitures from t to t+k.
The contribution of the different categories of plants depends on their productivity
outcomes and their employment shares in the firm. We apply equation (1) to private
equity targets and then aggregate over firms using employment weights. We do the same
for controls. By comparing productivity growth between targets and controls, and by
using (1) to decompose the sources of any differences, we can evaluate the three
hypotheses set forth in the introduction. That is, we can measure the productivity growth
differential between targets and controls after private equity transactions and decompose
the sources of any growth differential.
‡‡‡‡ Since Pit is the weighted average of log productivity, the change in Pit is a log based index of growth.
(contribution of continuers)
(contribution of entry and exit)
(contribution of acqu
C C C Cit it k it t k t k t t
N N X Xt k t k t t
A A D Dt k t k t t
P P P s P s P
s P s P
s P s P
+ + +
+ +
+ +
Δ ≡ − = −
+ −
+ − isition and divestiture)

21
As an example, consider how a productivity growth differential might arise in
connection with establishment exits. In general, productivity can differ between exiting
target firms and exiting control firms for several reasons:
• Targets and controls have different levels and distributions of productivity in the
event year,
• Targets and controls have different probabilities of exiting, conditional on initial
productivity, and
• Interactions between the initial productivity distributions and the conditional exit
probabilities.
Figure 4 illustrates the simple case with identical productivity distributions for targets and
controls in the event year but different exit thresholds. In this example, the conditional
exit probability is one for all plants below the indicated threshold, and zero otherwise.
The figure shows the case where private equity targets apply a higher productivity
threshold for plant closure.§§§§ By chopping off more of the lower tail, exits are a bigger
source of productivity gains at targets than controls in this case. This type of outcome
could arise because private equity groups are better at identifying underperforming
establishments in their portfolio firms, because they are more willing and able to shut
them down, or some combination.
§§§§ Theoretical models that deliver a productivity threshold rule for exit include Hopenhayn (1992), Hopenhayn and Rogerson (1992), and Melitz and Ottaviano (2004). Productivity is the only source of idiosyncratic profit variation in these models, and establishments face a fixed cost of operating and potentially a cost of exit. Productivity shocks follow a first order Markov process, profit maximizing firms base their exit decisions on the present discounted value of net profits. Such an environment yields an exit rule like the one illustrated in Figure 4.
22
Another simple case, not illustrated in the figure, is that target and control firms
have identical exit thresholds, but the private equity targets have a larger share of
employment at low-productivity establishments in the event year. In this situation as
well, exits contribute to a positive productivity growth differential for private equity
targets relative to controls but for a different reason.
C. Measuring Real Earnings Per Worker
We measure earnings per worker as the ratio of payroll to employment, deflated by an
index for the price of the firm’s output. In particular, we compute the real wage as the
nominal wage divided by an industry-level index for the output price. This type of real
wage measure is readily compared to our measure of real value added per worker,
because both measures involve the same price deflator for nominal output.
2. Analysis
A. The Pace of Entry, Exit, Acquisitions and Divestitures at Target Firms
Table 1 summarizes a key finding in our earlier study (Davis et al. (2008)):
Private equity targets have a higher pace of employment-weighted entry, exit, acquisition,
and divestiture than controls in the first two years after buyout transactions. Table 1
covers private equity transactions in the U.S. private sector from 1980 to 2005. Table 2
presents analogous results for the manufacturing sector, the focus of the current
study.***** The patterns are similar qualitatively to those in Table 1, but the magnitudes
***** In constructing Table 2, we include the non-manufacturing activity of firms that engage primarily in manufacturing activity. The results are very similar (with slightly smaller magnitudes but similar differences between targets and controls) when we exclude non-manufacturing activity.

23
are somewhat muted. Manufacturing is a sector with larger and more stable
establishments than other sectors, and with lower but still substantial entry and exit rates.
B. Results from Two Year Horizon Analysis
We estimate descriptive regressions for establishment-level outcomes on
productivity and real earnings per worker in the event year and two years later. For any
pair of years, the sample contains ASM establishments owned by firms in the event year
and two years later. Each establishment is linked to its parent firm and classified as part
of a private equity target firm or part of a control firm.††††† Classification as part of a
private equity target means that the establishment was owned by the target firm in the
event year and two years later. We use the five-way classification of establishments into
continuers, entrants, exits, acquisitions and divestitures described above, and we control
for industry-year effects, firm age and firm size for the establishment. We weight by
employment in all regressions.‡‡‡‡‡ The event year regressions (Table 3) pool all years
from 1980 to 2003. The two years after the event regressions (Table 4) pool all years
from 1982 to 2005.
Table 3 reports results for the event year regressions on productivity. Continuing
plants for private equity firms have productivity that is 3.7 log points higher than
continuers operated by control firms – the reference group in our regressions. Private
equity exits have productivity that is 19.8 log points lower than the continuing plants of
the control firms, while control exits have productivity that is 15.2 log points lower than
††††† Once a firm has been in the sample as a private equity target for the period between the transaction year and two years later the establishments of this firm are not included in any other years of the analysis. ‡‡‡‡‡ We also use propensity score weights to ensure that our weighted sample is representative of two year continuing firms for each pair of years considered in our regressions. The propensity score weights control for the fact that certain types of establishments are more likely to be in the ASM sample than others.

24
continuing control plants. Productivity at private equity divestitures (i.e., establishments
sold by private equity-backed firms) is similar to continuing plants in control firms, but it
is 10.6 log points lower at control firm divestitures. All of the differences we have noted
are statistically significant at the 5 percent level.
To investigate whether target firms are more likely to close low productivity
establishments, we fit a logit specification for the probability of a plant exit as a function
of its decile in its industry productivity distribution in the event year. Figure 5 plots the
fitted relationship separately for targets and controls. It shows that private equity targets
have higher exit probabilities in the lower deciles of the productivity distribution, much
higher in the bottom decile.§§§§§ In other words, target firms are more likely than controls
to shut down poorly performing establishments as measured by labor productivity.
The results for two years after the event are presented in Table 4. We find that
private equity continuing establishments have productivity that is 5.1 log points higher
than continuing control establishments. Private equity entering establishments have a
slightly lower productivity for entering establishments relative to continuing control
establishments, although the difference is not statistically significant. In contrast,
entering establishments of controls have much lower (and statistically significant)
productivity than continuing establishments for controls, with a gap of 17.7 log points.
The acquisitions for private equity firms have 10.4 log point lower productivity than
control continuing establishments, while acquisitions for control firms have 7.7 log point
lower productivity relative to control continuing establishments.
§§§§§ Differences are statistically significant at the 5 percent level for the bottom 4 deciles.
25
In comparing the results of Tables 3 and 4, several interesting patterns stand out.
First, the comparison of the productivity advantage of continuing establishments of
targets in year t+2 and t is of interest. This advantage increases from 3.7 log points to 5.1
log points, indicating that continuing establishments of private equity targets have a
substantial gain in productivity relative to controls. Second, the gap between the
productivity of exiting establishments and entering establishments for private equity
targets is very large in absolute magnitude (16.6 log points) and substantially larger than
the analogous gap for controls (-2.5 log points). Third, the gap between the productivity
of acquired and divested establishments for private equity targets is actually negative
(-8.3 log points) and lower than the gap for controls (-2.9 log points). As we show
below, the gains from continuing establishments and net entry for targets are sufficiently
large that they more than offset the drag on productivity from net acquisitions so that the
net effect on productivity growth for targets is positive.
Appropriate caution is required on interpreting the role of entry and acquisition
since the analysis is only over a two-year horizon. The literature on tracking the
productivity dynamics of entering establishments (see, Foster, Haltiwanger and Krizan
(2001, 2006)) highlights the important learning and selection effects that are critical for
interpreting the productivity dynamics of young establishments. The standard pattern for
each entering cohort of entrants is that their productivity grows more rapidly than
incumbents in the first ten years of existence, both because of selection effects (the low
productivity entrants have a high rate of exit) and learning-by-doing effects (surviving
young establishments have rapid productivity gains). Our analysis is not able to capture
those learning and selection effects directly, but we include some analysis below that

26
discusses the longer-run implications of the productivity gains already evident in Tables 3
and 4.
Turning to the earnings per worker results for Tables 3 and 4, many of the same
qualitative patterns hold as with productivity. This makes sense, as earnings per worker
at an establishment are closely related to real value added per worker. For example,
private equity exits have productivity that is 19.8 log points and earnings per worker that
is 10.7 percent lower than continuing control establishments. Control exits have
productivity that is 15.2 log points and earnings per worker that is 7.8 log points lower
than continuing establishments.
While the qualitative patterns are similar, comparing and contrasting the
productivity and earnings per worker findings yields some interesting results. For
example, private equity continuing plants in the event year have a productivity and
earnings per worker positive difference relative to control establishments. Two years
later the productivity advantage has increased but the earnings per worker difference has
disappeared. The results for exits indicate that private equity firms are shutting down low
productivity, low earnings per worker plants with productivity even lower than earnings
per worker. These patterns together suggest that private equity firms are increasing the
gap between productivity and earnings per worker.
Based on Tables 3 and 4, private equity continuing establishments gained in
productivity in relative terms compared to controls, but experienced some reduction in
earnings per worker. The within establishment relative growth rates of productivity and
earnings per worker for continuing establishments for targets and controls are presented
in Table 5. The results in Table 5 show that in terms of growth rates at the establishment

27
level, continuing establishments of target firms did not exhibit statistically significant
differences in growth rates relative to controls for productivity, but exhibited a 3 log
point decline in earnings per worker relative to controls. Thus, from either exercise, the
productivity-earnings gap increased for continuing plants for targets relative to controls.
It might seem to be a puzzle that Tables 3 and 4 show a substantial productivity
gain for continuing establishments of targets while Table 5 shows no such gain. The
productivity gain reflected in Tables 3 and 4 incorporates both any within establishment
growth rate effects as well as any improved allocation of activity across continuing
establishments. Thus, comparing the results in Tables 3, 4, and 5 indicates that the gains
in productivity for continuing establishments stems mainly from the improved allocation
and not from within establishment increases. That is, private equity firms improve
productivity at target firms by more efficiently organizing activity across target
establishments rather than improving productivity within plants.******
Table 5 shows the average patterns for targets vs. controls for productivity and
earnings per worker growth per worker. It is instructive to characterize the
establishment-level relationship between productivity and earnings growth for the whole
distribution, as depicted in Figure 6. It is apparent that for both targets and controls, there
is a positive correlation – that is, plants with increases in value added per worker also
show an increase in earnings per worker. Interestingly, the correlation between
productivity and earnings growth per worker is somewhat higher for targets than controls
– for targets, the correlation is 0.17 while it is 0.11 for controls. These correlations
****** There is a similar positive allocation effect on earnings. Within establishment earnings per worker growth is 3.2 log points less for targets relative to controls from Table 5 but Tables 3 and 4 show targets have 1.1 less growth in earnings per worker. The difference between these reflects increasing activity at the higher earnings (and higher productivity) per worker plants for targets.

28
suggest that both targets and controls share productivity gains with workers, but there is a
stronger positive relationship for targets relative to controls.
Before turning to the overall productivity implications of our findings, it is useful
to note that in unreported results, we have examined whether the results in Tables 3, 4,
and 5 are systematically different by type of private equity transaction. Using a simple
two-way classification of transactions distinguishing between public-to-private and all
other deals, we found little in the way of systematic, significant differences across this
classification of deals. We note, however, that small sample problems make inferences
from additional sub-divisions difficult. In Tables 3, 4, and 5, we are restricted to private
equity transactions in manufacturing for multi-unit, two-year continuing firms that are
also in the ASM sample. In addition, we are already decomposing establishments into
continuing, entering, exiting, acquired, and divested establishments.
C. Micro and Aggregate Net Effects of Private Equity Transactions on Productivity
In this section, we quantify the total productivity gains from private equity
transactions using the results from Tables 2, 3, and 4 along with the productivity
decomposition in equation (1). Recall that the productivity effects identified in Tables 2
and 3 are all deviations from the productivity levels of continuing establishments for
controls in years t and t+2 respectively. As such, it is useful to express the terms in
decomposition (1) using such deviations as follows (see page 20 for the variable
definitions):††††††
†††††† This transformation of equation (1) takes advantage of the fact that the shares across groups within a year sum to one so that the productivity terms in each year can be

29
Each of the terms in this expression is examined relative to the productivity of
continuing establishments of controls, where the latter are denoted by a tilde. This same
decomposition can be used for both targets and controls. Taking the difference between
the two yields an estimate of the productivity growth gains of targets relative to controls.
The deviation terms for both targets and controls are provided in Tables 3 and 4 for years
t and t+2 respectively, so that we can quantify each of the terms in the above expression
for k equal to 2. The shares of continuers, entrants, exits, acquisitions, and divestitures
are provided in Table 2 for t and t+2 respectively.
The resulting difference-in-difference (that is the difference in productivity
growth over the two year horizon for targets relative to controls) is presented in Table 6.
Our findings indicate that on average two years after the private equity transaction,
private equity firms have a 1.84 log point productivity growth gain relative to controls.
About 72 percent of this gain is due to the improved productivity growth of continuing
establishments and about 36 percent of this gain is due to net entry (entering plants
having higher productivity than exiting plants). Net acquisitions contribute negatively. If
we exclude net acquisitions, the gain is about 2 log points. ‡‡‡‡‡‡
deviated from a reference group in a given year – in this case the productivity of continuing establishments of control firms. ‡‡‡‡‡‡ In using the shares from Table 2, we are including the activity of firms whose primary activity is in manufacturing but who also may have activity in non-manufacturing. This would imply we are imputing our findings for manufacturing establishments to non-manufacturing establishments. We have checked the robustness of our results to using shares based only on the manufacturing activity of targets and controls. We find a very similar pattern with the net growth differential (excluding net acquisitions) of 1.91 log points (compared to the 1.99 log point difference when using the
( ) ( ) ( )
( ) ( ) ( )
C C C N N C A A Ct t k t k t k t k t k t k t k t k t k
C C C X X C D D C C Ct t t t t t t t t t k t
P s P P s P P s P P
s P P s P P s P P P P+ + + + + + + + +
+
Δ = − + − + −
− − − − − − + −
% % %
% % % % %

30
In interpreting these productivity growth gains, it is important to emphasize that
this is not the average productivity growth of targets but rather the productivity growth
differential of targets relative to controls. A productivity growth differential of about 2
log points is substantial since the average productivity growth over a two-year horizon
for all of manufacturing is about 7 log points for the period from 1980 to 2005.
To provide further perspective on the magnitude of the contribution of the
productivity growth differential, Figure 7 illustrates the cumulative real output (value-
added) gains from the transactions between 1980 and 2005 under alternative assumptions
about the duration of the gains. To calculate the tabulations in Figure 7, we use the 1.99
productivity differential, as it seems appropriate to exclude the contribution of net
acquisitions for this purpose (as net acquisitions involve changing the ownership of
existing plants and so any gains/losses are offset by losses/gains by other firms).§§§§§§
We apply the same estimated differential for all years for this exercise.*******
shares from Table 2). This difference has only modest effects on the tabulations in Figure 6. Note the latter reflects the output gains only for the manufacturing components of the firm. §§§§§§ Using the 1.84 percent productivity differential yields similar quantitative implications. For example, the cumulative value added creation under the zero depreciation scenario is about 14 billion dollars using the 1.84 percent differential. ******* We apply the 1.99 percent productivity differential to all deals from 1980-2005. Recall that in estimating this differential we have included industry*year controls, as well as controls for the firm size and firm age distribution. We apply the differential to all private equity transactions in manufacturing captured in Figure 2b that are in the ASM sample. We use propensity score weights to generate aggregates (we have checked and our propensity score-weighted version of Figure 2b closely mimics that in Figure 2b). Note that this means we are using this 1.99 differential for all manufacturing transactions, regardless of whether the transaction is part of regression analysis. That is, we use the regression analysis sample to generate the productivity deviation estimates and then apply this to the entire set of manufacturing private equity transactions.

31
Using the estimated productivity growth differential, we calculate the extra real
output from each cohort of targets. An open question is how long lasting these gains turn
out to be. In Figure 7, we show the cumulative gains across a range of “depreciation
factors” from 0 to 1. A depreciation factor of 0 assumes that the gains are permanent. A
depreciation factor of 1 assumes the gains are temporary – that they disappear
immediately after the two year horizon. A depreciation factor of 0.5 assumes that half of
the gains are eliminated for each year beyond the two year horizon.
Figure 7 shows that if the gains are permanent, private equity transactions from
1980 to 2005 created an additional 15 billion dollars (in 2007 dollars) of real output in
2007. If the gains are completely transitory, then the additional gains are about 4 billion
dollars (representing only the gains from 2005 itself). Under a modest depreciation factor
of 0.1, the additional real output created is about 10 billion dollars.
D. The Impact of Private Equity on Productivity as Credit Conditions Vary
The analysis in the prior sections quantifies the average effect of private equity
transactions on productivity, jobs, and earnings using the pooled set of transactions from
1980 to 2005. Economic conditions obviously vary over this period. Given the current
financial crisis in 2008, an obvious question is whether the impact of private equity
transactions on productivity varies with economic conditions in general and with credit
market conditions in particular. The economic downturn in 2008 has been driven by the
meltdown of financial markets and an associated “credit crunch.” While our analysis
does not include the 2008 data, there is considerable variation over the 1980-2005 period

32
in the state of credit markets. In this subsection, we explore the sensitivity of our results
to variation in credit market conditions.
One of the features of the 2008 crisis, as well as earlier credit crunches, is that
interest rate spreads across different types of debt increase. There is a flight to quality in
debt markets, so the spread between corporate bonds and Treasuries increases. In like
fashion, there is an increase in the spread between bonds with different quality ratings.
As illustrated in Figure 8, the spread between AAA- and BB-rated corporate bonds varies
substantially over time. In the current crisis, the spread has increased substantially. The
same pattern appears in earlier credit crunches, with an especially high spread around
1990.
The separate AAA and BB interest rate series depicted in Figure 8 are monthly
averages of the relevant interest rates, while our productivity and jobs data for targets and
controls are on an annual basis. We take the annual average of the monthly series and
take the difference between these annual averages, which we denote as the Diff Annual
Average in Figure 8. For our analysis in this section, we create a variable called “spread”
which is the deviation of annual spread measure from its overall time series mean from
1980-2005. The mean annual average spread is 3.7 percent over the 1980-2005 period
(our sample period). The deviation of the spread from this mean over our sample period
reaches a high of 4.97 percent in 1990. As is clear from Figure 2, most of the private
equity transactions in our sample are in the 1990-2005 period. The average mean
deviation over this latter is period is 0.44 percent.
We merge this spread series into our 1980-2005 analysis sample and explore
extensions of our regression specifications in Tables 3 and 4 that permit the effects in
33
Tables 3 and 4 to vary with the interest rate spread. For each type of effect estimated in
Tables 3 and 4, we include an additional interaction term with the spread variable. For
example, we include terms such as “Private Equity Continuer*Spread”. This
specification yields estimates of each of the effects in Tables 3 and 4 that vary with the
interest rate spread. In estimating these extended specifications, we use the same samples
and controls as in Tables 3 and 4. †††††††
We illustrate the implications of the variation in the estimated coefficients in
Figure 9.‡‡‡‡‡‡‡ To generate Figure 9, we compute the estimated difference in the
productivity growth of continuing establishments between targets and controls, as well as
the difference in productivity between entering and exiting establishments for different
††††††† A challenge in permitting the effects to vary with credit market conditions is that the specifications in Tables 3 and 4 already include a very rich set of controls. Namely, we control for the detailed industry (roughly 450 industries) interacted with year, firm size, and firm age controls. We found that when we attempted to estimate the same model, but allowing the target and control effects for continuing, exiting, entering, acquisitions and divestitures to vary with the interest spread, that some of the interaction effects were not identified (namely those for private equity acquisitions and divestitures). To estimate the effects in Figure 9, we made our controls somewhat coarser. Specifically, we used detailed industry interacted with a period variable that changed only every two years while keeping the firm size and age controls the same. We found that the results reported in Tables 3 and 4 are largely robust to this change and we were able to identify all of the interaction effects with the interest rate spread. We also note that all of the interaction effects we estimated are significant at least at the ten-percent level (and most at the five-percent level). ‡‡‡‡‡‡‡ We do not report results on interest spreads for acquisitions and divestitures because as noted in previous subsection these transactions reflect gains for one firm but offsetting losses for another firm. Also, note that in interpreting Figure 9 that the productivity differentials have not been weighted by the respective share of activity accounted for by continuing, entering and exiting establishments (as done in Table 6). We know from Table 2 that most activity is accounted for by continuing establishments. We did not weight the results in Figure 9 by the activity shares (although the regression results are appropriately employment weighted), as this would require an in depth analysis of how the patterns of entry and exit vary for targets vs. controls across economic conditions. We leave this latter analysis for future work.
34
levels of the interest rate spread in the relevant current year. Recall that from Tables 3
and 4 that the average difference in the productivity growth from continuing
establishments between targets and controls is about 1.4 log points. Figure 9 shows that
this difference increases with the interest rate spread variable. At a value of the spread
equal to zero (that is the spread equal to its long run mean), the gain is essentially zero.
At a value of 0.44 (the mean deviation over the 1990-2005 period), the gain from
continuing establishments is about 1.4 log points (the value we report from Tables 3 and
4). At a value of 1, the gain for continuing establishments is 3.3 log points. At a value of
4, the gain from continuing establishments is about 13.5 log points. Thus, interestingly,
private equity transactions conducted during times of credit crunches yield an even larger
gain from the restructuring and reallocation amongst continuing establishments.
From Table 3, the average difference between targets and controls in the
productivity of exiting productivity establishments is 4.6 log points with target exits
having lower average productivity. This effect contributes to the positive net
productivity gain for targets since doing a better job of shutting down low productivity
establishments raises average productivity. Figure 9 shows that this difference in the
productivity gain from exit also increases with the interest rate spread. At a value of the
spread equal to zero, there is no gain. For a value equal to 1, the gain is already
substantial at 4.1 log points. For a value of 4, the gain is very large at 20.1 log points.
Finally, the results in Table 4 show that there is a sizeable gap in the productivity
of entrants for targets relative to controls. The average gap as estimated in Table 4 is
13.5 log points. This also contributes positively to the net productivity growth gain of
targets relative to controls. Figure 9 shows that this positive entry differential diminishes

35
with the interest rate spread. At a value of the spread at 0, the gain is very large at 21.5
log points but falls to -5.1 log points at a value of the spread equal to 4.
In sum, we find evidence that in terms of the restructuring of continuing
establishments and the shutting down of low productivity establishments, transactions
done during credit crunches yield even larger gain productivity gains at target firms
relative to controls. We also find, however, that the productivity gap of entrants between
targets and controls diminishes in times of credit crunches. Overall, though, the evidence
is at least suggestive that private equity targets are better than controls in making the
difficult choices needed to restructure businesses and increase productivity in times of
financial crisis.
3. Conclusions
This paper explores the productivity, earnings and employment outcomes for
private equity transactions in the U.S. using firm and establishment level data. Our
findings highlight the importance of analyzing the restructuring and reallocation effects
within firms, as well as the changes through entry, exit, acquisitions, and divestitures.
We find that target firms of private equity transactions experience an
intensification of job creation and destruction activity, establishment entry and exit, and
establishment acquisition and divestiture. On net, we find that this intensification of
reallocation yields a substantial productivity growth differential (about 2 percent) within
two years after the transaction. About two-thirds of this differential is due to improved
productivity among continuing establishments of the firm (including the effects of
improved allocation among continuing establishments of the firm) and about one-third
36
due to the contribution of net entry. The contribution of net entry is dominated by our
finding that target firms are much more likely to close underperforming establishments
than comparable firms. The resulting effect on real output for target firms is large. We
estimate that private equity transactions completed between 1980 and 2005 yielded as
much as 15 billion dollars of extra output in 2007 at target manufacturing firms.
We find similar patterns for earnings per worker, although we find less of a
positive impact on earnings per worker from continuing establishments of the target
firms. We do find that the correlation between the growth in productivity and earnings
per worker after private equity transactions is higher at target firms than at comparable
firms.
Our analysis focuses on private equity transactions from 1980 to 2005. As such,
our analysis sample does not include transactions and activity during the current financial
crisis (in 2008). While we cannot yet address this question directly, we examine
fluctuations in credit market conditions, for example the deterioration in credit conditions
in the early 1990s, over the course of the 1980 to 2005 period to get a sense of how the
current crisis might affect private equity targets. Interestingly, we find evidence that the
relative productivity gains at targets from the restructuring of continuing establishments,
as well as the productivity gains from shutting down poorly performing establishments,
actually increase in credit market crunches. These findings suggest that private equity
firms are better than comparable firms in making the difficult choices of restructuring and
shutting down poorly performing establishments in times of economic downturns.
Our findings on the intensification of restructuring and reallocation hold for the
entire private sector, while our findings for productivity are restricted to the

37
manufacturing sector and also restricted to measures of labor productivity. The
manufacturing sector has been an important area of activity for private equity
transactions, but it would clearly be of interest for many reasons to extend our analysis of
productivity effects beyond manufacturing in future work. The data infrastructure for
productivity analysis is much richer for manufacturing, but extending the analysis to
other sectors would permit even richer analysis of the productivity, earnings, and
employment outcomes – e.g., digging deeper into the effects different types of
transactions (e.g. are the consequences of public-to-private deals different?) and
analyzing the outcomes over longer horizons. Analyzing outcomes over longer horizons
would permit studying the longer-run implications of private equity transactions.
Extending our analysis to explore total factor productivity, as well as the restructuring
and reallocation of physical capital, would also be of clear interest.

38
References
Amess, K. (2002) “Management Buyouts and Firm-Level Productivity: Evidence from a Panel of U.K. Manufacturing Firms,” Scottish Journal of Political Economy 49, 304-317. Baker, G.P. (1992) “Beatrice: A Study in the Creation and Destruction of Value,” Journal of Finance 47, 1081-1119. Baker, G.P. and K.H. Wruck (1989) “Organizational Changes and Value Creation in Leveraged Buyouts: The Case of the O.M. Scott & Sons Company,” Journal of Financial Economics 25, 163-190. Davis, S.J., J.C. Haltiwanger, R.S. Jarmin, C.J. Krizan, J. Miranda, A, Nucci, and K. Sandusky (2006), “Measuring the Dynamics of Young and Small Businesses: Integrating the Employer and Non-employer Business Universes,” National Bureau of Economic Research Working Paper no. 13266. Forthcoming in Dunne, T., J.B. Jensen, and M.J. Roberts (eds.), Producer Dynamics: New Evidence from Micro Data, Chicago, University of Chicago Press. Davis, S.J., J.C. Haltiwanger, R.S. Jarmin, J. Lerner, and J. Miranda, (2008) “Private Equity and Employment,” Center For Economic Studies Working Paper no. CES-07-08. Davis, S.J., J.C. Haltiwanger, R. Jarmin, and J. Miranda, (2007), “Volatility and Dispersion in Business Growth Rates: Publicly Traded versus Privately Held Firms,” in Acemoglu, D., K. Rogoff, and M. Woodford (eds.), NBER Macroeconomics Annual 21, 107-180. Davis, S.J., J.C. Haltiwanger, and S. Schuh (1996), Job Creation and Destruction, Cambridge, MA, MIT Press. Foster, L.S., J. Haltiwanger, and C.J. Krizan (2001), “Aggregate Productivity Growth: Lessons from Microeconomic Evidence,” in Dean, E., M. Harper, and C. Hulten (eds.), New Directions in Productivity Analysis, Chicago, University of Chicago Press. Foster, L.S., J. Haltiwanger, and C.J. Krizan (2006), "Market Selection, Reallocation, and Restructuring in the U.S. Retail Trade Sector in the 1990s," Review of Economics and Statistics 88, 748-758. Harris, R., D.S. Siegel, and M. Wright (2005), "Assessing the Impact of Management Buyouts on Economic Efficiency: Plant-Level Evidence from the United Kingdom,” Review of Economics and Statistics 87, 148-153. Hopenhayn, H.A. (1992), “Entry, Exit, and Firm Dynamics in Long Run Equilibrium.” Econometrica 60, 1127-50.

39
Hopenhayn, H.A. and R. Rogerson (1992), “Job Turnover and Policy Evaluation: A General Equilibrium Analysis”, Journal of Political Economy 101, 915-938. Jarmin, R.S., and J. Miranda (2002), “The Longitudinal Business Database”, Center For Economic Studies Working Paper 02-17. Jensen, M.C. (1989), “The Eclipse of the Public Corporation,” Harvard Business Review 67 (September-October), 61-74. Jensen, M.C., W. Burkhardt, and B.K. Barry (1990), “Wisconsin Central Ltd. Railroad and Berkshire Partners (A): Leveraged Buyouts and Financial Distress,” Harvard Business School Case no. 9-190-062. Jovanovic, B., and P. Rousseau (2008), “Mergers as Reallocation,” Review of Economics and Statistics 90, 765-776. Kaplan, S.N. (1989a), “The Effects of Management Buyouts on Operating Performance and Value,” Journal of Financial Economics 24, 217-254. Kaplan, S.N. (1989b), “Management Buyouts: Evidence on Taxes as a Source of Value Source,” Journal of Finance 44, 611-632. Lichtenberg, F.R. and D. Siegel (1987), “Productivity and Changes in Ownership of Manufacturing Plants,” Brookings Papers on Economic Activity: Microeconomics 643-683. Lichtenberg, F.R. and D. Siegel (1990), "The Effects of Leveraged Buyouts on Productivity and Related Aspects of Firm Behavior,” Journal of Financial Economics 27, 165-194. Long, W. and D. Ravenscraft (1993), “The Financial Performance of Whole Company LBOs,” Center For Economic Studies Working Paper no. CES-WP-93-16. Luehrman, T.A. (1992) "Kaiser Steel Corporation, 1987," Harvard Business School Case no. 293-019. Luehrman, T.A. (2007), “The Hertz Corporation (A),” Harvard Business School Case no. 208-030. Melitz, M.J., I. Gianmarco, and P. Ottaviano (2005). “Market Size, Trade, and Productivity,” Unpublished working paper, Harvard University. McGuckin, R.H. and S.V. Nguyen (2001), “The Impact of Ownership Changes: A View from Labor Markets,” International Journal of Industrial Organization 19, 739-762.

40
Stromberg, P. (2008), “The New Demography of Private Equity,” Unnumbered working paper, Swedish Institute for Financial Research. Wruck, K.H. (1991), "What Really Went Wrong at Revco?" Journal of Applied Corporate Finance 3 (Summer), 79-92.

41
Figure 1: Matches of Private Equity Targets to the LBD
Number of US Target Events: Targets Matched and Total
0
100
200
300
400
500
600
700
800
900
1980
1981
1982
1983
1984
1985
1986
1987
1988
1989
1990
1991
1992
1993
1994
1995
1996
1997
1998
1999
2000
2001
2002
2003
2004
2005
matched total

42
Figure 2a: Employment of Matched Targets (Level and Percent of LBD Total)
Employment under Private Equity Targets: By Year and as a Percent of Economy
0
0.5
1
1.5
2
2.5
1980
1981
1982
1983
1984
1985
1986
1987
1988
1989
1990
1991
1992
1993
1994
1995
1996
1997
1998
1999
2000
2001
2002
2003
2004
2005
0
500
1000
1500
2000
2500
Thou
sand
s
Percent of LBD Employment Target Employment (right axes)

43
Figure 2b: Employment of Matched Targets (Level and Percent of LBD Total) – Manufacturing
Manufacturing Employment under Private Equity Targets: By Year and as Percent of Manufacturing Sector
Employment
0
0.5
1
1.5
2
2.5
3
19801981198219831984198519861987198819891990199119921993199419951996199719981999200020012002200320042005
050100150200250300350400450500
Thou
sand
s
Percent of LBD Manufacturing Employment Target Employment (right axes)

44
Figure 3: Summary Statistics on Distribution by Employer Age, Size, and Industry
Size Distr ibution of Manufacturing Firm s: A ll vs Targets (employment weighted)
0 .00
10 .00
20 .00
30 .00
40 .00
50 .00
60 .00
70 .00
80 .00
90 .00
a ) 1 to 49 b) 50 to99
c) 100 to499
d) 25 0 to49 9
e) 500 to99 9
f ) 1000 to24 99
g) 2500to 4999
h) 50 00to 99 99
i) 1 0000+
P rivate Equ i ty LBD
Age Dis tr ibution o f Manu factu ring F irm s: All vs Targets (em ploym ent weigh ted)
0.0 0
1 0.0 0
2 0.0 0
3 0.0 0
4 0.0 0
5 0.0 0
6 0.0 0
a . 0 ‐5 b. 6 ‐1 0 c. 1 1 ‐1 5 d . 1 6+
P r i va te Equ i ty LBD

45
Figure 3 (Continued)
Industry Distribution of Manufacturing Establishments: All vs Targets (1980‐2001, employment weighted)
0.00
5.00
10.00
15.00
20.00
25.00
xx20
xx21
xx22
xx23
xx24
xx25
xx26
xx27
xx28
xx29
xx30
xx31
xx32
xx33
xx34
xx35
xx36
xx37
xx38
xx39
2‐Digit SICPrivate Equity LBD

46
Figure 4: Hypothetical Establishment Exit Thresholds for Private Equity Target Firms and Controls with Identical Productivity Distributions
Controls Targets
Productivity
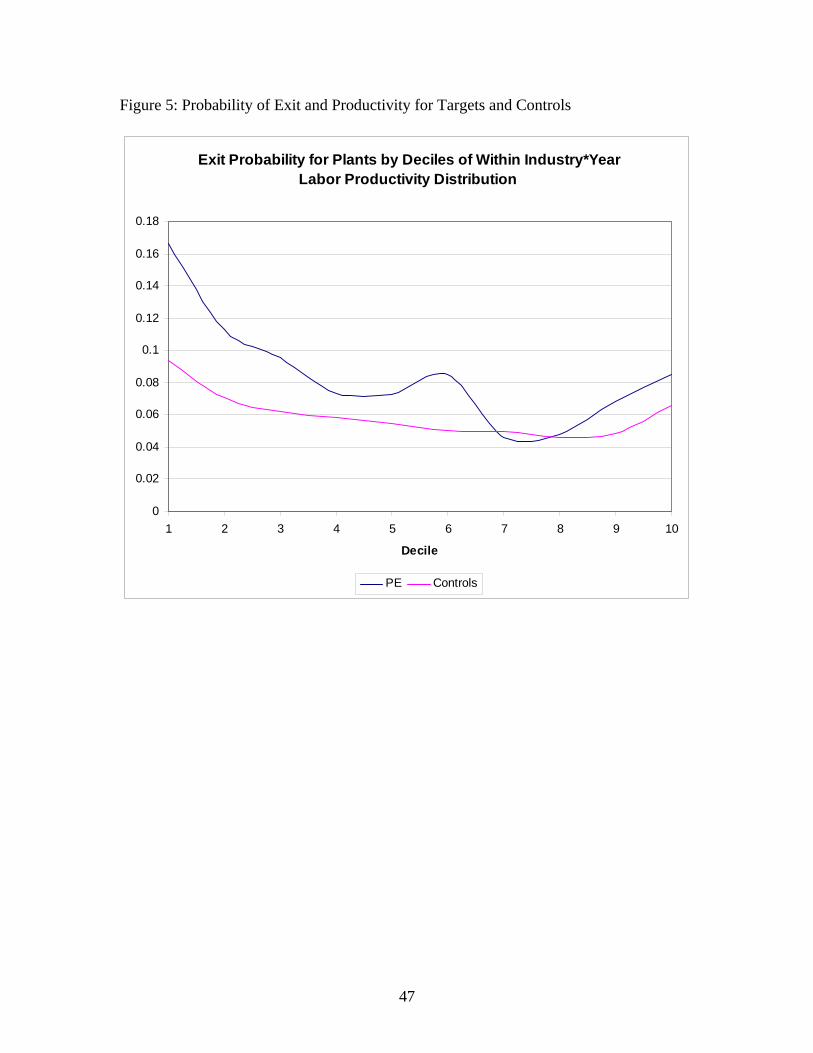
47
Figure 5: Probability of Exit and Productivity for Targets and Controls
Exit Probability for Plants by Deciles of Within Industry*Year Labor Productivity Distribution
0
0.02
0.04
0.06
0.08
0.1
0.12
0.14
0.16
0.18
1 2 3 4 5 6 7 8 9 10
Decile
PE Controls

48
Figure 6: Plant-Level Log Changes in Value-Added Per Worker and Earnings per Worker
Note: Depicted are two-year differences in log value added per worker and log earnings per worker for targets (red circles) and controls (black circles). A random sample of controls is depicted. The orange line is a non-parametric curve fit through targets and the blue line is a non-parametric curve fit through controls.

49
Figure 7: Estimated Impact of Private Equity Transactions
Extra Output Per Year as of 2007 Implied by Productivity Growth Differential for Private Equity Transactions in
Manufacturing from 1980 to 2005
02468
10121416
0 0.1 0.2 0.3 0.4 0.5 0.6 0.7 0.8 0.9 1
Annual Depreciation Rate on Productivity Gains
Bill
ions
(200
7$)
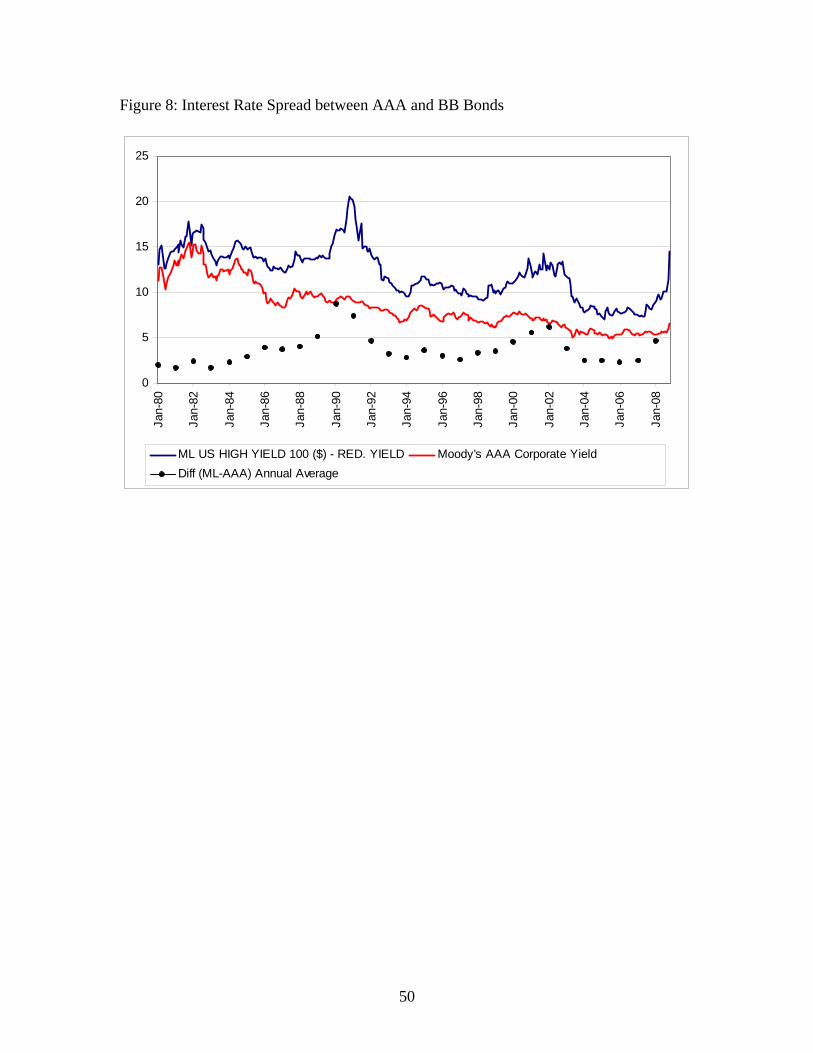
50
Figure 8: Interest Rate Spread between AAA and BB Bonds
0
5
10
15
20
25Ja
n-80
Jan-
82
Jan-
84
Jan-
86
Jan-
88
Jan-
90
Jan-
92
Jan-
94
Jan-
96
Jan-
98
Jan-
00
Jan-
02
Jan-
04
Jan-
06
Jan-
08
ML US HIGH YIELD 100 ($) - RED. YIELD Moody's AAA Corporate YieldDiff (ML-AAA) Annual Average
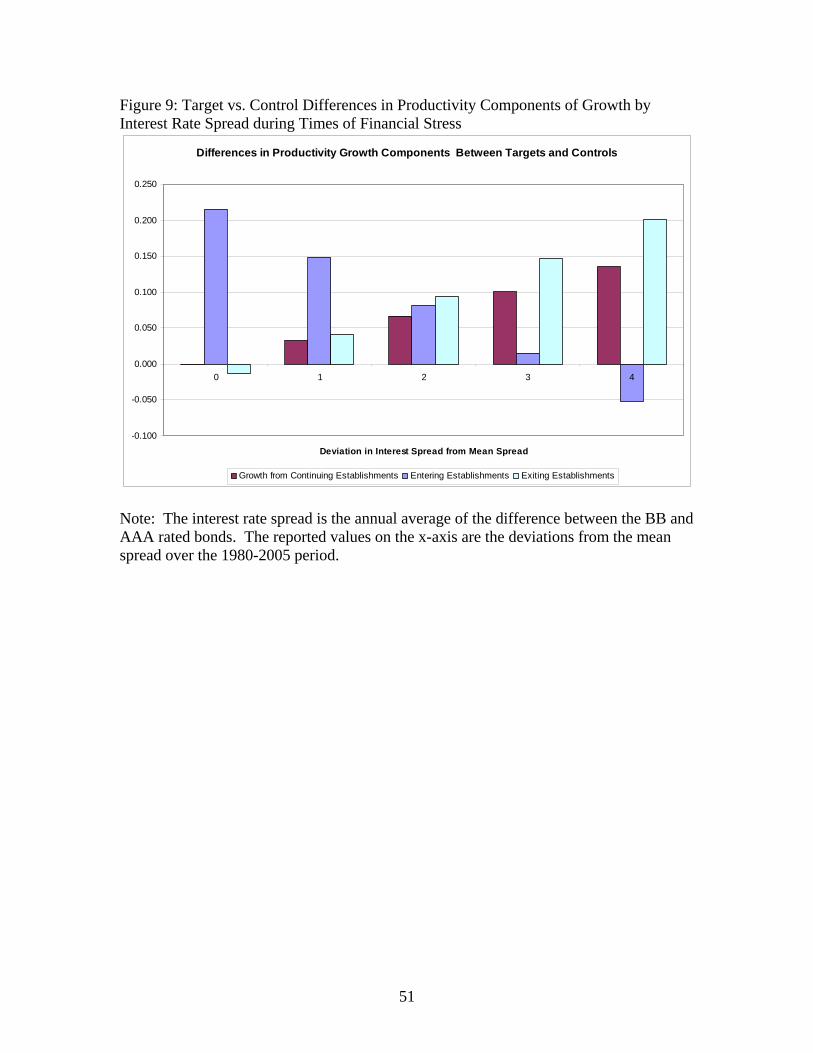
51
Figure 9: Target vs. Control Differences in Productivity Components of Growth by Interest Rate Spread during Times of Financial Stress
Differences in Productivity Growth Components Between Targets and Controls
-0.100
-0.050
0.000
0.050
0.100
0.150
0.200
0.250
0 1 2 3 4
Deviation in Interest Spread from Mean Spread
Growth from Continuing Establishments Entering Establishments Exiting Establishments
Note: The interest rate spread is the annual average of the difference between the BB and AAA rated bonds. The reported values on the x-axis are the deviations from the mean spread over the 1980-2005 period.
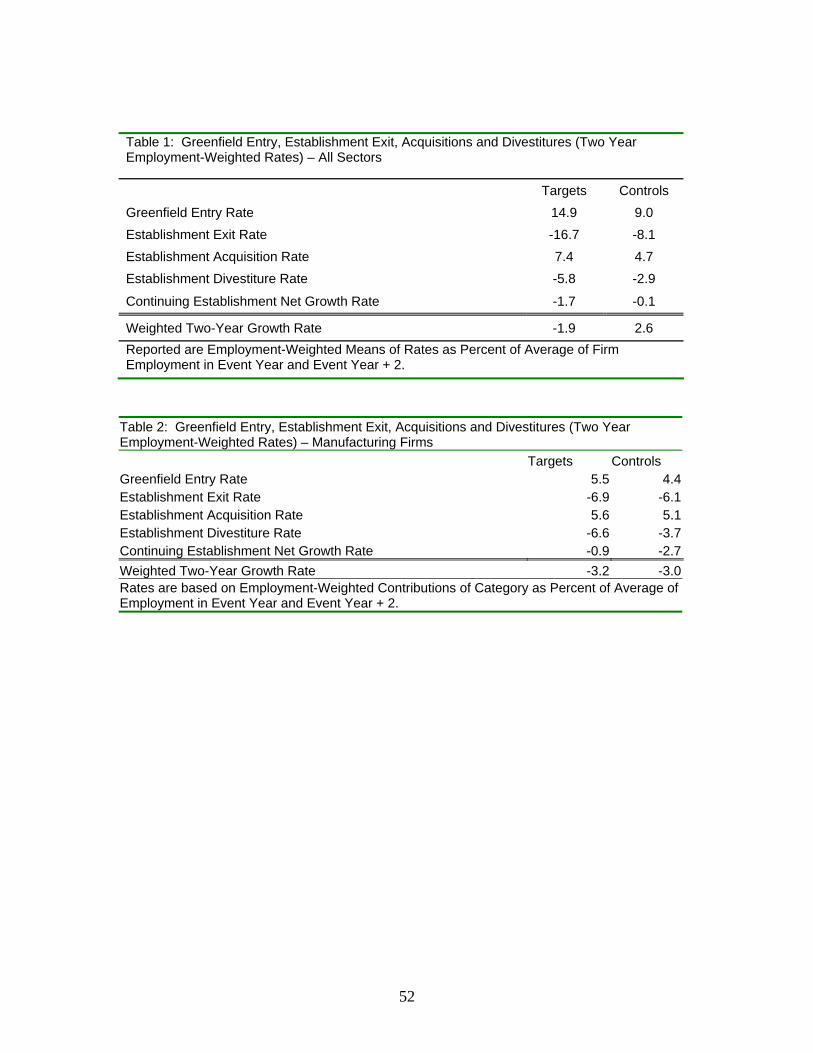
52
Table 1: Greenfield Entry, Establishment Exit, Acquisitions and Divestitures (Two Year Employment-Weighted Rates) – All Sectors
Targets Controls Greenfield Entry Rate 14.9 9.0 Establishment Exit Rate -16.7 -8.1 Establishment Acquisition Rate 7.4 4.7 Establishment Divestiture Rate -5.8 -2.9
Continuing Establishment Net Growth Rate -1.7 -0.1
Weighted Two-Year Growth Rate -1.9 2.6 Reported are Employment-Weighted Means of Rates as Percent of Average of Firm Employment in Event Year and Event Year + 2.
Table 2: Greenfield Entry, Establishment Exit, Acquisitions and Divestitures (Two Year Employment-Weighted Rates) – Manufacturing Firms Targets Controls Greenfield Entry Rate 5.5 4.4Establishment Exit Rate -6.9 -6.1Establishment Acquisition Rate 5.6 5.1Establishment Divestiture Rate -6.6 -3.7Continuing Establishment Net Growth Rate -0.9 -2.7Weighted Two-Year Growth Rate -3.2 -3.0Rates are based on Employment-Weighted Contributions of Category as Percent of Average of Employment in Event Year and Event Year + 2.
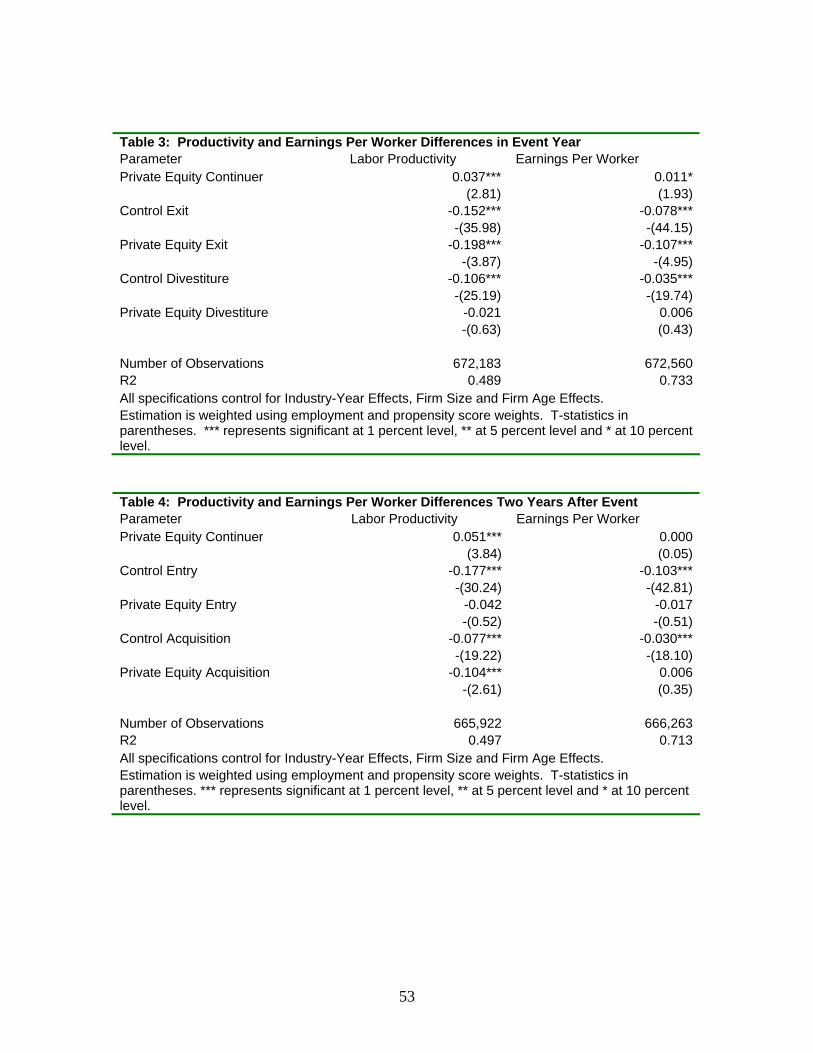
53
Table 3: Productivity and Earnings Per Worker Differences in Event Year Parameter Labor Productivity Earnings Per Worker Private Equity Continuer 0.037*** 0.011* (2.81) (1.93)Control Exit -0.152*** -0.078*** -(35.98) -(44.15)Private Equity Exit -0.198*** -0.107*** -(3.87) -(4.95)Control Divestiture -0.106*** -0.035*** -(25.19) -(19.74)Private Equity Divestiture -0.021 0.006 -(0.63) (0.43) Number of Observations 672,183 672,560R2 0.489 0.733All specifications control for Industry-Year Effects, Firm Size and Firm Age Effects. Estimation is weighted using employment and propensity score weights. T-statistics in parentheses. *** represents significant at 1 percent level, ** at 5 percent level and * at 10 percent level.
Table 4: Productivity and Earnings Per Worker Differences Two Years After Event Parameter Labor Productivity Earnings Per Worker Private Equity Continuer 0.051*** 0.000 (3.84) (0.05)Control Entry -0.177*** -0.103*** -(30.24) -(42.81)Private Equity Entry -0.042 -0.017 -(0.52) -(0.51)Control Acquisition -0.077*** -0.030*** -(19.22) -(18.10)Private Equity Acquisition -0.104*** 0.006 -(2.61) (0.35) Number of Observations 665,922 666,263R2 0.497 0.713All specifications control for Industry-Year Effects, Firm Size and Firm Age Effects. Estimation is weighted using employment and propensity score weights. T-statistics in parentheses. *** represents significant at 1 percent level, ** at 5 percent level and * at 10 percent level.

54
Table 5: Differences in Growth Rates of Productivity and Earnings Per Worker for Continuing Plants Parameter Labor Productivity Earnings Per Worker Private Equity -0.008 -0.032** -(0.47) -(2.49)Number of Observations
292,936 337,108
R2 0.241 0.396All specifications control for Industry-Year Effects, Firm Size and Firm Age Effects. Estimation is weighted using employment and propensity score weights. T-statistics in parentheses. *** represents significant at 1 percent level, ** at 5 percent level and * at 10 percent level.

55
Table 6: Two Year Productivity Growth Gain From Private Equity Total Productivity Growth Gain 1.84Total Excluding Acquisition/Divestiture 1.99Share of Total from: Continuing Establishments 0.72 Net Entry 0.36 Net Acquisition -0.08


![The Equality Multiplier...multiplier m= [1=(1 ˚0)] >1:It is an equality multiplier as long as the wage gap between jobs with high productivity p sand jobs with low productivity](https://static.fdocuments.net/doc/165x107/5f9297dd9bbc8476d409f076/the-equality-multiplier-multiplier-m-11-0-1it-is-an-equality-multiplier.jpg)