Private Coffee Standards and Sustainable Development A ...
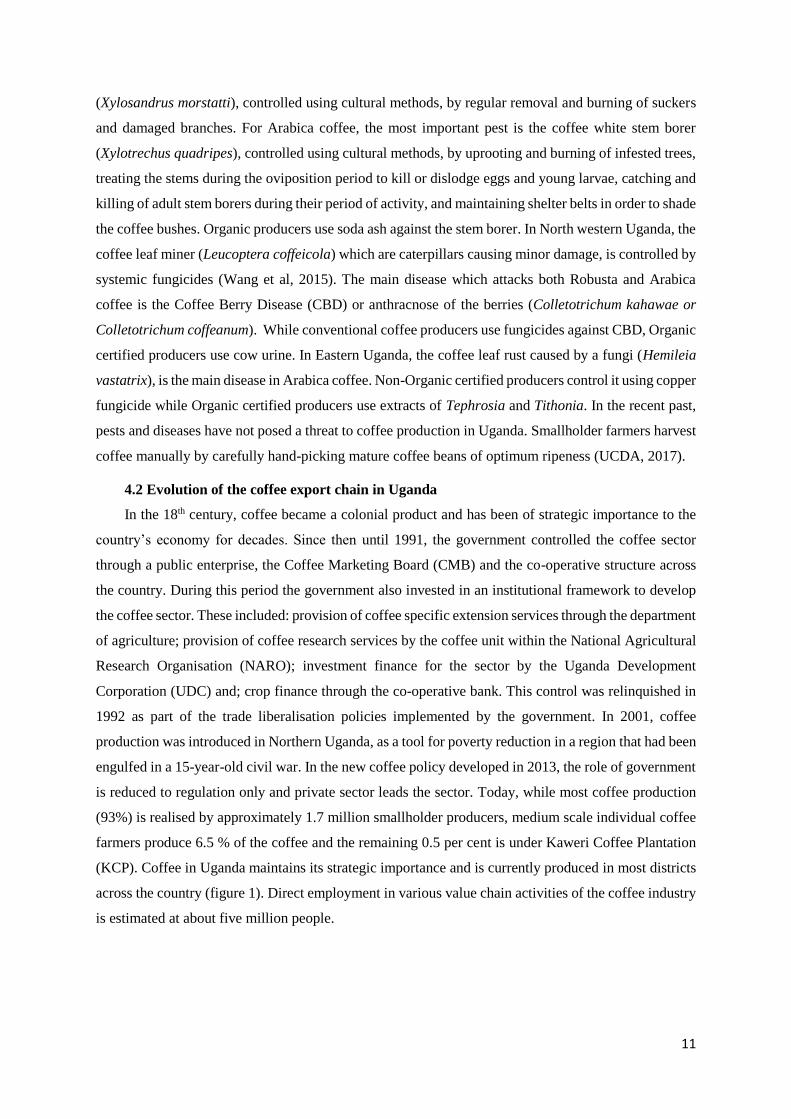
173
Private Coffee Standards and Sustainable Development A case study from Uganda Kevin Teopista Akoyi Supervisor: Prof. Dr. Ir. Miet Maertens Dissertation presented in partial fulfilment of the requirements for the degree of Doctor of Bioscience Engineering October, 2017
Transcript of Private Coffee Standards and Sustainable Development A ...
Private Coffee Standards and Sustainable Development
A case study from Uganda
Kevin Teopista Akoyi
Supervisor: Prof. Dr. Ir. Miet Maertens
Dissertation presented in partial fulfilment
of the requirements for the degree of
Doctor of Bioscience Engineering
October, 2017
ii
PRIVATE COFFEE STANDARDS AND
SUSTAINABLE DEVELOPMENT
A CASE STUDY FROM UGANDA
Kevin Teopista AKOYI
Supervisor:
Prof. Miet Maertens (KU Leuven)
Members of the Examination Committee:
Prof. Roel Merckx (Chairman - KU Leuven)
Prof. Liesbet Vranken (KU Leuven)
Prof. Seppe Deckers (KU Leuven)
Dr. Ir. Bruno Verbist (KU Leuven)
Prof. Marijke D’Haese (U Gent)
October 2017
Dissertation presented in partial
fulfilment of the requirements for
the degree of PhD in Bioscience
Engineering
iii
Doctoraatsproefschrift nr. 1444 aan de faculteit Bio-ingenieurswetenschappen van KU Leuven
© 2017 KU Leuven, Science, Engineering & Technology
Uitgegeven in eigen beheer, Kevin Teopista Akoyi, Leuven - Belgium
Alle rechten voorbehouden. Niets uit deze uitgave mag worden vermenigvuldigd en/of
openbaar gemaakt worden door middel van druk, fotokopie, microfilm, elektronisch of op
welke andere wijze ook zonder voorafgaandelijke schriftelijke toestemming van de uitgever.
All rights reserved. No part of the publication may be reproduced in any form by print,
photoprint, microfilm, electronic or any other means without written permission from the
publisher.
iv
Acknowledgements
Although a PhD is a process through which a candidate independently executes original research
work, while building their academic, analytical, scientific, writing and many other skills, it is not
possible without encouragement and support of many people. I would like to thank all those who, in
one way or another, contributed to the challenging and enriching journey which led to the realisation of
this PhD project and to my personal development.
First and foremost I would like to thank my Supervisor, Professor Miet Maertens. Miet, you have
been a wonderful mentor and I would like to thank you whole heartedly. When I first met you, I was
dreaming of doing a PhD, with a rather clear idea of interest, presented in a non-scientific manner and
moreover, I was not sure of how to proceed. After a few meetings with you, many things became clear.
You believed in me even when I doubted my own capacity due to late entry into a PhD program. You
encouraged and supported me to present a well written and consistent proposal, to search for funding,
design my research, go through the data analysis and to publish the results. Besides the pre-doc being a
tense period with very heavy workload, I also arrived at a time when the division was saying farewell
to one student who did not make it from pre-doc into a PhD program. I was shocked and very sad,
picturing the possibility of such a thing happening to me, and finally telling myself, I cannot allow it.
Without your support, this assertion would have been mere wishful thinking. I was touched by your
untiring commitment, especially one evening when one your children was ill and you left the office to
go check on that child and returned to office later, to have a final look at the proposal I was supposed
to present to the assessors the following day. That however, was only the beginning. Your tireless
support and encouragement continued throughout the PhD project. Moreover, the happy moments we
spent together in Mount Elgon, the passionate discussions we had on many issues especially on gender
issues and vegetarianism, the light moments in the bar, are all good memories I will always cherish.
I would also like to thank the members of my jury, whose comments have greatly contributed to
improving the quality of this Thesis. Professor Liesbet Vranken thanks for your critical comments
during seminars and presentations, especially on the analytical techniques used in various chapters and
better ways to explain the difference-in-difference estimation technique. They were very useful in
helping me to ground the reasoning behind the models and present them in a clear way. Dr. Ir. Bruno
Verbist, your comments during the whole process of executing the trade-off analysis, questions
regarding the superiority of reporting least square means and other comments on better ways of
presenting of various parts of the Thesis were very useful. Professor Seppe Deckers, thank you for your
feedback on agronomic practices for coffee production, the agro-ecological indicators, how to deal with
orthogonality of variables in my models and the discussions on possible ways of solving the soil fertility
issues in Mount Elgon. Professor Marijke D’Haese, thank you for the critical questions regarding
possible confounding effects of co-operatives and certification, and for challenging me to take a step
v
back from all the results of my research and look at the big picture, in order to write a better conclusion.
Professor Roel Merckx, thank you for your comments and for ably chairing both the preliminary and
the public defence of my PhD.
The motor that enables a combination of the ambition and the passion to do a PhD to progress into
the implementation phase is funding. I highly appreciate the KU Leuven DBOF research fund
(Scholarship of the research council) and the OT scholarship program for the critical financial support
for my PhD.
I was fortunate to be in the company of many helpful and friendly colleagues, who made the PhD
process less lonely. Erik, Ellen, Frederik, Isabel, Pieter, Monica, Katrien, Jana, Bernd, Jeremy, Tessa.
Fikadu, Natalia, Stefaan, Tessa, Yann, Goedele, Isabelle, Moses, Joseph, Diana, Iris, Marie, Eewoud,
Floris, Kaat, Genaye, Tafesse, Tijstke, Nuria, Oyinbo, Cindybell, Karin and Kewan. Thank you for the
many vibrant discussions on a wide range of topics, especially around the lunch table. Thanks for the
methodological discussions, feedback during the seminars and the light moments during the social
events and at the bar. Special thanks to Goedele and Tessa for a nice trip to Ithaca and the funny,
spontaneous dinner at Moosewood; to Natalia for the many enriching discussions and encouraging
words we often shared; and to Fikadu for the many passionate discussions on family, life and the future
of Africa. Special thanks to Koen for the very good collaboration we had, during data collection in
Mount Elgon and preparing a paper together.
I was fortunate to go back home to Uganda for my data collection where former colleagues and
the new ones I met, were a big asset for this PhD project. Rita, thank you for sharing the publication on
coffee stakeholders. The 20 page booklet with all coffee stakeholders in Uganda, including their
telephone contacts, made my life very easy in sampling potential interviewees. I also thank you for
sharing all other reports you had on coffee in Uganda. Julius, Florence, Marc and Paul, thank you for
updates on certified coffee production in Uganda. UCDA staff, many thanks for all the historical
statistics, the reports and the many engaging discussions we had regarding the coffee industry in
Uganda. Special thanks to: Angelita Musimenta and Kizito Mayanja. Despite having the stakeholder
contacts in hand, key players in the coffee sector can be hard to reach and one needs extra help to
actually get appointments from them. Joseph Nkandu, I highly appreciate the invitation you extended
to me to the NUCAFE annual convention. It enabled me to meet hundreds of key coffee stakeholders,
from the Ministers, through export company directors, to farmers, from all corners of the country, all
in one day and in one venue. The face-to-face introduction to them created a rapport which eased the
follow up appointments for the semi-structured interviews. In this regard, special thanks go to the
following people: David Barry, Kailash Natani, Hannington Karuhanga, Betty Namwagala, Francis
Kusuro, the late Chemusto Wilson, Fred Luzinda, Willington Wamayeye, Phiona Nakusi, Luke
Wephukulu, Hon. Gerald Ssendaula and Hon. Nandala Mafabi for all the information I obtained during
vi
the long hours of interviews with each of you. I also thank the Chief Administrative Officers (CAO) of
Bududa, Manafwa, Sironko, Bulambuli and Kapchorwa, for the district specific information.
The planning and co-ordination of quantitative data collection would have been impossible without
the support of many people I met in Mbale. Special thanks go to the following people: the Local Council
1 (LC 1) leaders of the sampled villages in Bushika, Bukigai, Sisiyi, Bukibologoto/Simu, Kaptanya,
Tegeres, Bupoto, Buwabwala, Buyobo and Buwasa sub-counties, for facilitating contacts with the non-
certified farmers; Anneke Fermont, Umar Male and your colleagues - Richard, Yakob, Peter,
Emmanuel, Vincent, John, Enos and Moses, for facilitating contact with Utz-Rainforest-4C certified
farmers; Luke, Stella, Grace, Benjamin, David, Johnson, Mourine, Robert, Abraham, Rogers and
Richard, for facilitating contact with Fairtrade-Organic certified farmers. To all of you certified
company staff, I appreciate all the information you provided based on your knowledge and experience
in the certified coffee business in Mount Elgon. The whole exercise of quantitative data collection
would have been completely over-whelming without good co-ordination at all times. Betty, I thank you
whole heartedly for the support you gave in supervising the data collection in the five districts, under
very difficult circumstances, especially poor rural roads. John and Immaculate thanks for the practical
support during enumerator recruitment and training. I thank, whole heartedly, all the enumerators who
hiked the mountain slopes during the rainy season to reach the sampled coffee producers and completed
all the 600 household and 300 village survey questionnaires: Ivan, Perez, Isaac, David, Kenneth,
Hussein, Bisikwa, Sarah, Tom, Ben, Sam, Walter, Joshua and Simon. Special thanks to Lawrence for
designing the electronic data sheets, training and monitoring data entrants. To the team of data entrants,
thank you for a job well done: Isaac, Emma, Simon, Francis, Sam and Zaidi. Needless to say, my deepest
appreciation goes to all the 600 coffee producers and 300 village leaders who accepted to be respondents
for the survey. Thank you very much for your time and the wealth of experience in coffee production,
which you readily shared with me.
An interesting part of the PhD process was the supervision on Masters students. Lotte and Veerle,
it was enriching to collaborate with and learn from you, as you prepared your Master’s Thesis. The
boda boda rides and the hikes on the slopes of mountain Elgon were fun too. For those students not
under my supervision but with whom I shared research information and experiences of conducting
research in Mount Elgon, it was great to engage with you in a learning process: Filip, Pieterjan, Moses,
Joseph and Koen. I hope you too enjoyed and learnt from my, sometimes, over-enthusiastic description
of situations in Uganda.
Embarking on a PhD after long work experience means one’s inspiration comes from somewhere.
For almost two decades prior to joining Arenberg Doctoral School, I worked in various capacities for
Vredeseilanden, facilitating organisational and value chain development processes with smallholder
farmers, as they rose up to the challenges of liberalised and globalising agricultural trade. There are

vii
many colleagues at Vredeseilanden, in Leuven and in the fourteen countries of Latin America, South
East Asia and Africa, with whom I spent many long hours, not only discussing various sustainable
development issues but also crafting and implementing strategies to respond to them. I cannot mention
all the 160 colleagues but I wish to thank you all, whole heartedly for enriching my life and inspiring
me. I thank you for the many critical questions we often asked, many of them without ready answers;
food security or business development? Global or local value chains? Cooperatives or other
organisational forms? Projects or Programs? Which business models for which context? Fairtrade,
Organic or Rainforest Alliance? I also extend special thanks to all colleagues in the Agency for
Cooperation and Development (ACORD). The discussions on which strategies are appropriate for
development in Africa and the programs we developed together, were enriching experiences. From the
steering committee of the International Assessment of Agricultural Knowledge, Science and
Technology for Development (IAASTD), the critical questions we discussed regarding sustainability
of smallholder farming and their contributions to climate change challenges of today, were inspirational.
Special thanks to Professor Emeritus Niels Roling and to Cathy Rutivi, for encouraging me to pursue
this PhD project.
An invaluable support during my PhD process came from my friends and family. Anneleen, Lucia
and follow choristers, thank you all for your friendship and encouragement. The children: Mary,
Winnie, Francis and Basil, special thanks to you all. Whether it was during the long stays in Uganda or
the long hours in office, you always remained encouraging and supportive throughout the years. Last
but not least, I wish to express my gratitude to John, my husband. I thank you for encouraging and
supporting me to transition from NGO management to student life, for the difficult task of commuting
between Uganda and Belgium, often coming just in time to solve all the small problems, for always
being available to solve all my practical problems whenever I was stranded in Mount Elgon. Our
veranda in Kampala became a mini-office for the PhD project and you calmly bore all the
inconveniences associated with it. Most importantly, I thank you for your unwavering friendship.
Kevin Teopista Akoyi
viii
Samenvatting
Private voedselstandaarden nemen snel aan belang toe in de agri-voedselsector. Dit is een gevolg
van de toenemende bezorgdheid van consumenten in hoge-inkomenslanden over de impact van
geliberaliseerde handel op kleinschalige producenten in ontwikkelingslanden, op voedselveiligheid, op
voedselkwaliteit en op het milieu. Deze standaarden concentreerden zich initieel op voedselveiligheid
en voedselkwaliteit, daarna werden ze uitgebreid naar ethische en milieuproblemen. Vandaag vormen
ze belangrijke commerciële en institutionele innovaties, die een belangrijke rol spelen in de
moderniseringsprocessen van globale agri-voedselketens in ontwikkelingslanden. Kortom, ze zijn
veelbelovend voor duurzame ontwikkelingsresultaten op het niveau van kleinschalige producenten.
Aangezien de liberalisering van de handel toeneemt, zijn private voedselstandaarden globaal fenomeen
geworden, met gevolgen voor alle ketenactoren, waaronder producenten, handelaren, leveranciers en
distributeurs. Het begrijpen van de impact van private voedselstandaarden, met betrekking tot de
beloftes die zij aan producenten in ontwikkelingslanden en consumenten in hoge-inkomenslanden
maken, is relevant. Veel ontwikkelingslanden zijn sterk afhankelijk van agri-voedselexports en de
meerderheid van de kleinschalige producenten in deze exportketens leeft in armoede. De huidige
literatuur over de impact van private voedselstandaarden op kleinschalige producenten is nog steeds
schaars. Er is geen consensus over de vraag of private voedselstandaarden hun beloftes over hun impact
op kleinschalige producenten in ontwikkelingslanden kunnen waarmaken. Daarnaast kijken weinig
studies naar het effect van meerdere standaarden op kleinschalige producenten. Dit proefschrift beoogt
om deze kloof in het wetenschappelijk onderzoek in te vullen door het ontrafelen van de link tussen
private standaarden in de koffiesector en de performantie van kleinschalige producenten op vlak van
duurzame ontwikkeling. Ik richt mij op het Mount Elgon-gebied in Oost-Oeganda, waar de vijf
belangrijkste private koffiestandaarden sinds 2000 worden geïmplementeerd.
Dit proefschrift is opgesteld in samenwerking met diverse collega's. Ik heb nauw samengewerkt
met mijn leidinggevende professor Miet Maertens van de afdeling Bio-economie van KU Leuven. Ik
heb samengewerkt met andere collega's om data te verzamelen en te analyseren voor hoofdstuk 5:
Professor Bart Muys, Dr. Bruno Verbist en Ir. Koen Vanderhaegen van de afdeling Bos, Natuur en
Landschap van KU Leuven, Dr. Wouter Dekoninck van het Koninklijk Belgisch Instituut voor
Natuurwetenschappen in Brussel en Dr. Rudy Jocqué van het Koninklijk Museum voor Centraal Afrika
in Tervuren.
In hoofdstuk twee beschrijven wij het liberaliserings- en moderniseringsproces van de koffie
waardeketen in Oeganda. Wij gebruiken data van stakeholders en secundaire informatie en gebruik de
concepten van de waardeketen- en innovatiesystemen om de innovaties in de koffiesector in Oeganda
te bepalen, de drijvende krachten te ontrafelen en van daaruit de voortvloeiende
moderniseringsprocessen te analyseren. Wij demonstreren dat, meer dan twee decennia na de
liberalisering, de koffiewaardeketen is veranderd van een eenvoudige overheidsgecontroleerde
ix
commodity chain naar een complexe waardeketen die beter georganiseerd is, directe buitenlandse
investeringen ontvangt en veel innovaties op technisch, commercieel en institutioneel niveau kent.
Hoewel er veel verbeteringen zijn, blijkt dat er uitdagingen blijven bestaan met betrekking tot lage
opbrengsten, slechte kwaliteit op bulking niveau, onduidelijke landbouwsadviseringsmechanismen,
onderontwikkelde invoermarkten en een te grote levering van gecertificeerde koffie.
In hoofdstuk drie onderzoeken wij de impact van private voedselstandaarden op het welzijn en de
productiviteit van kleinschalige producenten. Wij gebruiken cross-sectionele micro-economische data
van individuele producenten en dorpen en dorpsniveau- data, wij passen Instrumental Variable (IV)
methodes toe, met instrumenten die zwakke identificatietesten en over-identificatiebeperkingen
doorstaan, en wij voegen plot-gewogen agro-ecologische indicatoren in alle modellen toe. Wij
demonstreren dat deelname aan een triple Utz-Rainforest Alliance-Common Code of Conduct for
Coffee (Utz-Rainforest-4C) koffiecertificeringschema koffieopbrengsten, koffie-inkomen, totale
huishoudelijke inkomsten en arbeidsproductiviteit verhoogt, en dat armoede met 16 procentpunten
vermindert. Wij tonen aan dat deelname aan een dubbel Fairtrade-Organic koffiecertificeringschema,
de opbrengsten van koffie, koffie-inkomsten, totale inkomsten en arbeidsproductiviteit vermindert, en
dat het geen invloed heeft op armoede. Deze resultaten houden in dat, hoewel private
voedselstandaarden het potentieel hebben om het welzijn van de producent te verbeteren, niet altijd
doen wat ze beloven zoals bij Fairtrade-Organic.
In hoofdstuk vier analyseren wij de effecten van private koffiestandaarden op scholing van
kinderen. Wij evalueren de effecten van standaarden op de inschrijving van kinderen in de basis- en
middelbare school, en scholingsefficiëntie. Wij gebruiken cross-sectionele micro-economische data van
individuele kinderen en gezinnen en pas probit, tobit and difference-in-difference schattingstechniek
toe. Wij vinden dat de dubbele Fairtrade-Organic certificering de kans verhoogt dat kinderen in de
basisschool ingeschreven worden met 6% punten voor jongens, de kans om ingeschreven te worden op
de middelbare school met 13,4% punten voor jongens en 20% punten voor meisjes. Het verhoogt de
scholingsefficiëntie van het basisonderwijs met 14% punten voor jongens, 10% punten voor meisjes,
en de middelbare scholing efficiëntie met 8,4% punten voor jongens en 13,1% punten voor meisjes.
Wij vinden dat de triple Utz-Rainforest-4C-certificering geen invloed heeft op zowel de scholingsgraad
als scholingsefficiëntie. De resultaten betekenen dat enkel een verbod op kinderarbeid onvoldoende is
om de scholingsresultaten te verbeteren; private voedselstandaarden moeten extra investeringen doen
om scholing te stimuleren. De resultaten betekenen ook dat Fairtrade in de Mount Elgon regio haar
belofte over kinderscholing houdt.
In hoofdstuk vijf, onderzoeken wij de economische en milieu-effecten van private
koffiestandaarden de trade-off tussen deze effecten. Wij beoordelen de trade-off tussen de
sociaaleconomische gevolgen van standaarden, namelijk; armoede, koffie inkomen, koffieopbrengsten
en arbeidsproductiviteit ten opzichte van de milieueffecten op biodiversiteit en koolstofvoorraden. Wij
x
gebruiken micro-economische data van individuele producenten en koffievelden en passen limited-
information maximum likelihood estimators en instrumental variables toe om de sociaaleconomische
impact te schatten. Generalized linear interactive mixed modellen met log link functie (GLIMMIX)
worden gebruikt om de impact van private voedselstandaarden op koolstofvoorraden, boom- en
ongewervelde diversiteit te analyseren. Wij vinden dat de triple Utz-Rainforest-4C-certificering de
opbrengsten van koffie, arbeidsproductiviteit en koffie inkomen verhoogt en armoede vermindert, maar
ecosysteemdiensten op koffievelden verlaagt. De dubbele Fairtrade-Organische certificering resulteert
in een grotere hoeveelheid mier- en dwergkevers, een grotere boomverscheidenheid en grotere
koolstofopslag op koffievelden, maar vermindert de opbrengst, de arbeidsproductiviteit en het koffie-
inkomen - ondanks hogere verkoopsprijzen. Resultaten suggereren dat private voedselstandaarden de
trade-off tussen economische en ecologische voordelen verminderen, maar slagen er niet in om een
win-win-uitkomst voor economische en milieu-duurzaamheid te creëren.
Over het algemeen toont dit proefschrift dat private koffiestandaarden een belangrijke rol spelen
in het moderniseringsproces van de koffiewaardeketen in Oeganda door hun bijdragen aan innovaties
op verschillende niveaus en op structurele her configuratie van de waardeketen. Bovendien blijkt uit de
resultaten dat private koffiestandaarden het potentieel hebben om bij te dragen tot duurzame
koffieproductie door kleinschalige producenten, indien positieve aspecten van de verschillende
standaarden kunnen geharmoniseerd worden voor het specifieke geval van Mount Elgon. Voor
sommige elementen van duurzaamheid vervullen de private koffiestandaarden hun beloftes maar voor
andere niet.
xi
Summary
Private food standards in global agri-food value chains are rapidly spreading, in response to
concerns of consumers in high income countries about the impact of liberalised trade on smallholder
producers in developing countries, food safety, food quality and the environment. These standards
started by focusing on food safety and food quality issues, later on expanding to ethics and
environmental issues. Today they are important commercial and institutional innovations, playing a key
role in modernisation processes of global agri-food value chains in developing countries, and making
many promises on sustainable development outcomes at smallholder producer level. As liberalisation
of trade deepens, private food standards have become a global phenomenon, with impact on all chain
actors including producers, traders, bulkers and distributors. Understanding the impact of private food
standards, regarding the promises they make to producers in developing countries and consumers in
high income countries is pertinent. Many developing countries depend heavily on agri-food exports and
the majority of the smallholder producers in these export chains are living in poverty. Today, literature
on the impact of private food standards on smallholders is still scarce. There is no consensus as to
whether private food standards keep the many promises they make regarding their impact on
smallholder producers in developing countries. In addition, few studies look at the effect of multiple
standards on smallholder producers. This PhD Thesis aims to fill this research gap by unravelling the
link between private standards in the coffee sector and smallholder producer performance on sustainable
development outcomes. I focus on the Mount Elgon region of Eastern Uganda, where all the five major
private coffee standards are being implemented since 2000.
This Thesis has been prepared in collaboration with several colleagues. I worked closely with my
supervisor Professor Miet Maertens of the division of Bio-economics of KU Leuven. I collaborated
with other colleagues to collect and analyse data for chapter 5. They include: Professor Bart Muys, Dr.
Bruno Verbist and Ir. Koen Vanderhaegen of the division of Forest, Nature and Landscape of KU
Leuven, Dr. Wouter Dekoninck of Royal Belgian Institute of Natural Sciences in Brussels and Dr.
Rudy Jocqué of the Royal Museum for Central Africa in Tervuren.
In chapter two, we describe the liberalisation and modernisation process of the coffee value chain
in Uganda. We use stakeholder survey data and secondary information, and apply the value chain and
innovation systems concepts, in order to identify the innovations taking place in the coffee sector in
Uganda, the driving forces behind them and the consequent modernisation processes. We demonstrate
that over two decades after liberalisation, the value chain has transformed from a simple state controlled
commodity chain to a complex value chain which is better organised, receives foreign direct investment
and with many innovations at technical, commercial and institutional levels. Although there are many
improvements, results show that challenges remain regarding low yields, poor quality at bulking stage,
unclear agricultural extension mechanisms, under-developed input markets and oversupply of certified
coffee.
xii
In chapter three, we investigate the impact of private coffee standards on welfare performance of
smallholder households. Using cross-sectional household- and village-level survey data, we apply
Instrumental Variable (IV) methods, with instruments that pass weak identification tests and over-
identification restrictions, fixed effects models and we include plot-weighted agro-ecological indicators
in all models. We demonstrate that participation in a triple Utz-Rainforest Alliance-Common Code of
Conduct for Coffee (Utz-Rainforest-4C) coffee certification scheme increases coffee yields, coffee
income, total household income, labour productivity and reduces poverty by 16 percentage points. We
show that participation in a double Fairtrade-Organic coffee certification scheme, reduces coffee yields,
coffee income, total household income, labour productivity and has no impact on poverty. These results
imply that although private food standards have the potential to improve producer welfare, they do not
always walk the talk as in the case of Fairtrade-Organic.
In chapter four, we analyse the effects of private coffee standards on child schooling. We assess
the effects of standards on primary and secondary school enrolment, as well as on schooling efficiency.
we use cross-sectional household- and individual child-level survey data and apply probit, tobit and
difference-in-difference estimation techniques. We find that the double Fairtrade-Organic certification
increases the likelihood of children to be enrolled in primary school enrolment by 6% points for boys,
the likelihood to be enrolled in secondary school by 13.4% points for boys and 20% points for girls. It
increases primary schooling efficiency by 14% points for boys, 10% points for girls, and secondary
schooling efficiency by 8.4% points for boys and 13.1% points for girls. We find that the triple Utz-
Rainforest-4C certification has no impact on both school enrolment and schooling efficiency. The
results imply that prohibition of child labour alone is not sufficient to improve schooling outcomes and
private food standards need to make extra investments in order to yield positive results. The results also
imply that in the Mount Elgon region, Fairtrade keeps its promise regarding child schooling.
In chapter five, in a unique collaboration with Ir. Koen Vanderhaegen, we investigate the trade-off
between the impact of private coffee standards on the welfare and environmental performance of the
smallholder households. We assess the trade-off between the socio-economic impact of standards
namely; poverty, coffee income, coffee yields and labour productivity vis-à-vis environmental impact
on biodiversity and carbon stocks. We use household and plot level data and apply limited-information
maximum likelihood estimators and instrumental variables approach to estimate the socio-economic
impacts. Generalized linear interactive mixed models with log link function (GLIMMIX) is used to
analyse the impact of private food standards on carbon stocks, tree- and invertebrate diversity. We find
that the triple Utz-Rainforest-4C certification increases coffee yields, labour productivity and coffee
incomes, and decreases the incidence of poverty but reduces ecosystem services on coffee fields. The
double Fairtrade-Organic certification results in higher ant and rove beetle abundance, larger tree
diversity and larger carbon storage on coffee fields but reduces yield, labour productivity and coffee
incomes – despite higher farm-gate prices. Results suggest that private food standards reduce trade-offs
xiii
between economic and ecological benefits but fail to create win-win outcomes for economic and
environmental sustainability.
Overall, this Thesis shows that private coffee standards play an important role in the modernisation
process of the coffee value chain in Uganda through the contributions they make to innovations at
various levels and to structural re-configuration of the value chain. Furthermore, the results show that
standards have the potential to contribute to sustainable smallholder coffee production if positive
aspects of the various standards could be harmonised for the specific case of Mount Elgon. On some of
the sustainability outcomes the private coffee standards ‘walk the talk’ while on others they do not.
xiv
List of Abbreviations and Acronyms
ALL-protocol Ants of the Leaf Litter standard sampling protocol
4C Common Code for the Coffee Community
BCC Basic Common Code
BCU Bugisu Cooperative Union
BDS Business Development Services
BMF Brazillian Bolsa de Mercadorias & Futuros
C Carbon
CBD Coffee Berry Disease
CCLM Cosmo-Climate Limited-area Modelling
CCSSCTA Coffee Cooperative Societies and Specialty Coffee Traders Association
CCT Conditional Cash Transfer
CEE Central and Eastern Europe
CMB Coffee Marketing Board
CWD Coffee Wilt Disease
DBH Diameter at Breast Height
DD Difference-in-Difference
DEM Digital Elevation Model
DKV The German Coffee Association
EMIS Education Management Information System
EPOPA Export Promotion of Organic Production in Africa
FDI Foreign Direct Investment
FEWSNET Famine Early Warning Systems Network
FGD Focus Group Discussion
FSSP Farming Systems Support Project
FSU Former Soviet Union
GAP Good Agronomic Practices
GCCE Gumutindo Coffee Co-operative Enterprises
xv
GCP Global Coffee Platform
GCS Growers’ Co-operative Society
GIS Geographic Information System
GLIMMIX Generalized Linear Interactive Mixed Models
GPS Global Positioning System
ICA International Coffee Agreement
ICE Intercontinental Exchange Futures of US
ICO International Coffee Organisation
ILO International Labour Organisation
IMF International Monetary Fund
IPM Integrated Pest Management
ISEAL International Social and Environment Accreditation and Labelling
ISFM Integrated Soil Fertility Management
IV Instrumental Variable
KCL Kyagalanyi Coffee Limited
KCFA Kaweri Coffee Farmers’ Alliance
KCP Kaweri Coffee Plantation
LIFFE London International Financial Futures and options Exchange
LC Local Council
MAF Ministry of Agriculture
MAAIF Ministry of Agriculture, Animal Industry and Fisheries
MDGs Millenium Development Goals
MFIs Micro-Finance Institutions
MoC Ministry of Cooperatives
MSP Multi-Stakeholder Platform
MT Metric Tonne
NAADS National Agricultural Advisory Services
NACORI National Coffee Research Institute

xvi
NARO National Agricultural Research Organisation
NKG Neumann Kaffee Gruppe
NGO Non-Governmental Organisation
NUCAFE National Union of Coffee Agribusiness and Farm Enterprises
NTAEs Non-Traditional Agricultural Exports
NYBOT New York Board of Trade
OGS Organic Guarantee System
OLS Ordinary Least Squares
PEs Public Enterprises
POs Producer Organisations
PSCR Primary School Completion Rate
SACCOS Savings and Credit Cooperative Society
SAPs Structural Adjustment Programs
SCA Specific Catchment Area
SCP Sustainable Coffee Program
SDG Sustainable Development Goals
SECU Sebei Elgon Cooperative Union
SOC Soil Organic Carbon
SRTM Shuttle Radar Topography Mission
SSA Sub-Saharan Africa
TAECs Traditional Agricultural Export Crops
UBOS Uganda Bureau of Statistics
UCA Uganda Cooperative Alliance
UCDA Uganda Coffee Development Authority
UCF Uganda Coffee Federation
UCRA Uganda Coffee Roasters Association
UFC Uganda Finance Corporation
UGX Uganda shillings
xvii
Utz Good Coffee in Mayan language
UNADA Uganda National Agro-input Dealers Association
UNEX Union Export Services
USD United States Dollars
UPE Universal Primary Education
USE Universal Secondary Education
VSLA Village Savings and Lending Associations
WRS Warehouse Receipt System
xviii
Table of Contents Chapter 1 ................................................................................................................................................. 1
General Introduction ............................................................................................................................... 1
1. Introduction ................................................................................................................................. 1
2. Literature review ......................................................................................................................... 2
3. Research objectives ..................................................................................................................... 8
4. Case study background ............................................................................................................... 9
5. Thesis outline ............................................................................................................................ 21
Chapter 2 ............................................................................................................................................... 28
Liberalisation and Modernisation in the Coffee Value Chain in Uganda ............................................. 28
1. Introduction ............................................................................................................................... 28
2. Methods and data ...................................................................................................................... 29
3. The pre-reform period ............................................................................................................... 31
4. The collapse and the reforms .................................................................................................... 35
5. The post-reform period ............................................................................................................. 36
6. Conclusion ................................................................................................................................ 48
Chapter 3 ............................................................................................................................................... 49
Private Sustainability Standards in the Ugandan Coffee Sector: Empty Promises or Catalysts for
Development? ....................................................................................................................................... 49
1. Introduction ............................................................................................................................... 49
2. Background and data ................................................................................................................. 50
3. Methods..................................................................................................................................... 55
4. Results ....................................................................................................................................... 57
5. Discussion ................................................................................................................................. 62
6. Conclusion ................................................................................................................................ 65
Chapter 4 ............................................................................................................................................... 73
Do private food standards fulfil their child welfare promises? Coffee certification and schooling in
Uganda .................................................................................................................................................. 73
1. Introduction ............................................................................................................................... 73
2. Conceptual discussion ............................................................................................................... 75
xix
3. Background and data collection ................................................................................................ 78
4. Econometric methods ................................................................................................................ 81
5. Results ....................................................................................................................................... 83
6. Discussion ................................................................................................................................. 90
7. Conclusion ................................................................................................................................ 92
Chapter 5 ............................................................................................................................................... 98
Do Multiple Coffee Standards Address the Economic and Environmental Sustainability Trade-off? 98
1. Introduction ............................................................................................................................... 98
2. Methods and data .................................................................................................................... 100
3. Results ..................................................................................................................................... 103
4. Discussions ............................................................................................................................. 109
5. Conclusions ............................................................................................................................. 111
Chapter 6 ............................................................................................................................................. 126
General Conclusions ........................................................................................................................... 126
1. Main research findings ............................................................................................................ 126
2. Research Implications ............................................................................................................. 128
Popular Summary................................................................................................................................ 148
CURRICULUM VITAE .................................................................................................................. 150
1
Chapter 1
General Introduction
1. Introduction
Three decades ago, key agri-food value chains in developing countries were under full state
control. Most developing country economies depended on the export of a few Traditional Agricultural
Export Crops (TAECs) to earn foreign exchange which they used for imports needed for
industrialisation and consumption (Kherallah et al, 2002; Akiyama et al, 2003). They established Public
Enterprises (PEs) which controlled the production and marketing of the TAECs, from which the
government deducted revenue, before paying the farmers, practically taxing agriculture. By the early
1980s, most developing country economies were in balance of payments crisis due to several reasons
including oil shocks, declining world commodity prices, natural disaster and civil wars (Okidi et al,
2007). Another important reason for the balance of payments crisis is the fact that increasing revenue
extraction from agricultural commodities whose prices were on a downward trend, could no longer
work (Kherallah et al, 2002; Akiyama et al, 2003). International donors could only offer credit to
African countries, on condition that they implemented Structural Adjustment Programs (SAPs),
designed by the International Monetary Fund (IMF) and the World Bank. This situation forced
developing countries to liberalise trade (Ridell, 1992; SAPRI, 2004).
Liberalisation meant rolling back the government from business and allowing private actors to
occupy this business space, with the expectation that from competition, price incentives would reach
farmers, raise their incomes and address poverty. Although some effects of liberalisation, such as higher
revenues to producers were felt immediately, others such as new institutional arrangements were not
felt for several years, leading to intense debates as to whether developing countries, particularly
smallholder producers in sub-Saharan Africa (SSA), benefited from liberalisation (Akiyama et al, 2003;
Krivonos, 2004; Delpeuch & Vandeplas, 2013). Today, the PEs are privatised, private sector leads in
business, bring in Foreign Direct Investment (FDIs), engage in many innovations, leading to
modernisation of agri-food value chains. As liberalisation of trade deepens, consumers in high income
countries increasingly express their concerns about, not only food safety and quality aspects of
globalised agri-food trade, but also about the many negative effects on smallholder producers in
developing countries, and on the environment globally. These concerns led to the emergence of an
important innovation, the private food standards and their rapid spread in global agri-food value chains
(Swinnen & Maertens, 2007; Maertens & Swinnen, 2012). Today, private food standards are important
commercial and institutional innovations, playing a key role in value chain restructuring and

2
modernisation processes in developing countries. The conditions for compliance with private food
standards are now beyond food safety and quality, and include economic, social and environmental
indicators. In the literature, private food standards are used synonymously with private sustainability
standards and voluntary sustainability standards.
2. Literature review
2.1 Liberalisation of agri-food value chains in Africa
In the literature, there is consensus over some benefits to smallholder farmers in SSA. Several
authors confirm that smallholder farmers are receiving a higher share of the world commodity prices
compared to the pre-liberalisation days (Akiyama et al, 2003; Krivonos, 2004; Rusell et al, 2012;
Delpeuch & Vandeplas, 2013). This implies that farmers are receiving higher revenues. Smallholder
producers are also expected to benefit from FDIs flowing into value chains in which they are involved.
Some authors contend that FDI has flowed into areas such as processing of high value chains, especially
the fresh fruits and vegetables export sector (Maertens & Swinnen, 2012) and through domestic
investments in high value chains to supply supermarkets (Weatherspoon & Reardon, 2003). Other
authors admit however, that FDI did not flow into most SSA countries immediately after liberalisation
because the private sector did not exist (Belshaw et al 1999) and in some cases, policy reversal by
governments discouraged them (Delpeuch & Vandeplas, 2013). However, a decade after liberalisation,
some sectors in SSA started to recover, similar to countries in Central and Eastern Europe (Swinnen et
al, 2010).
Another important benefit of liberalised agri-food trade is the numerous innovations associated
with private sector leadership. The competitive environment in which they operate, coupled with the
investments they bring, stimulate actors and supporters, in an inter-dependent system of innovation, to
upgrade and modernise agri-food value chains. Several authors highlight innovations taking place in
high value agri-food chains at a technical level, for example new technologies, information and
knowledge; at commercial level such as labelling to differentiate products and; at institutional levels,
for instance through vertical co-ordination (Gomez et al, 2011; Swinnen & Maertens, 2007; Reardon et
al, 2009). Others contend that private food standards are particularly used by private sector
implementers, on the one hand as commercial innovations for capturing niche markets, and on the other
as institutional innovations for governing some global agri-food value chains, with mixed benefits for
smallholder producers (Henson & Reardon, 2005; Henson & Humphrey, 2010; Graeme, 2010). Private
food standards come with many promises, ranging from food safety, through ethical standards, to care
for the environment. In order to fulfil these promises, they also impose conditions on production and
marketing processes, increasing production costs and exerting extra pressure on smallholder producers
whose resources are already limited. Most private food standards also come with an extra premium
which consumers are willing to pay, over and above conventional prices in order to compensate for the
3
efforts of producers and other chain actors to comply with the conditions (Beuchelt & Zeller, 2013;
Vecchio & Annunziata, 2015; Rousseau, 2015). Although there are many studies on benefits of
liberalisation, it is interesting to re-visit a specific liberalised agri-food sector in a developing country
to understand the innovations and modernisation processes taking place, over two decades later.
2.2 Private coffee standards and welfare promises
Private food standards are rapidly spreading in agri-food value chains that are traded between
developing and high income countries. They have become important tools to guarantee consumers in
high income countries, that production, processing and handling methods of food products satisfy the
safety, ethical, and environmental standards they demand (Henson & Humphrey, 2010). Furthermore,
studies reveal that besides private coffee standards giving the poor producers the opportunity to almost
double their income in case of double certification compared to selling conventional coffee, there are
other benefits which include: improved natural resource management and biodiversity conservation,
crop resilience to weather and climactic risk, community or organizational development and fewer
health risks due to misuse of agrochemicals (Giovannucci & Koekoek,2003). Private food standards
therefore, make many promises to consumers about various outcomes at producer level. For example,
Fairtrade claims to provide farmers with a better deal that allows them to improve their lives and to
offer consumers a powerful way to reduce poverty through their everyday shopping (Fairtrade
International, 2016). Likewise Utz program enables farmers to learn better farming methods, improve
working conditions and take better care of their children and the environment (Utz, 2016). Available
literature includes studies on welfare impact on cocoa producers (Gilbert & Varangis, 2004; Wilcox, &
Abbott, 2004) and cotton producers in West Africa (Delpeuch & Vandeplas, 2013) in West Africa. The
most documented in literature are studies on welfare impact on smallholder coffee producers but
findings are mixed. Some of them find positive welfare impact (Chiputwa et al. 2015) while others find
ambiguous or even negative impact on small producers (Barham & Weber (2012; Beuchelt & Zeller,
2011; Mitiku et al, 2017). Mixed findings reflect the complexity of impacts of private food standards,
as well as the fact that they are industry- and context-specific (Beghin et al, 2015; DeFries et al, 2017).
Coffee is considered a pioneer commodity in certification to sustainability standards (Reinecke et
al, 2012). The global area certified to the 5 main coffee standards has seen tremendous growth between
2008 and 2013. Fairtrade by 20%, Organic by 50%, Utz doubled, Rainforest alliance tripled and 4C
grew by almost 600%. By 2012, certified coffee production to these five standards together, unadjusted
for multiple certification, as a share of global coffee production was approximately 39%; Fairtrade was
5%, Organic 3%, Utz 8%, Rainforest alliance 3% and 4C 20% (Lernoud et al, 2016). The markets for
sustainable coffee however, are persistently characterised by oversupply. In spite of the high percentage
of certified coffee production in 2012, only 12% of global coffee exports were certified to these
standards, implying that some of the coffee produced as standards compliant is traded as conventional
(Potts et al, 2014). Most case studies analysing the welfare impact of private coffee standards on
4
smallholder producers are from Latin America (for example, Bacon, 2005; Bacon et al, 2008; Barham
& Weber, 2012; Beuchelt & Zeller, 2011; Ruben & Fort, 2012; Valkila & Nygren, 2010; Wollni &
Zeller, 2007). Some studies are clear about higher producer prices of certified coffee being the channel
of effect in Nicaragua and Costa Rica (Bacon, 2005; Wollni & Zeller, 2007; Dragusanu et al, 2014).
Other studies argue that yield, rather than producer prices are the more important channel of effect
(Barham & Weber, 2012). Others studies however, find ambiguous effects of certification. Bacon et al,
(2008) conclude that while certified coffee cooperatives performed better in terms of impacts on
education, infrastructure investment, savings and the environment, key livelihood issues such as food
insecurity and low incomes remained. Ruben & Zuniga (2011) contend that while Fairtrade is helpful
in hooking producers on to the market and offering higher prices to coffee producers in Northern
Nicaragua, private labels such as Rainforest Alliance and Café practices, perform better in improving
coffee yields and upgrading quality. Weber (2011) argues that although Fairtrade-Organic farmers in
Southern Mexico made higher gross income gains of 5% excluding costs of certification, this small gain
suggests that the potential for price premium to raise returns to coffee producers is low.
In the recent past the number of case studies from Africa are increasing but they are still few and
findings are mixed as well. While Bolwig (2009) find positive revenue effects for organic coffee
producers in Uganda, Jena et al (2012) find limited impact on livelihoods for Fairtrade-Organic
producers in Ethiopia. Other studies reveal ambiguous findings even within the same context. Chiputwa
et al (2015) find a positive impact on per capita and household expenditure for Fairtrade coffee
producers in central Uganda, when disaggregated but no impact for Utz and Organic coffee producers.
Van Rijsbergen et al (2016) find that although Fairtrade coffee producers in Kenya achieve higher yields
and receive higher prices, non-certified farmers in the same area have higher household incomes
because of less specialisation in coffee production which allows them to hire more labour and free own
labour for other economic activities. Mitiku et al (2017) report that although Rainforest alliance and
Fairtrade-Organic increase incomes and reduce poverty as a result of higher prices, in the dis-aggregated
form Fairtrade has no impact on poverty and Organic reduces household income of producers.
Majority of empirical evidence on the welfare impact of private coffee standards focus either on
single or double standards: Bacon, (2005) and Bacon et al (2008) in Nicaragua; Bolwig (2009) in
Uganda; Beuchelt & Zeller (2011) in Nicaragua; Weber (2011) in southern Mexico; Ruben & Fort
(2012) in Peru; and Dragusanu et al (2014) in Costa Rica. Moreover most of the studies mentioned
above do not control for differences in agro-ecological conditions. Only few studies control for altitude
of coffee plots (Bolwig et al., 2009; Chiputwa et al., 2015; Wollni & Zeller, 2007).
There are three main research gaps regarding the welfare impact of private coffee standards. First,
since most documented evidence is based on case studies from Latin America, it is difficult to generalise
these conclusions for smallholder producers in SSA, due to limitations of representativeness. Yet, a
large number of smallholder producers, about 11.7 million (47% of world producers) live there (ICO,
5
2015), and most of them in poverty (Eakin et al, 2009). Second, most studies are based on cases from
single or double certified producers, yet certification to multiple coffee standards is in vogue today, as
companies strive to capture larger shares of the sustainability niche markets. Third, while participation
in certification may be influenced by other un-observed characteristics of participating households,
most studies do not address this endogeneity problem which may lead to under- or over-estimation of
effects. Furthermore, only few of these studies control for differences in agro-ecological conditions,
mostly altitude (Chiputwa et al., 2015), and yet, these can have important influence on outcomes of
private food standards.
2.3 Private coffee standards and child welfare promises
A critical challenge that emerged following liberalisation of trade is the use of child labour,
especially in manufacturing sectors in Asia. This happened mostly due to migration of some
manufacturing jobs to developing countries where labour is cheap (Chakrabarty & Grote,2009;
Chakrabarty et al, 2011). In addition, cost sharing for most services in the social sector, especially health
and education, due to reduced government subsidies, led to increasing poverty among poor smallholder
households (Oketch et al, 2010; Muyinda & Mugisha, 2015; Montaud & Tankari, 2016). The precarious
situation of children in such poor households and the consensus on the importance of education as an
important indicator for child welfare and the best long term investment in human capital (Handa, 2002;
Handa, 2004), led to action at different levels. The International Labour Organisation (ILO) adopted
convention 182 against the worst form of child labour, in addition to other conventions that already
existed on minimum age of admission to employment. Some governments in developing countries too,
responded with social safety net programs. Concurrently, private standard setting organisations ensured
that child labour prohibition became a cross-cutting condition in most private food standards. Today,
most private food standards promise child-labour-free production, processing, handling and marketing
of agri-food products, going well beyond wage employment of children in industries. Of the five
standards considered in this PhD project, all except organic, explicitly prohibit child labour. The
underlying assumption of this child-labour-free condition is the same as that behind the ILO
conventions which is that the best way to address the child labour problem is to keep children in school.
This implies that the aim of this condition is to increase child schooling. By so doing, this condition
improves, both the welfare of children and human capital development, with long-term benefits for
society (Handa, 2004). The pertinence of the child-labour-free condition in private food standards is
logical since they aim to address some of the key determinants of child schooling outcomes such as
household income, living standards and child nutrition, as well as keeping children in school (Handa,
2004; Lincove, 2009; Zhao & Glewwe, 2010; Mani et al, 2013).
A large stream of literature on child welfare investigates the impact of Conditional Cash Transfers
(CCT) on child schooling outcomes and confirms income as a key determinant for the demand side of
education since CCTs are meant to reduce poverty and offer incentives to parents to educate children,
6
rather than put them to work. Although most findings are positive regarding the impact of conditional
cash transfers on school enrolment, they also highlight limitations of such programs in achieving some
outcomes. For example, De Janvry et al, (2006) find that conditional cash transfers do not stop parents
from engaging children in work as a coping mechanism against income shocks. Gitter & Barham (2008),
using data from Nicaragua argue that although more household resources are spent on children when
mothers are empowered, when the mother’s power increases beyond that of the husband, the impact on
enrolment is negative. Ganimian & Murnane (2016) in a literature review conclude that while
conditional cash transfers have positive impact on school enrolment, they have no impact on
achievement. Other authors highlight broader impacts such as gains in terms of reduced working hours
by older brothers of program-eligible children in Nicaragua (Lincove & Parker, 2016). Male children
program participants in the US have more years of schooling, are healthier and have higher income in
adulthood (Aizer et al (2016). Using case studies from Kenya, Peru and Palestine however, Jones &
Samuels (2015) stress that it is critical to consider both demand and supply side challenges as entry-
points for conditional cash transfer programs.
Various positive social outcomes have been reported on the effects of private standards on
participating households in general, as well as on children in particular. In the carpet industry in India
and Nepal, Chakrabarty and Grote (2009) find a positive correlation between social labelling and
removal of children from paid work, for better off households. In a similar study in the carpet industry
in Nepal Chakrabarty et al (2011) find that social labelling increases child schooling and reduce child
labour in participating households and conclude that wage labour is one of the biggest hindrances to
child school enrolment. Other authors argue that a bigger problem however, is the invisible child labour
issue of children helping on parents’ farms in developing countries, and these can have important effects
as well. Regarding private food standards, Becchetti & Costantino (2008) report increased food
consumption among Fairtrade herb participants in Kenya. Becchetti et al (2013) find positive impact of
Fairtrade on child schooling among honey producers in Chile. Concerning private coffee standards,
several authors report positive impact on child schooling. For instance, Chiputwa & Qaim (2016) report
a positive indirect impact of coffee certification on nutrition among coffee farmers in Uganda, mainly
through higher incomes and improved gender equity. Participation in coffee certification in Mexico
increases years of schooling more for girls than for boys in the age cohort 16-25 years (Gitter et al,
2012). Arnould et al (2009) conclude that participation in Fairtrade certification by coffee producers in
Nicaragua, Guatemala and Peru has a positive impact on primary education.
I see two research gaps in literature on the impact of private food standards on child schooling.
First, most of the studies are on effects of conditional cash transfer programs by governments on child
schooling among households which benefit, mostly in Latin America. Another set of studies which
explore the effects of social labelling in the carpet industry on child schooling are conducted in a context
of the manufacturing export sector in South east Asia. Second the few available studies on the effects
7
of private coffee standards on child schooling, are mostly in Latin America. The literature on effects of
private coffee standards on child schooling in Africa is scarce. Relevant as all these studies are, they
fail to address child schooling in rural areas in Africa where 11.7 million smallholder farmers are
producing coffee for export and engaging children in unpaid family labour on farms. Lack of incentives
in households addressed by government programs which inject cash and wage employment of children
in the manufacturing export sector addressed by social labels are both quite different from engagement
of children in agricultural activities in the rural farm sector within the household. Such participation in
agricultural activities may hamper child schooling and yet, is generally invisible.
2.4 Private coffee standards and promises on care for the environment
One of the biggest challenges of our times is climate change (IPCC, 2007). There is now consensus
among scientists about the big ecological footprint of agriculture and the contribution it makes to
climate change, natural resources degradation and some of the negative effects of climate related
disasters we see today (Molden, 2007; Kiers, 2008; McIntyre, 2009). Furthermore, given that 11.7
million smallholder producers in Africa depend on coffee production as a main income source, many
living in poverty (Eakin et al, 2009) and that coffee trade has been identified as a major cause of
biodiversity threats in tropical countries (Lenzen et al, 2012), sustainable coffee cultivation remains a
challenge. Private coffee standards which promise actions that address climate change at specific stages
of the value chains are a response to this global societal need and are therefore, highly attractive to
concerned consumers. Such consumers are willing to pay a price premium for labelled products which
guarantee that such actions are indeed being taken from farm to supermarkets. These standards are
considered market based instruments for addressing sustainability (Rueda & Lambin, 2013), and come
with many promises regarding care for the environment. Organic promises a production system that
sustains the health of soils, ecosystems and people (IFOAM, 2016). Likewise, Rainforest Alliance
claims to ensure the long-term economic health of forest communities through protecting ecosystems,
safeguarding the well-being of local communities and improving productivity (Rainforest Alliance,
2016). Utz on its part assures consumers that products have been sourced in a sustainable manner
along the whole value chain (Utz, 2016).
Several studies document the impact of private coffee standards on agronomic management
practices of producers. Blackman & Naranjo (2012) find that organic certification improves coffee
producers' environmental performance in Costa Rica by significantly reducing chemical input use and
increasing the use of organic fertiliser which is an environmentally friendly management practice.
Rueda & Lambin (2013) reveal that Rainforest alliance coffee certification has a positive impact on
management practices, while at the same time improving the producers’ well-being and their
communities. Environmental benefits include tree diversity, watershed protection, infrastructure for
water-use efficiency and wastewater management. Producers also adopt integrated management
strategies for the berry borer and coffee leaf rust management, as well as the use of organic-inorganic
8
fertiliser combinations. On the contrary, Elder et al (2013) find that in Rwanda, national regulations
and policy are important in improving agronomic practices of producers rather than FT certification.
Other studies focus on the impact of private coffee standards on ecological benefits. In a study
among certified coffee producers in Costa Rica, Guatemala and Nicaragua, Haggar et al (2015) find
that certified coffee producers performed better on several environmental indicators. Organic farms had
higher tree diversity, shade levels and more tree strata than the non-certified farms. In Nicaragua,
Rainforest alliance certified farms had greater diversity, including old-growth forest species. Hardt et
al (2015) reports similar findings that socio-environmental certification in the Brazilian coffee sector is
important in reducing deforestation, protecting habitats and contributing to their connectivity. Rueda et
al (2015) further confirm that coffee-growing regions in Colombia have larger areas of forest cover and
forest patches, as well as better connectivity among patches than non-coffee areas, a decade after shade
coffee certification, implying the impact of certification on tree cover increase.
A few studies focus on trade-off between the socio-economic and the environmental impact of
private food standards with mixed findings. Perfecto et al (2005) conclude that achieving the
conservation of forest sensitive species in Mexico will require price premium for shade coffee
certification higher than for other certifications which do not affect yield and moreover, it should be
channelled directly to the producers. Gordon et al (2007) on the contrary, demonstrate that high-
biodiversity coffee cultivation can be compatible with high profitability, and has significant potential
for conserving biodiversity in coffee-growing regions in Mexico, but only as a substitute for low
biodiversity coffee cultivation, not forest.
There are three specific research gaps in literature on the impact of private coffee standards and
the environment. First, majority of the studies are disciplinary with some focusing on impact on
agronomic practices and others focussing on impact on ecological indicators. Second, literature on the
trade-off between socio-economic and environmental effects are rather scarce and yet, multiple
certification, combining standards which put different emphasis on producer welfare and on the
environment, is on the rise. Third, most of the studies are based on case studies from Latin America.
3. Research objectives
The overall purpose of this PhD Thesis is to disentangle the link between private coffee standards
and the performance of smallholder farmers in Uganda, on sustainable development outcomes. We
specifically look at private coffee standards which have been spreading in Uganda as part of both
commercial and institutional value chain innovations by export companies, in response to demands by
consumers who are aware of the negative effects of liberalised trade. The focus on private coffee
standards intends, on the one hand to address the on-going debate on the effects of these standards on
sustainable development outcomes at smallholder producer level and on the other, to contribute
9
empirical evidence to existing scientific literature. Ultimately this PhD aims at formulating policy
implications for ensuring that smallholder coffee production systems achieve sustainable development
outcomes.
By building on existing work on the impact of private food standards on smallholder producers in
developing countries, we make five main contributions. First, we contribute to the debate with a new
case study from Uganda. Second, we describe the on-going innovations and modernisation processes
taking place in the coffee value chain in Uganda, as well as the driving forces behind them, over two
decades after liberalisation. Third, since coffee is the most important source of livelihood for
smallholder producers in Mount Elgon, we investigate the implications of coffee certification to private
food standards on their welfare. Fourth, since most private standards prohibit child labour with the aim
of improving child welfare, we assess what the implications are for child schooling. Finally, since
compliance with conditions of private standards that improve environmental outcomes may undermine
welfare outcomes, we evaluate the welfare-environmental trade off implications of certification to
private food standards.
We address these research gaps using qualitative data from coffee chain stakeholders in Uganda
and historical coffee data to highlight the on-going modernisation of the coffee value chain in Uganda.
In addition, we use cross-sectional household, plot and village survey data gathered from rural areas of
the Mount Elgon region of eastern Uganda. We focus on a double Fairtrade-Organic and a triple Utz-
Rainforest-4C coffee certification schemes. We employ various econometric techniques, to enable me
overcome methodological limitations in literature and attribute the observed impact to private coffee
standards.
4. Case study background
4.1 Coffee production in Uganda
Currently Uganda comes second to Ethiopia as far as coffee exports from SSA is concerned, and
ranks the 11th in the world (ICO, 2016). Coffee production consists of 80% Robusta (Coffea robusta)
and 20 % Arabica (Coffea arabica). Robusta is an indigenous variety to Uganda, traditionally shared
and chewed among elders in important ceremonies such as weddings and other rituals of friendship.
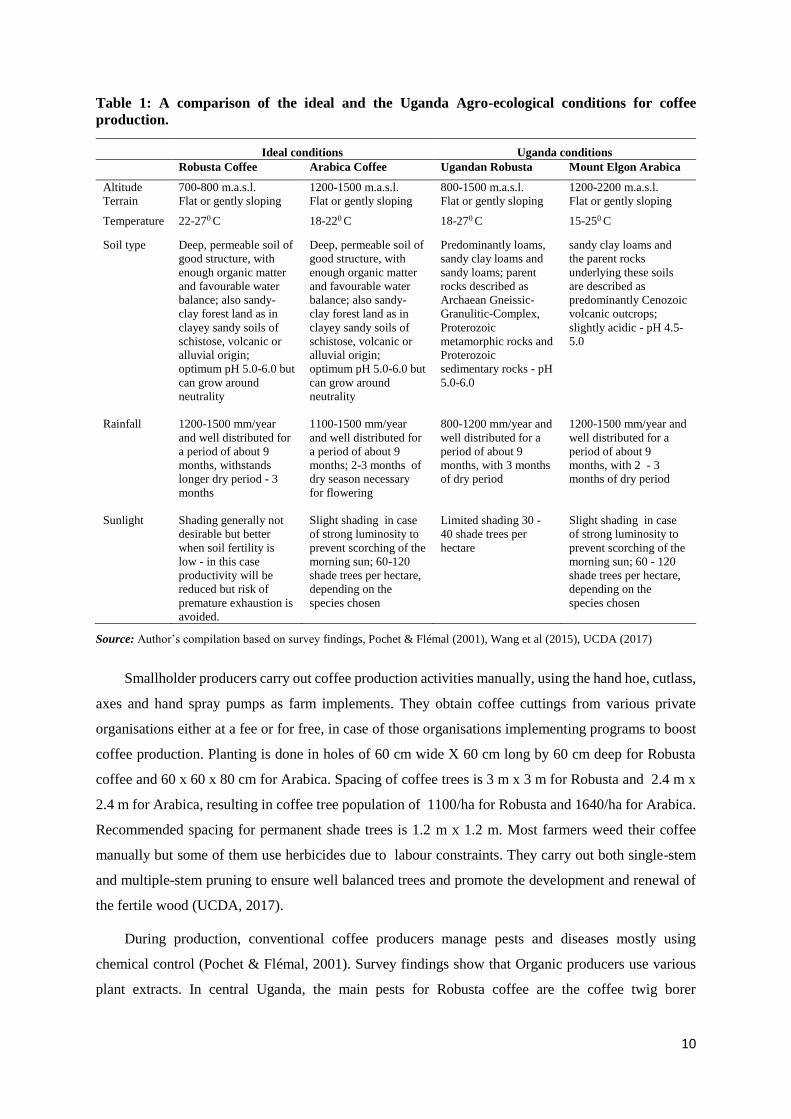
The country is endowed with optimum agro-ecological conditions for coffee production (table 1). The
Arabica variety, indigenous to Ethiopia, was introduced in Uganda from Central America (Yadessa,
2014). Besides the agro-ecological conditions, agronomic practices matter in coffee production. The
UCDA, recommends Good Agronomic Practices (GAP) for coffee production in different agro-
ecological zones in the country, from planting through management of the coffee trees in the garden,
up to harvesting.
10
Table 1: A comparison of the ideal and the Uganda Agro-ecological conditions for coffee
production.
Ideal conditions Uganda conditions
Robusta Coffee Arabica Coffee Ugandan Robusta Mount Elgon Arabica
Altitude 700-800 m.a.s.l. 1200-1500 m.a.s.l. 800-1500 m.a.s.l. 1200-2200 m.a.s.l.
Terrain Flat or gently sloping Flat or gently sloping Flat or gently sloping Flat or gently sloping
Temperature 22-270 C 18-220 C 18-270 C 15-250 C
Soil type Deep, permeable soil of
good structure, with
enough organic matter
and favourable water
balance; also sandy-
clay forest land as in
clayey sandy soils of
schistose, volcanic or
alluvial origin;
optimum pH 5.0-6.0 but
can grow around
neutrality
Deep, permeable soil of
good structure, with
enough organic matter
and favourable water
balance; also sandy-
clay forest land as in
clayey sandy soils of
schistose, volcanic or
alluvial origin;
optimum pH 5.0-6.0 but
can grow around
neutrality
Predominantly loams,
sandy clay loams and
sandy loams; parent
rocks described as
Archaean Gneissic-
Granulitic-Complex,
Proterozoic
metamorphic rocks and
Proterozoic
sedimentary rocks - pH
5.0-6.0
sandy clay loams and
the parent rocks
underlying these soils
are described as
predominantly Cenozoic
volcanic outcrops;
slightly acidic - pH 4.5-
5.0
Rainfall 1200-1500 mm/year
and well distributed for
a period of about 9
months, withstands
longer dry period - 3
months
1100-1500 mm/year
and well distributed for
a period of about 9
months; 2-3 months of
dry season necessary
for flowering
800-1200 mm/year and
well distributed for a
period of about 9
months, with 3 months
of dry period
1200-1500 mm/year and
well distributed for a
period of about 9
months, with 2 - 3
months of dry period
Sunlight Shading generally not
desirable but better
when soil fertility is
low - in this case
productivity will be
reduced but risk of
premature exhaustion is
avoided.
Slight shading in case
of strong luminosity to
prevent scorching of the
morning sun; 60-120
shade trees per hectare,
depending on the
species chosen
Limited shading 30 -
40 shade trees per
hectare
Slight shading in case
of strong luminosity to
prevent scorching of the
morning sun; 60 - 120
shade trees per hectare,
depending on the
species chosen
Source: Author’s compilation based on survey findings, Pochet & Flémal (2001), Wang et al (2015), UCDA (2017)
Smallholder producers carry out coffee production activities manually, using the hand hoe, cutlass,
axes and hand spray pumps as farm implements. They obtain coffee cuttings from various private
organisations either at a fee or for free, in case of those organisations implementing programs to boost
coffee production. Planting is done in holes of 60 cm wide X 60 cm long by 60 cm deep for Robusta
coffee and 60 x 60 x 80 cm for Arabica. Spacing of coffee trees is 3 m x 3 m for Robusta and 2.4 m x
2.4 m for Arabica, resulting in coffee tree population of 1100/ha for Robusta and 1640/ha for Arabica.
Recommended spacing for permanent shade trees is 1.2 m x 1.2 m. Most farmers weed their coffee
manually but some of them use herbicides due to labour constraints. They carry out both single-stem
and multiple-stem pruning to ensure well balanced trees and promote the development and renewal of
the fertile wood (UCDA, 2017).
During production, conventional coffee producers manage pests and diseases mostly using
chemical control (Pochet & Flémal, 2001). Survey findings show that Organic producers use various
plant extracts. In central Uganda, the main pests for Robusta coffee are the coffee twig borer
11
(Xylosandrus morstatti), controlled using cultural methods, by regular removal and burning of suckers
and damaged branches. For Arabica coffee, the most important pest is the coffee white stem borer
(Xylotrechus quadripes), controlled using cultural methods, by uprooting and burning of infested trees,
treating the stems during the oviposition period to kill or dislodge eggs and young larvae, catching and
killing of adult stem borers during their period of activity, and maintaining shelter belts in order to shade
the coffee bushes. Organic producers use soda ash against the stem borer. In North western Uganda, the
coffee leaf miner (Leucoptera coffeicola) which are caterpillars causing minor damage, is controlled by
systemic fungicides (Wang et al, 2015). The main disease which attacks both Robusta and Arabica
coffee is the Coffee Berry Disease (CBD) or anthracnose of the berries (Colletotrichum kahawae or
Colletotrichum coffeanum). While conventional coffee producers use fungicides against CBD, Organic
certified producers use cow urine. In Eastern Uganda, the coffee leaf rust caused by a fungi (Hemileia
vastatrix), is the main disease in Arabica coffee. Non-Organic certified producers control it using copper
fungicide while Organic certified producers use extracts of Tephrosia and Tithonia. In the recent past,
pests and diseases have not posed a threat to coffee production in Uganda. Smallholder farmers harvest
coffee manually by carefully hand-picking mature coffee beans of optimum ripeness (UCDA, 2017).
4.2 Evolution of the coffee export chain in Uganda
In the 18th century, coffee became a colonial product and has been of strategic importance to the
country’s economy for decades. Since then until 1991, the government controlled the coffee sector
through a public enterprise, the Coffee Marketing Board (CMB) and the co-operative structure across
the country. During this period the government also invested in an institutional framework to develop
the coffee sector. These included: provision of coffee specific extension services through the department
of agriculture; provision of coffee research services by the coffee unit within the National Agricultural
Research Organisation (NARO); investment finance for the sector by the Uganda Development
Corporation (UDC) and; crop finance through the co-operative bank. This control was relinquished in
1992 as part of the trade liberalisation policies implemented by the government. In 2001, coffee
production was introduced in Northern Uganda, as a tool for poverty reduction in a region that had been
engulfed in a 15-year-old civil war. In the new coffee policy developed in 2013, the role of government
is reduced to regulation only and private sector leads the sector. Today, while most coffee production
(93%) is realised by approximately 1.7 million smallholder producers, medium scale individual coffee
farmers produce 6.5 % of the coffee and the remaining 0.5 per cent is under Kaweri Coffee Plantation
(KCP). Coffee in Uganda maintains its strategic importance and is currently produced in most districts
across the country (figure 1). Direct employment in various value chain activities of the coffee industry
is estimated at about five million people.
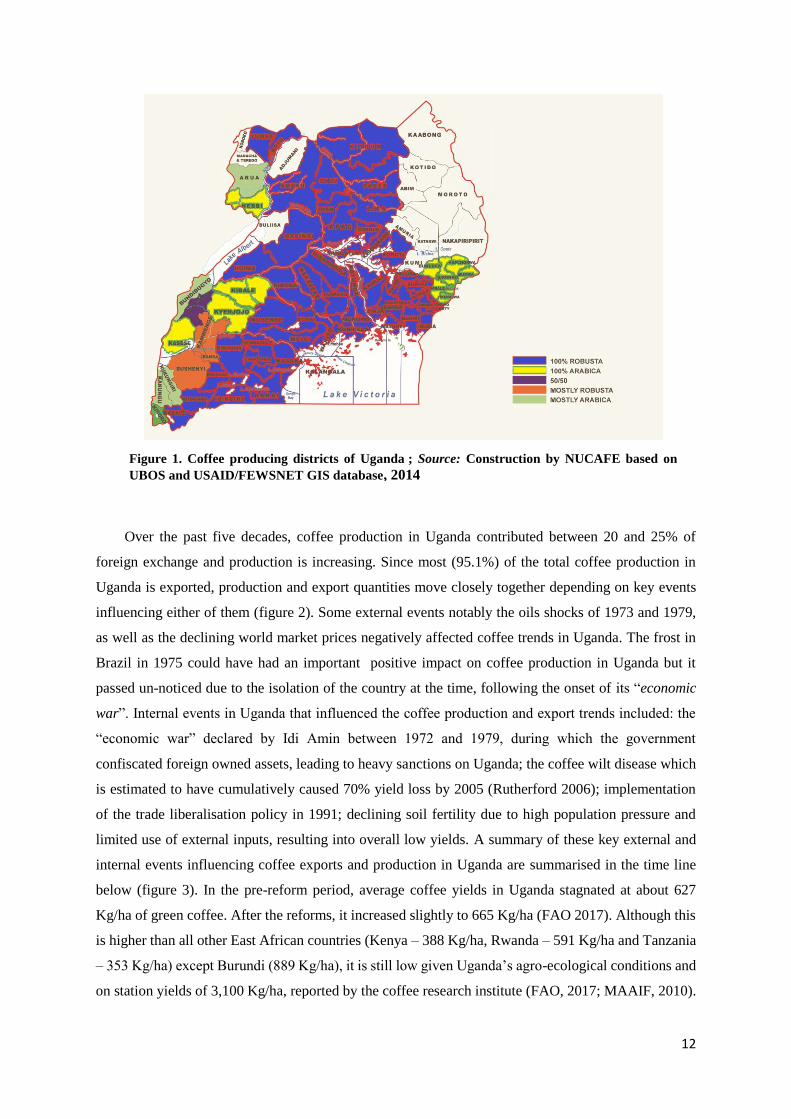
12
Over the past five decades, coffee production in Uganda contributed between 20 and 25% of
foreign exchange and production is increasing. Since most (95.1%) of the total coffee production in
Uganda is exported, production and export quantities move closely together depending on key events
influencing either of them (figure 2). Some external events notably the oils shocks of 1973 and 1979,
as well as the declining world market prices negatively affected coffee trends in Uganda. The frost in
Brazil in 1975 could have had an important positive impact on coffee production in Uganda but it
passed un-noticed due to the isolation of the country at the time, following the onset of its “economic
war”. Internal events in Uganda that influenced the coffee production and export trends included: the
“economic war” declared by Idi Amin between 1972 and 1979, during which the government
confiscated foreign owned assets, leading to heavy sanctions on Uganda; the coffee wilt disease which
is estimated to have cumulatively caused 70% yield loss by 2005 (Rutherford 2006); implementation
of the trade liberalisation policy in 1991; declining soil fertility due to high population pressure and
limited use of external inputs, resulting into overall low yields. A summary of these key external and
internal events influencing coffee exports and production in Uganda are summarised in the time line
below (figure 3). In the pre-reform period, average coffee yields in Uganda stagnated at about 627
Kg/ha of green coffee. After the reforms, it increased slightly to 665 Kg/ha (FAO 2017). Although this
is higher than all other East African countries (Kenya – 388 Kg/ha, Rwanda – 591 Kg/ha and Tanzania
– 353 Kg/ha) except Burundi (889 Kg/ha), it is still low given Uganda’s agro-ecological conditions and
on station yields of 3,100 Kg/ha, reported by the coffee research institute (FAO, 2017; MAAIF, 2010).
Figure 1. Coffee producing districts of Uganda ; Source: Construction by NUCAFE based on
UBOS and USAID/FEWSNET GIS database, 2014
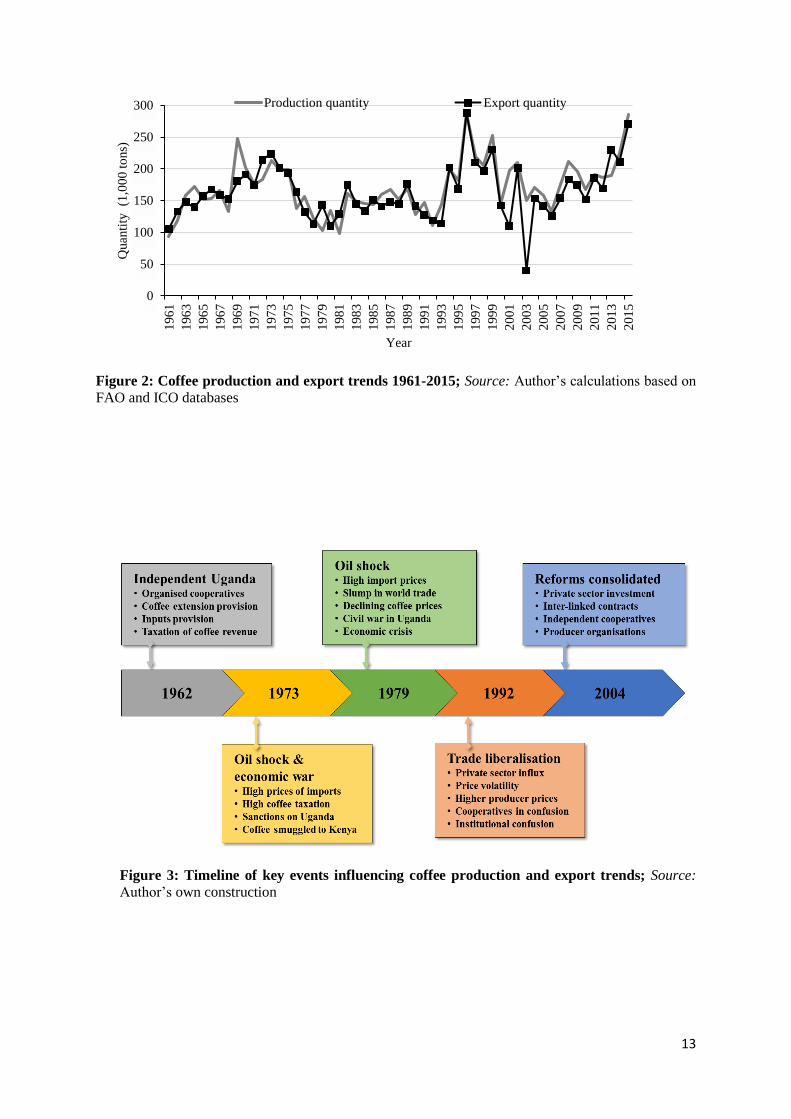
13
Figure 2: Coffee production and export trends 1961-2015; Source: Author’s calculations based on
FAO and ICO databases
Figure 3: Timeline of key events influencing coffee production and export trends; Source:
Author’s own construction
0
50
100
150
200
250
300
196
1
196
3
196
5
196
7
196
9
197
1
197
3
197
5
197
7
197
9
198
1
198
3
198
5
198
7
198
9
199
1
199
3
199
5
199
7
199
9
200
1
200
3
200
5
200
7
200
9
201
1
201
3
201
5
Quan
tity
(1
,00
0 t
ons)
Year
Production quantity Export quantity
14
Between 1961 and 1972 increasing production and exports are attributed to a combination of increasing
world prices and government investment in coffee. The decline between 1973 and 1981, followed by
stagnation until 1991 is attributed to a combination of the negative effects of the two oil shocks that
increased prices of imports, the “economic war” of 1972-78 and the civil war from 1979 to 1986.
Following trade liberalisation in 1992, coffee production and exports in Uganda experienced first a
decade of high volatility, then modest increase up to 2004. While the volatility is linked partly to
instability in the international coffee market and partly to domestic institutional gaps after liberalisation,
the modest increase is attributed to price incentives to coffee producers through higher share of world
coffee prices. From 2005 onwards, there has been steady growth, attributed to increased private sector
investment, especially in providing services to producers, through inter-linked contracts.
4.3 Standards in the coffee export chain
Coffee being a traditional cash crop in Uganda, the use of standards in the sector is as old the chain
itself. Clean green conventional coffee beans are certified according to the Ugandan public coffee
industry standard based on bean variety, weight size and the region within the country from which the
coffee. The grades start from highest to lowest quality. Robusta coffee beans are graded into: CRANE,
IMPALA, various grades of Screen and BHP, and BLACK BEANS. Arabica coffee from the Mount
Elgon region (Bugisu Arabica) is graded into - Grade AA, A, PB, B, C, UG and E; from western Uganda
into - WUGAR A, B, C and D; dry Arabica from Northern-Western Uganda into - DRUGAR A, B, C
and TRIAGE. According to interviews with staff of the Uganda Coffee Development Authority
(UCDA), Ugandan coffee was well-known for its high quality, especially in the pre-liberalisation
period. They further emphasise that up to today, international retailers and roasters value Ugandan
coffee for its flavour, a quality that seems to be linked to a combination of the altitudes at which the
coffee is produced and location of the country close to the equator. After liberalisation, coffee trading
was dominated by small unregistered middlemen (the ddebe boys) and, the quality of Uganda coffee
suffered. According to World Bank (2011), Uganda lost a substantial share of its international market
due to low quality. The situation has normalised due to certified graders instituted by UCDA, extra
investments in secondary coffee cleaning and processing by exporters and vertical co-ordination that
has emerged in the coffee sector in Uganda. Majority of the middlemen trading in coffee in rural areas
by the time of our survey are now linked to exporters or hulleries, some even with marketing contracts
and funds for their operations.
The emergence of private food standards in the coffee sector in Uganda in the early 1990s was
mostly with the help of Non-Governmental Organisations (NGOs), working in partnership with coffee
producers. The trend is linked to the genesis of certification worldwide (table A1), itself a result of
pressure from civil society groups, mostly NGOs, that highlighted the precarious poverty situation in
which coffee producers in developing countries lived, at a time when coffee prices were rising (Bacon,
2005). Once consumers in high income countries were aware of these issues, they demanded action on
15
the part of the companies and a demonstration that this action was being taken, hence the origin of
private food standards. Private standards in the coffee sector in Uganda started in 1994, with Fairtrade
supported by Twin trading UK, followed by organic in 1999 with the support of Swedish Export
Promotion of Organic Production in Africa (EPOPA) programme. In the year 2000 Utz was introduced
with the support of a Dutch NGO, Solidaridad, followed by the Common Code for the Coffee
Community (4C)1, which was introduced by export companies in 2008. Rainforest alliance was
introduced in 2009 by the NGO Rainforest Alliance international. According to our survey, these are
the main private standards in the coffee sector in Uganda, although, they are increasing in number.
According to survey findings, by 2014, an estimated 216,000 farmers, organised in independent
co-operatives or producer organisations, produced coffee certified to all the above standards, except 4C
which is considered the baseline industry standard verified only through internal monitoring and does
not appear on final products. Increasing quantities of Ugandan coffee is exported as sustainable coffees,
certified to private food standards. Deriving from the above producer figures however, about 13% of
coffee production in Uganda is certified to these 4 schemes, however, official export records estimate
that about 2% of total coffee exports are sustainable coffees (UCDA, 2017). This implies that not all
coffee produced under certification is sold as certified, confirming reports from certified farmers that
sometimes they sell their certified coffee as conventional. Exporters in Uganda are the certificate
holders, except for organic - and they are responsible for implementation and internal monitoring. From
survey findings, the costs of certification are mostly covered by donor funding. At national level, there
is no policy regarding sustainable coffees, although the government hopes to promote its expansion
among smallholder producers, as a way of re-positioning itself in the international coffee market. There
are no official records of certified coffee production and trade in the country, neither are benefits of
producing certified coffee documented. Most implementing companies believe certification adds value
in terms of conditions which have to be complied with and in terms of the niche markets they are able
to capture, but they admit that this value comes at a very high cost.
4.4 Research area
The research area covers five rural districts out of a total of eight in the Mount Elgon region in
Eastern Uganda (figure 4). The districts are, Bududa, Manafwa, Bulambuli, Sironko and Kapchorwa.
The latter is one of the three districts to the eastern side in a sub-region called Sebei while the former
four lie to the western side, in a sub-region called Bugisu. Key physical features in the region is an
extinct volcanic Mount Elgon (highest point of 4,322 m.a.s.l.) and the Mt. Elgon National Park. The
area ranges in altitude between 1,200 and 2,200 m.a.s.l. and has a bi-modal rainfall pattern (1,600 –
2,200 mm) and reasonably fertile soils. There are four main coffee exporting companies operating in
1 4C is now known as the Basic Common Code (BCC), after the 4C association was transformed into the Global
Coffee Platform (GCP) in 2016, to drive the sustainability agenda in the coffee industry.
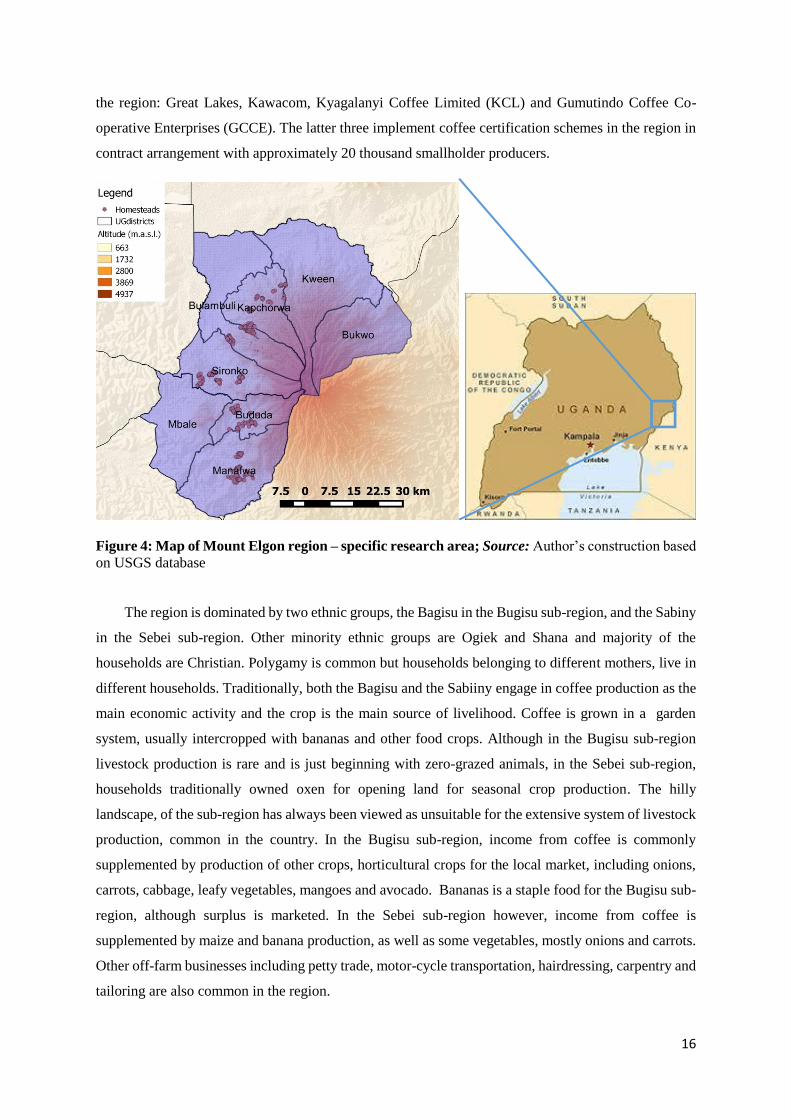
16
the region: Great Lakes, Kawacom, Kyagalanyi Coffee Limited (KCL) and Gumutindo Coffee Co-
operative Enterprises (GCCE). The latter three implement coffee certification schemes in the region in
contract arrangement with approximately 20 thousand smallholder producers.
Figure 4: Map of Mount Elgon region – specific research area; Source: Author’s construction based
on USGS database
The region is dominated by two ethnic groups, the Bagisu in the Bugisu sub-region, and the Sabiny
in the Sebei sub-region. Other minority ethnic groups are Ogiek and Shana and majority of the
households are Christian. Polygamy is common but households belonging to different mothers, live in
different households. Traditionally, both the Bagisu and the Sabiiny engage in coffee production as the
main economic activity and the crop is the main source of livelihood. Coffee is grown in a garden
system, usually intercropped with bananas and other food crops. Although in the Bugisu sub-region
livestock production is rare and is just beginning with zero-grazed animals, in the Sebei sub-region,
households traditionally owned oxen for opening land for seasonal crop production. The hilly
landscape, of the sub-region has always been viewed as unsuitable for the extensive system of livestock
production, common in the country. In the Bugisu sub-region, income from coffee is commonly
supplemented by production of other crops, horticultural crops for the local market, including onions,
carrots, cabbage, leafy vegetables, mangoes and avocado. Bananas is a staple food for the Bugisu sub-
region, although surplus is marketed. In the Sebei sub-region however, income from coffee is
supplemented by maize and banana production, as well as some vegetables, mostly onions and carrots.
Other off-farm businesses including petty trade, motor-cycle transportation, hairdressing, carpentry and
tailoring are also common in the region.

17
4.5 Data collection
Data collection took place in three phases in 2013 and 2014, yielding different outputs (figure 5).
In the first two phases I was the main responsible person for the data collection. In the third phase of
data collection, I was not involved. In this Thesis, I use four main data sources: 1/ secondary data on
trends of coffee production, exports and prices, 2/ primary data from the qualitative survey round, 3/
primary data from the household survey round, and 4/ primary biophysical field inventory data from
coffee fields.
In the first round, I visited UCDA in 2013 and gathered historical and secondary statistics on coffee
at national level. I also visited key organisations and government departments which support the sector
and generate reports on coffee in Uganda including; Ministry of Agriculture, Animal Industry and
Fisheries (MAAIF), the Uganda Coffee Federation (UCF), the National Union of Coffee Agribusiness
and Farm Enterprises (NUCAFE). To identify key stakeholders of the coffee chain in Uganda, I used
registration information from UCDA database and databases of NGOs and donors supporting the coffee
sector. I combined this stakeholder information with the snowball sampling procedure, continuously
adding new stakeholders based on important trade relationships revealed by those interviewed.
Although in some cases the snowballing methodology may lead to selection bias by the researcher being
directed to more favoured collaborators of the interviewees, the bias is mitigated to a certain extent by
using complementary databases which led to interviews with a wide range of actors at various stages of
the coffee value chain and with different interests. I also conducted semi-structured interviews with
major coffee actors and supporters. I interviewed three UCDA staff at management level, three
members of the parliamentary committee on agriculture, and four coffee company representatives in
the advisory council of NUCAFE, on their role in coffee policy making and priorities for the coffee
institutional framework, as well as their views on policy environment in Uganda. I also interviewed
the directors of 3 of the 5 most important coffee exporting companies (KCL, Olam, Ugacof) that source
coffee from the Mount Elgon region, in 2013. I focussed on their sourcing strategies, destination of their
exports, processing activities, bulking, trading relationships, their perception on the policy environment
and on private standards. I interviewed 4 staff of NGOs on their support role in extension service
provision, information dissemination, business relationship intermediation and technical training to
coffee producers associations. I interviewed 2 of the National Coffee Research Institute (NACORI) on
the research priorities for and major challenges to coffee research in the country. I interviewed 2
managers of GCCE and 4 secretary managers of Growers’ Co-operative Society (GCS) that are
members of GCCE (Busamaga GCS, Bumayoka GCS, Kikuyu GCS and Buteteya GCS), on the
cooperative business model including benefits and challenges, sourcing strategies and perceptions on
private standards.
In the second round, I was responsible for cross-sectional household and village data collection
between February and May, 2014. A multi-stage stratified random sampling design was used. In the

18
first stage, the five most intensive coffee growing districts were purposively selected out of the seven
rural districts in the Mount Elgon region. Two districts were dropped due to resource limitations. In the
second stage, four sub-counties were selected in each district. This was done in a stratified random way
with the different certification schemes as strata, and resulted in the selection of one sub-county with
Fairtrade-Organic producers, one with Utz-Rainforest-4C producers and two with non-certified
producers. While the Fairtrade-Organic company recruits producers from willing GCSs, the Utz-
Rainforest-4C first identifies areas with rivers that have large water flows to serve the washing stations,
and then recruits producers within a radius of 12.5 km. In the third and final stage, we randomly selected
three villages and 30 coffee farmers within each sub-county. In case of smaller villages, four of them
were selected or a reduced number of farmers was selected. The sampling frame was developed using
company databases of certified producers and village Local Council (LC) lists of coffee producers. It
includes 3,199 Fairtrade-Organic certified coffee producers organised in 6 cooperative societies and
supplying to GCCE; 5,331 Utz-Rainforest-4C certified coffee producers organised in 198 producer
organisations and supplying four KCL washing stations; and approximately 22,097 non-certified
producers in the selected sub-counties. The final sample includes 600 households from 60 villages in
21 sub-counties and five districts, of which 170 are Fairtrade-Organic certified, 130 are Utz-Rainforest-
4C certified and 300 are not certified. I gathered extra information on whether or not coffee farms and
individual coffee plots are certified from the survey data. I then cross-checked this information against
the companies’ producer database, as well as the supply contracts signed between producers and the
companies. This was needed because in interviews with farmers, many of them were not aware of the
exact scheme they are certified to. For each of the 60 villages, I interviewed 5 village LC-1 leaders in a
Focus Group Discussion (FGD). A total of 300 village leaders were interviewed. While I was not able
to interview farmers myself because I do not speak the local language, I visited all the villages, trained
15 enumerators to collect the data and 10 of them in data entry. The enumerators were all bachelor
degree holders, with experience in quantitative data collection for similar research projects.
For the household survey, I used a structured quantitative questionnaire, comprising modules on:
household socio-demographic characteristics; land ownership, land use and landslide risk; coffee
production and marketing; other crop production and marketing; agricultural training, extension and
knowledge; livestock and animal production; off-farm activities and other income; forest and farm
household interaction; household assets and living conditions; social capital; and attitude towards risk.
Income data were collected for the 12-month period prior to the survey. Whereas data was collected at
household level, detailed information on household demographic characteristics was collected at
individual level. Global Positioning System (GPS) coordinates of the homestead and all coffee plots
owned by the household head were recorded during the survey. All modules were addressed to the
household head with whom appointments were made, except in a few cases of non-availability where
they authorised their spouse to respond to enumerators. A household is defined as all persons who
19
currently live, eat and sleep together in the same compound, and all persons who did so for 6 months
during the past 12-month period prior to the survey. One interview lasted about two hours and plot GPS
recording lasted between 30 minutes to one hour, depending on how far the various plots are from the
homestead. For the village survey, I used a structured quantitative questionnaire, comprising modules
on: village infrastructure, accessibility and institutions.
In the third round of data collection in which I was not involved, a biophysical field inventory was
implemented in July-September, 2014. It covered a sub-sample of 74 coffee fields including 18
Fairtrade-Organic and 19 Utz-Rainforest-4C, selected in a stratified random way with strata based on
soil type and elevation. The fields were selected from 65 households located in 38 villages in 17 sub-
counties, in all the 5 districts. From the sub-sampled certified households, these 37 fields were pair-
wise matched with 37 non-certified fields using propensity score matching (Rosenbaum & Rubin, 1983)
with agro-ecological (elevation, rainfall, distance to the main road and to the national park,) and socio-
economic (household size and age, education, tribe and religion of the household head) information.
Measurements were done in rectangular (slope corrected) 0.05 ha plots randomly placed within the
field. Plots were GPS recorded, and slope and aspect measured. The Diameter at Breast Height (DBH)
and height for all woody plant species, stumps, deadwood and coarse woody debris were measured.
Stem and/or plant counts were made for crops. Litter was collected in two one-square metre quadrants
per plot. Soil bulk density and Soil Organic Carbon (SOC) samples were taken at 1 and 9 positions and
from 3 soil layers up to 30 cm deep. Invertebrates were sampled according to the Ants of the Leaf Litter
(ALL) standard sampling protocol using 16 pitfall traps (24 hr.), 24 baits (1 cm³ tuna, 45 min) spread
over the plot soil and shrub layer (1 m height) and by litter (2x1 m²) sieving plus Winkler extraction
(50). A total of 828 adult spiders (Araneae) and 44,690 ants (Formicidae) up to species/morphospecies
(88 and 187 respectively.) were identified and 2,732 rove beetles (Staphylinidae) counted. Ant
abundance and diversity are calculated leaving out Pheidole, Myrmicaria and Dorylus species.

20
Figure 5: Schematic overview of the data collection, dataset construction and output
4.6 Relevance of the case study
The choice of the coffee sector for this PhD project is a particularly unique case study to investigate
the impact of private food standards on sustainable development outcomes at smallholder producer
level. This case study is relevant for several reasons. First, the sector is crucial for the Ugandan
economy. Coffee is the single most important export earner, raising about 23% of Uganda’s foreign
exchange. The coffee sector, employs about 1.7 million smallholder farmers, many of them poor, and
about 5 million people at various stages of the value chain. According to survey findings, coffee is the
most important source of income for these households, bringing in about 46% of the total household
incomes. Furthermore, the government of Uganda, in its national export strategy, states its intention to
expand smallholder production of sustainable coffees as a strategy to re-position itself in the
international coffee market (ITC, 2012). Second, private standards have spread rapidly in the country
since mid-2005. In the Mount Elgon region alone, several companies are implementing coffee
certification schemes in collaboration with smallholder producers since 2000 and I could sample
farmers from a double Fairtrade-Organic and a triple Utz-Rainforest-4C coffee certification schemes,
as well as non-certified producers within the same district. This multitude of private standards within
one context makes an interesting case study. Third, although several empirical studies have been
conducted on the impact of private food standards in Uganda (Bolwig & Gibbon, 2009; Chiputwa et al
Chapter 2: Liberalisation and
modernisation in the coffee
value chain in Uganda
Chapter 3: Walk the Talk:
Private sustainability
standards in the Ugandan
coffee sector
Chapter 4: Do private food
standards fulfil their child
welfare promises? Coffee
certification and schooling in
Uganda
Chapter 5: Do private coffee
standards ‘walk the talk’ in
improving economic and
environmental sustainability?
DATA USE OUTPUT DATA COLLECTION
Sept 2013: Qualitative
stakeholder survey
Feb-May 2014: Quantitative
household survey
Feb - May 2014: Quantitative village survey
Sept, 2014: Biophysical
soil, flora and fauna
samplings
Sept 2013: Secondary data
collection
DATABASE
Secondary Data: Statistics
on coffee production, exports,
prices, registered chain actors
and supporters (1961-2011)
Primary data: Qualitative
data on 45 actors and
supporters
Primary data: Cross-
sectional data on 600
households
Primary data: Samples of soil,
ants, beetles from 74 plots
Primary data: Cross-
sectional data on 60 villages
from 300 village leaders
21
2015; Chiputwa et al 2016), there are no empirical studies, to the best of our knowledge that investigates
these category of standards in the Mount Elgon region. This presents a unique opportunity for this study
to make a contribution to literature. Fourth, with the detailed data collected from different sources, I
was able to control for selection bias by applying an IV approach, fixed effects and difference-in-
differences estimations, and present robust results. I was able to describe the modernisation of the coffee
value chain in Uganda, over two decades after liberalisation. All these factors allow us to do a detailed
analysis of the effects of private coffee standards in Uganda. Much as it is difficult to generalise the
results from our case study for other context situations, the in-depth analysis can provide insights on
the effects of private food standards on close to 11.7 million and 25 million smallholder coffee
producers in SSA and developing countries, respectively. This Ugandan case study can make important
contributions to the policy debates on the impact of private food standards on smallholder coffee
production systems, policies on multiple certification, as well as on improvements of the design of the
certificates.
5. Thesis outline
In this PhD Thesis, we present the results of the implications of private food standards on
smallholder farming systems in the coffee sector in Eastern Uganda, addressing the research gaps
highlighted above. In chapter 2, we use the value chain and innovation systems concepts to analyse
qualitative and secondary data, in order to identify the innovations taking place in the coffee sector in
Uganda, the driving forces behind them and the consequent modernisation processes that continue to
occur. We single out private food standards as both a commercial and institutional innovation playing
a key role in global agri-food value chains today. In chapter 3, we I investigate the impact of private
food standards on economic and welfare performance of smallholder households. We estimate the
effects of a household’s participation in a double Fairtrade-Organic scheme and a triple Utz-Rainforest-
4C scheme, on poverty, income, coffee production, yields and labour productivity. We use cross-
sectional household survey data and Instrumental Variable methods, with instruments that pass weak
identification tests and over-identification restrictions, to reveal how participation in the two schemes
and two certification combinations, impact on smallholder producers in Eastern Uganda. We use district
fixed effects model to better capture any unobserved district characteristics which might influence
selection into certification. Furthermore, thanks to a comprehensive GIS database for my research area,
we use plot-weighted indicators to better control for agro-ecological heterogeneity.
In chapter 4, we explore the effects of private food standards on social performance of smallholder
producers, taking child schooling as an example. We assess the effects of standards on primary and
secondary school enrolment, as well as schooling efficiency. We use probit, tobit and difference-in-
difference estimations to control for selection bias. In chapter 5, we investigate the trade-off between
22
the impact of standards on the welfare and environmental performance of the smallholder households.
We assess the trade-off between the socio-economic impact of standards namely; poverty, coffee
income, coffee yields and labour productivity vis-à-vis environmental impact on ant abundance and
organic carbon stocks. We use limited-information maximum likelihood estimators and instrumental
variables approach to estimate impact of coffee certification on labour productivity in coffee production,
net coffee income and poverty at household level, and on land productivity at field level. To analyse
the impact of private food standards on carbon stocks, tree- and invertebrate diversity, Generalized
linear interactive mixed models with log link function (GLIMMIX) was used. In Chapter 6, We present
general conclusions, including highlights of the main findings and policy implications.
23
Appendix:
Genesis and evolution of the five private food standards
Most private food standards were initiated in response to the civil society activist pressure regarding
the precarious poverty situation of smallholder coffee producers yet global coffee consumption boomed
(Bacon, 2005). By highlighting this situation and raising awareness among consumers in high income
countries, demand for certified products emerged and grew. The private food standards therefore, have
some common characteristics which include: belief in the urgency to shift towards sustainable value
chain practices, using certification as tool; aiming to address inequity and trade injustice issues on the
part of producers and society; separated roles of standard setting and auditing; mandatory internal
quality monitoring; mandatory external independent annual inspection on a sample of farms and the
local company they sell to, except for 4C which only requires verification; assuring product traceability
by all the five, except 4C; all their standard-setting and accreditation bodies are members of the
International Social and Environmental and Labelling (ISEAL) Alliance, the global association for
credible sustainability standards. The two closest certificates are RA and Utz, currently sharing certifier
services in some countries. The private food standards however, differ in terms of their genesis,
evolution and capture of the international market share (table A1).
Rainforest Alliance
The Rainforest Alliance (RA) certificate is signified by a green frog which symbolises
an “indicator species of environmental health. Our green frog certification seal indicates
that a farm, forest, or tourism enterprise has been audited to meet standards that require
environmental, social, and economic sustainability”. RA standards are based on
Integrated Pest Management (IPM) and promotes both biodiversity and protects welfare
of workers. RA covers three sectors of agriculture, forestry and tourism.
RA was founded in 1986 by a group of volunteers, led by Daniel Katz, in response to high rates of
deforestation and the consequent negative environmental impact. Landmarks in the evolution of the
certificate include; in 1989, opened an office in Costa Rica, launched its sustainable forestry program
of biodiversity conservation and provided economic incentives to companies, to stimulate responsible
forestry; in 1990, certified a farm in Indonesia and created standards for bananas, then launched a
campaign to encourage the expansion on the label; in 1992, first banana farms were certified; in 1995,
the first coffee farm was certified in Guatemala; later on added cocoa and in 1998, helped to form the
Sustainable Agriculture Network; in 1999, added on non-timber forest certification. Experienced
development and growth, especially in bananas, reaching 15% of all bananas in international market,
being supplied from RA certified farms, by the year 2000; added on other agricultural products, forest
products and flowers, spices, leather and reached a record 1200 companies using the label by 2002, then
launched an environmental education program in the Americas; in 2003 RA got a big boost when Kraft
Foods Ltd committed to purchasing RA certified coffee; in 2006, the first African coffee farms were
certified in Ethiopia and global sales of the RA certified cocoa, bananas and coffee reached $ 1bn; in
2007 Unilever committed to buying RA certified products; in 2009, validated and verified the first
project in Uganda; in 2011, recorded the first coffee to comply with RA climate smart criteria
(Rainforest Alliance, 2016)
Fairtrade
“Fairtrade is a trading partnership, based on dialogue, transparency and respect, that
seeks greater equity in international trade” (Fairtrade International, 2016). According
to activists involved in starting it, the precarious situation of smallholder producers
resulted from tensions among members of the International Coffee Organisation (ICOs)
which led to collapses of the International Coffee Agreement (ICA), led to the
liberalisation of coffee trade and consequent shift in supply management role from
governments of producing countries to private companies. By implication, power in the coffee value
24
chain and bigger share of benefits concentrated in the hands of companies in consuming countries
(Ponte, 2002).
Fair trade (FT) was first launched in 1988 when coffee from Mexico was first sold in Dutch
supermarket, under the name Max Havelaar, through the initiative of Solidaridad, a Dutch Non-
Governmental organisation (NGO). Since then FT achieved several landmarks including; rapid spread
to other markets in western Europe and North America in early 1990s, and reached out to producers
outside Latin America; in 1997, the Fair trade Labelling organisation (FLO), was formally established
in Germany. Secondly, in 2002 FT invited coffee producers on its international board and launched
the international FAIRTRADE Certification Mark. The latter, enabled greater visibility of the label and
simplified the export red tape for fair trade products. In 2004, the organisation split into two, the
standards setting organisation retained the name FLO and the external auditing organisation acquired
the name FLO-CERT. Thirdly, in 2007, FT was recognised by the International Social and
Environmental Accreditation and Labelling (ISEAL) alliance for reaching the highest standards for
defining ethical trade. It also allowed producers as full members of its international governance.
Fourthly, FT changed its constitution in 2013, to allow equal voting rights among farmers and workers.
The following year, not only did FT elect the first producer as chair of the international board, but it
also expanded its sourcing programs for cocoa, sugar and cotton. Between 2009 and today, FT spread
in other parts of the world, especially Eastern Europe, Asia and Africa.. Globally, 80% of FT coffee
comes from Latin America and the remaining 20% comes from the rest of the world, Asia and Africa
(Fairtrade International, 2016).
Organic
This is the first standard to be established for agriculture and is legally regulated in
many markets. Although the practice of organic coffee production started way back in
1927 on a farm in Mexico, the organic label, was developed by a group people who
first met in 1972 to constitute the International Federation of Organic Agriculture
Movement (IFOAM). They believed in agricultural practice which integrate traditional
wisdom, with biology and ecology. Most importantly, they detested synthetic chemicals and the
negative consequences on soil, human and environmental health (IFOAM 2016). IFOAM defines
organic agriculture as “a production system that sustains the health of soils, ecosystems and people. It
relies on ecological processes, biodiversity and cycles adapted to local conditions, rather than the use
of inputs with adverse effects. Organic Agriculture combines tradition, innovation and science to benefit
the shared environment and promote fair relationships and a good quality of life for all involved."
The adoption of the organic agriculture grew rapidly in the early days, with 50 affiliates by 1977 and
500 by the mid-1980s; experienced rapid growth in many countries all over the world up to late 1990;
it arrived in Uganda in 1994, starting with cotton, while organic coffee certification only started in
1999 (Gibbon, 2006); by 2011, there were 863 affiliates in 120 countries. The landmarks include:
publication of the first version of IFOAM basic standards and creating an evaluation mechanism in
1980; approval of accreditation program and separation of standard setting and auditing roles in 1990;
signing of multilateral mutual agreements for mutual recognition among IFOAM certifiers; stagnation
between 2000 and 2010, leading to the revision of the Organic Guarantee System (OGS). More than
50% comes from Latin America and 30% comes from Africa (IFOAM 2016)
Utz
Utz “aims to create a world where sustainable farming is the norm; where farmers
implement good agricultural practices and manage their farms profitably with respect
for people and planet, industry invests in and rewards sustainable production and
consumers can enjoy and trust the products they buy”. The certificate assures consumers
that products have been sourced in a sustainable manner along the whole value chain.
Utz certification was conceived in the early 1990s by two business partners, a Belgian-Guatemalan
coffee farmer, Nick Bocklandt, and a Dutch coffee roaster, Ward de Groote. It emerged from their
appreciation of the results of the final coffee product, based on how the farmer cared for his workers,
25
coffee and the environment. The two teamed up to start a new label aimed at spreading the practice to
other farmers and respond to the limitation the labels which existed at the time. Landmarks since
conception include: in 1999, an office was opened in Guatemala; in 2000, a head office was opened in
the Netherlands; in 2001, the first farm was certified and the label was officially launched in 2002, as
Utz Kapeh (meaning good coffee in the Mayan language); rapid growth and development followed, in
terms of number of farmers and companies involved, as well as products; in 2007, the name was
changed to Utz certified to reflect the diversity covered by the label (Utz-certified, 2016).
4C Verified
The 4C verification system aims at “guiding the mainstream coffee sector toward more
sustainable production in a pre-competitive arena where all relevant stakeholders are
enabled to participate”. Unlike other certificates, 4C works by maintaining a
commonly defined 4C baseline standard and verification system for sustainable coffee
production and sourcing of coffee.
4C stands for the Common Code of Conduct for Coffee. The 4C Association is an open and voluntary
initiative (multi-stakeholder platform) initiated in 2003 by the German Coffee Association (DKV) and
the German development cooperation. The members of the 4C Association include coffee farmers,
cooperatives, exporters, traders, importers, roasters and retailers, NGOs, standard setters, trade unions,
public institutions, research organisations and individuals who are committed to the Association’s aims.
Since its initiation landmarks include; in 2006 it completed a code of conduct for coffee sector
stakeholders, inspired by the UN Millennium development goals; in 2007 established its secretariat in
Bonn; in 2008 opens its regional offices in Eastern Africa, Central America and Brazil; 2009-2011,
experienced expansion and secured public commitment by two biggest coffee roasters; 2012 started
implementation of country specific strategies; growth continued and by 2014 4C had 300 members in
21 countries; in 2016 joined forces with Sustainable Coffee Program (SCP) to form the Global Coffee
Platform; it also separated verification company, Coffee Assurance Services GmbH & Co. KG and the
competitive Field-Level Projects of SCP taken up by IDH, the sustainable trade initiative, based in
Utrecht, the Netherlands (GCP, 2016). The 4C certificate is now called the Baseline Common Code
(BCC).
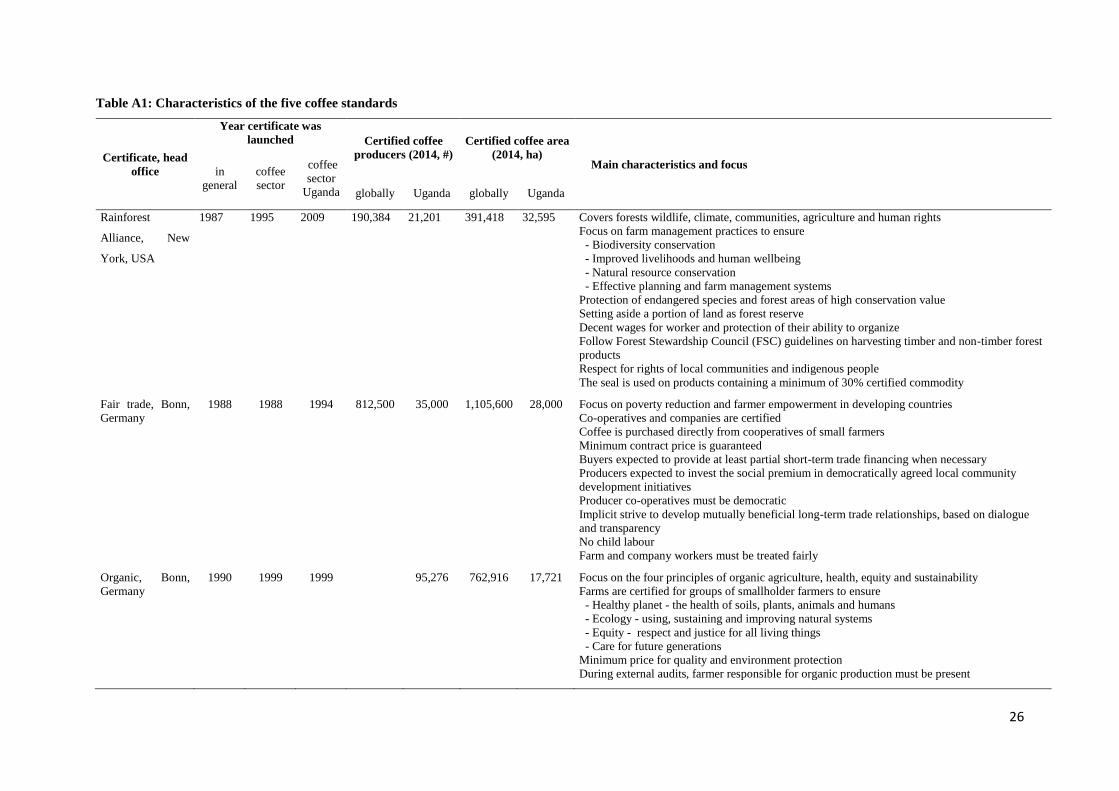
26
Table A1: Characteristics of the five coffee standards
Certificate, head
office
Year certificate was
launched Certified coffee
producers (2014, #)
Certified coffee area
(2014, ha) Main characteristics and focus
in
general
coffee
sector
coffee
sector
Uganda globally Uganda globally Uganda
Rainforest
Alliance, New
York, USA
1987 1995 2009 190,384 21,201 391,418 32,595 Covers forests wildlife, climate, communities, agriculture and human rights
Focus on farm management practices to ensure
- Biodiversity conservation
- Improved livelihoods and human wellbeing
- Natural resource conservation
- Effective planning and farm management systems
Protection of endangered species and forest areas of high conservation value
Setting aside a portion of land as forest reserve
Decent wages for worker and protection of their ability to organize
Follow Forest Stewardship Council (FSC) guidelines on harvesting timber and non-timber forest
products
Respect for rights of local communities and indigenous people
The seal is used on products containing a minimum of 30% certified commodity
Fair trade, Bonn,
Germany
1988 1988 1994 812,500 35,000 1,105,600 28,000 Focus on poverty reduction and farmer empowerment in developing countries
Co-operatives and companies are certified
Coffee is purchased directly from cooperatives of small farmers
Minimum contract price is guaranteed
Buyers expected to provide at least partial short-term trade financing when necessary
Producers expected to invest the social premium in democratically agreed local community
development initiatives
Producer co-operatives must be democratic
Implicit strive to develop mutually beneficial long-term trade relationships, based on dialogue
and transparency
No child labour
Farm and company workers must be treated fairly
Organic, Bonn,
Germany
1990 1999 1999
95,276 762,916 17,721 Focus on the four principles of organic agriculture, health, equity and sustainability
Farms are certified for groups of smallholder farmers to ensure
- Healthy planet - the health of soils, plants, animals and humans
- Ecology - using, sustaining and improving natural systems
- Equity - respect and justice for all living things
- Care for future generations
Minimum price for quality and environment protection
During external audits, farmer responsible for organic production must be present
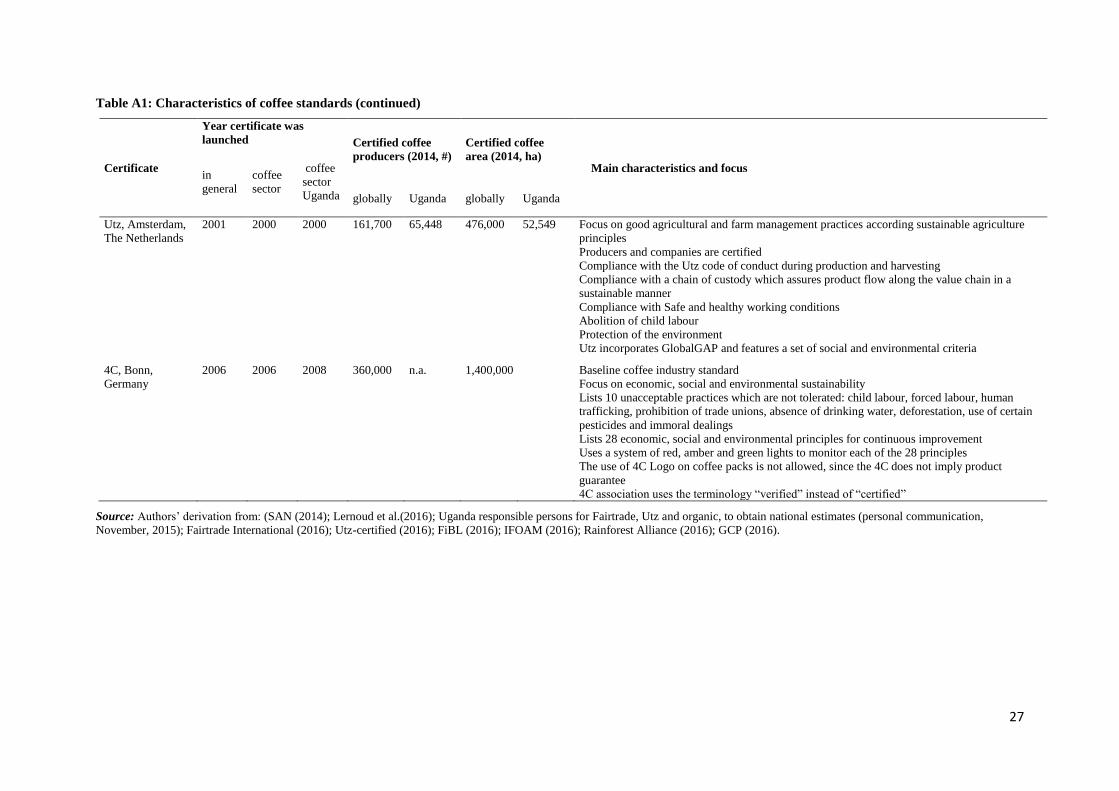
27
Table A1: Characteristics of coffee standards (continued)
Certificate
Year certificate was
launched Certified coffee
producers (2014, #)
Certified coffee
area (2014, ha) Main characteristics and focus
in
general
coffee
sector
coffee
sector
Uganda globally Uganda globally Uganda
Utz, Amsterdam,
The Netherlands
2001 2000 2000 161,700 65,448 476,000 52,549 Focus on good agricultural and farm management practices according sustainable agriculture
principles
Producers and companies are certified
Compliance with the Utz code of conduct during production and harvesting
Compliance with a chain of custody which assures product flow along the value chain in a
sustainable manner
Compliance with Safe and healthy working conditions
Abolition of child labour
Protection of the environment
Utz incorporates GlobalGAP and features a set of social and environmental criteria
4C, Bonn,
Germany
2006 2006 2008 360,000 n.a. 1,400,000
Baseline coffee industry standard
Focus on economic, social and environmental sustainability
Lists 10 unacceptable practices which are not tolerated: child labour, forced labour, human
trafficking, prohibition of trade unions, absence of drinking water, deforestation, use of certain
pesticides and immoral dealings
Lists 28 economic, social and environmental principles for continuous improvement
Uses a system of red, amber and green lights to monitor each of the 28 principles
The use of 4C Logo on coffee packs is not allowed, since the 4C does not imply product
guarantee
4C association uses the terminology “verified” instead of “certified”
Source: Authors’ derivation from: (SAN (2014); Lernoud et al.(2016); Uganda responsible persons for Fairtrade, Utz and organic, to obtain national estimates (personal communication,
November, 2015); Fairtrade International (2016); Utz-certified (2016); FiBL (2016); IFOAM (2016); Rainforest Alliance (2016); GCP (2016).
28
Chapter 2
Liberalisation and Modernisation in the Coffee Value Chain in Uganda
1. Introduction
Three decades ago, most economic sectors in sub-Saharan African (SSA) countries were heavily
state-controlled and many countries depended on export earnings from a few agricultural exports
(Akiyama et al, 2003). A combination of inefficiencies and coordination problems in state controlled
supply chains, shocks and increased competition in international markets, and natural disasters resulted
in declining revenues, serious balance of payment problems and an untenable economic and policy
situation in many SSA countries by the early 1980s (Kherallah et al, 2002; Schiff and Vald, 1992). The
World Bank and the International Monetary Fund (IMF) responded with loans conditional on macro-
economic stabilisation and Structural Adjustment Programs (SAPs) (Ridell, 1992; SAPRI, 2004). From
the mid-1980s onwards a wave of liberalisation and agricultural sector reforms swept across SSA
(World bank, 2007). Reforms were expected to result in price incentives to producers, increased
agricultural production, increased rural incomes and economic growth (Swinnen et al, 2010; Delpeuch
& Vandeplas, 2013).
There is a large body of literature on the impact of liberalisation in SSA but findings are mixed.
Some authors argue that SSA countries benefited in terms of higher producer prices (Kherallah et al,
2002; Varangis & Schreiber, 2001) resulting in a positive supply response, the emergence of marketing
institutions (Poulton et al, 2004;), as well as private sector leadership resulting in more dynamic markets
(Akiyama et al, 2003; Varangis & Schreiber, 2001). Others however, contend that expectations were
not met because SSA governments lost power and resources by ending taxation of agriculture which
had been an important revenue source (Kherallah et al, 2002), poor market systems due to weak capacity
to support markets (Poulton et al, 2004) and increased reliance on food imports (Moseley et al, 2010).
Furthermore, other authors argue that the main problem with reforms was institutional resistance, (Okidi
et al, 2007; Belshaw et al, 1999; Schiff & Vald, 1992) and in some cases, policy reversal (Delpeuch &
Vandeplas, 2013, Jayne et al, 2002).
Most articles on the subject of the impact of liberalisation in SSA are from the 1990s and early
2000s. Yet, Swinnen et al (2010), from a comparison of reforms in SSA, Former Soviet Union (FSU),
Central and Eastern Europe (CEE) and East Asia, show that growth may only emerge some years after
the reforms, even up to a decade like in FSU, because private sector responses are not immediate and
because policy reforms are sometimes not implemented as planned. Given that many SSA countries
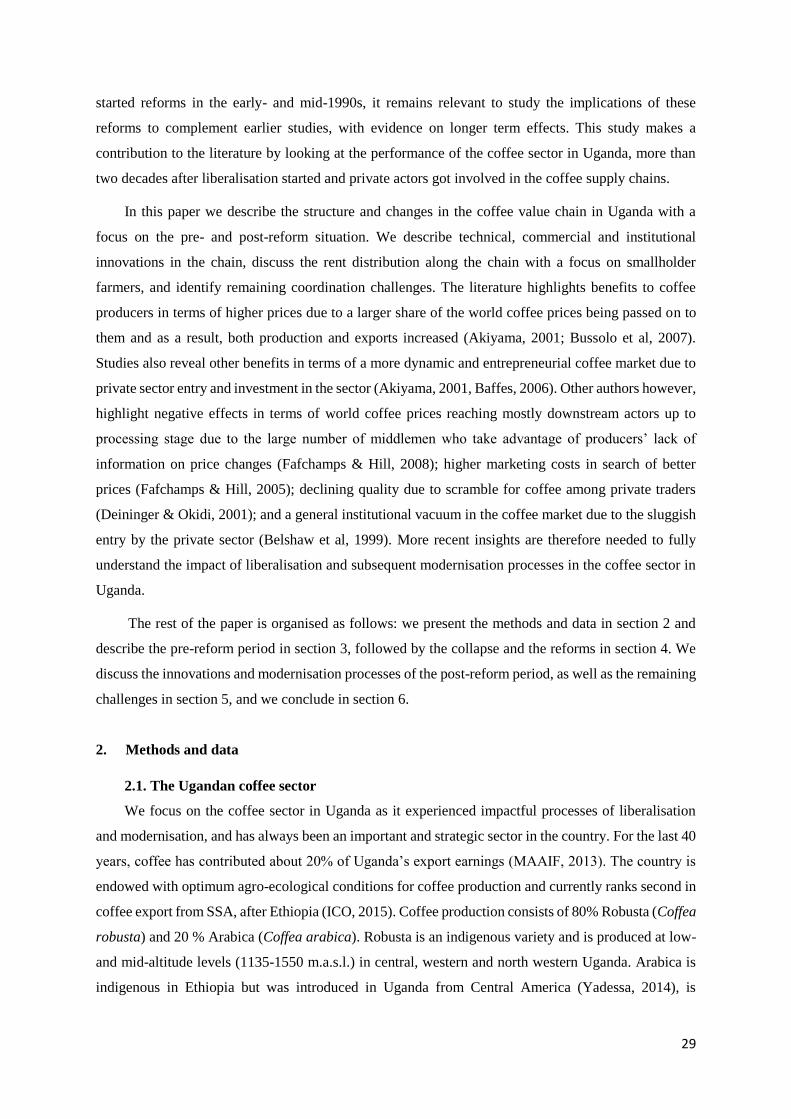
29
started reforms in the early- and mid-1990s, it remains relevant to study the implications of these
reforms to complement earlier studies, with evidence on longer term effects. This study makes a
contribution to the literature by looking at the performance of the coffee sector in Uganda, more than
two decades after liberalisation started and private actors got involved in the coffee supply chains.
In this paper we describe the structure and changes in the coffee value chain in Uganda with a
focus on the pre- and post-reform situation. We describe technical, commercial and institutional
innovations in the chain, discuss the rent distribution along the chain with a focus on smallholder
farmers, and identify remaining coordination challenges. The literature highlights benefits to coffee
producers in terms of higher prices due to a larger share of the world coffee prices being passed on to
them and as a result, both production and exports increased (Akiyama, 2001; Bussolo et al, 2007).
Studies also reveal other benefits in terms of a more dynamic and entrepreneurial coffee market due to
private sector entry and investment in the sector (Akiyama, 2001, Baffes, 2006). Other authors however,
highlight negative effects in terms of world coffee prices reaching mostly downstream actors up to
processing stage due to the large number of middlemen who take advantage of producers’ lack of
information on price changes (Fafchamps & Hill, 2008); higher marketing costs in search of better
prices (Fafchamps & Hill, 2005); declining quality due to scramble for coffee among private traders
(Deininger & Okidi, 2001); and a general institutional vacuum in the coffee market due to the sluggish
entry by the private sector (Belshaw et al, 1999). More recent insights are therefore needed to fully
understand the impact of liberalisation and subsequent modernisation processes in the coffee sector in
Uganda.
The rest of the paper is organised as follows: we present the methods and data in section 2 and
describe the pre-reform period in section 3, followed by the collapse and the reforms in section 4. We
discuss the innovations and modernisation processes of the post-reform period, as well as the remaining
challenges in section 5, and we conclude in section 6.
2. Methods and data
2.1. The Ugandan coffee sector
We focus on the coffee sector in Uganda as it experienced impactful processes of liberalisation
and modernisation, and has always been an important and strategic sector in the country. For the last 40
years, coffee has contributed about 20% of Uganda’s export earnings (MAAIF, 2013). The country is
endowed with optimum agro-ecological conditions for coffee production and currently ranks second in
coffee export from SSA, after Ethiopia (ICO, 2015). Coffee production consists of 80% Robusta (Coffea
robusta) and 20 % Arabica (Coffea arabica). Robusta is an indigenous variety and is produced at low-
and mid-altitude levels (1135-1550 m.a.s.l.) in central, western and north western Uganda. Arabica is
indigenous in Ethiopia but was introduced in Uganda from Central America (Yadessa, 2014), is

30
produced at mid- and high altitudes (1550-2200 m.a.s.l ) in western, eastern and north-western Uganda
(UCDA, 2014).
2.2. Concepts
We rely on two concepts, the value chain concept and the innovation systems concept, to assess
the transformation of the coffee sector in Uganda after policy reforms, and the consequent outcomes in
terms of private sector participation, technical, commercial and institutional innovations, and
performance of the sector. First, according to Kogut (1985), a value chain is the process by which
labour, capital, technology and material inputs are combined, processed, marketed and distributed to
end users. It implies that firms and individual market actors are involved in various inter-dependent
value adding activities and processes at each node of the chain, and implies some hierarchy among these
actors. A value chain consists of actors who operate within the chain, supporters outside the chain who
provide various services to chain actors, and the institutional environment. The concept has been
identified as a good instrument for characterizing food systems (Gereffi et al, 2005). Second, an
innovation system is a continuous process of learning, as well as events, among a network of
organizations, enterprises, and individuals striving to bring new products, processes, and organisational
forms into social and economic use. It emphasises the important role of institutions which affect the
behaviour and performance of the actors, and the intersection between an opportunity and user needs
(Lundvall B-A, 1985; World Bank, 2006; Roling, 2009). With these concepts, we put more emphasis
on the processes of interactions of chain actors, supporters and institutions to bring about innovations
in a sector, in addition to focussing on physical progress of production (Gilbert 2008).
2.3. Data
We use original data from stakeholder interviews, Focus Group Discussions (FGD) and a
quantitative farm-household survey, complemented with historical and secondary data. In 2013, we
conducted a value chain mapping exercise and identified key coffee chain stakeholders in Uganda. We
relied on the database of the Uganda Coffee Development Authority (UCDA) and combined it with a
snowball sampling procedure, continuously adding stakeholders based on trade relationships revealed
by those interviewed. Secondary data were collected from reports of UCDA, the Uganda Coffee
Federation (UCF) and the Ministry of Agriculture, Animal Industry and Fisheries (MAAIF). Historical
data on production is from the FAO database while that on prices is from the ICO database. Original
qualitative data were collected using FGDs with farmers and semi-structured interviews with other
coffee stakeholders. Questions were tailored to the roles and activities of specific actors and supporters.
In total, 45 people were interviewed, including 20 coffee famers, 6 leaders of coffee co-operatives, 10
policy-makers (3 UCDA managers, 3 members of the parliamentary committee on agriculture and 4
private sector representatives in the advisory council of the National Union of Coffee Agribusiness and
Farm Enterprises - NUCAFE), 3 coffee exporting companies, 4 Non-Governmental Organisations
(NGO) and 2 coffee researchers. Original quantitative data were collected from a cross-sectional
31
household survey among 600 coffee producers in Mount Elgon in 2014. The survey covered Bududa,
Bulambuli, Kapchorwa, Manafwa, and Sironko districts and provided detailed information on coffee
production, marketing and income, general household characteristics and overall household income.
3. The pre-reform period
3.1 Policy environment
From its independence in 1962 up to 1991, the Ugandan government followed a mixed economy
approach and was substantially involved in economic sectors and business activities. Reasons for this
approach include political and ideological considerations, proclaimed reluctance of the private sector
to invest in certain types of enterprises, and the need to nurture emerging industries (Nyirinkindi &
Opagi, 2010). A similar set up existed in many other SSA countries and was rooted in the colonial
period during which SSA governments intervened in all sectors of the economy. The approach resulted
in heavy state control, with fixed exchange rates and prices of key commodities, and government-
controlled marketing. The government also provided social services and was the largest employer.
Public Enterprises (PEs) or parastatals were set up to monitor and control key sectors of the economy
(Akiyama et al, 2003).
For the coffee sector in Uganda, the Coffee Marketing Board (CMB) which was established in
1962 by an act of parliament, played a key role in controlling the sector. CMB exported most of the
Robusta coffee (85%), while the rest was exported by a few private players at the time. Bugisu Co-
operative Union (BCU), exported Arabica coffee. In 1969, the Obote regime gave total monopoly over
the coffee sector to CMB including export processing, quality control and promoting Uganda coffee
(Akiyama, 2001). Based on the ICO indicator prices, CMB fixed the floor export price, producer price
and processing margins, ensuring that the difference between the producer and border prices contributed
a regular revenue stream to the government (Akiyama, 2001; Kherallah et al, 2002). One of the aims of
the government was to keep producer prices stable and when world market prices increased (decreased)
CMB announced a producer price that was only slightly higher (lower). Some authors argue that this
direct taxation inherent in the pricing policy formed only a small part, while a larger part of the taxation
came from industrial protection and macro-economic policies (Schiff & Vald, 1992). The government
provided subsidies to the coffee sector through two supporting ministries; the Ministry of Agriculture
and Forestry (MAF) and the Ministry of Co-operatives (MoC).
3.2 The coffee supply chain
The coffee supply chain was very short with only four types of actors (Figure 1): 1/ smallholder
coffee producers; 2/ a cooperative structure, 3/ a few private traders and 4/ the CMB. Coffee farmers
were grouped into Growers’ Co-operative Societies (GCSs) at parish level and linked to co-operative
unions at district level, and these in turn were organised into the Uganda Co-operative Movement, which
later evolved into the Uganda Co-operative Alliance (UCA), at national level. This cooperative structure

32
was responsible for coffee quality monitoring and negotiating producer prices with CMB. The GCSs
bought most of the coffee from producers, sold it to unions for onward selling to CMB, with a mark-up
at each stage. Few private traders also bought coffee from individual producers, sold it to private
hulleries that sold back the coffee to CMB for export. CMB was the sole exporter of coffee in the
country.
Figure 1: The Ugandan coffee value chain during the pre-reform period;
Source: Author’s construction based on stakeholder interviews
CMB graded the green coffee beans according to the Ugandan public coffee industry standards
before selling to international coffee buyers, mostly in Europe and North America. These standards
require a label that includes bean variety, weight size and the region from which the coffee originates.
Most of the coffee (over 99%), passed through this system and was exported. Coffee consumed locally
in hotels, restaurants and CMB-owned coffee shops, was re-imported from consuming countries.
Leftovers sorted-off the export quality, were roasted and pounded manually by farmers for home
consumption and supply to local shops. The government institutional support by MAF and MoC
ensured that coffee sold to CMB met international quality prescriptions. While the former provided
research and coffee extension services, as well as agro-inputs (mainly seedlings, pesticides and farm
equipment), the latter provided cooperative management and development services.
During the pre-reform period all actors and supporters of the coffee value chain except the
smallholder producers, were government structures, implying that the whole commodity chain was fully
state controlled. This state control functioned within the broader policy framework of the International
Coffee Organization (ICO) which mitigated power imbalances between producing and consuming
countries through the International Coffee Agreements (ICAs). Under the ICA, first signed in 1962,
export quotas were allocated to each producing country based on a target price for coffee negotiated
Export
Bulking,
Trading &
Processing
Production
Institutional Support
Coffee Marketing Board (CMB)
Cooperative Unions
Cooperative Societies
Individual smallholder producers
MoC; Cooperative marketing MAF; Extension & research
Private traders
Private hulleries
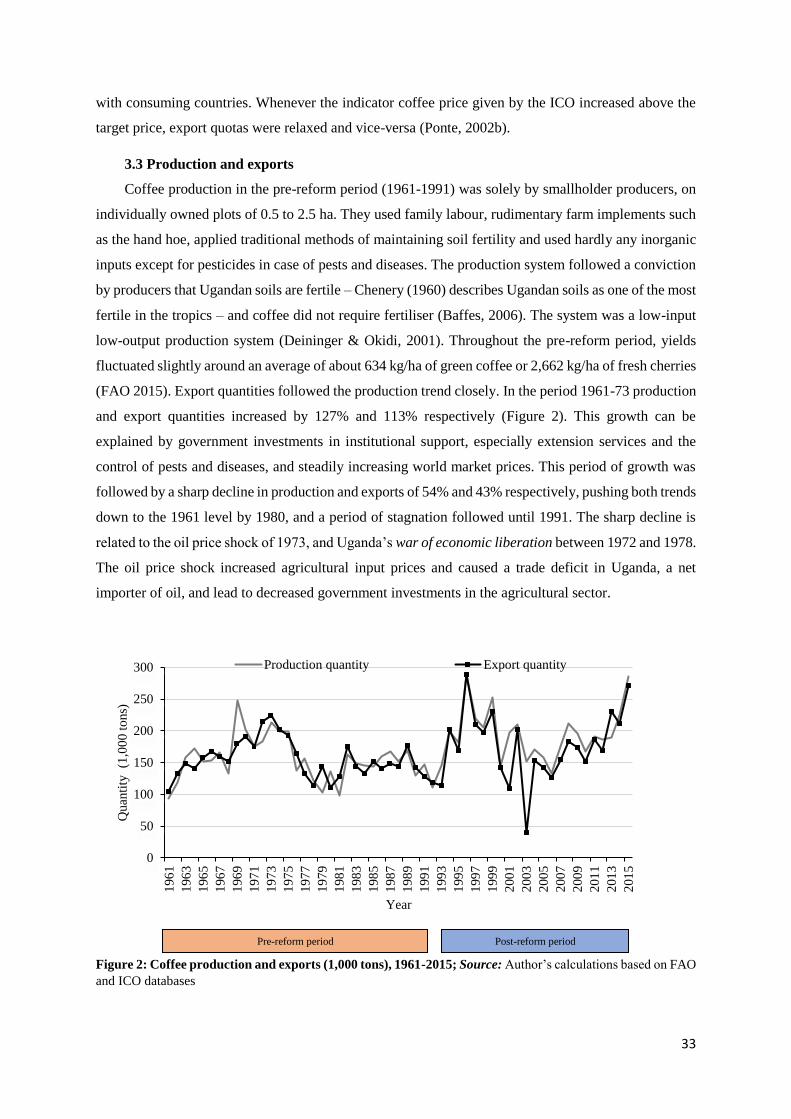
33
with consuming countries. Whenever the indicator coffee price given by the ICO increased above the
target price, export quotas were relaxed and vice-versa (Ponte, 2002b).
3.3 Production and exports
Coffee production in the pre-reform period (1961-1991) was solely by smallholder producers, on
individually owned plots of 0.5 to 2.5 ha. They used family labour, rudimentary farm implements such
as the hand hoe, applied traditional methods of maintaining soil fertility and used hardly any inorganic
inputs except for pesticides in case of pests and diseases. The production system followed a conviction
by producers that Ugandan soils are fertile – Chenery (1960) describes Ugandan soils as one of the most
fertile in the tropics – and coffee did not require fertiliser (Baffes, 2006). The system was a low-input
low-output production system (Deininger & Okidi, 2001). Throughout the pre-reform period, yields
fluctuated slightly around an average of about 634 kg/ha of green coffee or 2,662 kg/ha of fresh cherries
(FAO 2015). Export quantities followed the production trend closely. In the period 1961-73 production
and export quantities increased by 127% and 113% respectively (Figure 2). This growth can be
explained by government investments in institutional support, especially extension services and the
control of pests and diseases, and steadily increasing world market prices. This period of growth was
followed by a sharp decline in production and exports of 54% and 43% respectively, pushing both trends
down to the 1961 level by 1980, and a period of stagnation followed until 1991. The sharp decline is
related to the oil price shock of 1973, and Uganda’s war of economic liberation between 1972 and 1978.
The oil price shock increased agricultural input prices and caused a trade deficit in Uganda, a net
importer of oil, and lead to decreased government investments in the agricultural sector.
Figure 2: Coffee production and exports (1,000 tons), 1961-2015; Source: Author’s calculations based on FAO
and ICO databases
0
50
100
150
200
250
300
196
1
196
3
196
5
196
7
196
9
197
1
197
3
197
5
197
7
197
9
198
1
198
3
198
5
198
7
198
9
199
1
199
3
199
5
199
7
199
9
200
1
200
3
200
5
200
7
200
9
201
1
201
3
201
5
Quan
tity
(1
,00
0 t
ons)
Year
Production quantity Export quantity
Pre-reform period Post-reform period
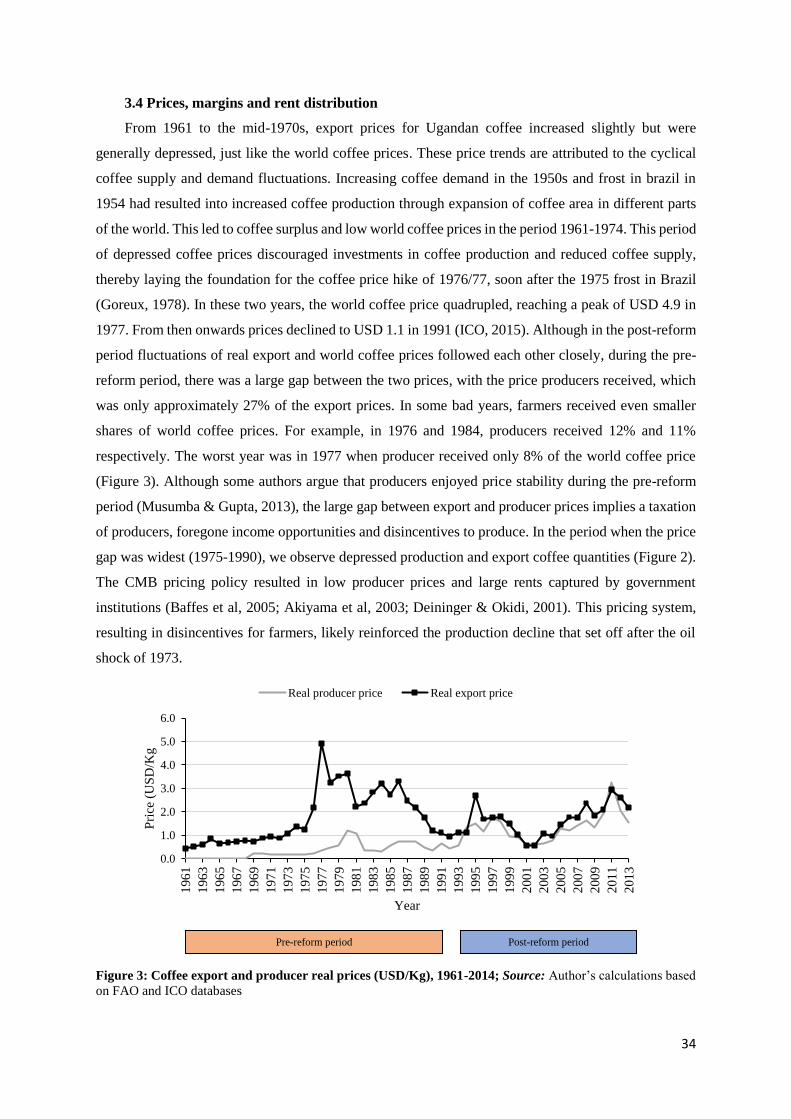
34
3.4 Prices, margins and rent distribution
From 1961 to the mid-1970s, export prices for Ugandan coffee increased slightly but were
generally depressed, just like the world coffee prices. These price trends are attributed to the cyclical
coffee supply and demand fluctuations. Increasing coffee demand in the 1950s and frost in brazil in
1954 had resulted into increased coffee production through expansion of coffee area in different parts
of the world. This led to coffee surplus and low world coffee prices in the period 1961-1974. This period
of depressed coffee prices discouraged investments in coffee production and reduced coffee supply,
thereby laying the foundation for the coffee price hike of 1976/77, soon after the 1975 frost in Brazil
(Goreux, 1978). In these two years, the world coffee price quadrupled, reaching a peak of USD 4.9 in
1977. From then onwards prices declined to USD 1.1 in 1991 (ICO, 2015). Although in the post-reform
period fluctuations of real export and world coffee prices followed each other closely, during the pre-
reform period, there was a large gap between the two prices, with the price producers received, which
was only approximately 27% of the export prices. In some bad years, farmers received even smaller
shares of world coffee prices. For example, in 1976 and 1984, producers received 12% and 11%
respectively. The worst year was in 1977 when producer received only 8% of the world coffee price
(Figure 3). Although some authors argue that producers enjoyed price stability during the pre-reform
period (Musumba & Gupta, 2013), the large gap between export and producer prices implies a taxation
of producers, foregone income opportunities and disincentives to produce. In the period when the price
gap was widest (1975-1990), we observe depressed production and export coffee quantities (Figure 2).
The CMB pricing policy resulted in low producer prices and large rents captured by government
institutions (Baffes et al, 2005; Akiyama et al, 2003; Deininger & Okidi, 2001). This pricing system,
resulting in disincentives for farmers, likely reinforced the production decline that set off after the oil
shock of 1973.
Figure 3: Coffee export and producer real prices (USD/Kg), 1961-2014; Source: Author’s calculations based
on FAO and ICO databases
0.0
1.0
2.0
3.0
4.0
5.0
6.0
196
1
196
3
196
5
196
7
196
9
197
1
197
3
197
5
197
7
197
9
198
1
198
3
198
5
198
7
198
9
199
1
199
3
199
5
199
7
199
9
200
1
200
3
200
5
200
7
200
9
201
1
201
3
Pri
ce (
US
D/K
g
Year
Real producer price Real export price
Pre-reform period Post-reform period
35
4. The collapse and the reforms
The poor economic management of the 1970s, especially the war of economic liberation, during
which the government seized foreign owned assets and the civil war in the 1980s, led to Uganda’s
economic collapse (Baffes, 2006). The dependence on PEs became untenable. By 1986 Uganda had
186 PEs, most of which operated below 30% capacity, held huge loan portfolios and were loss making
(Nyirinkindi & Opagi, 2010). By this time Uganda, like other SSA economies, faced serious balance of
payment problems due to a failing industrial sector, a stagnating agricultural sector, deteriorating
international terms of trade, and unsustainable fiscal deficits (Kherallah et al, 2002; Okidi et al, 2007).
The government needed more and more of the coffee revenue to finance both the industrial sector and
consumption as shown by the very large price gaps after the 1973 and 1979 oil shocks. It could neither
sustain the subsidies to the coffee sector (mainly costs of staff who provided coffee extension,
cooperative management and coffee marketing services, and agro-inputs) nor the producer prices and
by 1987, delayed payments to producers had become the new norm. At the same time at international
level, disagreements among ICO members regarding pricing and quotas, led to the collapse of the ICA
in 1989 (Ponte, 2002b). Reference price setting for coffee was then transferred to the stock market - the
New York Board of Trade (NYBOT), now called Intercontinental Exchange (ICE) Futures US and
more recently the Brazillian Bolsa de Mercadorias & Futuros (BMF) for Arabica coffee and the London
International Financial Futures and options Exchange (LIFFE) for Robusta coffee (Gilbert, 2008).
These events, coupled with increased coffee production worldwide led to a drastic coffee price decline
between 1987 and 1992.
In 1987 the government of Uganda introduced economic reforms, based on a policy paradigm shift
from the public to the private sector as the engine for growth, and under pressure of the IMF and the
World Bank for macro-economic stabilisation and Structural Adjustment Programs (SAP) (Akiyama et
al, 2003). Due to institutional resistance, effective implementation of the reforms only started in 1992
(Belshaw & Hubbard, 1999; Okidi et al, 2007). The reforms in Uganda entailed strict fiscal discipline,
rationalising PEs along commercial lines and ending subsidies to commercially oriented sectors
(Nyirinkindi & Opagi, 2010). For the coffee sector, reforms meant the end of subsidies for institutional
support (through MAF, MoC and CMB), the end of government’s price setting role, monopoly of CMB,
taxation of coffee proceeds, as well as the beginning of private sector involvement in coffee trade, in
direct competition with CMB. As part of the reform process in 1991, the government split CMB into
two, separating the trading and processing functions, from the monitoring and regulatory ones. A newly
incorporated CMB limited company performed the former role and a newly established UCDA
performed the latter role. From this year, apart from CMB, four co-operative unions under an umbrella
company, the Union Export services limited (UNEX) and private actors were allowed to export coffee.
Export was based on a floor export price set by UCDA and commercial banks were allowed to finance
coffee trade. In 1994 government resumed taxation of coffee proceeds, then a year later in 1995, the
36
floor export price was abolished by amending the UCDA statute, and in 1996, the floor prices were
abolished for good (Baffes, 2006; Henstridge & Kasekende, 2001; Akiyama, 2001). CMB continued
exporting coffee but its share continuously dwindled towards zero by 1997, as competition stiffened
due to increased private sector participation (Table 1). In 1998, CMB was dismantled by selling its
assets after failing to attract majority private shares in it. The share of UNEX also declined over time.
Although these changes paved the way for more private investment in all stages of the coffee value
chain, and allowed their representation on the UCDA board, private actors operated under the general
liberalisation policy of Uganda, without a specific coffee policy.
Table 1: Export shares of Ugandan coffee in the post-liberalisation period
Exporter 1991/92 1992/93 1993/94 1994/95 1995/96 1996/97 1997/98
CMB 84% 39% 16% 10% 4% 0.6% 0%
UNEX 12% 16% 12% 11% 2% 3% 2%
Private 4% 45% 72% 79% 94% 96% 98%
Source: Author’s adaptation from UCF Coffee Year Book 1998/99.
In the liberalised policy framework in Uganda today, exchange rates are liberalised, the PEs are
privatised and the civil service is restructured. Foreign Direct Investment (FDI) is welcome in all sectors
of the economy including agriculture. Moreover, investors are allowed to take out proceeds of their
investment and are given tax breaks in some cases. In addition, neither agricultural exports, nor key
agricultural imports are taxed (Nyirinkindi & Opagi, 2010). In 2013, the government approved its first
National Coffee Policy (NCP), developed in collaboration with the private sector and due to pressure
from them. In this policy, the government retained only three roles; i) regulating the coffee sector
through UCDA; ii) providing extension services on a cost-sharing basis through the National
Agricultural Advisory Services (NAADS); and iii) conducting coffee research through the National
Coffee Research Institute (NACORI). Today, the private sector is actively involved in all coffee chain
activities, taking leadership of the sector, making substantial investments and engaging in innovations
which are leading to the modernisation of the value chain.
5. The post-reform period
5.1 The coffee supply chain
In the post-reform period, the coffee industry landscape changed drastically (Figure 4). We observe
three distinct stages in the coffee chain namely; i) production or upstream; ii) processing and bulking
or mid-stream; iii) export and distribution or downstream.
The key actors at production stage are an estimated 1.7 million smallholder farmers scattered in 93
districts of the five coffee-banana agro-ecological zones of Central, Northern, Eastern, Western and
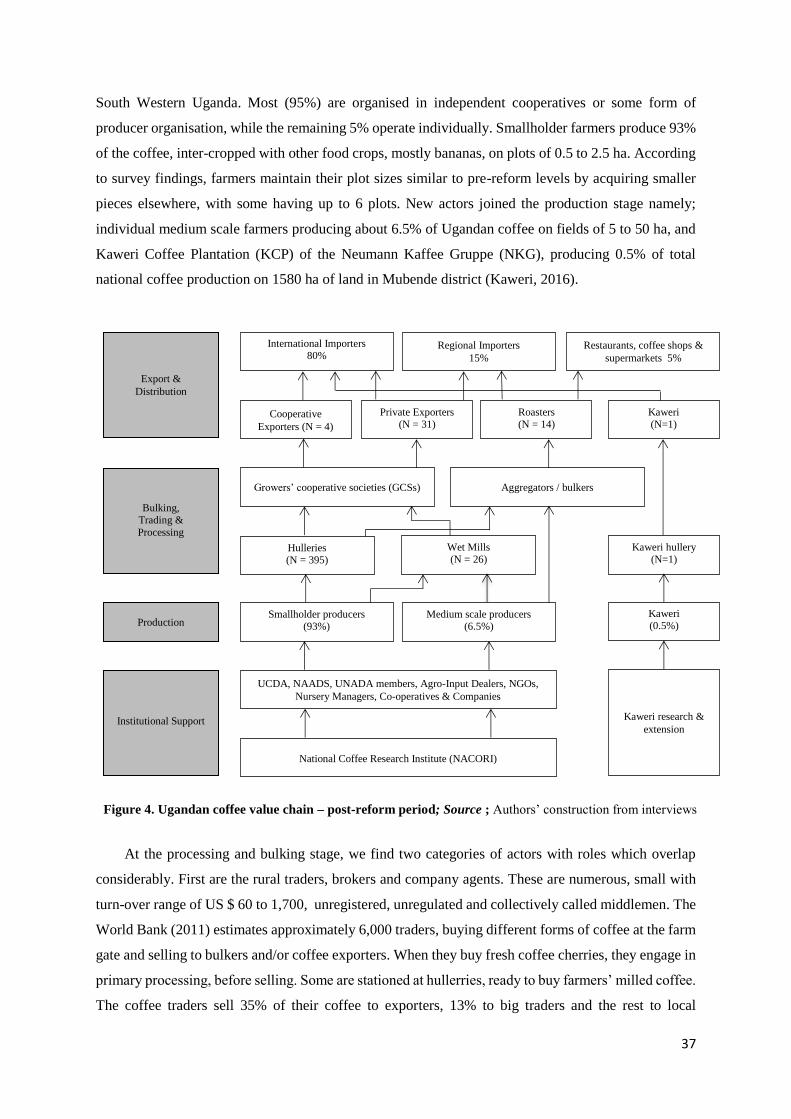
37
South Western Uganda. Most (95%) are organised in independent cooperatives or some form of
producer organisation, while the remaining 5% operate individually. Smallholder farmers produce 93%
of the coffee, inter-cropped with other food crops, mostly bananas, on plots of 0.5 to 2.5 ha. According
to survey findings, farmers maintain their plot sizes similar to pre-reform levels by acquiring smaller
pieces elsewhere, with some having up to 6 plots. New actors joined the production stage namely;
individual medium scale farmers producing about 6.5% of Ugandan coffee on fields of 5 to 50 ha, and
Kaweri Coffee Plantation (KCP) of the Neumann Kaffee Gruppe (NKG), producing 0.5% of total
national coffee production on 1580 ha of land in Mubende district (Kaweri, 2016).
At the processing and bulking stage, we find two categories of actors with roles which overlap
considerably. First are the rural traders, brokers and company agents. These are numerous, small with
turn-over range of US $ 60 to 1,700, unregistered, unregulated and collectively called middlemen. The
World Bank (2011) estimates approximately 6,000 traders, buying different forms of coffee at the farm
gate and selling to bulkers and/or coffee exporters. When they buy fresh coffee cherries, they engage in
primary processing, before selling. Some are stationed at hullerries, ready to buy farmers’ milled coffee.
The coffee traders sell 35% of their coffee to exporters, 13% to big traders and the rest to local
Restaurants, coffee shops &
supermarkets 5%
International Importers 80%
Cooperative
Exporters (N = 4)
Regional Importers
15%
Roasters (N = 14)
Kaweri (N=1)
Private Exporters (N = 31)
Aggregators / bulkers Growers’ cooperative societies (GCSs)
Export &
Distribution
Bulking, Trading &
Processing
Production
Institutional Support
Hulleries (N = 395)
Kaweri hullery (N=1)
Wet Mills (N = 26)
Kaweri (0.5%)
Smallholder producers (93%)
Medium scale producers (6.5%)
UCDA, NAADS, UNADA members, Agro-Input Dealers, NGOs,
Nursery Managers, Co-operatives & Companies
Kaweri research &
extension
National Coffee Research Institute (NACORI)
Figure 4. Ugandan coffee value chain – post-reform period; Source ; Authors’ construction from interviews
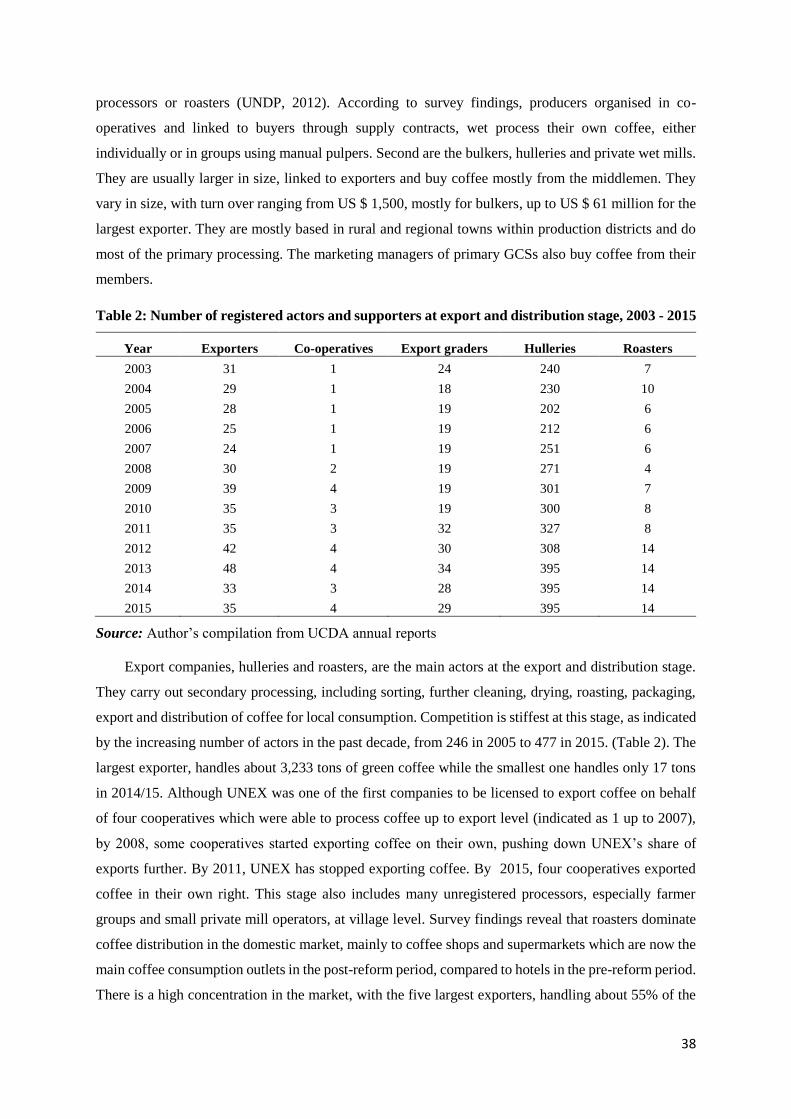
38
processors or roasters (UNDP, 2012). According to survey findings, producers organised in co-
operatives and linked to buyers through supply contracts, wet process their own coffee, either
individually or in groups using manual pulpers. Second are the bulkers, hulleries and private wet mills.
They are usually larger in size, linked to exporters and buy coffee mostly from the middlemen. They
vary in size, with turn over ranging from US $ 1,500, mostly for bulkers, up to US $ 61 million for the
largest exporter. They are mostly based in rural and regional towns within production districts and do
most of the primary processing. The marketing managers of primary GCSs also buy coffee from their
members.
Table 2: Number of registered actors and supporters at export and distribution stage, 2003 - 2015
Year Exporters Co-operatives Export graders Hulleries Roasters
2003 31 1 24 240 7
2004 29 1 18 230 10
2005 28 1 19 202 6
2006 25 1 19 212 6
2007 24 1 19 251 6
2008 30 2 19 271 4
2009 39 4 19 301 7
2010 35 3 19 300 8
2011 35 3 32 327 8
2012 42 4 30 308 14
2013 48 4 34 395 14
2014 33 3 28 395 14
2015 35 4 29 395 14
Source: Author’s compilation from UCDA annual reports
Export companies, hulleries and roasters, are the main actors at the export and distribution stage.
They carry out secondary processing, including sorting, further cleaning, drying, roasting, packaging,
export and distribution of coffee for local consumption. Competition is stiffest at this stage, as indicated
by the increasing number of actors in the past decade, from 246 in 2005 to 477 in 2015. (Table 2). The
largest exporter, handles about 3,233 tons of green coffee while the smallest one handles only 17 tons
in 2014/15. Although UNEX was one of the first companies to be licensed to export coffee on behalf
of four cooperatives which were able to process coffee up to export level (indicated as 1 up to 2007),
by 2008, some cooperatives started exporting coffee on their own, pushing down UNEX’s share of
exports further. By 2011, UNEX has stopped exporting coffee. By 2015, four cooperatives exported
coffee in their own right. This stage also includes many unregistered processors, especially farmer
groups and small private mill operators, at village level. Survey findings reveal that roasters dominate
coffee distribution in the domestic market, mainly to coffee shops and supermarkets which are now the
main coffee consumption outlets in the post-reform period, compared to hotels in the pre-reform period.
There is a high concentration in the market, with the five largest exporters, handling about 55% of the
39
total green coffee export. Another important indicator of stiff competition in the coffee sector is the
narrowing gap between prices of Robusta and Arabica coffee varieties which was about UGX 2
thousand in 2010/11 coffee season and had narrowed down to between UGX 50 – 200 from October,
2011 to 2013 (UCDA, 2014).
Institutional support to the coffee sector in the post-reform period is mostly done by the private
sector. Coffee production is supported by nursery managers, input suppliers, extension agents, export
graders and Business Development Services (BDS) providers. The supply of seedlings, considered the
most crucial input, is organised differently. NACORI and NGOs supply parent seedlings to UCDA,
which then multiplies and distributes them to certified private nursery managers for grafting. The
nursery managers sell the grafted coffee seedlings to individual farmers (53%), farmer groups (23%)
and to institutions (12%) (UNDP, 2012). About 2,200 private agro-input suppliers, under the umbrella
of the Uganda National Agro-Input Dealers Association (UNADA), sell mostly agro-chemical inputs
in urban and rural commercial centres (UNDP 2012).
Provision of extension services continues to be problematic and is provided by NAADS, NGOs
or export companies, mostly to organised producers. Individual un-organised coffee producers rarely
see extension agents. Private extension agents also monitor coffee stocks by maintaining accurate
records of plots per producer, plot area, number of coffee shrubs and estimated coffee yield. Exporters
use this information to forecast coffee volumes and inform contract commitments with buyers on the
one hand, and to circumvent side selling by contracted producers on the other. The middlemen also
provide brokerage services on coffee stocks and market prices, to other actors. Medium scale farmers,
export companies implementing coffee production contracts with smallholder producers, as well as
KCP, procure their own inputs and hire their own extension agents. Export graders are unique chain
supporters accredited by UCDA, to provide grading services to exporters. Private and NGO supporters
provide up to 60% of BDS while the government provides about 17% (UNDP, 2012). The services
include management skills, business relations, co-operative enterprise registration, price information
dissemination to farmers and extension services to improve agronomic practices.
5.2 Technical, commercial and institutional innovations
Competition among private actors, coupled with effects of globalisation, particularly higher quality
standards, as well as local market imperfections, has triggered innovations at all stages of the chain
(Swinnen & Vandeplas, 2011). Most innovations are initiated by downstream actors, mainly exporters
but eventually spread to other stages, given that all actors are inter-connected through transactions in
the chain and are actively involved in an innovation system.
At a technical level, we observe innovations in terms of new models of extension service delivery
and new technologies aiming to improve quality, productivity and efficiency. At production stage, there
has been a remarkable improvement in coffee seedling quality. Most seedlings are produced through

40
cloning to ensure clean planting materials, and one company is even producing seedlings by tissue
culture. The seedlings are strictly supplied to UCDA certified nursery managers who then multiply them
in form of cuttings. The cuttings are then distributed to farmers either at a fee or free of charge in cases
where the distribution is done through a fully funded coffee promotion program. Regarding coffee
extension services, the UCDA has compiled packages of Good Agricultural Practices (GAP) tailored to
the different agro-ecological zones and avails it to interested stakeholders but task division for effective
implementation is still problematic. Several supporters are providing BDSs, to improve the business
management skills of chain actors. At processing and bulking stage, exporters and larger scale traders
have established modern bulking facilities with optimum air circulation and appropriate holding racks,
established. They have also established modern wet mills and hulleries with multi-functional secondary
processors, combining cleaning, sorting, grading and drying of coffee. Farmer groups and bulkers have
acquired hand pulpers, own micro to medium wet mills and hulleries. These are important investments
with implications for rural development, considering that most have taken place in rural areas of coffee
producing regions where there are lower cost advantages for investing companies.
In the new liberalised market with many actors interlinked in complex business relationships,
demand for higher quality standards, traceability and competition lead to many changes in value chain
structure, most visible at commercial and institutional levels (Swinnen & Maertens, 2007; Neilson,
2008; Reardon, 2015). We therefore define commercial value chain innovations as activities and
processes intended to increase product visibility and capture larger market shares, such as product
differentiation and branding. Institutional innovations on the other hand, encompass activities and
processes that improve value chain governance, including formal and informal rules of engagement
among different actors. These two types of innovations sometimes overlap. In Uganda, some exporting
companies have established roasters which supply hotels, restaurants, coffee shops and supermarkets.
On the one hand roasting is a commercial innovation aimed at increasing margins, on the other, it is an
institutional innovation to boost domestic coffee consumption. From survey findings, UCDA reports
rapid spread of coffee shops, now dominating as consumption outlets, from less than five in 1998 to
200 by 2013. Coffee roasters are also developing brands for local and regional markets, currently
estimated to be over 20 coffee brands (UCDA, 2016). At the international level, exporters are
experimenting with new business models, using joint venture marketing initiatives. Examples include:
Uganda Coffee House ApS, between Sebei Elgon Co-operative Union (SECU) and SuperGros
supermarket, to supply Elgon coffee in Denmark and Scandinavian countries; ONE café in Sweden;
Zigoti Coffee in Japan; Fine Coffee in South Africa and Beijing Chenao supplying Crane coffee to three
supermarkets in China, all of them working in partnership with producer associations in Uganda (UCF,
2012).
Important in the post-reform period is the emergence of private coffee standards. On the one hand,
they serve as a product differentiation tool, transmitting production process information to consumers
41
in high-income countries who are willing to pay a premium (Baffes et al, 2005; Henson & Reardon,
2005). On the other hand, they are an institutional innovation used in chain governance since their
implementation is often linked to production contracts with producers who must comply with
agronomic and other production and processing conditions which assure quality, traceability ethical
behaviour and better care for the environment (Valkila, 2009; Beghin et al., 2015). The production
contracts usually include: estimated quantity of coffee to be supplied, the bean quality, the production
season and the services the company will provide, usually information, training and inputs. Certification
to private coffee standards started in Uganda in 1994 with Fairtrade, followed by organic in 1999
(Gibbon, 2006). Other standards followed: Utz in 2000, the Common Code for Coffee Community
(4C)2 in 2008 and Rainforest alliance in 2009. By 2014, an estimated 216,000 coffee farmers in Uganda
produced coffee certified to the first four standards. The government highlights expansion of
sustainable coffees as a strategy for increasing Uganda’s share of the international coffee market (ITC,
2012).
Export companies invest in certification partly because there is consumer demand for certified
products and partly because donors are willing to fund smallholder certification programs. The spread
of private coffee standards has some advantages in terms of leveraging unique characteristics such as
area of origin, as well as striving to satisfy social, ethical and environmental criteria. There is a tendency
towards multiple certification, with some advantages and disadvantages. First, survey findings show
that they are confusing to producers who indicate not to know which certificates they have signed for.
Second, each of them comes with conditions which increase costs on the part of producers and other
actors. Third, they make many promises and yet findings are mixed on their impacts. In central Uganda
for example, a double Fairtrade-Utz certification scheme increases per capita and household
consumption while a double Utz_Organic certification has insignificant impact (Chiputwa et al, 2015).
In Eastern Uganda, a triple Utz-Rainforest Alliance-4C scheme increases coffee yields, coffee income
and reduces poverty due to intensification while a double Fairtrade-Organic coffee scheme reduces
coffee yields and coffee income likely due to conditions which prohibit the use of inorganic fertilisers
in a region where soils are degraded (Akoyi & Maertens, 2017). These findings have implications for
sustainable development.
At production stage, coffee producers have responded to vertical co-ordination by organising
themselves in various types of farmer organisations, commonly registered at district level. These
organisations facilitate supply contracting between producers and export companies. Consequently,
smallholder and medium-scale producers are engaged in complex linkages with other actors and
supporters, with varying degrees of co-ordination and processes of innovation. At the extreme end of
the spectrum is the fully integrated KCP with its own nursery, extensions services, input procurement
2 4C is now known as the Basic Common Code (BCC) after the 4C association merged with the Sustainable Coffee
Program in 2016, to become the Global Coffee Platform (GCP).
42
and research unit. KCP also sources coffee from smallholder farmers in the vicinity, organised under
Kaweri Coffee farmers’ Alliance (KCFA) (Kaweri 2016). This is a new model of producing coffee
through an out grower scheme. From UCDA export data, although KCP produces about 0.5% of total
coffee production in the country, it handled 10% of coffee exports in 2013 (UCDA, 2014).
Our survey reveals different forms of horizontal co-ordination among various categories of actors
in Multi-Stakeholder Platforms (MSPs), initiated to share information, claim rights, lobby for a
favourable business environment and collaborate for better chain coordination. Main examples include:
NUCAFE, the Uganda Coffee Federation (UCF), the Uganda Coffee Roasters Association (UCRA) and
the Coffee Co-operative Societies and Specialty Coffee Traders Association (CCSSCTA). While these
innovations indicate dynamism in the Ugandan coffee industry and better co-ordination by the private
sector to overcome market constraints (Poulton et al, 2006), stakeholders highlighted persistent
discipline challenges undermining coffee quality.
We observe other institutional innovations in the provision of financial services including: the
Warehouse Receipt System (WRS) initiated by government as a market based tool to fill the commodity
financing gap after subsidies through the Uganda Finance Corporation (UFC) stopped; the Savings and
Credit Cooperatives (SACCOS) imitated farmer and trader co-operatives; Micro Finance Institutions
(MFIs); Village Savings and Lending Associations (VSLAs); NGO micro-credit programs and risk
capital. As a result of these innovations, the coffee sector is one of the best served value chain by
financial services, receiving 22% share of available financial services to agriculture (UNDP 2012).
5.3 Production and export
The post reform period is characterised by a decade of high volatility in production and export
until 2004, followed by a decade of steady growth which led to production and export levels that are
double the 1991 levels. Between 1993 and 2004, production and export quantities increased modestly
by 17% and 11%, respectively followed by increases of 77% and 68%, respectively, the following
decade. In this period, average annual coffee production was 189 thousand MT while export was 172
thousand MT and coffee exports followed production trends closely. Overall, there is a general rise in
production and exports (Figure 2). Production and export of certified coffee has increased as well. Two
decades after certified coffee production started in the country, 11% of the total national production,
adjusted for multiple certification, is certified to organic, Rainforest alliance and Utz by 2012. By 2014,
the estimated production of coffee certified to the 5 main standards is about 31.7%, unadjusted for
multiple certification. When it comes to exports however, UCDA estimates that only about 2% of the
total national exports leaves the country as certified coffee (UCDA, 2016). This implies that a large
proportion of standards compliant and certified coffee is sold as conventional coffee.
The modest increase in production and exports in the first decade of the post reform period can be
explained in several ways. This is in line with observations elsewhere in west Africa (Delpeuch &

43
Vandeplas, 2013; Varangis & Schreiber, 2001) in eastern and southern Africa (Jayne et al, 2002) and
in different SSA countries (Poulton et al, 2004; Kherallah et al, 2002). First, by government ending
taxation of coffee proceeds after liberalisation, price incentives accrued directly to coffee producers.
Some authors confirm an estimated 20% tax reduction for producers in Uganda (Bussolo et al, 2007;
Musumba & Gupta, 2013). Others report high shares of world coffee prices, between 64-98%, going to
producers due to stiff competition among private actors (Kherallah, et al, 2002; Akiyama, et al, 2003).
Modest effects of these incentives are likely due to the fact that ending taxation lasts a short period,
being a one-off positive shock which wanes off after being absorbed by economic growth (Swinnen et
al, 2010). Furthermore, inter-linked contracts that are critical in export crop production had not yet
taken off in this period. The government continued providing coffee specific extension services through
projects but stopped by 1999. It took a few years in the early 2000s for the government to develop the
NAADS and even more time to garner the necessary resources to make it functional.
Second, modest increases in production and exports in the first decade can be attributed to the fact
that smallholder farmers continued to dominate coffee production in Uganda. Their old mode of
production limits increased coffee production and yet, the private sector did not invest in productivity
enhancement through inter-linked contracts. The private sector which rushed into the coffee industry
concentrated more on trade, did not take up such roles and many dropped out. Other authors report that
three years after liberalisation, 117 export companies were registered but by 2001, only 20 of them
exported 80% of the coffee (Akiyama et al, 2003; Krivonos, 2004). This implies that the competition
was not sustained, partly due to limited FDI (Swinnen et al, 2010), and partly due to policy reversal by
the government (Baffes et al, 2005; Delpeuch & Vandeplas, 2013). In this period, the only inter-linked
contracts in the Ugandan coffee sector were by few coffee co-operatives which implemented Fairtrade
certification schemes and one company which implemented an organic coffee production scheme
(Gibbon, 2006). Other studies confirm that the structural transformation expected in the coffee sector
in Uganda did not happen because the private sector hardly existed (Belshaw & Hubbard, 1999; Okidi
et al, 2007).
Third, fragmentation and dis-organisation increased at producer level when government dis-
engaged from institutional support to the coffee sector. We argue that in the first decade of the post
reform period, when smallholder coffee co-operatives were exposed to direct competition with private
traders, they simply could not cope. They lacked the necessary skills, knowledge, experience and
networks needed in the new market. This follows from the fact that in the pre-reform period, producers
engaged in coffee production while all marketing activities were done on their behalf by staff of the
state controlled co-operatives and CMB. Producer co-operatives therefore, lost domestic market share,
went into financial crisis and eventually collapsed. In addition to losing assets through this painful
experience, producers felt confused about the coffee marketing channels, as middlemen roamed around
44
their villages in search of coffee. This situation was an important dis-incentive for smallholder
producers and affected their production activities negatively.
The stronger increase in production and export trends we observe from 2005, can be attributed
first, to the fact that the coffee area expansion from the government initiative in Northern Uganda, and
from private medium scale producers all over the country, started bearing fruit. Second, the vertical co-
ordination in the coffee chain which emerged as the market became more concentrated, is often to
service provision which is boosting productivity. This innovation starts at international level, as large
coffee traders respond to increasing competition. The pressure is then transmitted to exporters, who in
turn transmit it upstream, by engaging in inter-linked production and marketing contracts in the local
market. In such exporter-producer contract cases, the former plays a quasi-manufacturer role,
processing most of the coffee and intervening in on-farm activities through extension service delivery
(Kaplinsky, 2004). Lee et al (2012) confirm that changes at international level, lead to high price
volatility, stiffer competition and eventually higher concentration downstream by multi-national
traders, at the expense of other chain actors. By 2012, four biggest coffee importers: ECOM, Neumann
Kaffee Gruppe, Louis Dreyfus and VOLCAFE-ED&F Man, controlled about 40% of the global coffee
trade while five largest coffee roasters together controlled 50% of the world coffee market and about
85% of the European market (OWW, 2013; Ponte, 2002a). In Uganda, local exporters are operating as
subsidiaries of the international coffee buyers. For example, Kyagalanyi coffee operates as a member
of VOLCAFE-ED&F Man and Kawacom as a member of ECOM trading.
Third, coffee producers in Uganda became highly organised, mostly to facilitate access to
production contracts as well as services needed to support production. About 95% of smallholder
producers are organised and 5% operate individually. About 43% of them are organised in cooperatives
and 52% in other forms of farmer organisations. The latter, who comprise the majority, shun co-
operative coffee business due to past negative experiences. This is a stark difference with the pre-reform
period in which all coffee producers belonged to co-operatives. These organisations facilitate
contracting with exporters and traders and implies vertical co-ordination originating upstream as well.
A positive effect of farmer organisations is that they increase social capital of smallholder producers
and are good vehicles for engagement in an innovation system. Other authors highlight the importance
of farmer organisation, particularly collective action, stimulating new ways of linking with markets
(Kaganzi et al, 2009; Markelova et al, 2009).
In terms of institutional support, especially delivery of extension services, policy confusion seems
to persist. Although some export companies and NGOs provide these services, overall policy guidance
and clear task division is lacking. Since 1992, the government tried to fill the gap created by the
withdrawal of subsidies to the department of agriculture, using several donor funded projects. It first
instituted the Farming Systems Support Project (FSSP), followed by the unified extension system which
focussed on training farmers to be more responsive to the market. In the early 2000s, the government
45
created the National Agricultural Advisory Services (NAADS), mandated to provide extension services
on a demand driven, cost sharing basis. By this time extension service delivery was partly privatized,
due to the public good nature of some of its aspects (Poulton et al, 2010). A few years ago, after a
negative evaluation of NAADs performance however, the government mandated the military to deliver
extension services.
5.4 Prices, margins and rent distribution
In the post reform period, coffee prices have generally been volatile. Between 1993 and 1997, both
export prices and producer prices increased from US $ 1.1 to 1.7 (56%) and from 0.7 to 2.1 (218%),
respectively, per kg of green coffee. Thereafter, a sharp downward trend until 2002 with export prices
dropping from US $ 1.7 to 0.6 (by 65%) and producer prices from US $ 2.1 to 0.7 (by 65%). From
2003 to 2013, prices were generally on the rise, though the volatility persists (ICO, 2015). After reforms
started, we observe a remarkable reduction in the gap between the export price and producer prices
(Figure 3). This was expected since one of the objectives of liberalisation was to improve incentives to
producers through transmission of a higher share of world market prices to them. On the one hand,
reduction of the gap between world market and producer prices is an indication that producers indeed
get a higher share of the world coffee price. On the other, it signifies the degree of competition in the
coffee market. Interviews with exporters confirm that the coffee market is very tight in Uganda and that
in some years (e.g. 1997/98 and the early 2000s), they even made losses in order to stick to the
commitment of passing on a substantial share of world coffee prices to producers and maintain trading
relationships.
An important issue in the first decade in the post-reform period is that coffee producers did not
have price information. In spite of the limited trust they had in the middlemen (debbe boys), in the
chaotic market situation that followed liberalisation, they captured a substantial share of the coffee
price, resulting in very low producer prices (Fafchamps & Hill, 2008). The middlemen are also accused
of driving down coffee quality though their reckless behaviour of buying premature, poorly dried coffee
beans, since their profits are volume dependent and they operate in an unregulated section of the chain
(UNDP, 2012; MAAIF, 2010). In addition, the institutional void impacted negatively on the quality of
Uganda’s coffee (Petkova, 2006), leading to significant loss of its global market share (World Bank,
2011). This situation too was a dis-incentive to smallholder producers, contributing to the decline in
coffee production and trade between 1996 and 2003.
An important attribute of private coffee standards, which could contribute to their spread, is the
extra price premium most of them attract, above the world market coffee prices. Different standards,
approach premiums differently and most have been reducing as world coffee market prices rise. While
Fairtrade combines a fixed baseline and above the market price, Utz facilitates a more transparent
trading of sustainable coffee. Rainforest alliance and 4C offer a case-by-case and/market-based
premium, and organic premium is linked to overall coffee quality. By 2013, the minimum price for
46
washed Arabica Fairtrade coffee was USD 1.40 per pound and the social premium was USD 0.20 per
pound but between 2010 and 2013, the composite coffee price was above the Fairtrade minimum.
Organic certification which is the most mature regarding premiums offers interesting premiums. While
organic premiums were about 25-35% in the mid-2000s, they dropped to about 10-15% more recently.
The double Fairtrade-Organic coffee however, attracted a premium of USD 0.30 per pound in 2012.
Utz premium reduced from about USD 0.05/lb in 2009 to USD 0.04/lb in 2012. In Uganda Utz premium
was between USD 0.20/lb and USD 0.45/lb (Potts et al, 2014).
5.5 Challenges
The first most important challenge in the coffee sector in Uganda is low coffee yields. Throughout
the period (1961-2014), coffee yields remained rather stagnant. According to FAO (2017), average
green coffee yield for Uganda in the pre-reform period (1961-1991) was 627 kg/ha of green coffee.
This is higher than the African average of 386 kg/ha and Tanzania (469 kg/ha) but comparable to other
countries in the region (Burundi – 729 kg/ha; Kenya – 677 kg/ha; Rwanda – 627 kg/ha). In the post
reform period (1992-2014), coffee yields in Uganda increased by a mere 6% to 665 kg/ha. Although
this is still higher than the African average which increased to 446 kg/ha, and higher than all other
countries in the East Africa region (Kenya – 388 Kg/ha, Rwanda – 591 Kg/ha and Tanzania – 353
Kg/ha) except Burundi (889 kg/ha), it is way below the on station yield of 3,100 kg/ha for Uganda
(MAAIF 2010). While in the pre-reform period Ugandan soils were considered fertile (Chenery, 1960),
this is no longer the case. There are serious concerns about soil degradation due to nutrient depletion
and population pressure, among other things (Tenywa et 1999; Nkonya, 2004). Other authors confirm
that coffee yields in Uganda are below 30% of the potential due to pests, old trees, poor agronomic
practices and unfavourable soil properties (Baffes, 2006; Wang et al, 2015). Improving coffee yields
might be an effective way to improve rural incomes and reduce poverty in coffee producing areas, where
expansion of the coffee area is hardly possible anymore. Higher yields could also reduce costs of coffee
processers and exporters and increase efficiency in the chain. For example, while installed capacity for
wet mills and hulleries was 28 MT/day in 2010, only 11 MT/day of coffee on average was processed,
implying a capacity utilization of only 39% (World Bank, 2011).
Second, closely related to the low coffee yields are poor development and co-ordination of agro-
input markets and extension services. NGOs and other pressure groups forced agro-input dealers to
form UNADA in the late 1990s, in order to address the wide spread problem of fake inputs which had
negative effects on productivity. Furthermore, while many producers are interested in using organic-
inorganic input combinations to tackle low productivity at reasonable costs, organic input markets
hardly exist. Consequently, expenses on inputs in the Mount Elgon region, a good indicator of input use
by coffee producers, is as low as USD 953 annually, mostly on pesticides (Akoyi & Maertens, 2017).
3 By survey time, 1 USD was equivalent to Uganda shilling 2,700
47
Critical to solve the above two challenges is the coordination of coffee extension services. The
government shifts responsibilities every few years, which leads to confusion and inefficiencies and yet,
smallholder farmers who need the service the most, especially those not linked to exporters companies
in certification contracts, do not get extension advice. There is need for clarity in task division between
the government and the private sector for an effective coffee extension service. The government needs
to take care of the policy and institutional framework. Given the economic potential of coffee in
Uganda, caution should be exercised to avoid a heavily subsidised extension system which might be
unsustainable in the long run.
Third, low coffee quality persists, especially for coffee handled by middlemen. Survey findings
indicate that exporters invest in extra secondary processing of coffee in order to ensure export quality.
This investment is an extra cost on exporters and reduces the margins received by producers.
Considering the sheer number of players in the coffee market in Uganda, and the consequent stiff
competition, low quality of coffee is bound to continue given the institutional vacuum left by the co-
operatives. It will be important for UCDA to take leadership in co-ordinating various chain actors,
especially producer association and exporters to agree on a general coffee quality monitoring and
traceability mechanism which could be linked to reward and punishments through pricing.
Fourth, the proliferation of private coffee standards poses a challenge. While certified coffee
production in Uganda, unadjusted for multiple certification, is estimated at 31.7%, only 2% of coffee is
exported as certified coffee (Potts et al, 2014). This implies that smallholder producers are investing in
adherence to the requirements in these standards without reaping the benefits of a price premium.
Double and triple certification is increasing but given the oversupply of certified coffee, the benefits of
this for farmers are unclear. If the government aims at increasing the international market share through
sustainable coffees it is important that it develops a policy on sustainable coffee production.
Furthermore, the government should stimulate the private sector to use available scientific information
on the performance of these standards in coffee production zones in Uganda, to support coffee
productivity enhancement.
Fifth, poor infrastructure in rural areas, specifically poor road conditions and a poor
telecommunication network, raises the costs of doing business in Uganda. Companies invest in
impressive coffee collection networks but still fail to reach some farmers due to poor road conditions.
At processing level, power disruption poses a challenge. Larger companies invest in power generators
to ensure processing continues but for smaller companies this is difficult. Poor infrastructure increases
transactions costs and reduces profits throughout the coffee chain.
48
6. Conclusion
We describe the liberalisation and modernisation process in the coffee value chain in Uganda. This
can be summarized as a transformation from a very simple, largely state-controlled commodity chain
with few actors and low returns for farmers to a complex value chain with a few public supporting
institutions and many private actors who are inter-linked in complex business relationships, with
technical and institutional innovations emerging from these actors, and with higher returns for farmers.
Although the organisation, coordination and efficiency in the coffee value chain improved after
liberalisation, challenges remain regarding low yields, poor quality, unclear extension mechanisms,
under-developed input markets and oversupply of certified coffee.
49
Chapter 3
Private Sustainability Standards in the Ugandan Coffee Sector: Empty
Promises or Catalysts for Development?
1. Introduction
Over the past two decades, private food standards in global food value chains have spread rapidly
(Beghin et al., 2015). Private food standards guarantee specific quality and/or safety attributes of food,
and specific ethical and/or environmental aspects of food production and trade (Henson and Humphrey,
2010). They are especially important in international trade relations with developing countries because
of information asymmetries between producers in those countries and overseas buyers and consumers
(Schuster and Maertens, 2015). Understanding the welfare and poverty effects of private food standards
is particularly important because private food standards raise expectations among consumers about the
impact they have for smallholder producers in developing countries. For example, Fairtrade claims to
provide farmers with a better deal that allows them to improve their lives and to offer consumers a
powerful way to reduce poverty through their everyday shopping (Fairtrade International, 2016).
Likewise, Rainforest Alliance claims to ensure the long-term economic health of forest communities
through protecting ecosystems, safeguarding the well-being of local communities and improving
productivity (Rainforest Alliance, 2016). There is a growing body of literature investigating the welfare
implications of private food standards but evidence is quite mixed (see Beghin et al., 2015 for a review).
Some studies indicate that private food standards enhance farmers’ welfare (e.g. Asfaw et al., 2010;
Handschuch et al., 2013) while others find no or even adverse effects (e.g. Holzapfel and Wollni, 2014;
Hansen and Trifkovic, 2014).
In this chapter, we assess the economic implications of coffee certification for smallholder coffee
farmers in the Mount Elgon region in Eastern Uganda. We use cross-sectional household survey data
and instrumental variable methods – with instruments that pass weak identification tests and over-
identification restrictions – to reveal how participation in two different coffee certification schemes – a
double Fairtrade-Organic scheme and a triple Utz - Rainforest Alliance - Common Code of Conduct for
Coffee (Utz-Rainforest-4C) scheme – affects poverty, income, coffee production, yields and labour
productivity. The focus on coffee in Uganda is particularly relevant because coffee is a major export
crop produced by a large number of smallholder farmers. The government of Uganda promotes adoption
of private food standards and production of ‘sustainable coffees’ as a means to reposition the country
in the international coffee market – as mentioned in the National Export Strategy (MAAIF, 2010; ITC,
2012).
50
The focus on private food standards in the coffee sector is relevant because there is no consensus
on whether private food standards are good for smallholder coffee farmers or not. Studies from different
institutional and agro-ecological settings provide diverse conclusions on the income and poverty effects
of coffee standards. Most studies focus on Latin-America (e.g. Bacon, 2005; Wollni and Zeller, 2007;
Bacon et al., 2008; Mendez et al., 2010; Valkila and Nygren, 2010; Beuchelt and Zeller, 2011; Ruben
and Zuniga, 2011; Barham and Weber, 2012; Ruben and Fort, 2012) while evidence from Africa is
limited to a handful of recent papers (Bolwig et al., 2009; Chiputwa et al., 2015; Van Rijsbergen et al.,
2016). With this chapter we contribute to the evidence on the impact of private food standards in Africa.
In addition, earlier studies mostly analyse the impact of one single certification scheme (e.g. Bacon et
al., 2008; Bolwig et al., 2009; Valkila and Nygren, 2010; Ruben and Fort, 2012; Jena and Grote, 2017)
– mostly Fairtrade certification as one of the oldest private food standards in the coffee sector – while
more recent studies investigate the impact of double or triple certification (e.g. Valkila, 2009; Weber,
2011; Jena, et al., 2012; Bolwig, et al., 2013) or compare different certification schemes in the same
area (e.g. Mendez et al, 2010; Beuchelt and Zeller, 2011; Ruben and Zuniga, 2011; Barham and Weber,
2012; Chiputwa et al, 2015 and Van Rijsbergen et al, 2016). As private food standards differ widely in
focus and requirements, their effectiveness and their complementarity in improving farmers’ welfare
and reducing poverty in specific settings may vary as well. Comparative evidence and evidence on
increasingly common multiple certification remains relevant and our research contributes to this.
Moreover, we focus on multiple outcome indicators in order to better understand the channels through
which certification contributes to farmer welfare and poverty reduction. Furthermore, aforementioned
economic studies on the impact of coffee certification usually do not control for differences in agro-
ecological conditions – or only to a small extent, e.g. by controlling for altitude of coffee plots (Wollni
and Zeller, 2007; Bolwig et al., 2009; Chiputwa et al., 2015). Based on a comprehensive GIS database
for our research area, we are able to better control for agro-ecological heterogeneity using various plot-
weighted indicators.
2. Background and data
2.1 The coffee sector in Uganda
During the past two decades coffee production in Uganda increased from 3.2 million 60 Kg bags
of green coffee in 1995 to about 4.8 million in 2015 (figure 1). Production decreased in the early 2000s,
mainly due to the Coffee Wilt Disease (Tracheomycosis), but recovered from 2005 onwards. About
80% of the production is Robusta coffee, mainly grown in central and south-western Uganda, and 20%
is Arabica coffee, grown at higher altitude in western, north-western and eastern Uganda. Domestic
consumption is very small (5% of production) ; coffee is mainly for export. Coffee constitutes about
20% of Uganda’s foreign exchange earnings and Uganda is the second largest African coffee exporter
(UCDA, 2014; ICO, 2015).

51
Until 1991, coffee trade in Uganda was controlled by the Coffee Marketing Board (CMB) and
production organized through a centrally-planned cooperative system. Processes of liberalisation and
privatisation in the 1990s led to abolition of CMB and the collapse of many coffee cooperatives. Private
companies emerged and currently about 52 private roasting and exporting companies are registered, of
which about 35 are active (UCDA, 2014). More than 90% of Ugandan coffee is produced by
approximately 1.7 million smallholder producers (UBOS, 2014). Direct employment in various
activities in the coffee chain is estimated at about five million people, including farmers, farm-workers,
traders, and employees in roasting and exporting companies. Coffee yields in Uganda are low, on
average 609 kg of green coffee per hectare or about 2,550 kg/ha of fresh cherries (FAO, 2016). Although
higher than the African average of 502 kg/ha for green coffee, actual yield is a fifth of the 3,100 kg/ha
green coffee (or 13,000 kg/ha fresh cherries) yield obtained in on-station research trials in Uganda
(MAAIF, 2010; FAO, 2016).
Figure 1: Coffee Production and Export Trends in Uganda (1995-2015) ; Source: Derived from FAOstat
(www.faostat.org)
Private sustainability standards started spreading in the Ugandan coffee sector in mid-1990s,
starting with Fairtrade in 1994, followed by organic, Utz, Rainforest Alliance (Rainforest) and 4C.
These standards all focus to some extent on improving the livelihoods of smallholder coffee producers
but this is most apparent for Fairtrade that focuses on reducing poverty and empowering farmers.
Rainforest and Organic have the strongest focus on biodiversity and natural resource conservation while
Utz and 4C primarily focus on good agricultural and farm management practices (see Table A1,
appendix of chapter one) for more details on the characteristics and requirements of the standards).
Since implementing companies ensure that producers comply with certification requirements of each
of the standards, one would expect improvements in social, economic and environmental outcomes
encompassed in these requirements. Currently about 35,000 Ugandan coffee producers are FT certified;
30,000 are Organic certified; 65,450 are Utz certified; and 21,200 are Rainforest certified (Table A1,

52
appendix chapter 1). 4C certification, now called the Baseline Common Code (BCC), was introduced
in Uganda in 2008 but being a sector-wide standard, it is difficult to estimate the number of producers
involved. Certified coffee production is currently estimated to be 3% of total coffee exports and
continues to expand. In its national export strategy, Uganda aims to further increase production of
sustainable coffees to boost export earnings (ITC, 2012).
2.2 Study area
We study the implications of coffee certification for smallholder producers in the Mount Elgon
region in Eastern Uganda, a main Arabica coffee producing area in the country. The region includes
eight districts; ranges in altitude between 1,200 and 2,200 metres above sea level; and has a bi-modal
rainfall pattern (1,600 - 2,200 mm) and reasonably fertile soils. The region faces increasing population
pressure and land degradation, including problems of soil erosion and increased occurrence of
landslides (Claessens et al., 2007; Knapen et al., 2006). The region is dominated by two ethnic groups,
the Bagisu in the western Bugisu sub-region, and the Sabiny in the eastern Sebei sub-region. Coffee is
grown in a garden system, usually intercropped with bananas and other food crops. There are four main
coffee exporting companies operating in the region: Great Lakes, Kawacom, Kyagalanyi Coffee
Limited (KCL) and Gumutindo Coffee Co-operative Enterprises (GCCE). The latter three implement
coffee certification schemes in the region.
Before liberalisation of the coffee sector, production and marketing of coffee in Mount Elgon
region was organised by Bugisu Cooperative Union (BCU), a state-controlled cooperative. BCU was
one of the largest coffee cooperatives in the country with over 200 Growers’ Cooperative Societies
(GCSs) and about 467,000 members. It was one of the first cooperatives in Uganda to become Fairtrade
certified in 1995. When the liberalisation process increased competition in the sector, BCU faced
problems. Limited entrepreneurship, failure to deliver high quality Fairtrade coffee, and
mismanagement of the Fairtrade social premium ultimately resulted in the collapse of BCU in 1997.
Gumutindo Coffee Cooperative Enterprise (GCCE) was then founded on BCU remains, by grouping
its four best performing GCSs. Since its founding in 2000, GCCE started implementing Fairtrade and
later, a double Fairtrade-Organic certification scheme. It runs a cooperative business model, through a
network of GCSs across the region, and provides coffee specific extension services to its members and
does not allow the use of chemical inputs. Registered cooperative societies transport and supply fully
washed coffee to GCCE union in Mbale town. Farmers usually process their coffee at home and deliver
it fully washed to the cooperative society.
Kyagalanyi Coffee Limited (KCL) is one of the oldest private coffee export company in Uganda,
founded in 1992. In Mount Elgon region, KCL implements a triple Utz-Rainforest-4C coffee
certification program since 2006. KCL’s business model is centred around the company’s coffee
washing stations and contract-farming with producer organisations. Currently, KCL has six washing
stations in the Mount Elgon region; all established close to rivers in order to guarantee access to water
53
for coffee washing. The company selects interested farmers within a 12.5 km radius from the washing
stations and organises farmers into producer organisations (POs) per village. The company provides
coffee specific extension services, agro-chemicals, protective gear, and facilities for cleaning protective
gear and disposal of used chemical containers. KCL pays attention to timely delivery of good quality
inputs and offers farmers the opportunity to obtain fertilizer on credit, deducting the cost from the end-
season bonus farmers receive, and to buy other inputs in its agrochemical store. KCL collects fresh
coffee cherries from the POs and processes them at the washing stations.
Independent coffee farmers and cooperatives also operate in the Mount Elgon region. They sell
coffee to traders and agents of the four companies through spot market transactions, either individually
or through independent coffee cooperatives or producer organisations. They sell fresh coffee cherries
or home-processed dried (kiboko) or fully washed coffee. Most independent farmers do not receive
coffee specific extension services, except for ad hoc trainings from NGOs, the National Agricultural
Advisory Services (NAADS), or regional UCDA officers.
2.3 Data collection
We use original cross-sectional household survey data from the Mount Elgon region, collected
between February and May 2014 and covering the 2013/2014 coffee season. A multi-stage stratified
random sampling design was developed using information from company databases of certified
producers and village Local Council (LC) lists of coffee producers. In the first stage, the five most
intensive coffee growing districts were purposively selected out of the seven rural districts in the Mount
Elgon region (table 1). In the second stage, four (or five for Kapchorwa district with smaller sub-
counties) sub-counties per district were selected in a stratified random way with the certification
schemes as strata. In each district two (or three in Kapchorwa) sub-counties were selected where GCCE
or KCL source certified produce from – the two companies source from different sub-counties – and
two sub-counties where they do not source from. In the third stage, we randomly selected three (or two
in Kapchorwa) villages per sub-county and 10 coffee farmers in each village. The final sample includes
600 coffee producing farm-households from 60 villages in 21 sub-counties and five districts, of which
170 are Fairtrade-Organic certified, 130 are Utz-Rainforest-4C certified and 300 are not certified (table
1). The analysis in this paper is done excluding five farmers in the sample whose coffee shrubs are still
too young to be productive. In order to limit confounding the impact of certification with the impact of
cooperative or association membership, all farmers in the sample belong to a cooperative or a producer
association. Due to continuous administrative subdivision in Uganda, sub-counties (the lowest
administrative unit) are very small and include only one coffee cooperative or association, impeding
the selection of certified and control farmers in the same sub-county (and controlling for sub-county
fixed effects in the analysis). Nevertheless, sub-counties within a district are relatively similar in terms
of agro-ecological, infrastructure and institutional characteristics – although differences exists between
sub-counties (table A1, appendix).

54
Table 1: Sampling design
District Sub-county Certification Total households Sampled households
Bududa Bududa Utz-RA-4C 2,597 30
Bumayoka FT-Org 701 30
Bukigai None 2,000 30
Bushiika None 2,600 30
Bulambuli Masiira Utz-RA-4C 1,215 30
Namisuni FT-Org 359 30
Sisiyi None 2,480 30
Bukibologoto /Simu None 1,380 30
Kapchorwa Gamogo Utz-RA-4C 520 20
Kabeywa Utz-RA-4C 485 20
Munaria FT-Org 268 20
Kaptanya None 2,400 30
Tegeres None 2,950 30
Manafwa Bumbo FT-Org 320 30
Magale FT-Org 262 30
Bupoto None 2,320 30
Buwabwala None 1,440 30
Sironko Busulani Utz-RA-4C 1,251 30
Buwalasi FT-Org 1,289 30
Buyobo None 2,100 30
Buwasa None 1,710 30
Total 21 30,647 600
Source: Authors’ derivation from administrative data, company databases and village Local Council lists;
Notes: Utz-RA-4C = Utz-Rainforest-4C, FT-Org = Fairtrade-Organic;
The survey was implemented using a quantitative structured questionnaire with different modules
and through face-to-face interviews by a team of trained enumerators. Survey data include detailed
information on coffee production, marketing and income, and on general household characteristics and
overall income. GPS coordinates of the homestead and all coffee plots were recorded during the survey
and available GIS data on Mount Elgon region was used to derive location-specific indicators. In
addition, a village survey was implemented in all 60 sampled villages, using a structured questionnaire
and face-to-face interviews with a small group of village leaders; and semi-structured interviews were
carried out with 45 stakeholders in the coffee sector, including exporters, processors, traders, co-
operative marketing managers and service providers.

55
3. Methods
To analyse the impact of the two coffee certification schemes in the Mount Elgon region, we
estimate regression models of the following type:
Yi = α0 + βXi + γCi + εi (1)
The dependent variable Yi, measures the welfare outcome of household i. To create insights into the
channels through which certification affects coffee farmers, we estimate multiple models for the
following outcome indicators: 1/ poverty, measured as having a per capita household income below the
international poverty linei; 2/ total household income, measured as total income in UGX from livestock,
coffee and other crop production, off-farm activities and transfers in the last 12 months; 3/ per capita
income, measured as total household income in UGX divided by the household size; 4/ coffee income,
measured as net coffee income in UGX for the last 12 months; 5/ coffee income per hectare, measured
as coffee income divided by area under coffee; 6/ coffee production, measured as the quantity of coffee
harvested in kg during the last 12 months; 7/ coffee yield, measured as quantity of coffee harvested in
kg per hectare; and 8/ labour productivity, measured as the net coffee income per person-day of family
labour in coffee production, processing and marketing in UGX/person-day. The main explanatory
variables of interest are included in Ci,, a vector of dummy variables for participation in the Utz-
Rainforest-4C (Utz-RA-4C) and Fairtrade-Organic (FT-Org) coffee certification schemes. These binary
variables are mutually exclusive as no producer is contracting with GCCE and KCL at the same time.
In a first set of regressions we use a probit model estimation for the binary poverty outcome
indicator, and OLS estimations for the other continuous outcome indicators. To control for possible
selection bias from observed heterogeneity, we include a large set of observable household, agro-
ecological and location characteristics in the vector Xi. Household characteristics include indicators of
human and physical capital: the education level, gender and age of the household head, the number of
adults and the number of children in the household, livestock ownership measured in tropical livestock
units, and the coffee area and its square – the latter are replaced with the total farm size and its square
for the regressions with poverty and total household income as outcome indicators. Agro-ecological
indicators include slope measured in percentage, altitude measured in metres above sea level,
topographic wetness measured as a dimension-less index, and heat load measured in trigonometric
units. These variables are derived by overlaying GPS data of coffee plots from the household survey,
with GIS data, including a Digital Elevation Model (DEM)ii, and plot-size weighted averages are
calculated at the household level. The topographic wetness index indicates rainfall and run-off flows
and is a good proxy for soil nutrient flows (Sorensen et al., 2006). Heat load is a good proxy for how
much sunshine a plot receives (McCune and Keon, 2002). Together these four variables capture
variation in the suitability of land for coffee cultivation. Location variables include district dummies
and a vector of village indicators including dummy variables for villages having a primary school, a
56
health centre, a weekly market and an all-weather road, and the distance from the village centre to the
nearest trading centre and to Mbale town. These variables capture observed and unobserved differences
across districts, regarding access to infrastructure and transaction costs for accessing input and output
markets. Infrastructure variables are derived from village interviews and distance variables from GPS
information.
In a second set of regressions we use instrumental variable models (IV) and a 2SLS estimation
technique:
𝑌𝑖 = 𝛼0 + 𝛽𝑋𝑖 + 𝛾�̂�𝑖 + 𝑢𝑖 (2)
�̂�𝑖 = 𝜋0 + 𝜋1𝑍𝑖 + 𝜋2𝑋𝑖 + 𝑣𝑖 (3)
With IV models we can reduce bias from heterogeneity in unobserved factors such as farmer motivation
and experience being correlated with the certification variables of interest (Ci). As instruments Zi in the
first stage equation, we use the following variables: 1/ years of experience of the farm-household in
BCU; 2/ distance between the homestead and the nearest KCL washing station; and 3/ the square of the
distance between the homestead and the nearest KCL washing station. These are relevant instruments
(see section 4.2). Many farmers (44% of sampled households) had bad experience with BCU before its
collapse in 1997 and these farmers are less likely to engage in coffee cooperatives and contracting again.
The correlation between the first instrument, years of experience with BCU, is negative and significant
at the 1% level for both certification variables, with correlation coefficients of -0.16 for Fairtrade-
Organic and -0.22 for Utz-Rainforest-4C certification. Given the business model of KCL and their
practices of sourcing coffee from within a certain radius from their washing stations, farmers located
closer to the washing stations are more likely to engage in supplying KCL under the Utz-Rainforest-4C
certification scheme while farmers located farther from the washing station are more likely to engage
in supplying GCCE under the Fairtrade-Organic certification scheme. Certification to the Fairtrade-
Organic scheme is significantly (at the 1% level) positively correlated with the instruments distance to
the washing station and the squared distance – with correlation coefficients of 0.26 and 0.33 – while for
Utz-Rainforest-4C certification the correlation is significantly (at the 1% level) negative with
correlation coefficients of -0.54 and -0.41. The instruments are plausibly exogenous or only weakly
correlated with the error term. The distance to the KCL washing station (and the squared distance) is
exogenous to farm-household decision-making. KCL locates its washing stations close to rivers for easy
access to water and given that we control for agro-ecological differences in our regression analysis,
distance to the washing station can be considered exogenous. The years of experience with BCU before
its collapse in 1997, is likely not or only weakly correlated with unobserved factors that determine the
outcome indicators because of the time period of more than 15 years between its collapse and survey
time. Given the high correlation between the instruments and the instrumented certification variables,
potential endogeneity bias is likely reduced in the IV models, even if the instruments are not completely

57
exogenous. We further test the validity of our instrumental variable approach with an F-test for joint
significance of the excluded instruments; a Sanderson-Windmeijer Chi2 test and Kleibergen-Paap LM
test for under-identification; a Kleibergen-Paap F-test for weak identification; and a Sargan-Hansen test
for over-identification restrictions. In spite of the instruments passing all these tests, we cannot rule out
bias completely. We also perform an Anderson-Rubin test for endogeneity of the certification variables.
4. Results
4.1 Comparison of certified and non-certified households
In table 2, we present summary statistics for household, agro-ecological and village characteristics.
We compare respectively Utz-Rainforest-4C and Fairtrade-Organic certified with non-certified
households. The average age of household heads in the region is 50 years; the average years of education
is 8.14; 11% of households are female-headed; and the average household size is 4.3 adults and 4.1
children. The statistics indicate that Fairtrade-Organic and Utz-Rainforest-4C certified households have
a slightly lower level of education of the household head, and that Fairtrade-Organic certified
households are slightly older with a higher probability to be female-headed.
Farm sizes in the region are small; on average 1.05 ha per household of which 0.6 ha is used for
coffee cultivation. While there is no difference in total farm size or livestock ownership between
certified and non-certified households, Utz-Rainforest-4C certified households do have a significantly
larger coffee area (0.67 ha) than non-certified households (0.56 ha). Compared to non-certified
households, Utz-Rainforest-4C certified households cultivate on steeper slopes (15%) and on plots with
a lower heat load index while Fairtrade-Organic certified households cultivate on more gentle slopes
(10.7%) and on plots with a higher heat load index. There is no significant difference in altitude and
topographic wetness across certified and non-certified households. This is an indication that on average
Fairtrade-Organic household operate on plots that are slightly better suited for coffee production while
Utz-Rainforest-4C households manage plots slightly less suited for coffee production. Apart from Utz-
Rainforest-4C households having a lower probability of access to a health centre in the village and a
higher probability of having access to an all-weather road, there are no differences in village
infrastructure characteristics. Compared to non-certified households, both Utz-Rainforest-4C and
Fairtrade-Organic households are closer to a trading centre.
Table 3 presents summary statistics on poverty, income and variables related to coffee production
and a comparison of certified with non-certified households. In general, we observe a very high
incidence of poverty in the research area, with 65% of households under the international poverty line,
compared to the national average of 19.7% in 2012/13 (MFPED, 2014). Average household income is
low, at around 3.9 million UGX or about 649 thousand UGX per capita; and a main part of the income,
around 1.8 million UGX, comes from coffee cultivation. Utz-Rainforest-4C certified households have
a significantly lower incidence of poverty and significantly higher income, total household income,
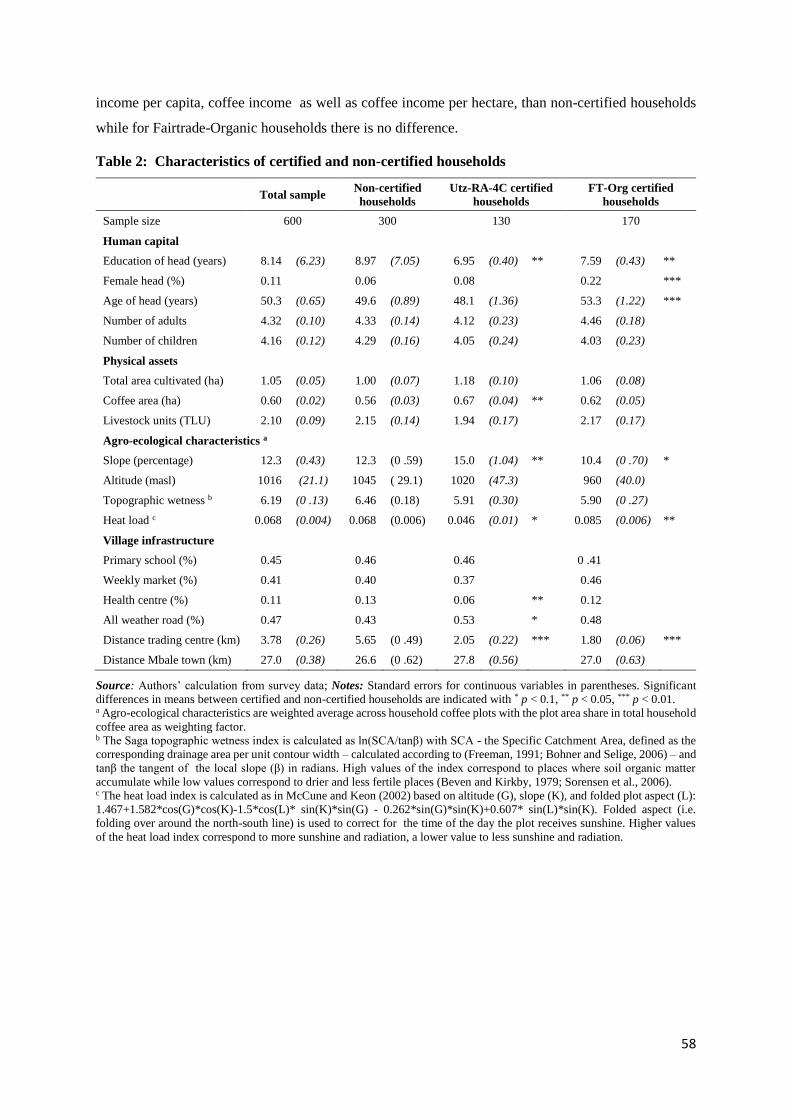
58
income per capita, coffee income as well as coffee income per hectare, than non-certified households
while for Fairtrade-Organic households there is no difference.
Table 2: Characteristics of certified and non-certified households
Total sample
Non-certified
households
Utz-RA-4C certified
households
FT-Org certified
households
Sample size 600 300 130 170
Human capital
Education of head (years) 8.14 (6.23) 8.97 (7.05) 6.95 (0.40) ** 7.59 (0.43) **
Female head (%) 0.11 0.06 0.08 0.22 ***
Age of head (years) 50.3 (0.65) 49.6 (0.89) 48.1 (1.36) 53.3 (1.22) ***
Number of adults 4.32 (0.10) 4.33 (0.14) 4.12 (0.23) 4.46 (0.18)
Number of children 4.16 (0.12) 4.29 (0.16) 4.05 (0.24) 4.03 (0.23)
Physical assets
Total area cultivated (ha) 1.05 (0.05) 1.00 (0.07) 1.18 (0.10) 1.06 (0.08)
Coffee area (ha) 0.60 (0.02) 0.56 (0.03) 0.67 (0.04) ** 0.62 (0.05)
Livestock units (TLU) 2.10 (0.09) 2.15 (0.14) 1.94 (0.17) 2.17 (0.17)
Agro-ecological characteristics a
Slope (percentage) 12.3 (0.43) 12.3 (0 .59) 15.0 (1.04) ** 10.4 (0 .70) *
Altitude (masl) 1016 (21.1) 1045 ( 29.1) 1020 (47.3) 960 (40.0)
Topographic wetness b 6.19 (0 .13) 6.46 (0.18) 5.91 (0.30) 5.90 (0 .27)
Heat load c 0.068 (0.004) 0.068 (0.006) 0.046 (0.01) * 0.085 (0.006) **
Village infrastructure
Primary school (%) 0.45 0.46 0.46 0 .41
Weekly market (%) 0.41 0.40 0.37 0.46
Health centre (%) 0.11 0.13 0.06 ** 0.12
All weather road (%) 0.47 0.43 0.53 * 0.48
Distance trading centre (km) 3.78 (0.26) 5.65 (0 .49) 2.05 (0.22) *** 1.80 (0.06) ***
Distance Mbale town (km) 27.0 (0.38) 26.6 (0 .62) 27.8 (0.56) 27.0 (0.63)
Source: Authors’ calculation from survey data; Notes: Standard errors for continuous variables in parentheses. Significant
differences in means between certified and non-certified households are indicated with * p < 0.1, ** p < 0.05, *** p < 0.01. a Agro-ecological characteristics are weighted average across household coffee plots with the plot area share in total household
coffee area as weighting factor. b The Saga topographic wetness index is calculated as ln(SCA/tanβ) with SCA - the Specific Catchment Area, defined as the
corresponding drainage area per unit contour width – calculated according to (Freeman, 1991; Bohner and Selige, 2006) – and
tanβ the tangent of the local slope (β) in radians. High values of the index correspond to places where soil organic matter
accumulate while low values correspond to drier and less fertile places (Beven and Kirkby, 1979; Sorensen et al., 2006). c The heat load index is calculated as in McCune and Keon (2002) based on altitude (G), slope (K), and folded plot aspect (L):
1.467+1.582*cos(G)*cos(K)-1.5*cos(L)* sin(K)*sin(G) - 0.262*sin(G)*sin(K)+0.607* sin(L)*sin(K). Folded aspect (i.e.
folding over around the north-south line) is used to correct for the time of the day the plot receives sunshine. Higher values
of the heat load index correspond to more sunshine and radiation, a lower value to less sunshine and radiation.

59
Table 3: Comparison of poverty incidence, income and coffee production performance
indicators across certified and non-certified producers
Total
sample
Non-certified
households
Utz-RA-4C
certified
households
FT-Org certified
households
Sample size 595 300 129 166
Poverty incidence (%) 0.648 0.682 0.485 *** 0.712
(0.02) (0.027) (0.044) (0.035)
Total household income (1,000 UGX) 3,855 3,603 4,783 *** 3,604
(128) (170) (314) (230)
Income per capita (1,000 UGX) 649 608 810 *** 599
(25.3) (36.2) (58.8) (42.0)
Coffee income (1,000 UGX) 1,788 1,584 2,601 *** 1,532
(82) (111) (214) (126)
Coffee income per hectare (1,000 UGX/ha) 2,904 2,720 3,678 *** 2,625
(64.1) (82.7) (173) (95.5)
Coffee production (kg) 2,336 2,146 3,367 *** 1,891
(87.6) (118.6) (227.3) (125.4)
Coffee yield (kg/ha) 4,009 3,964 5,200 *** 3,179 ***
(43.5) (43.2) (78.3) (61.9)
Input costs for coffee (UGX/ha) 259,892 315,541 372,038 75,227 ***
(20193) (28382) (60620) (12870)
Family labour in coffee (days/ha) 790 882 566 *** 800
(33.6) (50.2) (72.1) (54.1)
Coffee labour productivity (UGX/day) 8,249 6,888 15,318 *** 5,252 *
(468) (604) (1381) (445)
Price fresh cherries (UGX/kg) 842.7 857.8 821.1 * n.a.
(10.3) (18.3) (9.88)
Price dried cherries (UGX/kg) 3,105 3,093 n.a. n.a.
(14.1) (14.7)
Price fully washed (UGX/kg) 4,244 3,947 n.a. 4,364.06 ***
(37.6) (42.2) (49.01)
Source: Authors’ calculation from survey data; Notes: Standard errors in parentheses. Significant differences in means for
each certification category and the control are indicated with * p < 0.1, ** p < 0.05, *** p < 0.01. n.a. = price data is not
available because farmers do not or hardly sell coffee in this form.
On average Fairtrade-Organic certified households use significantly less inputs (75 thousand
UGX/ha) than non-certified households (315 thousand UGX/ha) while there is no difference in labour
input. Utz-Rainforest-4C certified household use significantly less labour in coffee production (566
person-days) than non-certified households (882 person-days) while there is no difference in input costs.
In general, coffee farmers in the research area have an average coffee output of 2,336 kg fresh cherries,
an average coffee yield of 4,009 kg fresh coffee cherries per ha (equalling about 954 kg of green coffee
per ha) and a labour productivity in coffee production of 8,249 UGX per person-day. There are large
60
differences in output and productivity across farmers. Utz-Rainforest-4C certified farmers have the
highest coffee output, yield and labour productivity; their coffee output is 57% higher than for non-
certified farmers, coffee yield 31% higher and return to labour 122% higher. On the contrary, Fairtrade-
Organic certified farmers have lower yields and labour productivity; their coffee yield is 20% lower
than for non-certified farmers and return to labour 238% lower. The coffee yield of Fairtrade-Organic
farmers of 3,179 kg/ha is slightly above the national average of about 2,550 kg/ha; the yield of Utz-
Rainforest-4C farmers of 5,200 kg/ha is more than double the national average yield but is still only
half the potential coffee yield of 13,000 kg/ha measured in Ugandan on-station trials.
Coffee prices are difficult to compare as farmers sell coffee as fresh cherries, home-dried cherries
or home-processed fully washed coffee. Utz-Rainforest-4C certified farmers mainly sell fresh cherries
to the washing stations of KCL; Fairtrade-Organic certified farmers mainly sell fully washed coffee to
the GCCE unit in Mbale; and non-certified farmers sell fresh, dried and/or washed coffee. The price for
fresh cherries that Utz-Rainforest-4C certified farmers receive is somewhat (4.3%) lower than the price
non-certified farmers receive for fresh cherries; while the price for washed coffee that Fairtrade-Organic
farmers receive is substantially (11%) higher than the price non-certified farmers receive for washed
coffee. These prices are quite low compared to fertiliser prices. UCDA (2017) recommends 750 Kg/ha
of chemical fertiliser per hectare of coffee which costs about 2,250 thousand UGX/ha. Considering the
above average coffee yields and prices in the Mount Elgon region, it implies that fertiliser costs would
be 53% and 68% of coffee revenue per hectare for Utz-Rainforest-4C and Fairtrade-Organic certified
producers, respectively.
4.2 Econometric results
In table 4, we present a summary of the main estimated effects of Utz-Rainforest-4C and Fairtrade-
Organic certification on the different outcome indicators from probit, OLS and IV estimations. The full
regression results are given in tables A2 (first stage results), A3 (probit and OLS results) and A4 (IV
results) in appendix. Before examining the main results, we first shortly discuss the relevance and
validity of the instruments. For both certification variables, the instruments are jointly significant in the
first stage regressions and the Sanderson-Windmeijer tests reject the null-hypotheses of under-
identification (table A2). In addition, based on the Kleibergen-Paap LM test we can reject overall under-
identification of the model, and the Kleibergen-Paap test for weak identification reveals a Wald F
statistic of 34.7, which is above the 10% Stock-Yogo critical value of 13.43 (table A2). Moreover, all
IV regressions, pass the Sargan-Hansen test for over-identification restrictions (table A4). The tests
show that the instruments are relevant and plausibly exogenous. The Anderson-Rubin test rejects the
null hypotheses of certification being exogenous (table A4), which justifies the use of IV estimations.
Given that our instruments are strong and that exogeneity of the certification variables is rejected, the
IV estimates likely result in the smallest bias and hence we base our discussion on these estimates.
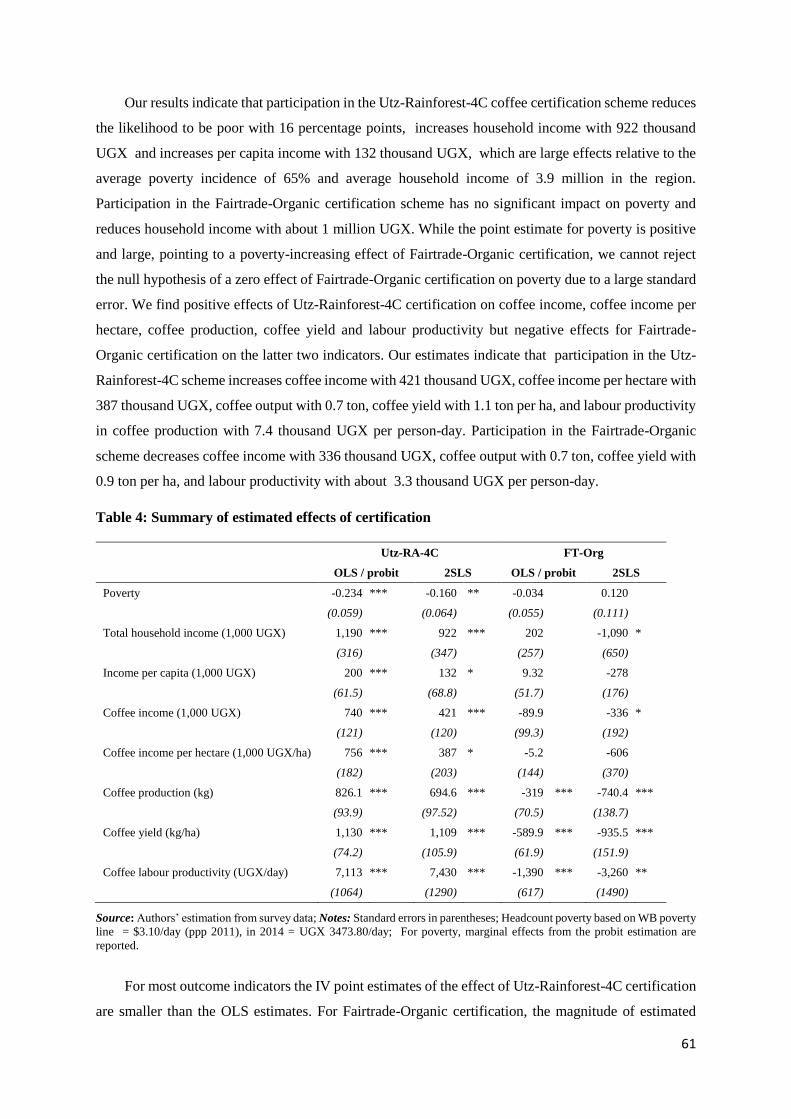
61
Our results indicate that participation in the Utz-Rainforest-4C coffee certification scheme reduces
the likelihood to be poor with 16 percentage points, increases household income with 922 thousand
UGX and increases per capita income with 132 thousand UGX, which are large effects relative to the
average poverty incidence of 65% and average household income of 3.9 million in the region.
Participation in the Fairtrade-Organic certification scheme has no significant impact on poverty and
reduces household income with about 1 million UGX. While the point estimate for poverty is positive
and large, pointing to a poverty-increasing effect of Fairtrade-Organic certification, we cannot reject
the null hypothesis of a zero effect of Fairtrade-Organic certification on poverty due to a large standard
error. We find positive effects of Utz-Rainforest-4C certification on coffee income, coffee income per
hectare, coffee production, coffee yield and labour productivity but negative effects for Fairtrade-
Organic certification on the latter two indicators. Our estimates indicate that participation in the Utz-
Rainforest-4C scheme increases coffee income with 421 thousand UGX, coffee income per hectare with
387 thousand UGX, coffee output with 0.7 ton, coffee yield with 1.1 ton per ha, and labour productivity
in coffee production with 7.4 thousand UGX per person-day. Participation in the Fairtrade-Organic
scheme decreases coffee income with 336 thousand UGX, coffee output with 0.7 ton, coffee yield with
0.9 ton per ha, and labour productivity with about 3.3 thousand UGX per person-day.
Table 4: Summary of estimated effects of certification
Utz-RA-4C FT-Org
OLS / probit 2SLS OLS / probit 2SLS
Poverty -0.234 *** -0.160 ** -0.034 0.120
(0.059) (0.064) (0.055) (0.111)
Total household income (1,000 UGX) 1,190 *** 922 *** 202 -1,090 *
(316) (347) (257) (650)
Income per capita (1,000 UGX) 200 *** 132 * 9.32 -278
(61.5) (68.8) (51.7) (176)
Coffee income (1,000 UGX) 740 *** 421 *** -89.9 -336 *
(121) (120) (99.3) (192)
Coffee income per hectare (1,000 UGX/ha) 756 *** 387 * -5.2 -606
(182) (203) (144) (370)
Coffee production (kg) 826.1 *** 694.6 *** -319 *** -740.4 ***
(93.9) (97.52) (70.5) (138.7)
Coffee yield (kg/ha) 1,130 *** 1,109 *** -589.9 *** -935.5 ***
(74.2) (105.9) (61.9) (151.9)
Coffee labour productivity (UGX/day) 7,113 *** 7,430 *** -1,390 *** -3,260 **
(1064) (1290) (617) (1490)
Source: Authors’ estimation from survey data; Notes: Standard errors in parentheses; Headcount poverty based on WB poverty
line = $3.10/day (ppp 2011), in 2014 = UGX 3473.80/day; For poverty, marginal effects from the probit estimation are
reported.
For most outcome indicators the IV point estimates of the effect of Utz-Rainforest-4C certification
are smaller than the OLS estimates. For Fairtrade-Organic certification, the magnitude of estimated

62
effects is stronger or more negative in the IV estimations than in the OLS estimations, and for income
and poverty effects reverse signs. This is consistent with an upward bias in the OLS estimates due to
more productive and less poor coffee farmers self-selecting in the certification scheme.
5. Discussion
Our results show that participation in the Utz-Rainforest-4C coffee certification scheme increases
the income from coffee production and the overall household income of smallholder coffee farmers.
This income effect mainly comes from an increase in land and labour productivity and not from a price
effect. The increased income associated with Utz-Rainforest-4C certification also results in substantial
poverty reduction. The estimated increase in total household income (922 thousand UGX) is about
double the estimated increase in coffee income (421 thousand UGX). Given that on average more than
90% of household income comes from farming, this may be an indication that the Utz-RA-4C coffee
scheme results in managerial and technical spill-over effects on the farm or that increased revenue from
coffee production relaxes farmers’ cash constraints to invest in other farm activities. Such indirect
effects have been reported in the literature for certification of other crops (e.g. Balineau, 2013; Graeme,
2010; Hidayat et al, 2015; Rueda and Lambin, 2013) and for contract-farming in general (e.g. Maertens
and Vande Velde, 2017; Minten et al., 2007). Our results show that smallholder participation in the
Fairtrade-Organic coffee certification scheme reduces smallholders’ income from coffee production
and total household income, and does not contribute to poverty reduction. While Fairtrade-Organic
certified producers do receive higher prices for the supplied coffee from selling fully washed coffee
beans and receiving both Fairtrade and organic premiums, the certificate results in lower land and labour
productivity and higher prices do not compensate for this. We find that the income-reducing effect of
Fairtrade-Organic is much stronger for total household income (-1.1 million UGX) than for coffee
income (-336 thousand UGX). The negative impact on total household income is substantial; it is 28%
of the average income in the region. Possible explanations for this include a negative spill-over effect
of organic production to other crops that are often intercropped with coffee by depressing their yields;
and a reduced availability of family labour for other income-generating activities related to the need for
labour-intensive coffee-processing to deliver fully washed coffee to GCCE. The results imply that 14
years after the introduction of Fairtrade-Organic certification, the scheme fails to reduce poverty in the
Mount Elgon region. The incidence of poverty among Fairtrade-Organic certified producers is as high
as the incidence of poverty among non-certified producers.
The results show that the two certification schemes differ substantially regarding the impact on
smallholder producers. While the Utz-Rainforest-4C scheme contributes to higher yields, labour
productivity and coffee incomes – and ultimately results in higher total and per capita household income
and reduced poverty – the Fairtrade-Organic scheme results in lower yields, labour productivity and
coffee income – and does not contribute to reducing poverty. Utz-Rainforest-4C certification is found
63
to have a superior impact despite Utz-Rainforest-4C certified households operating on plots that are on
average less suited for coffee production; which holds up our strategy to control for agro-ecological
differencesiii. The differences in findings between the two certification schemes are likely related to the
different coffee production systems the two schemes promote, as they implement measures to comply
with the different certification conditions. These differences further confirm findings by other authors
that impact of private food standards tend to vary with the functioning of the farmer organisations or
cooperatives and company business models used (Mitiku et al, 2017; Chiputwa et al, 2015; Beuchelt &
Zeller, 2013). KCL promotes an intensive coffee production system with a balanced use of organic-
inorganic fertilizer combination and different species of shade trees. The company has set up an
extension system with company extension agents on motorcycles travelling regularly to all villages in
the scheme to give advice over production and management practices to Utz-Rainforest-4C certified
farmers. The company provides quality inputs at its store for easy and timely access by farmers, and
pays farmers cash at time of delivery of the coffee to the washing station and a bonus at the end of the
season. For the 2013/2014 season farmers received a bonus of 35 UGX/kg. It is likely the combination
of a well-organized contract-farming scheme with extension services, input delivery and timely
payments to farmers on the one hand, and the requirements on good agricultural practices (including
chemical input use) and environmental sustainability in the three certificates on the other, that explains
the superior impact of the Utz-Rainforest-4C certification scheme on land and labour productivity.
GCCE promotes an organic production system that prohibits the use of inorganic fertilizers and
pesticides. The scheme includes extension services to members and supports a farmer-to-farmer input
sharing system. However, farmers in the GCCE scheme indicate that shortage of organic fertilizer is
one of the main constraints for productivity growth; and that access to manure from their own livestock
is insufficient while a market for manure hardly exists and sharing with other farmers is rarely practiced.
Farmers are paid a fixed price per kg of supplied coffee, which varies according to the quality of their
coffee. Payment is done after the GCS has delivered the coffee to GCCE and not at time of delivery to
the GCS. Farmers receive a bonus per kg of supplied coffee at the end of the season when coffee prices
are good, but for the 2013/2014 season Fairtrade-Organic farmers reported not to have received a bonus.
Our results suggest that in the Mount Elgon region, where coffee yields are far below their potential,
where soils are increasingly depleted and where access to manure and organic fertilizer is insufficient,
an organic production system further reduces yields and results in low labour productivity – and that a
price premium of 11% cannot compensate for these productivity losses and improve farmers’ income.
Our results are to some extent in line with other studies on the implications of coffee certification
for smallholder producers. We find that participation in a double Fairtrade-Organic certification scheme
is associated with higher prices, lower yields and reduced labour productivity, and thereby fails to
contribute to income growth and poverty reduction. Other studies have also indicated a lack of impact
of FT, Org and double Fairtrade-Organic certification for smallholder producers. For smallholder coffee
64
producers in Nicaragua, Bacon et al. (2008), Valkila (2009, Valkila and Nygren (2010) and Ruben and
Zuniga (2011), conclude that Fairtrade certification results in higher prices but does not improve yields,
poverty and living conditions; and Beuchelt and Zeller (2011) indicate that both Organic and double
Fairtrade-Organic certification have no impact on farm profits and poverty. For other countries in Latin-
America, Ruben and Fort (2012) indicate that Fairtrade certification has no substantial impact on
income and productivity for Peruvian coffee farmers; and Mendez et al. (2010) conclude, based on a
cross-country analysis, that Fairtrade, Organic and double Fairtrade-Organic certification increase
coffee prices but have no effect on poverty and living conditions. For smallholder coffee farmers in
Ethiopia, Jena et al. (2012) find no substantial impact of Fairtrade certification on farm income and
poverty, and a negative effect of Org certification on yields and coffee incomes. For India, Jena and
Grote (2017) find that Fairtrade certification increases the income of coffee farmers somewhat but not
enough to reduce poverty substantially. For Mexico, Perfecto, et al (2005), find that farmers receive
higher prices for certified shade coffee but that price premiums are not enough to compensate for
substantial yield reductions.
We find that participation in the triple Utz-Rainforest-4C certification scheme results in higher
yields, higher labour productivity and higher coffee incomes, and thereby creates income growth and
poverty reduction. Very few other studies have estimated the economic impact of these types of coffee
standards. Ruben and Zuniga (2011) come to very similar findings for Rainforest certification among
coffee farmers in Nicaragua and conclude that Rainforest outperforms Fairtrade certification because
of strong positive yield effects. Mitiku et al. (2017) show that Rainforest certification in Ethiopia
increases farm incomes and reduces poverty. However, in their study the superior impact of Rainforest
certification mainly comes from a large price effect, while we find that Rainforest improves farmers’
income especially through a positive yield effect.
Our results differ substantially from the findings of Chiputwa et al. (2015) who compare similar
certification schemes (Utz, double Utz-Fairtrade and double Utz-Organic) in Central Uganda, a main
Robusta coffee producing area in the country. They find that Utz-Fairtrade certification increases
household per capita expenditures and reduces poverty while single Utz and double Utz-Organic
certification have no impact. This is in contrast with our findings from Eastern Uganda that Utz-
Rainforest-4C certification contributes to poverty reduction while Fairtrade-Organic does not, and that
Utz-Rainforest-4C certification has a positive impact on yields, labour productivity and incomes while
Fairtrade-Organic has a negative impact. We put forward possible interpretations of these differences
in findings. First, differences in the organisation and structure of the supply chains could contribute to
explaining the observed heterogeneity in effects. Coffee can be sold in different forms at different stages
of processing and value-adding. In our sample, Fairtrade-Organic farmers sell washed green coffee and
Utz-Rainforest-4C farmers sell fresh cherries while in the sample of Chiputwa et al. (2015)
Utz_Fairtrade farmers sell milled coffee and Utz and Fairtrade-Organic farmers sell fresh cherries. In

65
addition, contract conditions vary. In our sample both certification schemes entail exclusive contracts
that do not allow side-selling while Chiputwa et al. (2015) indicate Utz-Fairtrade farmers in their sample
to have non-exclusive agreements with the coffee company that allow selling to other buyers. In our
sample no bonus was paid at the end of the season to Fairtrade-Organic farmers while Chiputwa et al.
(2015) indicate Utz-Fairtrade farmers to have received a Fairtrade bonus. Adding value through milling,
being allowed to look for the highest bidder, and effectively receiving a Fairtrade bonus at the end of
the coffee season may increase the return to farmers. Second, the combined results of our study and the
study by Chiputwa et al. (2015) may imply that in Uganda, where coffee yields are rather low, Fairtrade
certification is better for smallholder coffee farmers when combined with Utz certification than when
combined with Organic certification which prohibits the use of external inorganic inputs and results in
lower yields. Both studies indicate that Fairtrade certification results in higher prices, but the
combination with Organic in our analysis results in lower yields while the combination with Utz in the
analysis by Chiputwa et al. (2015) results in better incomes and reduced poverty.
More generally, heterogeneity in the performance of cooperatives and contract-farming schemes
are important factors driving the results in our analysis – and in other available studies on the impact of
coffee certification. In most studies, including ours, the number of sampled certification schemes is
very limited, which makes it impossible to completely disentangle the impact of certification and the
impact of membership in a specific cooperative or participation in a specific contract-farming scheme.
To better take into account cooperative and contract heterogeneity, and better distinguish the impact of
certification, one would need a larger and more varied sample of farmers, including farmers certified to
the same standard in different contract and cooperative schemes.
6. Conclusion
In this chapter we analyse the implications of two coffee certification schemes, a double Fairtrade-
Organic certification scheme and a triple Utz-Rainforest-4C certification scheme, for smallholder
farmers in Eastern Uganda. Our results show that smallholder participation in the former scheme
reduces producer incomes and has no impact on poverty. While certified producers do receive higher
coffee prices, the certificate results in lower land and labour productivity and the price premium does
not compensate for this. For the latter scheme, we find that smallholder participation increases income
by increasing land and labour productivity in coffee production, and eventually contributes to poverty
reduction. The results imply that 14 years after the introduction of Fairtrade-Organic certification, the
scheme fails to reduce poverty in the Mount Elgon region.
Our results, along with previous findings in the literature, indicate that a price premium to
producers is neither necessary, nor sufficient, for private food standards to contribute to increasing rural
incomes and reducing poverty. We find that a price premium of 11% in the Fairtrade-Organic
66
certification scheme cannot offset a detrimental impact on yield while a yield increase of about 45% in
the Utz-Rainforest-4C certification scheme results in higher coffee incomes, even without a price
premium. Our findings corroborate the conclusions of Barham and Weber (2012), based on evidence
from Mexico and Peru, that yields are more important than prices in increasing net returns to coffee
farmers; and of Valkila (2009) that low yields and low intensity agriculture, promoted by standards, can
trap people in poverty. From the interpretation of our results and the comparison with results from
Chiputwa et al. (2015), we put forward that in areas with degraded soils and low average yields,
Fairtrade certification focusing on fair producer prices, might be better for smallholder coffee farmers
when combined with standards that focus on good agricultural practices and productivity growth, such
as Utz, than when combined with Organic standards. It is an increasingly popular practice to combine
Fairtrade and organic certification but this practice is driven by consumer demand and is less evident
from a producer perspective because yield effects are more important than price effects in creating gains
for smallholder producers (Barham and Weber, 2012; Van den Broeck et al., 2015).
Our results imply that private food standards may not always live up to the expectations they create
concerning poverty reduction and improving the welfare of smallholder farmers. In our study, this is
most obvious for the double Fairtrade-Organic certification that does not create income benefits for
farmers and does not contribute to poverty reduction while the Fairtrade standard claims to offer
consumers a powerful way to reduce poverty through their everyday shopping (Fairtrade International,
2015). Other studies have come to similar conclusions on the lack of a substantial impact of private
food standards in the coffee sector in various countries. This puts doubt on the sincerity of private food
standards and the justification of the price premium consumers pay for certified products, as standard
seem to not always walk their talk.
i The World Bank International poverty line of $3.10/day (in 2011 PPP prices) is used; this is equivalent to UGX
3,473.80 /day in 2014 price levels (World Bank, 2015). ii DEM was based on void filled Shuttle Radar Topography Mission (SRTM) data at a resolution of 1 arc-second
(USGS, 2015). iii Failure to control for agro-ecological differences likely would have resulted in an underestimation of the impact
of Utz_RA_4C certification and an overestimation of the impact of FT-Org certification.
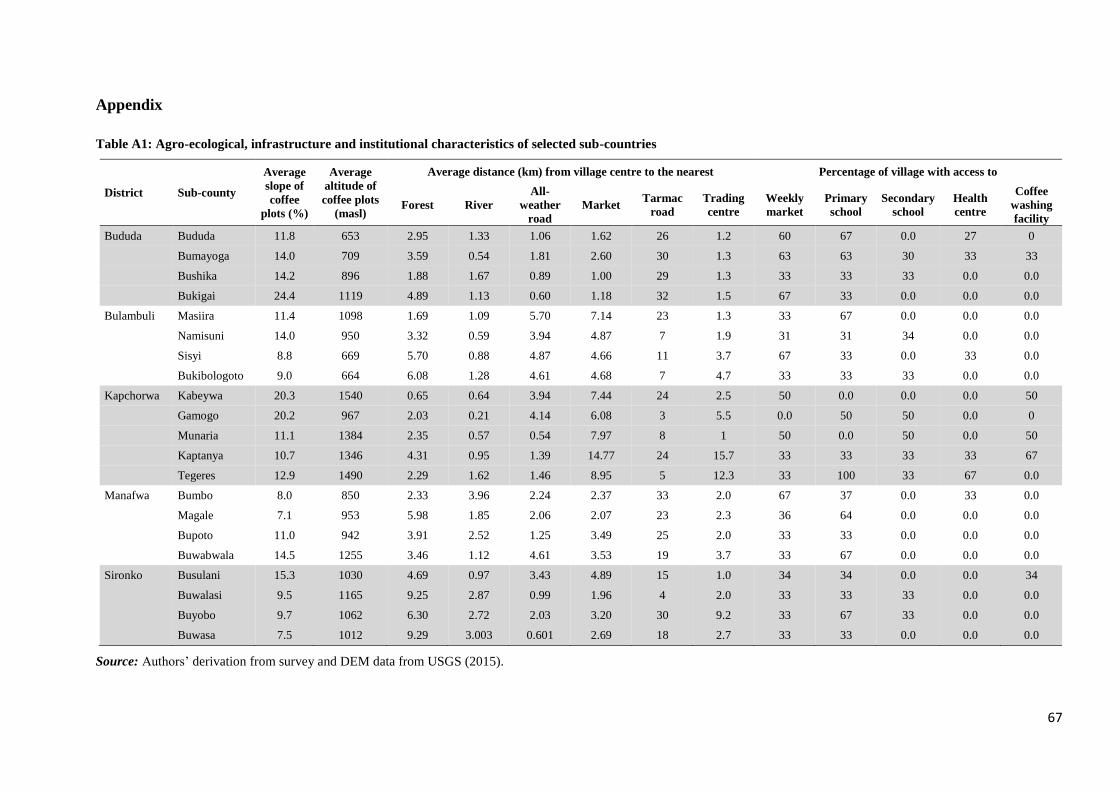
67
Appendix
Table A1: Agro-ecological, infrastructure and institutional characteristics of selected sub-countries
District Sub-county
Average
slope of
coffee
plots (%)
Average
altitude of
coffee plots
(masl)
Average distance (km) from village centre to the nearest Percentage of village with access to
Forest River
All-
weather
road
Market Tarmac
road
Trading
centre
Weekly
market
Primary
school
Secondary
school
Health
centre
Coffee
washing
facility
Bududa Bududa 11.8 653 2.95 1.33 1.06 1.62 26 1.2 60 67 0.0 27 0
Bumayoga 14.0 709 3.59 0.54 1.81 2.60 30 1.3 63 63 30 33 33
Bushika 14.2 896 1.88 1.67 0.89 1.00 29 1.3 33 33 33 0.0 0.0
Bukigai 24.4 1119 4.89 1.13 0.60 1.18 32 1.5 67 33 0.0 0.0 0.0
Bulambuli Masiira 11.4 1098 1.69 1.09 5.70 7.14 23 1.3 33 67 0.0 0.0 0.0
Namisuni 14.0 950 3.32 0.59 3.94 4.87 7 1.9 31 31 34 0.0 0.0
Sisyi 8.8 669 5.70 0.88 4.87 4.66 11 3.7 67 33 0.0 33 0.0
Bukibologoto 9.0 664 6.08 1.28 4.61 4.68 7 4.7 33 33 33 0.0 0.0
Kapchorwa Kabeywa 20.3 1540 0.65 0.64 3.94 7.44 24 2.5 50 0.0 0.0 0.0 50
Gamogo 20.2 967 2.03 0.21 4.14 6.08 3 5.5 0.0 50 50 0.0 0
Munaria 11.1 1384 2.35 0.57 0.54 7.97 8 1 50 0.0 50 0.0 50
Kaptanya 10.7 1346 4.31 0.95 1.39 14.77 24 15.7 33 33 33 33 67
Tegeres 12.9 1490 2.29 1.62 1.46 8.95 5 12.3 33 100 33 67 0.0
Manafwa Bumbo 8.0 850 2.33 3.96 2.24 2.37 33 2.0 67 37 0.0 33 0.0
Magale 7.1 953 5.98 1.85 2.06 2.07 23 2.3 36 64 0.0 0.0 0.0
Bupoto 11.0 942 3.91 2.52 1.25 3.49 25 2.0 33 33 0.0 0.0 0.0
Buwabwala 14.5 1255 3.46 1.12 4.61 3.53 19 3.7 33 67 0.0 0.0 0.0
Sironko Busulani 15.3 1030 4.69 0.97 3.43 4.89 15 1.0 34 34 0.0 0.0 34
Buwalasi 9.5 1165 9.25 2.87 0.99 1.96 4 2.0 33 33 33 0.0 0.0
Buyobo 9.7 1062 6.30 2.72 2.03 3.20 30 9.2 33 67 33 0.0 0.0
Buwasa 7.5 1012 9.29 3.003 0.601 2.69 18 2.7 33 33 0.0 0.0 0.0
Source: Authors’ derivation from survey and DEM data from USGS (2015).

68
Table A2: First stage regression results on the likelihood of certification Utz-RA-4C
certification
FT-Org
certification
Included variables
Education of head -0.0021 -0.0008
(0.0017) (0.0031) Female head -0.0477 * 0.1453 **
(0.0285) (0.0612)
Age of head 0.0007 0.0004
(0.0035) (0.0077)
Age of head2 -0.0000003 0.00002
(0.00003) (0.0001)
Number of adults -0.0057 0.0054
(0.0067) (0.0111)
Number of children 0.0061 -0.0042
(0.0057) (0.0087)
Coffee area 0.1083 * 0.1001
(0.0631) (0.0926)
Coffee area2 -0.0260 -0.0510
(0.0267) (0.0350)
Livestock units 0.0062 -0.0025
(0.0045) (0.0063)
Weighted plot slope -0.0047 ** 0.0026
(0.0019) (0.0028)
Weighted plot altitude 0.0002 *** 0.00003
(0.00005) (0.0001)
Weighted topographic wetness -0.0242 *** -0.0168
(0.0065) (0.0108)
Weighted heat load -0.5754 *** 0.8521 ***
(0.1726) (0.2298)
Primary school dummy 0.0851 *** -0.0605 *
(0.0220) (0.0326)
Weekly market dummy -0.0296 -0.0158
(0.0236) (0.0358)
Health Centre dummy 0.0237 0.1638 ***
(0.0478) (0.0551)
All season road dummy -0.0557 ** 0.0171
(0.0272) (0.0475)
Distance to trading centre -0.0026 -0.0111 ***
(0.0022) (0.0027)
Distance to Mbale -0.0082 *** -0.0078
(0.0027) (0.0057)
Bulambuli district dummy 0.1535 *** -0.0122
(0.0531) (0.0972)
Kapchorwa district dummy 0.4495 *** -0.1158
(0.0762) (0.1471)
Manafa district dummy 0.3551 *** -0.3595 ***
(0.0467) (0.0855)
Sironko district dummy 0.3885 *** -0.1678 ***
(0.0455) (0.0556)
Excluded instruments
Distance to washing station -0.1941 *** -0.0532 ***
(0.0094) (0.0122)
Distance to washing station2 0.0077 *** 0.0051 ***
(0.0005) (0.0007)
BCU experience -0.0004 -0.0077 ***
(0.0013) (0.0021)
Constant 0.8834 *** 0.5366** **
(0.1430) (0.2374)
N-observations 595 595 F-test for excluded instruments 258.9 41.71
F-test p-value 0.00 0.00
SW Chi2 statistics 740.1 127.6 Chi2 p-value 0.00 0.00
SW F-test 353.2 60.9
Notes: Standard errors in parentheses; * p < 0.1, ** p < 0.05, *** p < 0.01; SW Chi2 = Sanderson-Windmeijer under identification Chi-square statistics; SW F-test = Sanderson-Windmeijer weak identification; Overall under-identification test, the Kleibergen-Paap LM statistic = 59.34
& p-value = 0.00; Overall weak identification test, the Kleibergen-Paap Wald F statistic = 34.67, the test statistic is above the Stock-Yogo
critical value at 10% = 13.43.
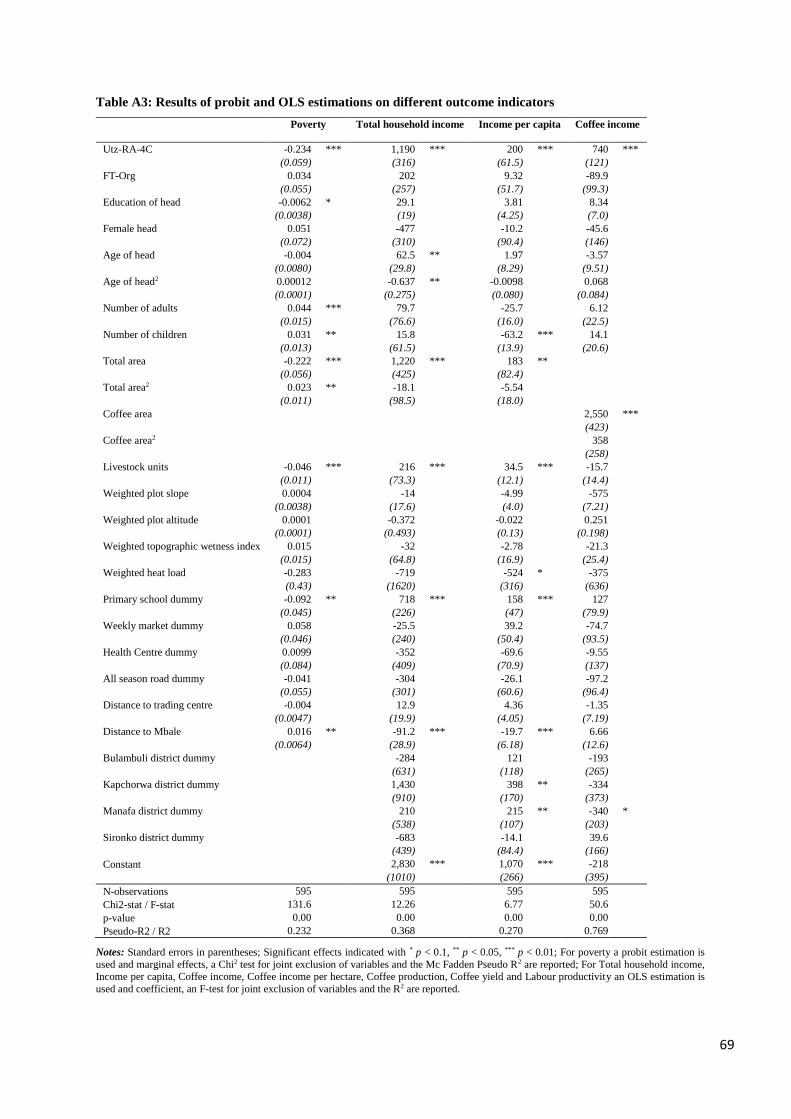
69
Table A3: Results of probit and OLS estimations on different outcome indicators
Poverty Total household income Income per capita Coffee income
Utz-RA-4C -0.234 *** 1,190 *** 200 *** 740 *** (0.059) (316) (61.5) (121)
FT-Org 0.034 202 9.32 -89.9
(0.055) (257) (51.7) (99.3)
Education of head -0.0062 * 29.1 3.81 8.34
(0.0038) (19) (4.25) (7.0)
Female head 0.051 -477 -10.2 -45.6
(0.072) (310) (90.4) (146)
Age of head -0.004 62.5 ** 1.97 -3.57
(0.0080) (29.8) (8.29) (9.51)
Age of head2 0.00012 -0.637 ** -0.0098 0.068
(0.0001) (0.275) (0.080) (0.084)
Number of adults 0.044 *** 79.7 -25.7 6.12
(0.015) (76.6) (16.0) (22.5)
Number of children 0.031 ** 15.8 -63.2 *** 14.1
(0.013) (61.5) (13.9) (20.6)
Total area -0.222 *** 1,220 *** 183 **
(0.056) (425) (82.4)
Total area2 0.023 ** -18.1 -5.54
(0.011) (98.5) (18.0)
Coffee area 2,550 *** (423)
Coffee area2 358
(258)
Livestock units -0.046 *** 216 *** 34.5 *** -15.7
(0.011) (73.3) (12.1) (14.4)
Weighted plot slope 0.0004 -14 -4.99 -575
(0.0038) (17.6) (4.0) (7.21)
Weighted plot altitude 0.0001 -0.372 -0.022 0.251
(0.0001) (0.493) (0.13) (0.198)
Weighted topographic wetness index 0.015 -32 -2.78 -21.3
(0.015) (64.8) (16.9) (25.4)
Weighted heat load -0.283 -719 -524 * -375
(0.43) (1620) (316) (636)
Primary school dummy -0.092 ** 718 *** 158 *** 127
(0.045) (226) (47) (79.9)
Weekly market dummy 0.058 -25.5 39.2 -74.7
(0.046) (240) (50.4) (93.5)
Health Centre dummy 0.0099 -352 -69.6 -9.55
(0.084) (409) (70.9) (137)
All season road dummy -0.041 -304 -26.1 -97.2
(0.055) (301) (60.6) (96.4)
Distance to trading centre -0.004 12.9 4.36 -1.35
(0.0047) (19.9) (4.05) (7.19)
Distance to Mbale 0.016 ** -91.2 *** -19.7 *** 6.66
(0.0064) (28.9) (6.18) (12.6)
Bulambuli district dummy -284 121 -193
(631) (118) (265)
Kapchorwa district dummy 1,430 398 ** -334
(910) (170) (373)
Manafa district dummy 210 215 ** -340 * (538) (107) (203)
Sironko district dummy -683 -14.1 39.6
(439) (84.4) (166)
Constant 2,830 *** 1,070 *** -218
(1010) (266) (395)
N-observations 595 595 595 595
Chi2-stat / F-stat 131.6 12.26 6.77 50.6
p-value 0.00 0.00 0.00 0.00
Pseudo-R2 / R2 0.232 0.368 0.270 0.769
Notes: Standard errors in parentheses; Significant effects indicated with * p < 0.1, ** p < 0.05, *** p < 0.01; For poverty a probit estimation is
used and marginal effects, a Chi2 test for joint exclusion of variables and the Mc Fadden Pseudo R2 are reported; For Total household income,
Income per capita, Coffee income, Coffee income per hectare, Coffee production, Coffee yield and Labour productivity an OLS estimation is
used and coefficient, an F-test for joint exclusion of variables and the R2 are reported.

70
Table A3: Results of probit and OLS estimations on different outcome indicators (continued)
Coffee income/ha Coffee production Coffee Yield Labour productivity
Utz-RA-4C 756 *** 826.1 *** 1,130 *** 7,113 *** (182) (93.9) (74.2) (1064)
FT-Org -5.20 -319 *** -589.9 *** -1,390 ** (144) (70.5) (61.9) (617)
Education of head 10.4 5.14 0.163 72.56
(8.24) (4.84) (3.97) (51.5)
Female head -162 -173.7 -196.7 * 944
(183) (129.2) (100.4) (1187)
Age of head -1.58 7.40 7.64 -72.41
(15.7) (10.03) (8.72) (100)
Age of head2 0.080 -0.038 -0.074 0.756
(0.143) (0.085) (0.077) (0.922)
Number of adults 37.3 -23.03 -0.521 -549.5 *** (38.2) (16.3) (15.18) (205)
Number of children 36.4 24.3 10.57 175
(35.2) (15.8) (12.68) (194)
Total area
Total area2
Coffee area -99.4 3,595 *** -891.2 *** 7,087 * (396) (430) (190.8) (3960)
Coffee area2 142 47.9 245.9 *** 3,944 * (157) (262.4) (87.41) (2335)
Livestock units -33.8 -6.77 -18.96 * -166.9
(21.2) (9.82) (10.6) (125)
Weighted plot slope 4.67 -10.05 ** -8.57 * -37.99
(16.1) (4.43) (4.75) (39)
Weighted plot altitude 0.291 0.1002 0.121 -1.56
(0.382) (0.150) (0.139) (1.73)
Weighted topographic wetness index -46.2 -15.81 -48.31 ** 481.7 * (44.3) (18.63) (18.81) (251)
Weighted heat load -482 -412.7 -62.96 -9,000 ** (1180) (503) (504) (4290)
Primary school dummy 79.8 187.5 *** 104.6 * 378
(128) (58.9) (53.52) (662)
Weekly market dummy -312 ** 2.54 -54.07 -255
(128) (69) (55.06) (700)
Health Centre dummy -0.247 -9.50 0.245 -1,570
(190) (113.8) (87.26) (1015)
All season road dummy -256 * -100.76 -78.92 765
(146) (69.4) (62.995) (797)
Distance to trading centre -16.2 -4.70 -12.77 * -11.47
(14.7) (5.73) (7.067) (54.19)
Distance to Mbale 31.2 7.46 14.86 ** 294.8 *** (19.3) (10.48) (7.53) (105)
Bulambuli district dummy -222 -289.8 -370.2 *** -1,990
(275) (228.3) (128.7) (1996)
Kapchorwa district dummy -358 -160.3 22.21 -4,540
(542) (303.9) (189.4) (2778)
Manafa district dummy -771 *** -416.1 ** -856 *** -1,740
(260) (177.7) (103.2) (1343)
Sironko district dummy 452 ** 161 237.7 ** 6,174 ***
(227) (141.7) (112.9) (1423)
Constant 1,840 *** -127.6 4,317 *** -4,630
(647) (351) (345.7) (3688)
N-observations 595 595 595 595
Chi2-stat / F-stat 4.76 127.2 51.12 14.16
p-value 0.00 0.00 0.00 0.00
Pseudo-R2 / R2 0.139 0.887 0.6307 0.6018
Notes: Standard errors in parentheses; Significant effects indicated with * p < 0.1, ** p < 0.05, *** p < 0.01; For poverty a probit estimation is
used and marginal effects, a Chi2 test for joint exclusion of variables and the Mc Fadden Pseudo R2 are reported; For Total household income,
Income per capita, Coffee income, Coffee income per hectare, Coffee production, Coffee yield and Labour productivity an OLS estimation is used and coefficient, an F-test for joint exclusion of variables and the R2 are reported.
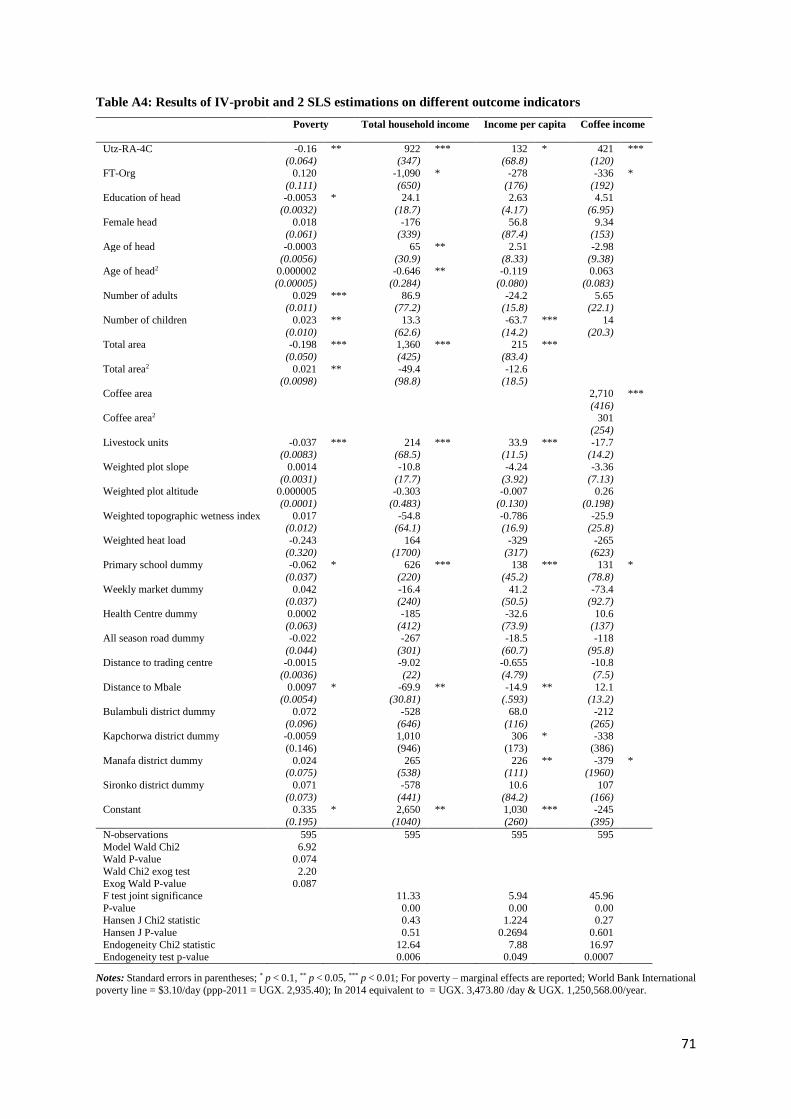
71
Table A4: Results of IV-probit and 2 SLS estimations on different outcome indicators
Poverty Total household income Income per capita Coffee income
Utz-RA-4C -0.16 ** 922 *** 132 * 421 *** (0.064) (347) (68.8) (120)
FT-Org 0.120 -1,090 * -278 -336 * (0.111) (650) (176) (192)
Education of head -0.0053 * 24.1 2.63 4.51 (0.0032) (18.7) (4.17) (6.95)
Female head 0.018 -176 56.8 9.34
(0.061) (339) (87.4) (153)
Age of head -0.0003 65 ** 2.51 -2.98
(0.0056) (30.9) (8.33) (9.38)
Age of head2 0.000002 -0.646 ** -0.119 0.063 (0.00005) (0.284) (0.080) (0.083)
Number of adults 0.029 *** 86.9 -24.2 5.65
(0.011) (77.2) (15.8) (22.1)
Number of children 0.023 ** 13.3 -63.7 *** 14
(0.010) (62.6) (14.2) (20.3)
Total area -0.198 *** 1,360 *** 215 *** (0.050) (425) (83.4)
Total area2 0.021 ** -49.4 -12.6
(0.0098) (98.8) (18.5)
Coffee area 2,710 *** (416)
Coffee area2 301 (254)
Livestock units -0.037 *** 214 *** 33.9 *** -17.7
(0.0083) (68.5) (11.5) (14.2)
Weighted plot slope 0.0014 -10.8 -4.24 -3.36
(0.0031) (17.7) (3.92) (7.13)
Weighted plot altitude 0.000005 -0.303 -0.007 0.26 (0.0001) (0.483) (0.130) (0.198)
Weighted topographic wetness index 0.017 -54.8 -0.786 -25.9
(0.012) (64.1) (16.9) (25.8)
Weighted heat load -0.243 164 -329 -265
(0.320) (1700) (317) (623)
Primary school dummy -0.062 * 626 *** 138 *** 131 * (0.037) (220) (45.2) (78.8)
Weekly market dummy 0.042 -16.4 41.2 -73.4 (0.037) (240) (50.5) (92.7)
Health Centre dummy 0.0002 -185 -32.6 10.6
(0.063) (412) (73.9) (137)
All season road dummy -0.022 -267 -18.5 -118
(0.044) (301) (60.7) (95.8)
Distance to trading centre -0.0015 -9.02 -0.655 -10.8 (0.0036) (22) (4.79) (7.5)
Distance to Mbale 0.0097 * -69.9 ** -14.9 ** 12.1
(0.0054) (30.81) (.593) (13.2)
Bulambuli district dummy 0.072 -528 68.0 -212
(0.096) (646) (116) (265)
Kapchorwa district dummy -0.0059 1,010 306 * -338 (0.146) (946) (173) (386)
Manafa district dummy 0.024 265 226 ** -379 * (0.075) (538) (111) (1960)
Sironko district dummy 0.071 -578 10.6 107
(0.073) (441) (84.2) (166)
Constant 0.335 * 2,650 ** 1,030 *** -245
(0.195) (1040) (260) (395)
N-observations 595 595 595 595
Model Wald Chi2 6.92
Wald P-value 0.074
Wald Chi2 exog test 2.20
Exog Wald P-value 0.087
F test joint significance 11.33 5.94 45.96
P-value 0.00 0.00 0.00
Hansen J Chi2 statistic 0.43 1.224 0.27
Hansen J P-value 0.51 0.2694 0.601
Endogeneity Chi2 statistic 12.64 7.88 16.97
Endogeneity test p-value 0.006 0.049 0.0007
Notes: Standard errors in parentheses; * p < 0.1, ** p < 0.05, *** p < 0.01; For poverty – marginal effects are reported; World Bank International
poverty line = $3.10/day (ppp-2011 = UGX. 2,935.40); In 2014 equivalent to = UGX. 3,473.80 /day & UGX. 1,250,568.00/year.
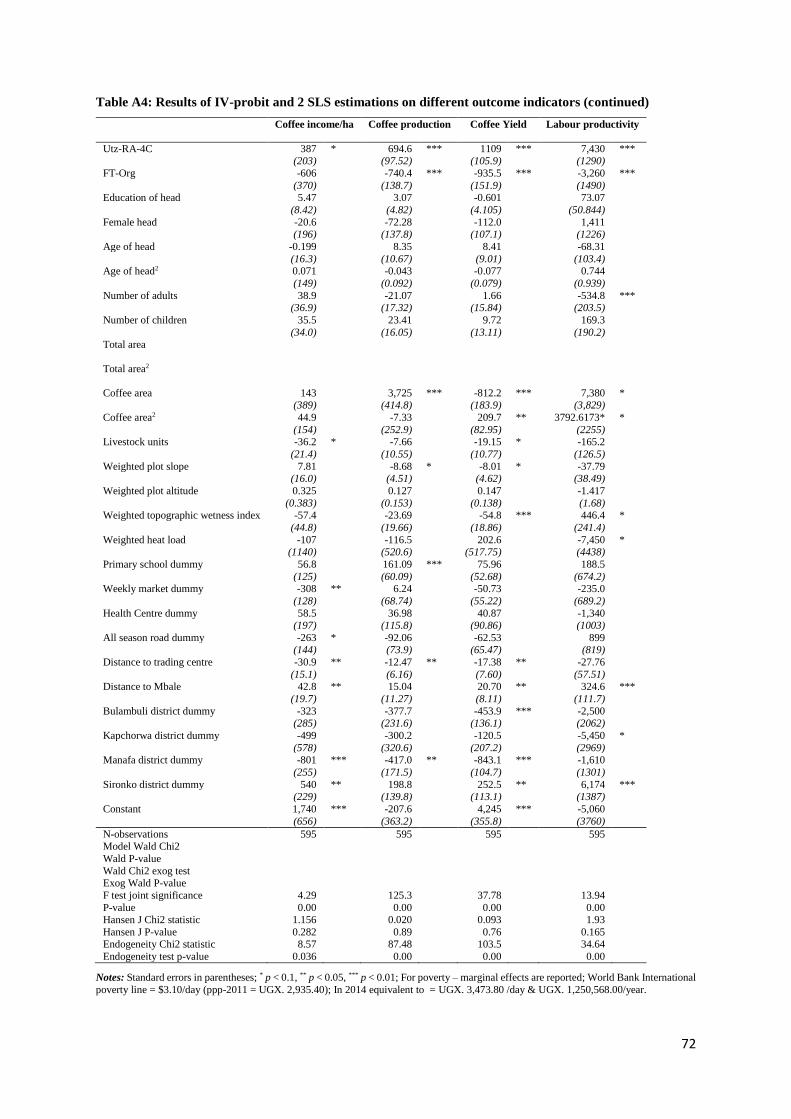
72
Table A4: Results of IV-probit and 2 SLS estimations on different outcome indicators (continued)
Coffee income/ha Coffee production Coffee Yield Labour productivity
Utz-RA-4C 387 * 694.6 *** 1109 *** 7,430 *** (203) (97.52) (105.9) (1290)
FT-Org -606 -740.4 *** -935.5 *** -3,260 *** (370) (138.7) (151.9) (1490)
Education of head 5.47 3.07 -0.601 73.07 (8.42) (4.82) (4.105) (50.844)
Female head -20.6 -72.28 -112.0 1,411
(196) (137.8) (107.1) (1226)
Age of head -0.199 8.35 8.41 -68.31
(16.3) (10.67) (9.01) (103.4)
Age of head2 0.071 -0.043 -0.077 0.744 (149) (0.092) (0.079) (0.939)
Number of adults 38.9 -21.07 1.66 -534.8 *** (36.9) (17.32) (15.84) (203.5)
Number of children 35.5 23.41 9.72 169.3
(34.0) (16.05) (13.11) (190.2)
Total area
Total area2
Coffee area 143 3,725 *** -812.2 *** 7,380 * (389) (414.8) (183.9) (3,829)
Coffee area2 44.9 -7.33 209.7 ** 3792.6173* * (154) (252.9) (82.95) (2255)
Livestock units -36.2 * -7.66 -19.15 * -165.2
(21.4) (10.55) (10.77) (126.5)
Weighted plot slope 7.81 -8.68 * -8.01 * -37.79
(16.0) (4.51) (4.62) (38.49)
Weighted plot altitude 0.325 0.127 0.147 -1.417
(0.383) (0.153) (0.138) (1.68)
Weighted topographic wetness index -57.4 -23.69 -54.8 *** 446.4 * (44.8) (19.66) (18.86) (241.4)
Weighted heat load -107 -116.5 202.6 -7,450 * (1140) (520.6) (517.75) (4438)
Primary school dummy 56.8 161.09 *** 75.96 188.5
(125) (60.09) (52.68) (674.2)
Weekly market dummy -308 ** 6.24 -50.73 -235.0 (128) (68.74) (55.22) (689.2)
Health Centre dummy 58.5 36.98 40.87 -1,340 (197) (115.8) (90.86) (1003)
All season road dummy -263 * -92.06 -62.53 899
(144) (73.9) (65.47) (819)
Distance to trading centre -30.9 ** -12.47 ** -17.38 ** -27.76
(15.1) (6.16) (7.60) (57.51)
Distance to Mbale 42.8 ** 15.04 20.70 ** 324.6 *** (19.7) (11.27) (8.11) (111.7)
Bulambuli district dummy -323 -377.7 -453.9 *** -2,500
(285) (231.6) (136.1) (2062)
Kapchorwa district dummy -499 -300.2 -120.5 -5,450 * (578) (320.6) (207.2) (2969)
Manafa district dummy -801 *** -417.0 ** -843.1 *** -1,610 (255) (171.5) (104.7) (1301)
Sironko district dummy 540 ** 198.8 252.5 ** 6,174 ***
(229) (139.8) (113.1) (1387)
Constant 1,740 *** -207.6 4,245 *** -5,060
(656) (363.2) (355.8) (3760)
N-observations 595 595 595 595
Model Wald Chi2
Wald P-value
Wald Chi2 exog test
Exog Wald P-value
F test joint significance 4.29 125.3 37.78 13.94
P-value 0.00 0.00 0.00 0.00
Hansen J Chi2 statistic 1.156 0.020 0.093 1.93
Hansen J P-value 0.282 0.89 0.76 0.165
Endogeneity Chi2 statistic 8.57 87.48 103.5 34.64
Endogeneity test p-value 0.036 0.00 0.00 0.00
Notes: Standard errors in parentheses; * p < 0.1, ** p < 0.05, *** p < 0.01; For poverty – marginal effects are reported; World Bank International
poverty line = $3.10/day (ppp-2011 = UGX. 2,935.40); In 2014 equivalent to = UGX. 3,473.80 /day & UGX. 1,250,568.00/year.
73
Chapter 4
Do private food standards fulfil their child welfare promises? Coffee
certification and schooling in Uganda
1. Introduction
The proliferation of private food standards in global agri-food value chains in the past two decades
is apparent. Coffee is a good example of such an agri-food value chain. Inherent in private food
standards is information transmission between producers and consumers at opposite ends of global food
supply chains. The information is related to quality and/or safety attributes of food, as well as ethical
and/or environmental aspects of food production, processing and marketing (Henson & Humphrey,
2010; Holzapfel & Wollni, 2014). There is a growing body of empirical literature investigating welfare
impact of private food standards, mostly coffee but findings are mixed (Beghin et al., 2015). Some of
them find positive impact on revenue and income (Bolwig, 2009; Jena & Grote, 2017), prices (Wollni
& Zeller, 2007; Dragussanu et al, 2014) and increased per capita expenditure (Chiputwa et al. 2015;
Akoyi & Maertens, 2017). Others find limited or no impact on producer welfare (Mendez et al, 2010;
Beuchelt & Zeller, 2011; Mitiku et al, 2017; Van Rijsbergen et al, 2016). Few studies go beyond welfare
effects to investigate whether private food standards have positive social impact on smallholder
producers in developing countries or not. For example, Lyon et al (2010) conclude that participation in
a Fairtrade-Organic co-operative in Mesoamerica has a positive impact on women empowerment
through access to organisational network benefits, as well as increased control over management
practices and coffee income by women. Becchetti & Costantino (2008) conclude that participation in
Fairtrade increases food consumption among members of Meru herbs in Kenya. Chiputwa & Qaim
(2016) find a positive indirect impact of coffee certification on calorie and micronutrient consumption
among coffee farmers in Uganda, mainly through higher incomes and improved gender equity.
Yet, an important aspect of the ethical attribute of private coffee standards is enshrined in the
requirement that prohibits child labour, thereby communicating to consumers a child-labour-free
production and marketing process (Baland & Duprez, 2009). With this requirement, private food
standards hope to promote schooling of children of smallholder producers in developing countries, by
reducing their engagement in work on coffee farms. For example: Rainforest alliance, prohibits the
worst forms of child labour according to ILO (Rainforest Alliance, 2017). Likewise, the Utz code of
conduct states no forced labour or child labour and requires participating companies to ensure access
to education for children (Utz-certified (2016). Fairtrade emphasises the child labour requirement most
strongly. Not only does it prohibit forced labour and child labour, it also requires the payment of
Fairtrade premium (social premium) by coffee buying companies in high income countries to Fairtrade
co-operatives or plantation workers, in developing countries. Fairtrade premium is meant to improve
74
the situation of workers, farmers and local communities in health, education, environment and
economy (Fairtrade International, 2017). These promises raise many expectations among consumers in
the face of poor education outcomes which persist in Africa. Although much was achieved by the
Millennium Development Goals (MDGs) in terms of school enrolment, 22% of children of primary
school age in Africa are still out of school and education remains an important goal in the Sustainable
Development Goals – SDG (United Nations, 2017; UNESCO, 2017). Considering the prevalence of the
child labour condition in private food standards, it is important to investigate whether they indeed live
up to these promises.
Several authors have investigated the impact of social labelling on child labour and child schooling
in the carpet manufacturing industry. Some authors find a positive correlation between social labelling
and eradication of child labour as well as increased schooling among households in India and Nepal
(Chakrabarty & Grote, 2009; Chakrabarty et al, 2011). Other authors report opposing findings, that the
impact of the labels reduces remarkably when most households can acquire it because children are
displaced from working in the industry to working at home (Baland & Duprez, 2009). Few studies also
investigate the impact of private food standards in agri-food value chains on welfare outcome of
children, reporting positive effects on child school. For example, among Fairtrade honey producers in
Chile (Becchetti et al, 2013), on secondary schooling among Fairtrade coffee producers in Mexico
(Gitter et al, 2012), on primary child schooling among Fairtrade coffee producers in Nicaragua,
Guatemala and Peru (Arnould et al (2009), on school enrolment in Nicaragua (Bacon et al (2008).
Relevant as the above literature is regarding impact of private food standards on child welfare, they fail
to address similar issues in Africa.
In this chapter, we examine the child schooling impact of private coffee standards for smallholder
producer households in Eastern Uganda. We use cross-sectional household survey data and apply
different econometric techniques to reveal how participation in two different coffee certification
schemes – a double Fairtrade-Organic scheme and a triple Utz-Rainforest-4C – affects children’s
primary school enrolment, secondary school enrolment and their schooling efficiency. All these
standards aim at improving household welfare, a key determinant of child schooling (Lincove, 2009;
Handa, 2004). Of these five coffee standards implemented in two schemes in our study area, all except
organic, prohibit child labour. This condition is based on conventions 138 and 182 of the ILO, which
emphasize the link between schooling and child labour, stating that involving children in work hampers
their education and full development (ILO, 2017). Moreover, some studies (Gitter & Barham, 2007;
Kruger, 2007) confirm that changes in economic opportunities determine labour versus schooling
choices of households. Coffee certification being one such change in economic opportunity, and
multiple certification being on the increase, makes the two schemes in Eastern Uganda an ideal case
study.
75
The remainder of the chapter is organised as follows. In section two, we present a conceptual
discussion of the different pathways through which participation of a household in a coffee certification
scheme can affect child schooling. In section three, we give background information and describe the
research area and data collection process. In section four, we describe the econometric methods and we
present the results in section five. In section six we discuss the results and conclude in section seven.
2. Conceptual discussion
Child schooling refers to the process of school-aged children being taught within institutions,
usually schools, and based on a statutory national curriculum. This definition implies reference to
common content and standards. Besides, there is consensus in literature on the key determinants of child
schooling being accessibility aspects on the supply side and characteristics of households on the demand
side. In order to achieve supply of education, school infrastructure, teachers, and associated school
materials are critical. On the demand side, household income and parents’ education are important
(Lincove, 2009; Handa, 2004). Other authors emphasise however, that other critical factors on the
demand side include, improving child health, child nutrition and reducing the child’s workload, thereby
highlighting the critical relationship between child labour and child schooling (Kremer, 2013; Langsten,
2017). When households are poor, with very low income, and school costs are high, parents will be
inclined to withdraw their children from school. While this may mean engaging children in wage
employment for households living in urban areas (Chakrabarty & Grote, 2009; Chakrabarty et al, 2011),
for those living in rural areas it may mean engaging them in farm work (Admassie, 2003). There is a
large body of literature investigating the impact of government social safety net programs to incentivise
poor households to take their children to school, especially the conditional cash transfers (De Janvry et
al, 2006; Gitter & Barham, 2008). In studying impacts of programs on child schooling therefore, authors
commonly use indicators such as: school entry captured by ever-enrolment or whether a child was
enrolled the previous year; retention or grade attainment; timely enrolment; and timely progress through
education or schooling efficiency (Langsten, 2014; Langsten, 2017). The latter two indicators are
particularly important because both late start and temporary withdrawal of children from school, reduce
their motivation to continue in school (Handa, 2002; Kruger, 2007; Gitter et al, 2012).
In this chapter, we examine the impact of participation of smallholder producers in a coffee
certification scheme in Eastern Uganda, on primary school enrolment, secondary school enrolment and
schooling efficiency of their children. The choice to study the impact of coffee certification on schooling
in the coffee sector in Uganda is pertinent for several reasons. First, child labour through wage
employment in a manufacturing industry is quite different from child labour on parents’ farms in rural
areas. Second, the child labour problem among coffee producers is mainly invisible due to the common
practice of school age children helping on farms of poor households in rural Africa (Admassie, 2003).
Yet, literature using case studies from Africa hardly exist. The few studies which investigate the impact
76
of private food standards on child schooling in agri-food value chains, are all based on case studies from
Latin America. Third, most of the available studies focus on the impact of Fairtrade and yet, it is
important to compare the impact of different combinations of standards on child schooling, given the
increasing multiple certification. Fourth, coffee remains the most important export earner for Uganda
and the government considers it a strategic crop for reducing rural poverty (ITC, 2012) and yet, it is
largely produced by smallholder farmers in rural areas, where poverty is higher than the national
average. In our research area, survey findings show that 65% of the population are below the national
poverty line compared to the national average of 19.7% (UBOS, 2014). The subject of our study, the
schooling impact of private food standards is critical because there is consensus that investment in
education contributes directly to human capital development and is the backbone, both for economic
growth and social development in the long run (Mundial, 2006; Handa et al, 2004).
In the next paragraphs of this section, we discuss the possible mechanisms through which
participation in a coffee certification scheme could influence child schooling. We consider effects
related to our research area, a relatively poor Mount Elgon region where, Fairtrade-Organic certification
is about 14 years old while Utz-Rainforest-4C is relatively new, about 7 years old.
First, coffee certification might influence child schooling positively or negatively, depending on
how it affects income. Previous research in Mount Elgon on the welfare impact of private food standards
reveal that Utz-Rainforest-4C certification increases producers’ coffee and total household incomes,
while Fairtrade-Organic certification reduces both (Akoyi & Maertens, 2017). Some authors highlight
the link between higher income and positive schooling outcomes (Gitter et al, 2012; Arnould et al,
2009), arguing that higher household incomes make it easier for parents to pay school costs whereas
low incomes in rural households are correlated with low parental education, asset poverty, poor
sanitation and poor living standards in general (Handa, 2004; Lincove, 2009). Higher incomes due to
certification may result either from higher prices linked to certification (Mitiku et al, 2017) or from
higher yields from intensification of coffee production (Bacon, 2005; Valkila, 2009).
Second, participation in a coffee certification scheme can increase child schooling through
awareness raising on the reasoning behind the child-labour-free condition. In our research area, the
Fairtrade-Organic implementing company uses the co-operative structure, not only to invest in
awareness raising but also to conduct group trainings and mobilise peer pressure among members for
better internal monitoring, in order to ensure compliance with certification conditions. This is enshrined
in the fifth of the nine cooperative principles adopted by the International Cooperative alliance as a
guideline by which co-operatives put their values in practice. Under this principle, a cooperative is
expected to invest education, training, and information of managers, members and employees, in order
to ensure effective participation of all, for the development of their co-operative (Novkovic & Power,
2005). These awareness raising activities lead to a change in preference for child schooling among the
participating households. Parents, regardless of their level of education, get a better understanding of
77
the child-labour-free condition and attach higher value to education of their children and its long term
human capital benefits to their own families and society as a whole. In addition, the co-operative
structure has also given rise to several Village Savings and Lending Associations (VSLAs), which help
to reduce the negative effects of credit constraints. Credit helps to smoothen household consumption
and reduces the pressure of meeting school material costs (Beegle et al, 2003; Gitter & Barham, 2007).
Third, Fairtrade certification can increase child schooling outcomes due to investment of the social
premium in local communities of producers. The Fairtrade certificate is associated with this important
condition, which requires coffee buyers to pay social (Fairtrade) premium to GCSs for investment in
local social development initiatives. According to survey findings, about 50% of the Fairtrade-Organic
GCSs invested this money directly in education, particularly school renovation, desks and other school
materials. All Fairtrade-Organic respondents indicated that they highly value this condition of Fairtrade.
One way in which investment of the social premium could work to increase child schooling outcome is
by representing an exogenous income transfer to participating households, with which they reduce the
cost of education, usually incurred by parents, in terms of tuition, scholastic materials, transport and
meals (Omoeva & Gale, 2016). By so doing, it leaves households with income space to hire labour, in
case of pressure from coffee production activities. Valkila & Nygren (2010) find improvements in
education, healthcare, local infrastructure and institutional capacity in Nicaragua, thanks to investments
of the Fairtrade premium.
Fourth, participation in a coffee certification scheme can come with increased work load in terms
of more complex coffee agronomic practices and processing techniques, needed to produce high quality
beans. The situation could be worse if certification prohibits labour-saving techniques like the use of
chemical weed-killers, thereby increasing household labour demands and their tendency to engage
children. The practice in the Mount Elgon region, as in many rural areas in SSA, of involving children
to help on the farms would worsen and could have a negative effect on child schooling, since most
smallholder producers rely on family labour. According to survey findings, children are engaged in
what producers refer to as light farm work which include weeding, picking, sorting, fertiliser and
pesticide application in different months in the production season. Coffee producers experience highest
labour pressure around May, for weeding, and between August to November, the peak harvesting
period. In order to ensure high quality Arabica coffee beans, producers need to harvest coffee daily at
the optimum ripeness and wet-process it within 8 hours. At such times, they have only two options,
either to increase children’s working hours on the farms or hire labour. Although survey findings show
that all enrolled school-aged children missed school for several reasons, 47% of these absences for
children in the age-cohort 13-18 years, were due to them helping on coffee farms. Given the labour
intensive nature of production, certification can act as a double-edged sword, serving as an important
source of funding for education on the one hand, and hampering children’s education in cases where it
increases work load, on the other (Kruger, 2007; Gitter and Barham, 2009).

78
Furthermore, producers in the region engage girls, more than boys, consistent with gender division
of labour, according to which most of the light farm work like harvesting, washing and drying of coffee,
is considered women’s (and by implication girls’) activities. Lyon et al (2016) find similar gender
division of labour in coffee production in Mexico. Furthermore, households consider it important to
‘train’ their daughters for their future roles as mothers and wives, in accordance with cultural practices.
All this implies that if certification increases workload, it will reduce child schooling outcomes but
more for girls than for boys.
In summary, coffee certification might affect child schooling through: 1/ an income effect of which
the direction is not clear a priori, 2/ a positive awareness raising effect, 3/ a positive investment effect,
4/ a labour effect, of which the direction is not clear a priori.
3. Background and data collection
3.1 Evolution of school enrolment in Ugandan
Despite the big strides made towards achieving the Millennium Development Goals (MDGs),
Africa still lags behind in all key indicators. In 2015, the region had a projected net primary school
enrolment of 80% compared to 91% for developing regions, Primary School Completion Rate (PSCR)
of about 64% compared to 84% for developing regions and literacy rate among youth (15-24 years)
stood at 71% compared to 89% world-wide (United Nations, 2015). According to the World Bank
(2017), the adjusted net primary school enrolment for Uganda in 2014 was 95% for girls and 92% for
boys, far higher than 77% and 81%, respectively, for sub-Saharan Africa. Uganda is fortunate to have
high net primary school enrolment rates and to have achieved gender parity but education quality
declined in the past decade and challenges remain in education. Social services in Uganda, especially
health and education suffered enormously, due to economic mismanagement, political unrest and
liberalisation which led to cost sharing in social service delivery (Oketch et al, 2010; Muyinda &
Mugisha, 2015). The rolling back of government from education service provision had important
negative effects on education quality, mainly due to lack of corresponding investment in teacher training
and recruitment (Deininger, 2003). Ugandans were compelled to complement government efforts by
privately investing in education, estimated at about 50% of total education expenditure. In addition,
majority of Ugandans engage in various initiatives to improve education quality (MoESTS, 2017; Penny
et al, 2008).
Although in 1992 the government responded to the dire situation by initiating a Universal Primary
Education (UPE) program, it was not until five years later that political commitment, donor and
institutional good will in terms of budget support, all converged to push forward the full implementation
of the UPE (Magona, 2010; Ward et al, 2006). Under the UPE, government removed tuition fees for
primary education and invested heavily in school infrastructure, as well as school materials, generally
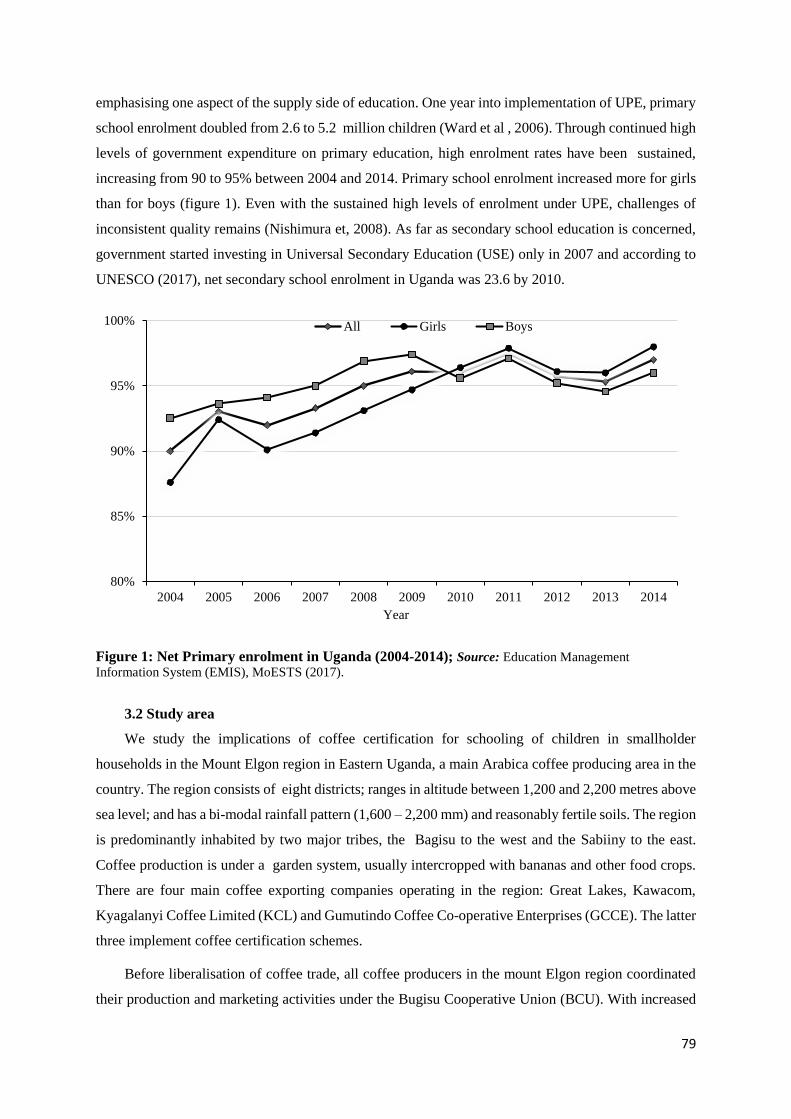
79
emphasising one aspect of the supply side of education. One year into implementation of UPE, primary
school enrolment doubled from 2.6 to 5.2 million children (Ward et al , 2006). Through continued high
levels of government expenditure on primary education, high enrolment rates have been sustained,
increasing from 90 to 95% between 2004 and 2014. Primary school enrolment increased more for girls
than for boys (figure 1). Even with the sustained high levels of enrolment under UPE, challenges of
inconsistent quality remains (Nishimura et, 2008). As far as secondary school education is concerned,
government started investing in Universal Secondary Education (USE) only in 2007 and according to
UNESCO (2017), net secondary school enrolment in Uganda was 23.6 by 2010.
Figure 1: Net Primary enrolment in Uganda (2004-2014); Source: Education Management
Information System (EMIS), MoESTS (2017).
3.2 Study area
We study the implications of coffee certification for schooling of children in smallholder
households in the Mount Elgon region in Eastern Uganda, a main Arabica coffee producing area in the
country. The region consists of eight districts; ranges in altitude between 1,200 and 2,200 metres above
sea level; and has a bi-modal rainfall pattern (1,600 – 2,200 mm) and reasonably fertile soils. The region
is predominantly inhabited by two major tribes, the Bagisu to the west and the Sabiiny to the east.
Coffee production is under a garden system, usually intercropped with bananas and other food crops.
There are four main coffee exporting companies operating in the region: Great Lakes, Kawacom,
Kyagalanyi Coffee Limited (KCL) and Gumutindo Coffee Co-operative Enterprises (GCCE). The latter
three implement coffee certification schemes.
Before liberalisation of coffee trade, all coffee producers in the mount Elgon region coordinated
their production and marketing activities under the Bugisu Cooperative Union (BCU). With increased
80%
85%
90%
95%
100%
2004 2005 2006 2007 2008 2009 2010 2011 2012 2013 2014
Year
All Girls Boys
80
competition after liberalisation, BCU faced problems and collapsed in 1997 and many other private
players entered the coffee sector. GCCE was founded on BCU remains, by grouping its four best
performing Growers’ Co-operative Societies (GCSs). Since its establishment in 2000, GCCE started
implementing Fairtrade and later, a double Fairtrade-Organic certification scheme. GCCE runs a
cooperative business model, through a network of GCSs across the region. KCL is one of the oldest
private coffee export company in Uganda, founded in 1992. In Mount Elgon region, KCL implements
a triple Utz-Rainforest-4C coffee certification program since 2006. KCL’s business model is centred
around the company’s coffee washing stations and contract-farming arrangement with Producer
Organisations (POs) at village level. Currently, KCL has six washing stations across the region, all
established close to rivers in order to guarantee access to water for coffee washing. The company selects
interested farmers within a 12.5 km radius from the washing stations and organises them into POs.
Independent coffee farmers and cooperatives also operate in the Mount Elgon region. They sell coffee
to traders and agents of the four companies through spot market transactions, either individually or
through their coffee cooperatives or producer organisations.
3.3 Data collection
We use original cross-sectional household survey data from the Mount Elgon region, in eastern
Uganda. Our study focusses on households supplying coffee to KCL and GCCE. We use data, collected
in 2014, using a multi-stage stratified random sampling design. In the first stage, the five most intensive
coffee growing districts were purposively selected namely, Bududa, Manafwa, Bulabmbuli, Kapchorwa
and Sironko. The final sample includes 600 coffee producing farm-households from 60 villages in 21
sub-counties and five districts, of which 170 are Fairtrade-Organic certified, 130 are Utz-Rainforest-4C
certified and 300 are not certified. The analysis in this paper is based on data from 509 households, after
dropping five farmers in the sample who did not harvest coffee because their coffee shrubs were too
young to be productive and 81 farmers who did not have children of school age. Together, the remaining
households have 1694 children between the age of 6 and 18 years, 871 girls and 823 boys.
We used a quantitative structured questionnaire. It includes separate modules on household
demographics, land and non-land assets, coffee production and marketing, income from other crops,
off-farm activities and other income. This data allow the calculation of net income from various sources,
as well as total household income. Of specific importance for the analysis in this chapter, we gathered
detailed information on child schooling at individual child level for all children between age six and 18.
This includes age of child, school attendance the previous year, intelligence as perceived by household
head, frequency of absence from school and reasons why. The household survey data was
complemented by data from a village survey, implemented in all 60 sampled villages, using a structured
questionnaire and face-to-face interviews with a small group of village leaders. Furthermore, semi-
structured interviews were carried out with 45 stakeholders in the coffee sector, including exporters,
processors, traders, co-operative marketing managers and service providers.
81
4. Econometric methods
To assess the impact of a household’s participation in certification on schooling of their children,
we first apply a linear probability technique, followed by a Difference-in-Difference method (DD). For
all our models, we start with a reduced form equation of the following type:
Si = β0 + β1Ci + β2Xi + µ1 (1)
Where Si, is estimated in different regressions, as one of the following schooling indicators: 1/ primary
school enrolment, measured as a dummy equal to one if a child of age cohort 6-12 was enrolled in a
primary school grade (P1-P7), the previous year and zero otherwise; 2/ secondary school enrolment,
measured as a dummy equal to one if a child of age cohort 13-18 was enrolled in a secondary school
grade (S1-S6), the previous year and zero otherwise; 3/ primary schooling efficiency for the age cohort
6-12; 4/ secondary schooling efficiency for the age cohort 13-18. Schooling efficiency is measured by
a proxy variable, school gap for children, which is the ratio of the child’s current grade to the child’s
expected grade, had s/he started school at the right age and gone through school without repeating.
Our main explanatory variable of interest, Ci, is a vector of dummy variables indicating the
participation of a household either in the Fairtrade-Organic (FT-Org) or Utz-Rainforest-4C (Utz-RA-
4C) coffee certification schemes. By implication, the two certification dummies are mutually exclusive
since producers hold coffee production contracts with only one certification company at a time. In the
regression, we control for possible selection bias from observed heterogeneity, by including a large set
of observable characteristics. The vector of control variables Xi includes characteristics of the child
(age, sex, rank, intelligence, whether child belongs to household, number of sisters and number of
brothers); the household (tribe, religion, number of male and female workers, age of head, whether
head is female, education of head, education of mother, land cultivated, livestock units, and asset
poverty) and; village institutions and accessibility (whether village has primary school, secondary
school, health centre, an all-weather road and distance to Mbale town – the regional capital).
Infrastructure variables are derived from village interviews and distance variables from a combination
of GPS information gathered during the survey and available GIS Digital Elevation Model (DEM)
information on Uganda4. In the first instance, we run a set of regressions using probit model estimation
for the first two binary schooling indicators, and a tobit estimation for last two indicators that are
censored. For each of the schooling indicators, we run gender dis-aggregated models for boys and girls.
In order to check further for potential selection bias due to observed and unobserved heterogeneity
and test the robustness of our results, we apply the Difference-in-Difference (DD) method on all
outcome indicators. Using available information in our dataset regarding the year when a household
4 DEM was based on void filled Shuttle Radar Topography Mission (SRTM) data at a resolution of 1 arc-second
(USGS, 2015)
82
was first certified, the year when a household first joined a co-operative and the year when a child first
enrolled in school, we construct counterfactual groups of both certified and non-certified households
before certification or before joining a co-operative. We group households with children of the same
age-cohort for the survey year (2014) and before certification started in 2000. The year 2000 is chosen
as the cut off year, because it is the year when the first coffee standard was implemented in the region.
To construct child schooling data for the period before certification, we calculate the difference between
the child’s age in 2014 and the number of years the household has been in certification since households
join coffee certification schemes at different points in time. For Fairtrade-Organic cooperatives,
certification started in 2000, while for Utz-Rainforest-4C, it started in 2007. For non-certified
households, we use the number of years the household has been in the non-certified coffee co-operative.
We then create schooling dummy indicators equal to one if the difference is between child’s age in 2014
and the number of years the household has been in certification is positive and zero otherwise. Based
on this procedure, we are able to construct child data for two groups of producers before certification
in the year 2000, one certified and one non-certified. When we combine these with data from the two
groups of certified and non-certified households in the survey year in 2014, we end up with four groups
of households with four categories of child data.
By calculating the mean of the difference between schooling indicators after and before
certification (year 2000) for certified and non-certified households, we estimate the effects of
certification (Khandker et al., 2010), according to equation (2a) of the following type:
𝐷𝐷 = 𝐸(𝑌1𝑇 − 𝑌0
𝑇|𝑇1 = 1) − 𝐸(𝑌1𝐶 − 𝑌0
𝐶|𝑇1 = 0) (2a)
Where, 𝑇1 = 1 indicates our treatment which is certification, in 2014: 𝑇1 = 0 indicates the absence of
certification before 2000. 𝑌1𝑇 and 𝑌1
𝐶 are the respective schooling outcome indicators for children of
certified and non-certified households after 2000 while 𝑌0𝑇 and 𝑌0
𝐶 are the respective schooling outcome
indicators for children of certified and non-certified households before 2000. The DD estimator enables
us to calculate the unobserved difference in means of the counterfactual outcome indicators between
certified and non-certified households, itself a source of selection bias. A very critical assumption in
the DD method, similar to that of fixed effects model and panel analysis is the parallel trend assumption,
that unobserved characteristics influencing selection into the program are time invariant. We construct
four categories of certified and non-certified households that have children in the age-cohort 6-18 years
before and after certification in the year 2000. We calculate the age of child before certification in 2000,
as age of child in 2014 minus duration of certification. The age of child after certification is the age in
2014.
We repeat the same procedure for schooling efficiency before and after certification in the year
2000. For this paper, we specify and estimate the following model:
83
𝑌𝑖ℎ𝑡 = 𝛼 + 𝜑𝑇𝑖1𝑡 + 𝜎𝑇𝑖1 + 𝜏𝑡 + 𝛽𝑋𝑗 + 𝜌𝐾ℎ𝑗 + 𝜐𝑖ℎ𝑡 2b)
Where, the coefficient 𝜑 of the interaction term between the post-certification variable (𝑇𝑖1) and time
(t = 0 for 2000 and t = 1 for 2014), yields the average DD effect of certification on the various schooling
indicators. By including the variables 𝑇𝑖1 and t separately, we are able to capture any other mean effects
of time and also the effect of being targeted or not, through coefficients 𝜎 and 𝜏, respectively. This helps
to limit the possible confounding effects of certification and time. We control for a large set of
observable time-varying and time-invariant pre-treatment characteristics including household and
village level characteristics 𝑋𝑗 and child characteristics 𝐾ℎ𝑗 , that might be correlated with child
schooling. The advantage of DD method is that it relaxes the condition of selection based on observed
characteristics. A drawback however, can be the influence of shocks before the program starts, for
instance, the so called ‘coffee crisis’, which may be a typical situation of Ashenfelter’s Dip. This would
imply that certified households might have experienced better schooling outcomes even if they were
not certified, in which case our DD estimates could be over-estimated. This is clearly not the case since
certification in the area started 5 years after the coffee crisis. We make probit and tobit estimations for
the full sample of children (N=1694) but in DD estimations the total number of children reduces
remarkably (N=1390), due to differencing out of the certification duration from the age of children. For
all the models, we estimate effects of coffee certification on girls and boys separately, within an age
group. Although we cannot claim to have dealt with all biases, we increase the robustness of our results
by separately controlling for treatment, Ti1 and time, t into our models, thereby limiting the confounding
effects of the two variables, treatment and time (tables A4 and A5).
5. Results
5.1 Household characteristics
In table 1, we present summary statistics on children, households and village infrastructure
characteristics, across certified and non-certified households. Overall, households in the sample are
male headed (91%); household heads’ average age and years of schooling is 49 and 8.3 years,
respectively; mothers’ education is rather low with only 5.6 years of schooling. Most heads are of the
Bagisu tribe (88%) and are mostly Christian (88%) while the rest (12%) are Muslim. The number of
adult workers living in the household (age 15-63 years) is quite large, 4 on average. Land cultivated is
1.1 ha on average, livestock ownership is 2.14 on average, 47% of the households are asset poor and
total household income is low, UGX 4 million on average. Households are rather large, with 4. 6
children on average; with 1.9 sisters and 1.8 brothers; and 71% of them are of average intelligence
according to parents’ perceptions. Average age school-aged children (6-18 years) 12 years; most of
them (84%) belong to the household.
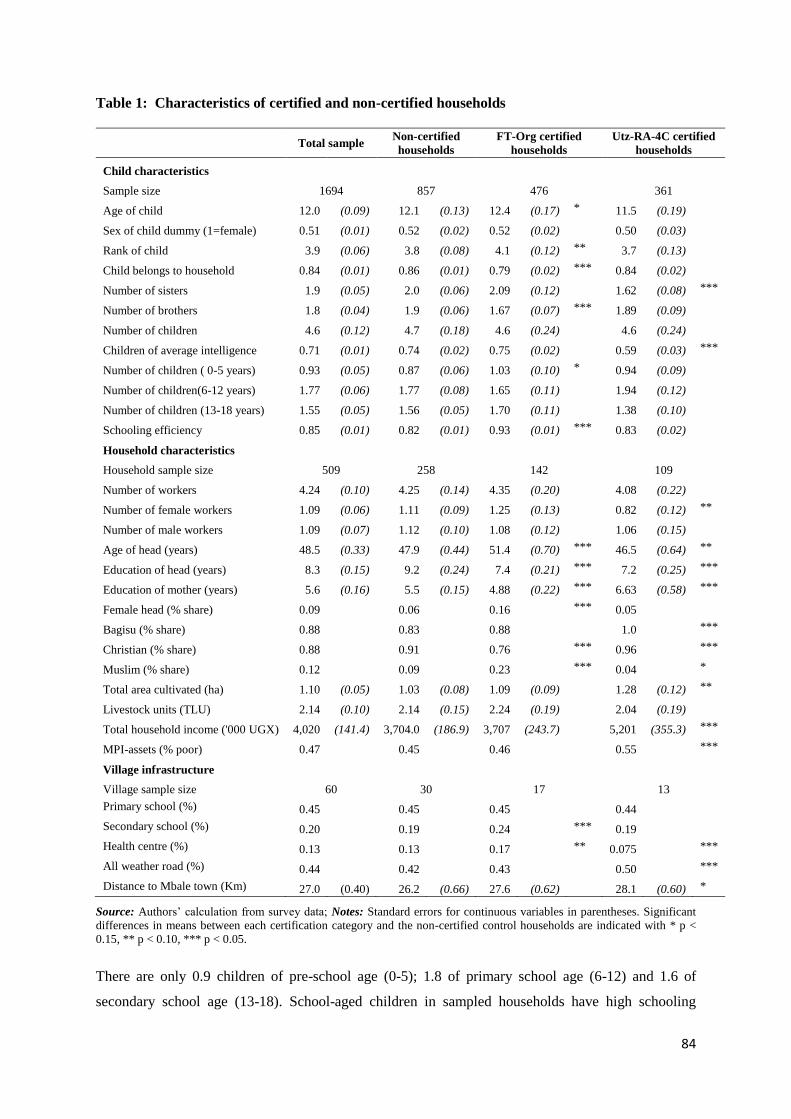
84
Table 1: Characteristics of certified and non-certified households
Total sample Non-certified
households
FT-Org certified
households
Utz-RA-4C certified
households
Child characteristics
Sample size 1694 857 476 361
Age of child 12.0 (0.09) 12.1 (0.13) 12.4 (0.17) * 11.5 (0.19)
Sex of child dummy (1=female) 0.51 (0.01) 0.52 (0.02) 0.52 (0.02)
0.50 (0.03)
Rank of child 3.9 (0.06) 3.8 (0.08) 4.1 (0.12) ** 3.7 (0.13)
Child belongs to household 0.84 (0.01) 0.86 (0.01) 0.79 (0.02) *** 0.84 (0.02)
Number of sisters 1.9 (0.05) 2.0 (0.06) 2.09 (0.12)
1.62 (0.08) ***
Number of brothers 1.8 (0.04) 1.9 (0.06) 1.67 (0.07) *** 1.89 (0.09)
Number of children 4.6 (0.12) 4.7 (0.18) 4.6 (0.24)
4.6 (0.24)
Children of average intelligence 0.71 (0.01) 0.74 (0.02) 0.75 (0.02)
0.59 (0.03) ***
Number of children ( 0-5 years) 0.93 (0.05) 0.87 (0.06) 1.03 (0.10) * 0.94 (0.09)
Number of children(6-12 years) 1.77 (0.06) 1.77 (0.08) 1.65 (0.11)
1.94 (0.12)
Number of children (13-18 years) 1.55 (0.05) 1.56 (0.05) 1.70 (0.11)
1.38 (0.10)
Schooling efficiency 0.85 (0.01) 0.82 (0.01) 0.93 (0.01) *** 0.83 (0.02)
Household characteristics
Household sample size 509 258 142 109
Number of workers 4.24 (0.10) 4.25 (0.14) 4.35 (0.20)
4.08 (0.22)
Number of female workers 1.09 (0.06) 1.11 (0.09) 1.25 (0.13)
0.82 (0.12) **
Number of male workers 1.09 (0.07) 1.12 (0.10) 1.08 (0.12)
1.06 (0.15)
Age of head (years) 48.5 (0.33) 47.9 (0.44) 51.4 (0.70) *** 46.5 (0.64) **
Education of head (years) 8.3 (0.15) 9.2 (0.24) 7.4 (0.21) *** 7.2 (0.25) ***
Education of mother (years) 5.6 (0.16) 5.5 (0.15) 4.88 (0.22) *** 6.63 (0.58) ***
Female head (% share) 0.09 0.06 0.16 *** 0.05
Bagisu (% share) 0.88 0.83 0.88
1.0 ***
Christian (% share) 0.88 0.91 0.76 *** 0.96
***
Muslim (% share) 0.12 0.09 0.23 *** 0.04
*
Total area cultivated (ha) 1.10 (0.05) 1.03 (0.08) 1.09 (0.09)
1.28 (0.12) **
Livestock units (TLU) 2.14 (0.10) 2.14 (0.15) 2.24 (0.19) 2.04 (0.19)
Total household income ('000 UGX) 4,020 (141.4) 3,704.0 (186.9) 3,707 (243.7) 5,201 (355.3) ***
MPI-assets (% poor) 0.47 0.45 0.46 0.55 ***
Village infrastructure
Village sample size 60 30 17 13
Primary school (%) 0.45 0.45 0.45 0.44
Secondary school (%) 0.20 0.19 0.24 *** 0.19
Health centre (%) 0.13 0.13 0.17 ** 0.075
***
All weather road (%) 0.44 0.42 0.43
0.50 ***
Distance to Mbale town (Km) 27.0 (0.40) 26.2 (0.66) 27.6 (0.62) 28.1 (0.60) *
Source: Authors’ calculation from survey data; Notes: Standard errors for continuous variables in parentheses. Significant
differences in means between each certification category and the non-certified control households are indicated with * p <
0.15, ** p < 0.10, *** p < 0.05.
There are only 0.9 children of pre-school age (0-5); 1.8 of primary school age (6-12) and 1.6 of
secondary school age (13-18). School-aged children in sampled households have high schooling
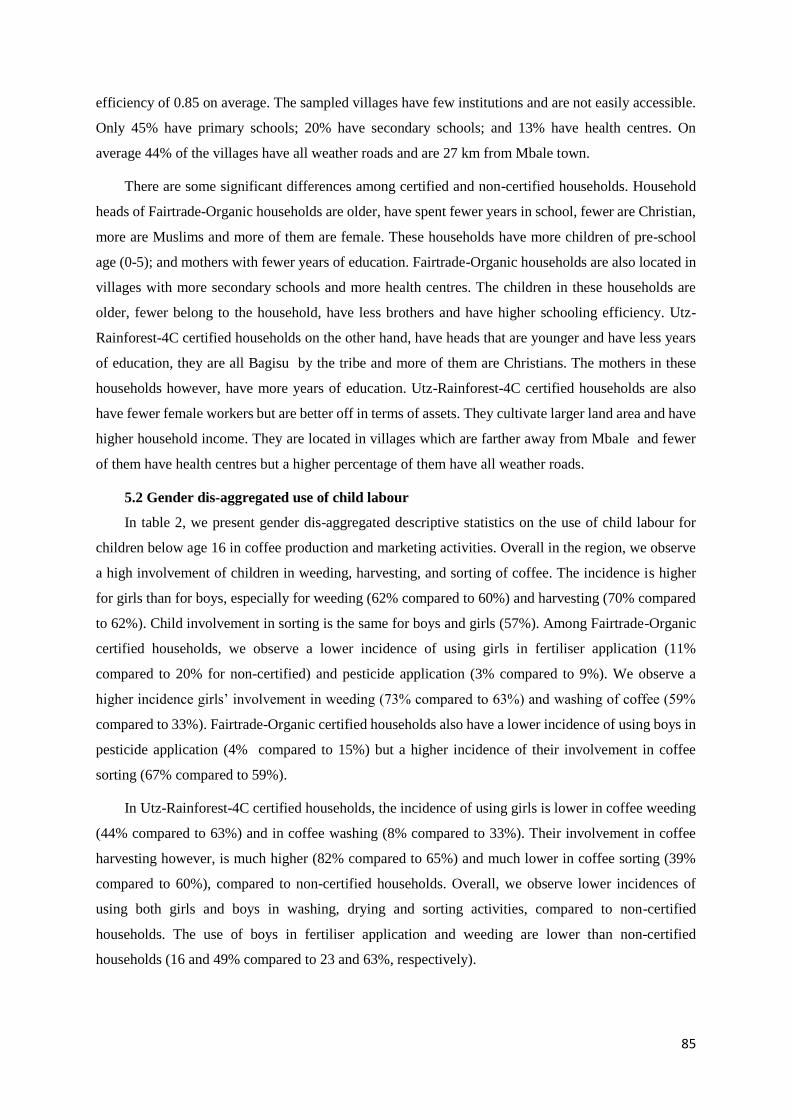
85
efficiency of 0.85 on average. The sampled villages have few institutions and are not easily accessible.
Only 45% have primary schools; 20% have secondary schools; and 13% have health centres. On
average 44% of the villages have all weather roads and are 27 km from Mbale town.
There are some significant differences among certified and non-certified households. Household
heads of Fairtrade-Organic households are older, have spent fewer years in school, fewer are Christian,
more are Muslims and more of them are female. These households have more children of pre-school
age (0-5); and mothers with fewer years of education. Fairtrade-Organic households are also located in
villages with more secondary schools and more health centres. The children in these households are
older, fewer belong to the household, have less brothers and have higher schooling efficiency. Utz-
Rainforest-4C certified households on the other hand, have heads that are younger and have less years
of education, they are all Bagisu by the tribe and more of them are Christians. The mothers in these
households however, have more years of education. Utz-Rainforest-4C certified households are also
have fewer female workers but are better off in terms of assets. They cultivate larger land area and have
higher household income. They are located in villages which are farther away from Mbale and fewer
of them have health centres but a higher percentage of them have all weather roads.
5.2 Gender dis-aggregated use of child labour
In table 2, we present gender dis-aggregated descriptive statistics on the use of child labour for
children below age 16 in coffee production and marketing activities. Overall in the region, we observe
a high involvement of children in weeding, harvesting, and sorting of coffee. The incidence is higher
for girls than for boys, especially for weeding (62% compared to 60%) and harvesting (70% compared
to 62%). Child involvement in sorting is the same for boys and girls (57%). Among Fairtrade-Organic
certified households, we observe a lower incidence of using girls in fertiliser application (11%
compared to 20% for non-certified) and pesticide application (3% compared to 9%). We observe a
higher incidence girls’ involvement in weeding (73% compared to 63%) and washing of coffee (59%
compared to 33%). Fairtrade-Organic certified households also have a lower incidence of using boys in
pesticide application (4% compared to 15%) but a higher incidence of their involvement in coffee
sorting (67% compared to 59%).
In Utz-Rainforest-4C certified households, the incidence of using girls is lower in coffee weeding
(44% compared to 63%) and in coffee washing (8% compared to 33%). Their involvement in coffee
harvesting however, is much higher (82% compared to 65%) and much lower in coffee sorting (39%
compared to 60%), compared to non-certified households. Overall, we observe lower incidences of
using both girls and boys in washing, drying and sorting activities, compared to non-certified
households. The use of boys in fertiliser application and weeding are lower than non-certified
households (16 and 49% compared to 23 and 63%, respectively).
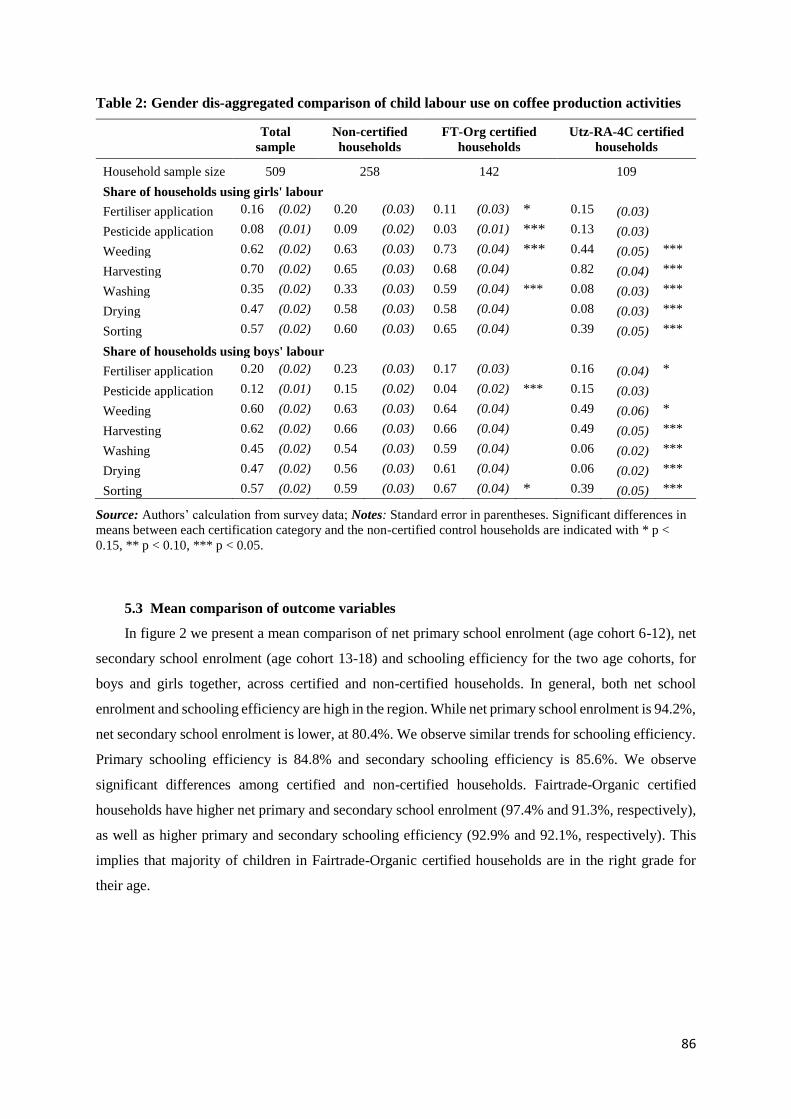
86
Table 2: Gender dis-aggregated comparison of child labour use on coffee production activities
Total
sample
Non-certified
households
FT-Org certified
households
Utz-RA-4C certified
households
Household sample size 509 258 142 109
Share of households using girls' labour
Fertiliser application 0.16 (0.02) 0.20 (0.03) 0.11 (0.03) * 0.15 (0.03)
Pesticide application 0.08 (0.01) 0.09 (0.02) 0.03 (0.01) *** 0.13 (0.03)
Weeding 0.62 (0.02) 0.63 (0.03) 0.73 (0.04) *** 0.44 (0.05) ***
Harvesting 0.70 (0.02) 0.65 (0.03) 0.68 (0.04) 0.82 (0.04) ***
Washing 0.35 (0.02) 0.33 (0.03) 0.59 (0.04) *** 0.08 (0.03) ***
Drying 0.47 (0.02) 0.58 (0.03) 0.58 (0.04) 0.08 (0.03) ***
Sorting 0.57 (0.02) 0.60 (0.03) 0.65 (0.04) 0.39 (0.05) ***
Share of households using boys' labour
Fertiliser application 0.20 (0.02) 0.23 (0.03) 0.17 (0.03) 0.16 (0.04) *
Pesticide application 0.12 (0.01) 0.15 (0.02) 0.04 (0.02) *** 0.15 (0.03)
Weeding 0.60 (0.02) 0.63 (0.03) 0.64 (0.04) 0.49 (0.06) *
Harvesting 0.62 (0.02) 0.66 (0.03) 0.66 (0.04) 0.49 (0.05) ***
Washing 0.45 (0.02) 0.54 (0.03) 0.59 (0.04) 0.06 (0.02) ***
Drying 0.47 (0.02) 0.56 (0.03) 0.61 (0.04) 0.06 (0.02) ***
Sorting 0.57 (0.02) 0.59 (0.03) 0.67 (0.04) * 0.39 (0.05) ***
Source: Authors’ calculation from survey data; Notes: Standard error in parentheses. Significant differences in
means between each certification category and the non-certified control households are indicated with * p <
0.15, ** p < 0.10, *** p < 0.05.
5.3 Mean comparison of outcome variables
In figure 2 we present a mean comparison of net primary school enrolment (age cohort 6-12), net
secondary school enrolment (age cohort 13-18) and schooling efficiency for the two age cohorts, for
boys and girls together, across certified and non-certified households. In general, both net school
enrolment and schooling efficiency are high in the region. While net primary school enrolment is 94.2%,
net secondary school enrolment is lower, at 80.4%. We observe similar trends for schooling efficiency.
Primary schooling efficiency is 84.8% and secondary schooling efficiency is 85.6%. We observe
significant differences among certified and non-certified households. Fairtrade-Organic certified
households have higher net primary and secondary school enrolment (97.4% and 91.3%, respectively),
as well as higher primary and secondary schooling efficiency (92.9% and 92.1%, respectively). This
implies that majority of children in Fairtrade-Organic certified households are in the right grade for
their age.
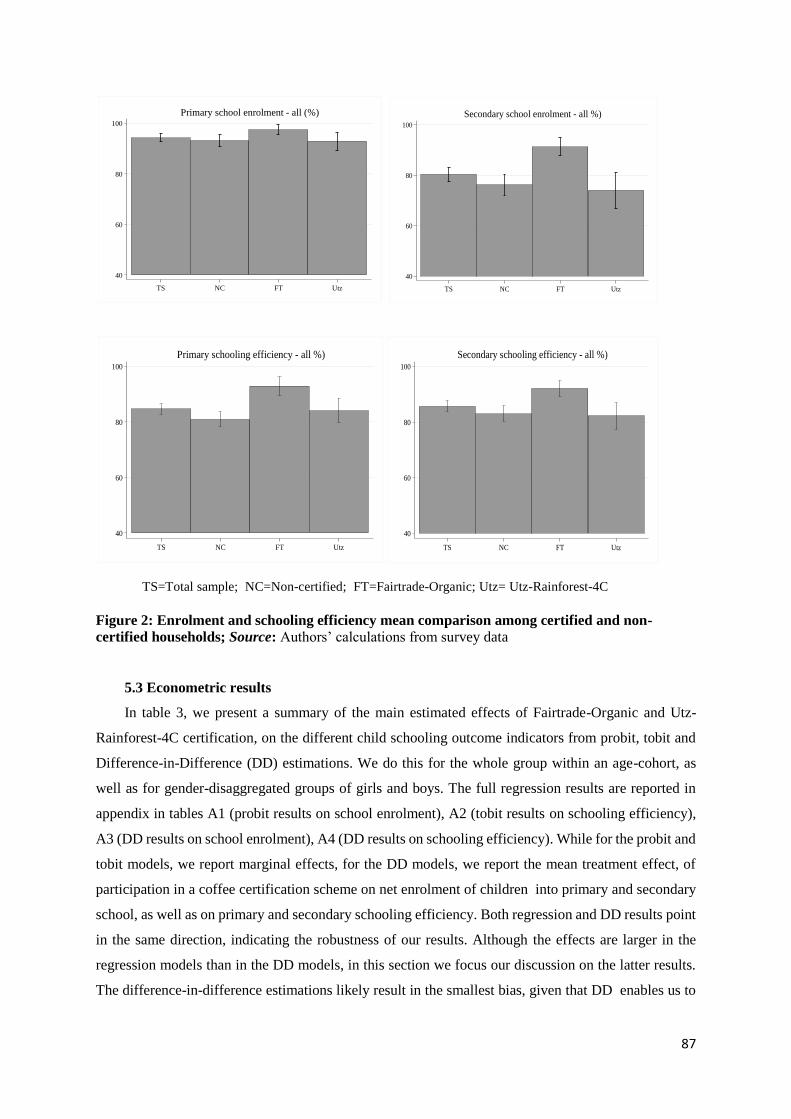
87
Figure 2: Enrolment and schooling efficiency mean comparison among certified and non-
certified households; Source: Authors’ calculations from survey data
5.3 Econometric results
In table 3, we present a summary of the main estimated effects of Fairtrade-Organic and Utz-
Rainforest-4C certification, on the different child schooling outcome indicators from probit, tobit and
Difference-in-Difference (DD) estimations. We do this for the whole group within an age-cohort, as
well as for gender-disaggregated groups of girls and boys. The full regression results are reported in
appendix in tables A1 (probit results on school enrolment), A2 (tobit results on schooling efficiency),
A3 (DD results on school enrolment), A4 (DD results on schooling efficiency). While for the probit and
tobit models, we report marginal effects, for the DD models, we report the mean treatment effect, of
participation in a coffee certification scheme on net enrolment of children into primary and secondary
school, as well as on primary and secondary schooling efficiency. Both regression and DD results point
in the same direction, indicating the robustness of our results. Although the effects are larger in the
regression models than in the DD models, in this section we focus our discussion on the latter results.
The difference-in-difference estimations likely result in the smallest bias, given that DD enables us to
40
60
80
100
TS NC FT Utz
Primary school enrolment - all (%)
40
60
80
100
TS NC FT Utz
Secondary school enrolment - all %)
40
60
80
100
TS NC FT Utz
Primary schooling efficiency - all %)
40
60
80
100
TS NC FT Utz
Secondary schooling efficiency - all %)
TS=Total sample; NC=Non-certified; FT=Fairtrade-Organic; Utz= Utz-Rainforest-4C
certified

88
create four different groups of the certified and non-certified, before and after the treatment, thereby
allowing us to account for both observed and unobserved heterogeneity. Furthermore, models which
include total household income yield similar results, implying that income has little influence on the
effects. We therefore focus our discussion on effects estimated from models excluding total household
income.
Table 3: Summary of estimated effects of certification on child schooling
Total household income excluded Total household income included
FT-Org certified Utz-RA-4C certified FT-Org certified Utz-RA-4C certified
Probit/Tobit OLS_DD Probit/Tobit OLS_DD Probit/Tobit OLS_DD Probit/Tobit OLS_DD
PS enrolment (total) 0.430 *** 0.040 ** -0.120 -0.014 0.397 *** 0.036 ** -0.197 -0.023
(0.126) (0.016) (0.191) (0.024) (0.125) (0.016) (0.190) (0.024)
PS enrolment (boys) 0.576 *** 0.060 ** -0.208 -0.015 0.498 *** 0.052 ** -0.337 -0.030
(0.193) (0.025) (0.297) (0.038) (0.188) (0.025) (0.297) (0.038)
PS enrolment (girls) 0.329 * 0.016 -0.126 -0.013 0.321 * 0.014 -0.151 -0.020
(0.177) (0.021) (0.264) (0.030) (0.177) (0.021) (0.263) (0.030)
SS enrolment (total) 0.648 *** 0.154 *** -0.261 -0.047 0.650 *** 0.155 *** -0.246 -0.043
(0.143) (0.031) (0.162) (0.044) (0.144) (0.031) (0.168) (0.045)
SS enrolment (boys) 0.684 *** 0.134 *** -0.297 -0.059 0.754 *** 0.140 *** -0.164 -0.033
(0.233) (0.042) (0.226) (0.056) (0.243) (0.042) (0.242) (0.058)
SS enrolment (girls) 0.758 *** 0.200 *** -0.238 -0.0302 0.762 *** 0.197 *** -0.333 -0.059
(0.202) (0.049) (0.237) (0.069) (0.203) (0.049) (0.246) (0.070)
PS efficiency (total) 0.123 *** 0.125 *** 0.013 0.017 0.115 *** 0.115 *** -0.005 -0.0061
(0.025) (0.025) (0.030) (0.028) (0.024) (0.025) (0.030) (0.028)
PS efficiency (boys) 0.136 *** 0.144 *** 0.005 0.044 0.125 *** 0.129 *** -0.016 0.018
(0.034) (0.035) (0.048) (0.045) (0.034 (0.035) (0.048) (0.045)
PS efficiency (girls) 0.100 *** 0.100 *** 0.0005 -0.0039 0.096 *** 0.095 ** -0.0154 -0.022
(0.037) (0.038) (0.038) (0.037) (0.036) (0.037) (0.037) (0.037)
SS efficiency (total) 0.097 *** 0.096 *** -0.038 -0.029 0.097 *** 0.097 *** -0.041 -0.025
(0.023) (0.022) (0.034) (0.031) (0.024) (0.022) (0.036) (0.033)
SS efficiency (boys) 0.089 *** 0.084 *** -0.022 -0.018 0.092 *** 0.088 *** -0.011 -0.0004
(0.031) (0.029) (0.035) (0.033) (0.031) (0.030) (0.038) (0.036)
SS efficiency (girls) 0.124 *** 0.131 *** -0.061 -0.037 0.121 *** 0.130 *** -0.080 -0.051
(0.038) (0.035) (0.059) (0.055) (0.038) (0.035) (0.060) (0.055)
Source: Authors’ estimation from survey data; Notes: For probit and tobit models marginal effects are reported; standard error in parentheses; significant differences between each certification category and non-certified households are indicated with * p < 0.10, ** p < 0.05, *** p <
0.01; PS=Primary School; SS=Secondary School
Our results indicate that participation in the Fairtrade-Organic certification scheme increases both
school enrolment and schooling efficiency. Net primary school enrolment rate increases by 4% for the
whole group in the age cohort (6-12 years) and by 6% for boys. Participation in the Fairtrade-Organic
certification scheme has a higher impact at secondary level, increasing net enrolment rate by 15.4% for
the whole group, by 13.4% for boys and by 20% for girls, in the age-cohort (13-18 years). Participation
in the Fairtrade-Organic certification scheme increases primary schooling efficiency by 12.5 percentage
points and the effect is higher for boys (14.4%) than for girls (10%). It also increases secondary
schooling efficiency by 9.6 percentage points, with higher effects for girls (13.1%) than for boys (8.4%).
While effects are larger for boys in the age cohort (6-12 years) than for girls, the reverse is true for age
cohort (13-18 years). All effects on children of the Fairtrade-Organic certified producers, except for
primary school enrolment are significant at 1% level. These effects, especially at secondary school level
are large, given that net secondary school enrolment in the study area is only 84%. We find that
participation in the Utz-Rainforest-4C coffee certification scheme on the other hand, has no impact on
89
either net school enrolment or schooling efficiency for whole groups within an age-cohort, as well as
for girls and boys separately.
Other factors also influence the probability of a child to be enrolled in school as shown in the full
regressions in (tables A3 and A4). First, the child characteristics, particularly the age of the child is
important for school enrolment but not for schooling efficiency. We find a quadratic relationship
between age of child and school enrolment. It is positive but in a decreasing way, as a child grows older.
This is expected, given delays in enrolment, common in rural areas in Uganda. The rank of a child in a
household is another child characteristic of importance. The higher the rank of a child in a household
the lower the likelihood to be enrolled in secondary school and the lower the schooling efficiency at
primary level and among boys of primary and secondary school age. This could be linked to resource
limitations which arise as more siblings are borne. The number of sisters increases the likelihood of a
child to be enrolled in secondary school enrolment and the secondary schooling efficiency. The number
of brothers on the other hand, has a positive relationship with total primary school enrolment and the
school enrolment for boys.
Second, household characteristics do matter, most important being the mother’s education which
positively affects both total primary and secondary school enrolment, as well as secondary schooling
efficiency. The level of education of a household head (91% of whom are fathers) has a positive
relationship with primary school enrolment of boys, their schooling efficiency at both levels, as well as
the schooling efficiency of all children at secondary level. Mothers’ education is critical as well, for
both primary and secondary school enrolment and for secondary schooling efficiency. Educated parents,
especially mothers attach higher value to education of their children (Handa, 2002; Langsten, 2014).
The age of household head also has a positive relationship with total secondary school enrolment, as
well as with schooling efficiency at primary and secondary school levels, except for girls. We also find
that while the number of male workers in a household has a positive relationship with total and boys’
primary school enrolment, the number of female workers positively impacts on total and boys’
schooling efficiency. Being a Muslim negatively affects girls’ primary enrolment and boys’ secondary
school enrolment. Asset poverty in a household negatively affects schooling efficiency for all children
at primary level and affects schooling efficiency of girls at both levels. Thirdly, as far as village
infrastructure is concerned, having an all-weather road in the village positively affects primary school
enrolment. Surprisingly, the presence of key village institutions namely primary school, secondary
school and health centres, negatively influence the likelihood to be enrolled in school, as well as
schooling efficiency. This is opposite to the expected negative influence. This could be due to the very
poor quality of these institutions in rural areas of Mount Elgon and the fact that they are mainly located
in poorer villages especially during political campaigns. After they are established most of them do not
receive institutional support.
90
6. Discussion
Our results imply that participation in the Fairtrade-Organic coffee certification scheme increases
the net enrolment rate, as well as schooling efficiency for both primary and secondary school levels.
And yet, both certification categories prohibit child labour, with the aim of improving child schooling
outcomes. These are important effects and are expected according to the conceptual discussion in
section 2. They most likely come from a combination of an awareness raising effect and an investment
effect. The Fairtrade-Organic coffee certification scheme emphasises awareness raising for
participating producers, on all the critical requirements of the certificate, through an extensive co-
operative structure at parish level. The child labour prohibition condition is one of those highly
emphasised. Fairtrade-Organic certified producers are trained through their GCSs to continuously
monitor implementation and are mobilised to exert peer pressure among members to ensure compliance
by all and avoid the risk of losing the certificate. Interviews with key informants confirmed the rigorous
manner in which the external auditors look for any evidence of violation of this requirement. This
implies that the sampled Fairtrade-Organic households, generally abide by the child labour-free-
condition. We find a positive impact of participation in Fairtrade-Organic certification scheme even
though complying with certification conditions seems to put higher labour demands on certified
producers due to the numerous detailed organic agronomic practices, wet processing of coffee, and the
strict child-labour-free production expected of them. The higher prevalence of use of children to
perform weeding, washing and sorting activities (table 3), is evidence to this labour pressure. This
notwithstanding, participation in Fairtrade-Organic certification has a positive impact on both school
enrolment and schooling efficiency at primary and secondary levels. It implies that involvement in these
activities does not interfere with the children’s schooling and therefore cannot be considered child
labour. Such positive impact of certification on schooling has been reported in literature (Arnould et al,
2009; Gitter et al, 2012; Bechetti et al, 2013).
Another important factor influencing the positive impact of Fairtrade-Organic certified households
on the different schooling indicators comes from the investment effect. Fairtrade certification requires
coffee buying companies in high income countries to invest part of the annual profits generated from
fair-traded coffee, in the communities where the producers live. These funds are spent by GCSs on local
social development priorities, democratically agreed upon by all members. In our research area,
Fairtrade-Organic GCSs have received these funds for about 10 years. Most of them invested these
funds in a wide range of projects including “solar power distribution, scholastic materials and
construction of pit latrines”. The farmers also testify that because of the social premium, coffee has
been consistent in ensuring that they achieve healthcare and education, clean water and energy in their
communities (GCCE, 2017). From interviews with co-operative leaders in Mount Elgon, about 50% of
the GCSs invest these funds in their local schools, mostly on school materials. All these investments
positively affect schooling outcomes directly (through improvements of the local school quality and
91
environment) and indirectly (through reduction of the cost of education for the parents concerned). Our
results are consistent with others that confirm that any investments which relieves parents from some
of the cost of education, has a positive impact on enrolment (Handa et al, 2004; Rawlings & Rubio,
2005).
The positive impact of participation in Fairtrade-Organic coffee certification on school enrolment
and schooling efficiency could not have come through the income route. First, other studies in the area
find that participation in Fairtrade-Organic coffee certification reduces total household income (Akoyi
& Maertens, 2017). Moreover, table 1 shows that there is no difference in asset poverty between
Fairtrade-Organic certified households and the non-certified. Second, when we control for total
household income in the model, there is no difference in estimated effects (table 3). This proves that
there is an effect of participation in Fairtrade-Organic coffee certification scheme on schooling
indicators that comes, not through income but through other channels. Income as a channel of effect
could have been weakened by the heavy and sustained investment in UPE and later USE by the
government of Uganda. Such sustained investment significantly reduces the cost of education, wiping
out the wealth effect on schooling (Deininger, 2003). As far as other factors impacting on schooling
indicators are concerned, education levels of parents imply higher aspirations by parents for the
education of their own children. These findings are consistent with other studies. Nishimura et al (2008)
finds similar results in Uganda and Emerson & Souza (2007) in Brazil.
The lack of impact we find, of participation in Utz-Rainforest-4C coffee certification scheme on
school enrolment and schooling efficiency can be explained in several ways. First, we argue that an
important factor is the limited awareness raising effect linked to the manner in which the certification
conditions are emphasised and monitored. Much as Utz, Rainforest alliance and 4C all prohibit child
labour, with the aim of promoting child schooling, the Utz-Rainforest-4C coffee certification scheme
focuses more on an intensive coffee production system, emphasising good agronomic practices to
enhance coffee yields. Company extension workers regularly visit individual producers to ensure proper
and timely implementation of the Good Agronomic Practices (GAP). The results of this effort is clearly
observable in the healthy-looking coffee shrubs in the fields of the Utz-Rainforest-4C certified
households and the high coffee yields they achieve (table 3 – chapter 3). These households are however,
organised in loosely structured Producer Organisations (POs), mostly aimed at simplifying contact and
communication with the company, and coffee collection during peak season. The use of POs is also
meant to reduce the co-operative burden on the part of producers such as regular meetings, peer
pressure, centralised decision-making, risk of control by government, among others (Benard &
Spielman 2009). The negative side of this arrangement is that the POs are limited in the extent to which
they can stimulate peer pressure for purposes of monitoring compliance with certification conditions
and group trainings on social development issues, sometimes achieved through collective action by
bigger POs or co-operatives (Markelova et al, 2009). Third, even with high government investment in
92
education, school costs remain high in Uganda and parents have had to increase their own investment
in education, to complement government efforts. If a certification scheme does not make specific efforts
to support such investments, it may negatively affect schooling indicators.
Our results are in line with other studies on the implications of coffee certification for schooling
of children of smallholder producers. We find that participation in a double Fairtrade-Organic
certification scheme increases the likelihood to be enrolled in primary school by 4% point and in
secondary school by 15.4% points. It also increases primary schooling efficiency by 9.9% points and
secondary schooling efficiency by 9.6% points. Our findings are consistent with other studies. For
smallholder coffee producers in Mexico, Gitter et al. (2012), conclude that participation in a Fairtrade-
Organic coffee co-operative increased girls schooling by about 0.7 years compared to boys of age
cohort 16-25. For smallholder coffee producers in Ecuador and Mexico, Arnould et al (2007) find that
participation of a household in an FT co-operative has a positive impact on children being currently
enrolled in primary school. For smallholder honey producers in Chilean Fairtrade co-operative,
Becchetti et al (2013) find a positive impact of household participation in the co-operative on child
schooling, with one additional year of membership in the co-operative raising schooling index by about
1.8% for the age cohort 14-18 and 0.9% for the age cohort 10-18. We find no impact of participation in
the triple Utz-Rainforest-4C certification scheme on either school enrolment or schooling efficiency.
We are not aware of other similar studies with which we can compare our results.
In general, differences in the implementation mechanism and business models used by companies
are important factors driving the results in our analysis, just as in other available studies on the impact
of coffee certification. Most studies, including ours, base analysis on a limited number of sampled
certification schemes, thereby making it impossible to completely tease out the impact of certification
and the impact of membership in a specific cooperative or coffee certification scheme. To better take
into account cooperative and scheme heterogeneity, and better distinguish the impact of certification,
one would need a larger and more varied sample of farmers, including farmers certified to the same
standard in different contract and cooperative schemes.
7. Conclusion
In this chapter we analyse the impact of participation in two coffee certification schemes, a double
Fairtrade-Organic certification scheme and a triple Utz-Rainforest-4C certification scheme, by
smallholder farmers in Eastern Uganda, on child schooling. Our results demonstrate that smallholder
participation in the former scheme increases the likelihood of children to be enrolled in both primary
and secondary school. It also increases primary and secondary schooling efficiency of children in the
respective age cohorts. This is mainly due to a combination of an awareness raising effect and an
investment effect. The results imply that 14 years after the introduction of Fairtrade-Organic
certification in the Mount Elgon region, its positive impact on social development, specifically child
93
schooling through sustained awareness raising on the importance of the child-labour-free condition for
child schooling and investment of the social premium in local communities, is evident. For the Utz-
Rainforest-4C certification scheme, we find that smallholder participation has no impact on child
schooling due to limited awareness raising and lack of investment, directly linked to social
development.
Our results, along with previous findings in the literature, indicate that stating the child-labour-free
condition alone is not enough, for private food standards to contribute to school enrolment and
schooling efficiency. We find that even when Utz, Rainforest alliance and 4C all have the child labour-
free condition, and even when participants in these certificates have higher total household income, the
scheme generally has no impact on child schooling. Yet, the impact of participation in a Fairtrade-
Organic scheme has a positive impact on school enrolment and schooling efficiency among children of
smallholder producers, even when participants engage children more in coffee production activities
(table 2), and their total household income is lower than that of non-certified households (table 1). Our
results imply that unless additional measures are put in place to ensure child schooling, stating the child-
labour-free condition as most certificates do may not have any impact.

94
Appendix
Table A1: Results of probit estimations on school enrolment indicators
Primary school enrolment Secondary school enrolment
Total Boys Girls Total Boys Girls
FT-Org 0.430 *** 0.576 *** 0.329 * 0.648 *** 0.684 *** 0.758 ***
(0.126) (0.193
(0.177)
(0.143)
(0.233)
(0.202)
Utz-RA-4C -0.120 -0.208
-0.126
-0.261
-0.297
-0.238
(0.191) (0.297)
(0.264)
(0.162)
(0.226)
(0.237)
Child age 4.038 *** 4.12 *** 4.39 *** 7.17 *** 6.88 *** 7.82 *** (0.303) (0.388)
(0.476)
(0.463)
(0.732)
(0.640)
Child age2 -0.228 *** -0.233 *** -0.248 *** -0.226 *** -0.215 *** -0.248 *** (0.016) (0.021)
(0.026)
(0.015)
(0.024)
(0.021
Child sex (female=1) 0.125
-0.272 **
(0.140)
(0.119)
Average child intelligence 0.228 -0.323
0.663 *** -0.097
-0.243
-0.098
(0.152) (0.225)
(0.232)
(0.128)
(0.197)
(0.180)
Rank of child -0.092 -0.075
-0.147
-0.059
-0.261 *** 0.044
(0.059) (0.090)
(0.092)
(0.056)
(0.095)
(0.081)
Child of household 0.191 -0.274
0.356
0.313 * 0.207
0.347
(0.245) (0.290)
(0.363)
(0.175)
(0.279)
(0.229)
Number sisters 0.041 -0.038
0.075
0.107 ** 0.292 *** 0.083
(0.060) (0.129)
(0.062)
(0.045)
(0.096)
(0.057)
Number brothers 0.137 ** 0.189 ** 0.169 * -0.073
-0.0054
-0.142
(0.066) (0.093)
(0.091)
(0.057)
(0.078)
(0.089)
Bagisua 0.564 * 0.717 * 0.305
0.522 * 0.744 * 0.175
(0.290) (0.429)
(0.389)
(0.271)
(0.420)
(0.365)
Christian 0.182 0.450
-0.242
0.129
-0.267
0.403
(0.256) (0.390)
(0.316)
(0.298)
(0.489)
(0.418)
Muslim 0.510 0.975 * 0.128
-0.553
-1.37 ** -0.105
(0.354) (0.527)
(0.547
(0.376)
(0.597)
(0.550)
Female workers 0.185 ** 0.331 ** 0.212 * -0.042
-0.069
-0.074
(0.086) (0.152)
(0.118)
(0.066)
(0.112)
(0.092)
Male workers 0.012 -0.109
0.034
0.093
0.264 *** 0.015
(0.073) (0.114)
(0.123)
(0.061)
(0.095)
(0.100)
Age head 0.0045 -0.0014
0.012 * 0.0092 ** 0.0103
0.0085
(0.0052) (0.0077)
(0.007)
(0.0047)
(0.0071)
(0.0062)
Education head 0.0058 0.026
0.0039
0.0071
0.012
0.0026
(0.0104) (0.017)
(0.014)
(0.0091)
(0.014)
(0.013)
Sex head (female=1) 0.460 ** 0.158
0.689 ** -0.029
0.726 *** -0.329
(0.198) (0.306)
(0.307)
(0.188)
(0.269)
(0.270)
Mother's education -0.004 -0.021
-0.0019
0.025 ** 0.048 ** 0.014
(0.0077) (0.020)
(0.0081)
(0.012)
(0.024)
(0.0085)
Land cultivated (ha) 0.076 -0.0502
0.219 *** -0.008
-0.015
-0.0031
(0.052) (0.069
(0.082)
(0.053)
(0.084)
(0.073)
Total livestock unit -0.0199 -0.021
-0.017
0.027
0.028
0.071
(0.025) (0.037)
(0.038)
(0.025)
(0.035)
(0.046)
Household asset poor -0.078 0.020
-0.147
-0.177
-0.063
-0.315 * (0.162) (0.259)
(0.229)
(0.126)
(0.195)
(0.172)
Primary school in village -0.354 *** -0.502 *** -0.330
0.096
0.133
0.034
(0.133) (0.177)
(0.201)
(0.117)
(0.177)
(0.162)
Secondary school in village -0.208 -0.111
-0.408 ** 0.029
0.292
-0.176
(0.158 (0.243)
(0.200)
(0.140)
(0.226)
(0.186)
Health centre in village -0.389 ** -0.6140 ** -0.471
0.038
-0.216
0.236
(0.192) (0.285)
(0.293)
(0.174)
(0.260)
(0.264)
All weather road in village 0.212 0.382 * 0.058
-0.015
-0.131
0.038
(0.135 (0.2004)
(0.181)
(0.111)
(0.171)
(0.157)
Distance to Mbale (km) 0.0073 0.0096
0.0067
0.014
0.019
0.0053
(0.0097) (0.014)
(0.014)
(0.009)
(0.013)
(0.013)
Constant -16.66 *** -0.037 *** -17.93 *** -56.87 *** -55.11 *** -61.43 *** (1.54) -0.055
(2.26)
(3.51)
(5.45)
(4.89)
N - Observations 1694 823 871 1694 823 871
Chi2 statistics 398.9 246.5
199.8
401.2
224.1
218.2
P-value 0.00 0.00
0.00
0.00
0.00
0.00
Pseudo-R2 0.804 0.804 0.824 0.690 0.740 0.673
Notes: Marginal effects are reported; standard errors in parentheses; Significant effects indicated with * p < 0.10, ** p < 0.05, *** p < 0.01; ). aBagisu is the most important tribe in the Mount Elgon region.
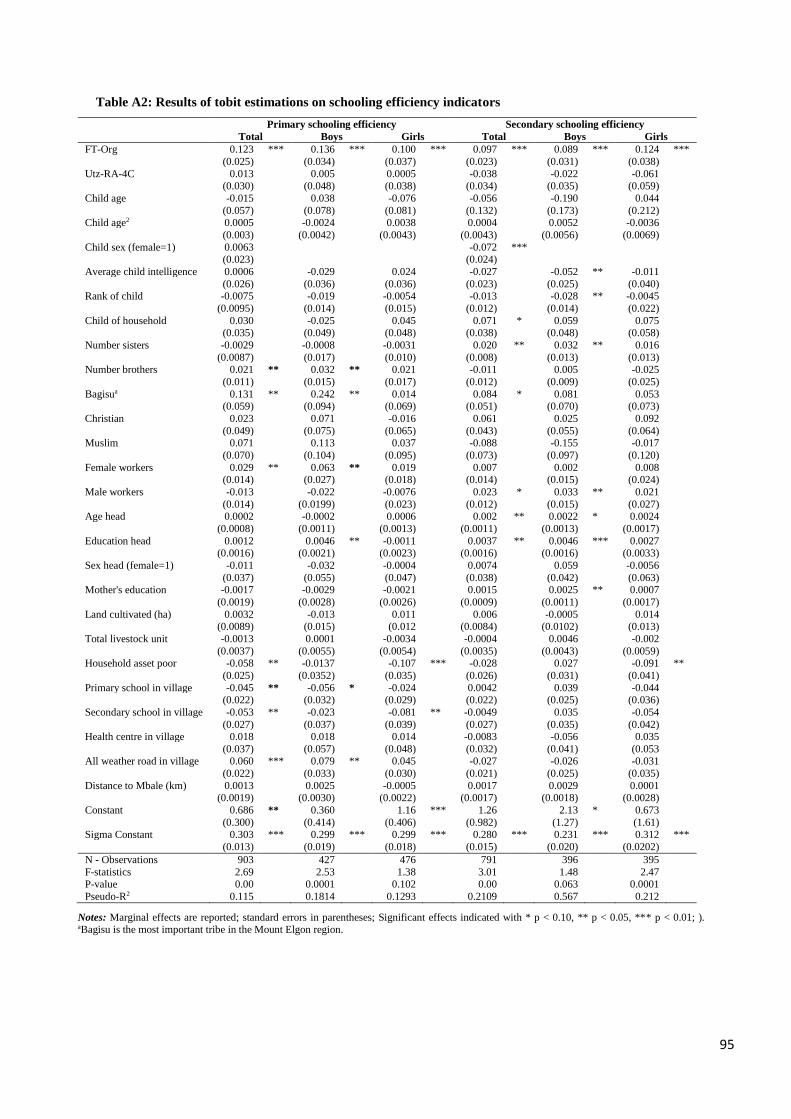
95
Table A2: Results of tobit estimations on schooling efficiency indicators
Primary schooling efficiency Secondary schooling efficiency
Total Boys Girls Total Boys Girls
FT-Org 0.123 *** 0.136 *** 0.100 *** 0.097 *** 0.089 *** 0.124 ***
(0.025) (0.034)
(0.037)
(0.023)
(0.031)
(0.038)
Utz-RA-4C 0.013 0.005
0.0005
-0.038
-0.022
-0.061
(0.030) (0.048)
(0.038)
(0.034)
(0.035)
(0.059)
Child age -0.015 0.038 -0.076 -0.056
-0.190
0.044
(0.057) (0.078)
(0.081)
(0.132)
(0.173)
(0.212)
Child age2 0.0005 -0.0024 0.0038 0.0004
0.0052
-0.0036
(0.003) (0.0042)
(0.0043)
(0.0043)
(0.0056)
(0.0069)
Child sex (female=1) 0.0063
-0.072 ***
(0.023)
(0.024)
Average child intelligence 0.0006 -0.029
0.024 -0.027
-0.052 ** -0.011
(0.026) (0.036)
(0.036)
(0.023)
(0.025)
(0.040)
Rank of child -0.0075 -0.019
-0.0054
-0.013
-0.028 ** -0.0045
(0.0095) (0.014)
(0.015)
(0.012)
(0.014)
(0.022)
Child of household 0.030 -0.025
0.045
0.071 * 0.059
0.075
(0.035) (0.049)
(0.048)
(0.038)
(0.048)
(0.058)
Number sisters -0.0029 -0.0008
-0.0031
0.020 ** 0.032 ** 0.016
(0.0087) (0.017)
(0.010)
(0.008)
(0.013)
(0.013)
Number brothers 0.021 ** 0.032 ** 0.021
-0.011
0.005
-0.025
(0.011) (0.015)
(0.017)
(0.012)
(0.009)
(0.025)
Bagisua 0.131 ** 0.242 ** 0.014
0.084 * 0.081
0.053
(0.059) (0.094)
(0.069)
(0.051)
(0.070)
(0.073)
Christian 0.023 0.071
-0.016
0.061
0.025
0.092
(0.049) (0.075)
(0.065)
(0.043)
(0.055)
(0.064)
Muslim 0.071 0.113
0.037
-0.088
-0.155
-0.017
(0.070) (0.104)
(0.095)
(0.073)
(0.097)
(0.120)
Female workers 0.029 ** 0.063 ** 0.019
0.007
0.002
0.008
(0.014) (0.027)
(0.018)
(0.014)
(0.015)
(0.024)
Male workers -0.013 -0.022
-0.0076
0.023 * 0.033 ** 0.021
(0.014) (0.0199)
(0.023)
(0.012)
(0.015)
(0.027)
Age head 0.0002 -0.0002
0.0006
0.002 ** 0.0022 * 0.0024
(0.0008) (0.0011)
(0.0013)
(0.0011)
(0.0013)
(0.0017)
Education head 0.0012 0.0046 ** -0.0011
0.0037 ** 0.0046 *** 0.0027
(0.0016) (0.0021)
(0.0023)
(0.0016)
(0.0016)
(0.0033)
Sex head (female=1) -0.011 -0.032
-0.0004
0.0074
0.059
-0.0056
(0.037) (0.055)
(0.047)
(0.038)
(0.042)
(0.063)
Mother's education -0.0017 -0.0029
-0.0021
0.0015
0.0025 ** 0.0007
(0.0019) (0.0028)
(0.0026)
(0.0009)
(0.0011)
(0.0017)
Land cultivated (ha) 0.0032 -0.013
0.011
0.006
-0.0005
0.014
(0.0089) (0.015)
(0.012
(0.0084)
(0.0102)
(0.013)
Total livestock unit -0.0013 0.0001
-0.0034
-0.0004
0.0046
-0.002
(0.0037) (0.0055)
(0.0054)
(0.0035)
(0.0043)
(0.0059)
Household asset poor -0.058 ** -0.0137
-0.107 *** -0.028
0.027
-0.091 ** (0.025) (0.0352)
(0.035)
(0.026)
(0.031)
(0.041)
Primary school in village -0.045 ** -0.056 * -0.024
0.0042
0.039
-0.044
(0.022) (0.032)
(0.029)
(0.022)
(0.025)
(0.036)
Secondary school in village -0.053 ** -0.023
-0.081 ** -0.0049
0.035
-0.054
(0.027) (0.037)
(0.039)
(0.027)
(0.035)
(0.042)
Health centre in village 0.018 0.018 0.014
-0.0083
-0.056
0.035
(0.037) (0.057)
(0.048)
(0.032)
(0.041)
(0.053
All weather road in village 0.060 *** 0.079 ** 0.045
-0.027
-0.026
-0.031
(0.022) (0.033)
(0.030)
(0.021)
(0.025)
(0.035)
Distance to Mbale (km) 0.0013 0.0025
-0.0005
0.0017
0.0029
0.0001
(0.0019) (0.0030)
(0.0022)
(0.0017)
(0.0018)
(0.0028)
Constant 0.686 ** 0.360 1.16 *** 1.26
2.13 * 0.673
(0.300) (0.414)
(0.406)
(0.982)
(1.27)
(1.61)
Sigma Constant 0.303 *** 0.299 *** 0.299 *** 0.280 *** 0.231 *** 0.312 *** (0.013) (0.019)
(0.018)
(0.015)
(0.020)
(0.0202)
N - Observations 903 427 476 791 396 395
F-statistics 2.69 2.53
1.38
3.01
1.48
2.47
P-value 0.00 0.0001
0.102
0.00
0.063
0.0001
Pseudo-R2 0.115 0.1814 0.1293 0.2109 0.567 0.212
Notes: Marginal effects are reported; standard errors in parentheses; Significant effects indicated with * p < 0.10, ** p < 0.05, *** p < 0.01; ). aBagisu is the most important tribe in the Mount Elgon region.
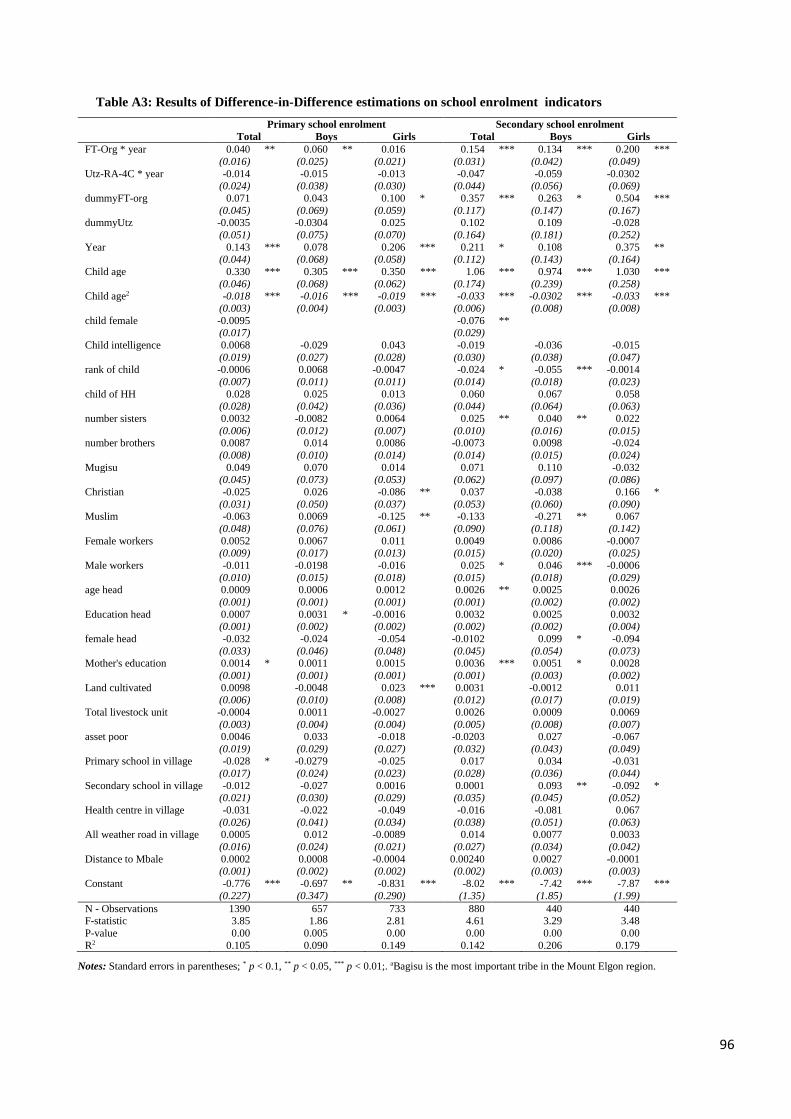
96
Table A3: Results of Difference-in-Difference estimations on school enrolment indicators
Primary school enrolment Secondary school enrolment
Total Boys Girls Total Boys Girls
FT-Org * year 0.040 ** 0.060 ** 0.016 0.154 *** 0.134 *** 0.200 ***
(0.016) (0.025) (0.021) (0.031) (0.042) (0.049)
Utz-RA-4C * year -0.014 -0.015 -0.013 -0.047 -0.059 -0.0302
(0.024) (0.038) (0.030) (0.044) (0.056) (0.069)
dummyFT-org 0.071 0.043 0.100 * 0.357 *** 0.263 * 0.504 ***
(0.045) (0.069) (0.059) (0.117) (0.147) (0.167)
dummyUtz -0.0035 -0.0304 0.025 0.102 0.109 -0.028
(0.051) (0.075) (0.070) (0.164) (0.181) (0.252)
Year 0.143 *** 0.078 0.206 *** 0.211 * 0.108 0.375 **
(0.044) (0.068) (0.058) (0.112) (0.143) (0.164)
Child age 0.330 *** 0.305 *** 0.350 *** 1.06 *** 0.974 *** 1.030 ***
(0.046) (0.068) (0.062) (0.174) (0.239) (0.258)
Child age2 -0.018 *** -0.016 *** -0.019 *** -0.033 *** -0.0302 *** -0.033 ***
(0.003) (0.004) (0.003) (0.006) (0.008) (0.008)
child female -0.0095 -0.076 **
(0.017) (0.029)
Child intelligence 0.0068 -0.029 0.043 -0.019 -0.036 -0.015
(0.019) (0.027) (0.028) (0.030) (0.038) (0.047)
rank of child -0.0006 0.0068 -0.0047 -0.024 * -0.055 *** -0.0014
(0.007) (0.011) (0.011) (0.014) (0.018) (0.023)
child of HH 0.028 0.025 0.013 0.060 0.067 0.058
(0.028) (0.042) (0.036) (0.044) (0.064) (0.063)
number sisters 0.0032 -0.0082 0.0064 0.025 ** 0.040 ** 0.022
(0.006) (0.012) (0.007) (0.010) (0.016) (0.015)
number brothers 0.0087 0.014 0.0086 -0.0073 0.0098 -0.024
(0.008) (0.010) (0.014) (0.014) (0.015) (0.024)
Mugisu 0.049 0.070 0.014 0.071 0.110 -0.032
(0.045) (0.073) (0.053) (0.062) (0.097) (0.086)
Christian -0.025 0.026 -0.086 ** 0.037 -0.038 0.166 *
(0.031) (0.050) (0.037) (0.053) (0.060) (0.090)
Muslim -0.063 0.0069 -0.125 ** -0.133 -0.271 ** 0.067
(0.048) (0.076) (0.061) (0.090) (0.118) (0.142)
Female workers 0.0052 0.0067 0.011 0.0049 0.0086 -0.0007
(0.009) (0.017) (0.013) (0.015) (0.020) (0.025)
Male workers -0.011 -0.0198 -0.016 0.025 * 0.046 *** -0.0006
(0.010) (0.015) (0.018) (0.015) (0.018) (0.029)
age head 0.0009 0.0006 0.0012 0.0026 ** 0.0025 0.0026
(0.001) (0.001) (0.001) (0.001) (0.002) (0.002)
Education head 0.0007 0.0031 * -0.0016 0.0032 0.0025 0.0032
(0.001) (0.002) (0.002) (0.002) (0.002) (0.004)
female head -0.032 -0.024 -0.054 -0.0102 0.099 * -0.094
(0.033) (0.046) (0.048) (0.045) (0.054) (0.073)
Mother's education 0.0014 * 0.0011 0.0015 0.0036 *** 0.0051 * 0.0028
(0.001) (0.001) (0.001) (0.001) (0.003) (0.002)
Land cultivated 0.0098 -0.0048 0.023 *** 0.0031 -0.0012 0.011
(0.006) (0.010) (0.008) (0.012) (0.017) (0.019)
Total livestock unit -0.0004 0.0011 -0.0027 0.0026 0.0009 0.0069
(0.003) (0.004) (0.004) (0.005) (0.008) (0.007)
asset poor 0.0046 0.033 -0.018 -0.0203 0.027 -0.067
(0.019) (0.029) (0.027) (0.032) (0.043) (0.049)
Primary school in village -0.028 * -0.0279 -0.025 0.017 0.034 -0.031
(0.017) (0.024) (0.023) (0.028) (0.036) (0.044)
Secondary school in village -0.012 -0.027 0.0016 0.0001 0.093 ** -0.092 *
(0.021) (0.030) (0.029) (0.035) (0.045) (0.052)
Health centre in village -0.031 -0.022 -0.049 -0.016 -0.081 0.067
(0.026) (0.041) (0.034) (0.038) (0.051) (0.063)
All weather road in village 0.0005 0.012 -0.0089 0.014 0.0077 0.0033
(0.016) (0.024) (0.021) (0.027) (0.034) (0.042)
Distance to Mbale 0.0002 0.0008 -0.0004 0.00240 0.0027 -0.0001
(0.001) (0.002) (0.002) (0.002) (0.003) (0.003)
Constant -0.776 *** -0.697 ** -0.831 *** -8.02 *** -7.42 *** -7.87 ***
(0.227) (0.347) (0.290) (1.35) (1.85) (1.99)
N - Observations 1390 657 733 880 440 440
F-statistic 3.85 1.86 2.81 4.61 3.29 3.48
P-value 0.00 0.005 0.00 0.00 0.00 0.00
R2 0.105 0.090 0.149 0.142 0.206 0.179
Notes: Standard errors in parentheses; * p < 0.1, ** p < 0.05, *** p < 0.01;. aBagisu is the most important tribe in the Mount Elgon region.
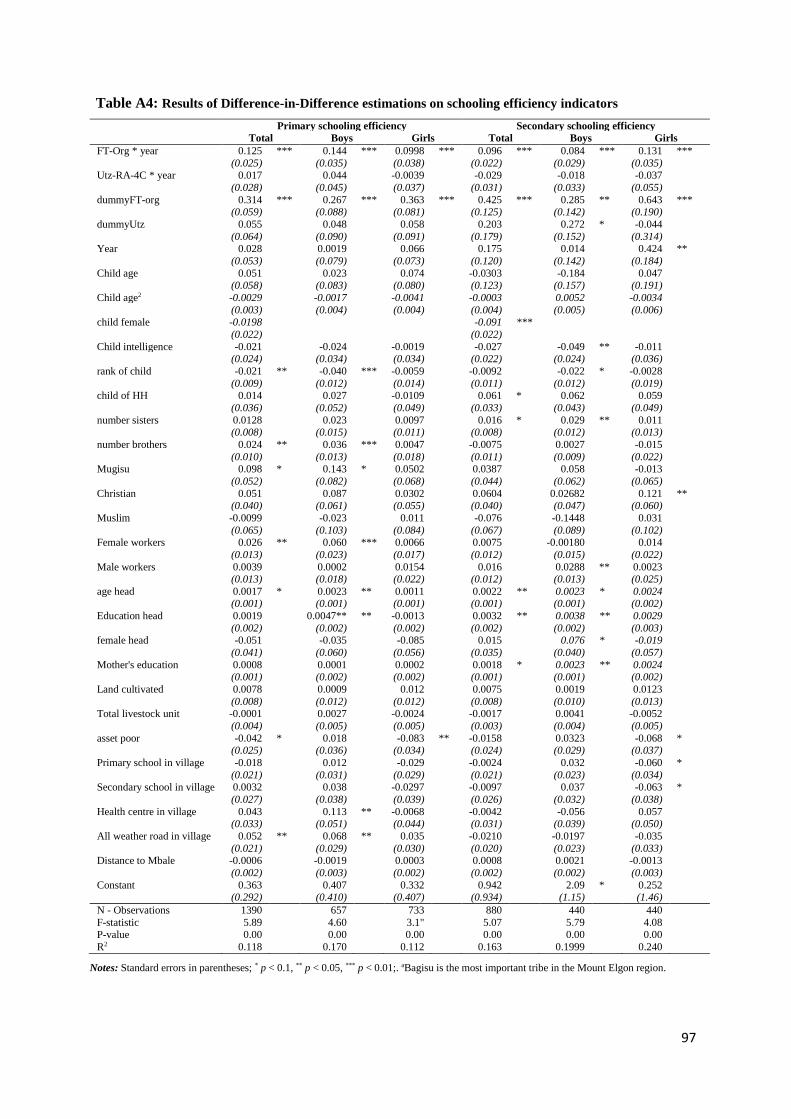
97
Table A4: Results of Difference-in-Difference estimations on schooling efficiency indicators
Primary schooling efficiency Secondary schooling efficiency
Total Boys Girls Total Boys Girls
FT-Org * year 0.125 *** 0.144 *** 0.0998 *** 0.096 *** 0.084 *** 0.131 ***
(0.025) (0.035) (0.038) (0.022) (0.029) (0.035)
Utz-RA-4C * year 0.017 0.044 -0.0039 -0.029 -0.018 -0.037
(0.028) (0.045) (0.037) (0.031) (0.033) (0.055)
dummyFT-org 0.314 *** 0.267 *** 0.363 *** 0.425 *** 0.285 ** 0.643 ***
(0.059) (0.088) (0.081) (0.125) (0.142) (0.190)
dummyUtz 0.055 0.048 0.058 0.203 0.272 * -0.044
(0.064) (0.090) (0.091) (0.179) (0.152) (0.314)
Year 0.028 0.0019 0.066 0.175 0.014 0.424 **
(0.053) (0.079) (0.073) (0.120) (0.142) (0.184)
Child age 0.051 0.023 0.074 -0.0303 -0.184 0.047
(0.058) (0.083) (0.080) (0.123) (0.157) (0.191)
Child age2 -0.0029 -0.0017 -0.0041 -0.0003 0.0052 -0.0034
(0.003) (0.004) (0.004) (0.004) (0.005) (0.006)
child female -0.0198 -0.091 ***
(0.022) (0.022)
Child intelligence -0.021 -0.024 -0.0019 -0.027 -0.049 ** -0.011
(0.024) (0.034) (0.034) (0.022) (0.024) (0.036)
rank of child -0.021 ** -0.040 *** -0.0059 -0.0092 -0.022 * -0.0028
(0.009) (0.012) (0.014) (0.011) (0.012) (0.019)
child of HH 0.014 0.027 -0.0109 0.061 * 0.062 0.059
(0.036) (0.052) (0.049) (0.033) (0.043) (0.049)
number sisters 0.0128 0.023 0.0097 0.016 * 0.029 ** 0.011
(0.008) (0.015) (0.011) (0.008) (0.012) (0.013)
number brothers 0.024 ** 0.036 *** 0.0047 -0.0075 0.0027 -0.015
(0.010) (0.013) (0.018) (0.011) (0.009) (0.022)
Mugisu 0.098 * 0.143 * 0.0502 0.0387 0.058 -0.013
(0.052) (0.082) (0.068) (0.044) (0.062) (0.065)
Christian 0.051 0.087 0.0302 0.0604 0.02682 0.121 **
(0.040) (0.061) (0.055) (0.040) (0.047) (0.060)
Muslim -0.0099 -0.023 0.011 -0.076 -0.1448 0.031
(0.065) (0.103) (0.084) (0.067) (0.089) (0.102)
Female workers 0.026 ** 0.060 *** 0.0066 0.0075 -0.00180 0.014
(0.013) (0.023) (0.017) (0.012) (0.015) (0.022)
Male workers 0.0039 0.0002 0.0154 0.016 0.0288 ** 0.0023
(0.013) (0.018) (0.022) (0.012) (0.013) (0.025)
age head 0.0017 * 0.0023 ** 0.0011 0.0022 ** 0.0023 * 0.0024
(0.001) (0.001) (0.001) (0.001) (0.001) (0.002)
Education head 0.0019 0.0047** ** -0.0013 0.0032 ** 0.0038 ** 0.0029
(0.002) (0.002) (0.002) (0.002) (0.002) (0.003)
female head -0.051 -0.035 -0.085 0.015 0.076 * -0.019
(0.041) (0.060) (0.056) (0.035) (0.040) (0.057)
Mother's education 0.0008 0.0001 0.0002 0.0018 * 0.0023 ** 0.0024
(0.001) (0.002) (0.002) (0.001) (0.001) (0.002)
Land cultivated 0.0078 0.0009 0.012 0.0075 0.0019 0.0123
(0.008) (0.012) (0.012) (0.008) (0.010) (0.013)
Total livestock unit -0.0001 0.0027 -0.0024 -0.0017 0.0041 -0.0052
(0.004) (0.005) (0.005) (0.003) (0.004) (0.005)
asset poor -0.042 * 0.018 -0.083 ** -0.0158 0.0323 -0.068 *
(0.025) (0.036) (0.034) (0.024) (0.029) (0.037)
Primary school in village -0.018 0.012 -0.029 -0.0024 0.032 -0.060 *
(0.021) (0.031) (0.029) (0.021) (0.023) (0.034)
Secondary school in village 0.0032 0.038 -0.0297 -0.0097 0.037 -0.063 *
(0.027) (0.038) (0.039) (0.026) (0.032) (0.038)
Health centre in village 0.043 0.113 ** -0.0068 -0.0042 -0.056 0.057
(0.033) (0.051) (0.044) (0.031) (0.039) (0.050)
All weather road in village 0.052 ** 0.068 ** 0.035 -0.0210 -0.0197 -0.035
(0.021) (0.029) (0.030) (0.020) (0.023) (0.033)
Distance to Mbale -0.0006 -0.0019 0.0003 0.0008 0.0021 -0.0013
(0.002) (0.003) (0.002) (0.002) (0.002) (0.003)
Constant 0.363 0.407 0.332 0.942 2.09 * 0.252
(0.292) (0.410) (0.407) (0.934) (1.15) (1.46)
N - Observations 1390 657 733 880 440 440
F-statistic 5.89 4.60 3.1" 5.07 5.79 4.08
P-value 0.00 0.00 0.00 0.00 0.00 0.00
R2 0.118 0.170 0.112 0.163 0.1999 0.240
Notes: Standard errors in parentheses; * p < 0.1, ** p < 0.05, *** p < 0.01;. aBagisu is the most important tribe in the Mount Elgon region.
98
Chapter 5
Do Multiple Coffee Standards Address the Economic and Environmental
Sustainability Trade-off?
1. Introduction
A wide variety of private food standards is spreading in global agri-food sectors, each with its
own promises on improving sustainability of food production and trade (Gereffi et al, 2005; Henson &
Humphrey, 2010; Lee et al, 2012). Private food standards focus to a varying extent on environmental,
economic and social aspects, and are most important in trade relations with developing countries
(Henson & Humphrey, 2010; Lee et al, 2012; Beghin et al, 2015). For example, Organic certification
is promoted as eco-friendly production without chemical inputs. Fairtrade claims to improve farmers’
lives and to offer consumers a powerful way to reduce poverty through their everyday shopping.
Rainforest Alliance claims to ensure the long-term economic health of communities through protecting
ecosystems, safeguarding the well-being of local communities and improving productivity. Utz
assures that coffee, tea and cocoa suppliers follow expert guidance on better farming methods,
working conditions and care for nature; which leads to better production, a better environment and a
better life for everyonei.
But do private food standards walk the talk – and effectively provide a way to improve economic
and environmental sustainability of global food production and trade? Answering this question is
important for various stakeholders. First, for developing countries for whom agri-food exports are
critical for growth and whose farmers are often poor and operate in environmentally sensitive areas.
Second, for consumers to know if private food standards deliver what they promise and to judge if a
price premium is justified. Third, for companies and non-profit organizations initiating and adopting
standards to know the impact of the standards they promote and justify the rents they extract from agri-
food chains. Fourth, for donors in order to ascertain the effectiveness of financial support to certification
schemes in comparison with other development projects.
There is evidence on both socio-economic and ecological implications of specific private food
standards. A review article on the socio-economic impacts concludes that private food standards
can enhance the competitive position of developing countries and exporters in international markets
but that the implications for smallholder producers are complex, case-specific and should be analysed
in a comparative way (Reardon et al, 2009). A review article on the ecological impacts concludes that
certification of tropical commodities can support biodiversity conservation but that the causal impact is
still questionable (Tscharntke et al, 2015). Multidisciplinary studies that concurrently assess socio-
economic and ecological outcomes of private food standards, and potential trade-offs, are rare or
even non-existent.
99
In this chapter, we analyse the on-farm agronomic, socio-economic and environmental
implications of a double Fairtrade-Organic and a triple Utz – Rainforest Alliance – Common Code for
Coffee Commodity (Utz-Rainforest-4C) smallholder coffee certification scheme in the Mount Elgon
region in Eastern Uganda (Mt. Elgon). We combine economic and ecological methods in a
multidisciplinary approach. We use household- and field-levelii
socio-economic data from a
quantitative survey among 595 farm-households producing coffee on 1,183 fields. We combine these
with GIS data on location and agro-ecological conditions; and field-level inventory data on carbon
storage, tree- and invertebrate-biodiversity from a sub- sample of 74 fields selected from the 1,183
fields through stratified random selection of certified fields and matching of control fields. We use
instrumental variable regressions that pass weak- and over-identification restrictions to estimate the
impact of private coffee standards on agronomic practices, coffee yield, labour productivity, coffee
income and poverty; and linear mixed models to reveal the implications of private coffee standards for
tree and invertebrate diversity and carbon storage.
Given that an estimated 25 million smallholders worldwide (11.7 million in Africa) depend on
coffee production as a main income source, that the incidence of poverty among them is high (Eakin et
al, 2009) and that coffee trade has been identified as a major cause of biodiversity threats in tropical
countries (Lenzen et al, 2012), sustainable coffee cultivation remains a challenge. Understanding the
contribution of private food standards in addressing this challenge requires a multidisciplinary focus.
While multidisciplinary studies analyse the trade-offs between economic and ecological outcomes of
increased intensification of tropical commodity production (Teuscher et al 2015; Philpott et al, 2008;
Steffan-Dewenter et al, 2008; Bos et al, 2007), studies on coffee certification are mainly discipline
specific and mostly from Latin-America. Socio-economic studies analyse the impact on productivity,
income, poverty and food security (Mitiku et al, 2017; Jena & Grote, 2017; Chiputwa et al, 2016; Van
Rijsbergen, 2016; Chiputwa et al, 2015; Barham & Weber, 2012; Wollni & Zeller, 2007; Bacon, 2005).
There are studies on the agronomic (Ibanez & Blackman, 2016; Rueda & Lambin, 2013; Elder et al,
2013; Blackman & Naranjo, 2012) and ecological (Haggar et al, 2015; Hardt et al, 2015; Rueda et al,
2015; Philpott et al, 2007; Perfecto et al, 2005) implications of coffee certification, of which some
include an economic analysis of revenues and costs (Ibanez & Blackman, 2016; Hardt et al, 2015;
Rueda & Lambin, 2013; Philpott et al, 2007). This multidisciplinary study on the agronomic, socio-
economic and ecological implications of coffee certification fills an important gap in the literature.
100
2. Methods and data
2.1 Research area
The research area covers five of the eight districts in the Mount Elgon region in Eastern Uganda,
a main coffee producing area in the country (figure 3 - Chapter 1). The region ranges between
1,200 and 2,200 m.a.s.l.; has a bi-modal rainfall pattern and volcanic soils; borders the Mount Elgon
National Park; is dominated by Bagisu and Sabiny ethnic groups; and faces increasing population
pressure and land degradation problems.
2.2 Data
Farm-household survey data were collected in February-March 2014 using a quantitative
structured questionnaire and a stratified random sample of 600 coffee producing households, clustered
in 60 villages and 21 sub-counties. Strata of Utz-Rainforest-4C certified, Fairtrade-Organic certified,
and non- certified sub-counties, villages and households were constructed based on information from
coffee companies and local councils. The sample includes 170 Fairtrade-Organic and 130 Utz-
Rainforest-4C certified producers, and 300 non- certified producers. Five observations were dropped
due to missing information. The survey provides household-level data and field-level data for all
1,183 coffee fields of the sampled households, including GPS coordinates. Survey data were merged
with available GIS data on topographic, soil, climate and other location-specific characteristics.
Additional information was collected from interviews with village leaders and coffee companies.
A biophysical field inventory was done on a subsample of 74 coffee fields in July-September
2014. The subsample includes 18 Fairtrade-Organic and 19 Utz-Rainforest-4C fields selected in a
stratified random way with strata based on soil type and elevation. These 37 fields were pair-wise
matched with 37 non-certified fields using propensity score matching (Rosenbaum & Rubin, 1983)
with agro-ecological (elevation, rainfall, distance to the main road and to the national park,) and socio-
economic (household size and age, education, tribe and religion of the household head) information.
Measurements were done in rectangular (slope corrected) 0.05 ha plots randomly placed within the
field. GPS coordinates of plots were recorded, and slope and aspect measured. We measured the
Diameter at Breast Height (DBH) and height for all woody plant species, stumps, deadwood and
coarse woody debris. Stem and/or plant counts were made for crops. Litter was collected in two 1
m² quadrants per plot. Soil bulk density and Soil Organic Carbon (SOC) samples were taken at 1 and 9
positions and from 3 soil layers up to 30 cm deep. Invertebrates were sampled according to the standard
Ants of the Leaf Litter (ALL)-protocol using 16 pitfall traps (24 hr.), 24 baits (1 cm³ tuna, 45 min)
spread over the plot soil and shrub layer (1 m height) and by litter (2x1 m²) sieving + Winkler extraction
(Agosti et al, 2000). We identified 828 adult spiders (Araneae) and 44,690 ants (Formicidae) up to
species/morphospecies (88 and 187, respectively) and counted 2,732 rove beetles (Staphylinidae). Ant
abundance and diversity are calculated leaving out Pheidole, Myrmicaria and Dorylus speciesiii.
101
Agronomic practices: From survey data (1,183 coffee fields) and in-depth interviews with the
subsampled household heads (of the 74 coffee fields), binary field level variables are derived indicating
the application of pesticides, copper fungicide, chemical fertilizer, cultural weed control, mulching,
animal manure, green manure, shade trees, wind breaks, soil tillage, intercropping with legumes,
slashing undergrowth, recommended spacing and pruning coffee shrubs during the past year.
Socio-economic indicators: From survey data we derive coffee yield, coffee labour productivity,
net coffee income and poverty. Coffee yield is calculated at field level as the total quantity of coffee
harvested over the 12-month period prior to the survey over the size of the field, and expressed in kg of
fresh coffee cherries per ha. Labour productivity is calculated at the household level as the net income
from coffee production per person-day of family labour in coffee production, processing and marketing,
and expressed in UGX per person-day. Coffee income is net household income in UGX from coffee
production and processing, and derived as total sales value of coffee minus the costs of variable inputs
and hired labour. Poverty is a binary variable for per capita household income falling below the
international poverty line of $3.10/day (equivalent to 3,473 UGX in 2014). Per capita income is
calculated taking into account all labour and non-labour income sources and based on the modified
OECD adult equivalence scale.
Ecological indicators: a) Carbon storage: Total Carbon (C) stocks (Mg C ha-1
) are calculated
based on above ground woody species-, crop- and root-biomass C, coarse woody debris and litter C
and SOC in the top 30 cm soil layer. Woody species biomass C (DBH > 5 cm) is assessed using
an allometric equation with tree heights, tree DBH and species specific oven dry wood densities
and standard C/dry biomass weight ratio of 0.5 (Chave et al, 2014; Zanne et al, 2009; Eggleston et
al, 2006). Crop C is estimated and time averaged based on stem and/or plant counts, oven dry crop
weights, length of the crop growth cycles and annual cropping periods. Regeneration (DBH < 5 cm)
biomass C is assessed using species specific dry wood densities and simplifying their shape to a
cone. Coarse woody debris is simplified to cylinder shapes. Deadwood densities are corrected for
decomposition (IFER, 2002). Root biomass C is assessed based on the above ground biomass C using
a shoot-root ratio of 0.205 (Mokany et al, 2006). Coffee and banana biomass C is assessed using
species specific allometric relations (Negash et al, 2013; Hairiah et al, 2011). Litter C is assessed from
oven dry litter weights. SOC is measured by dry combustion at 1020 °C (Carlo Erba 1108 Elemental
Analyser). Bulk density determined from undisturbed, Kopecky ring, soil sample weights dried 48
hours at 105°C.
b) Biodiversity: Basal area per tree species is calculated based on the DBH and species data.
Tree, ant and spider species/morphospecies data are used to calculate the Simpson diversity index: 𝐷′ =
1 − ∑ 𝑝𝑖 2𝑠
𝑖=1 , where pi is the proportion of the ith species (s) in the population (Simpson, 1949). Plot
heat load indices are calculated based on folded aspect, slope and latitude (McCune & Keon, 2002);
102
plot altitude measured by GPS. Rainfall data are obtained from the COSMO-Climate Limited-area
Modelling (CCLM) by (Thiery et al, 2015).
2.3 Impact estimation
Instrumental variable (IV) models: For socio-economic analysis, we apply Instrumental
variable (IV) models. We use limited-information maximum likelihood estimators and IVs to estimate
the following models, respectively at the field (equation 1) and household level (equation 2):
𝑌𝑖𝑗 = 𝛽0 + 𝛽1𝑈𝑡𝑧𝑅𝐴4𝐶𝑖 + 𝛽2𝐹𝑇𝑂𝑟𝑔𝑖 + 𝛽3𝐹𝑖𝑗 + 𝛽4𝑋𝑖 + 𝛽5𝑉𝑖 + 𝛽6𝐷𝑖 + 𝜀𝑖+ 𝜃𝑖𝑗 (1)
𝑌𝑖 = 𝛽0′ + 𝛽1
′𝑈𝑡𝑧𝑅𝐴4𝐶𝑖 + 𝛽2′ 𝐹𝑇𝑂𝑟𝑔𝑖 + 𝛽3
′ 𝐹𝑖 + 𝛽4′𝑋𝑖 + 𝛽5
′ 𝑉𝑖 + 𝜀′𝑖 (2)
Outcome variables Yij at field level include different agronomic practices and coffee yield. Outcome
variables Yi at household level include labour productivity in coffee production, net coffee income and
poverty. For binary outcome variables (agronomic practices, poverty) the IV estimation is interpreted
as a linear probability model. The binary certification variables Utz-Rainforest-4C (Utz-RA-4C) and
Fairtrade-Organic (FT-Org) are considered endogenous and instrumented for. The vector of control
variables F includes field size, age of coffee shrubs and agro-ecological characteristics (altitude, slope,
heat load, topographic wetness, soil type) at the field level (Fij) or field-size weighted averages at the
household level (Fi). The latter are derived from GIS data (table A1). The vector X includes household
level control variables measuring human capital (age, education and gender of the household head,
number of adults and children in the household) and physical capital (livestock units, land, land-
squared) – land is measured as total coffee area or total farm size. Variables in X are derived from
survey data (table A2). The vector V includes village level institutional and accessibility characteristics
(distance to Mbale town and the nearest trading centre, access to an all-weather road, a market-day, a
primary school and a health centre in the village) while D includes district fixed effects (table A2).
The latter are not included in the field-level regressions on agronomic practices. From these models
(tables A3 and 4) we obtain least- square means (LS-means) which are used in Figures 1 and 2.
Three instruments are used to address endogeneity, considering the common problem of selection
bias in programs targeting smallholder producers: years of experience of the household in Bugisu
Cooperative Unioniv; distance between the homestead and the nearest washing station of the Utz-
Rainforest-4C scheme; and the square of this distance. Instruments are relevant and plausibly
exogenous. Joint exclusion of instruments is rejected with an F-statistic of 245.15 (p<0.001) for Utz-
Rainforest-4C and 40.12 (p<0.001) for Fairtrade-Organic (table A2). Instruments pass the Kleibergen-
Paap test for under-identification with an LM test statistic of 59.34 (p< 0.001); and the Kleibergen-Paap
test for weak identification with a Wald F statistic of 34.67 (which is above the 10% Stock-Yogo critical
value of 13.43) (table A2). For all socio- economic indicators, regressions pass the Sargan-Hansen
test for over-identification restrictions at the 1% significance level while the Anderson-Rubin test
indicates both certification variables are endogenous (table A4a) - which justifies the use of the less
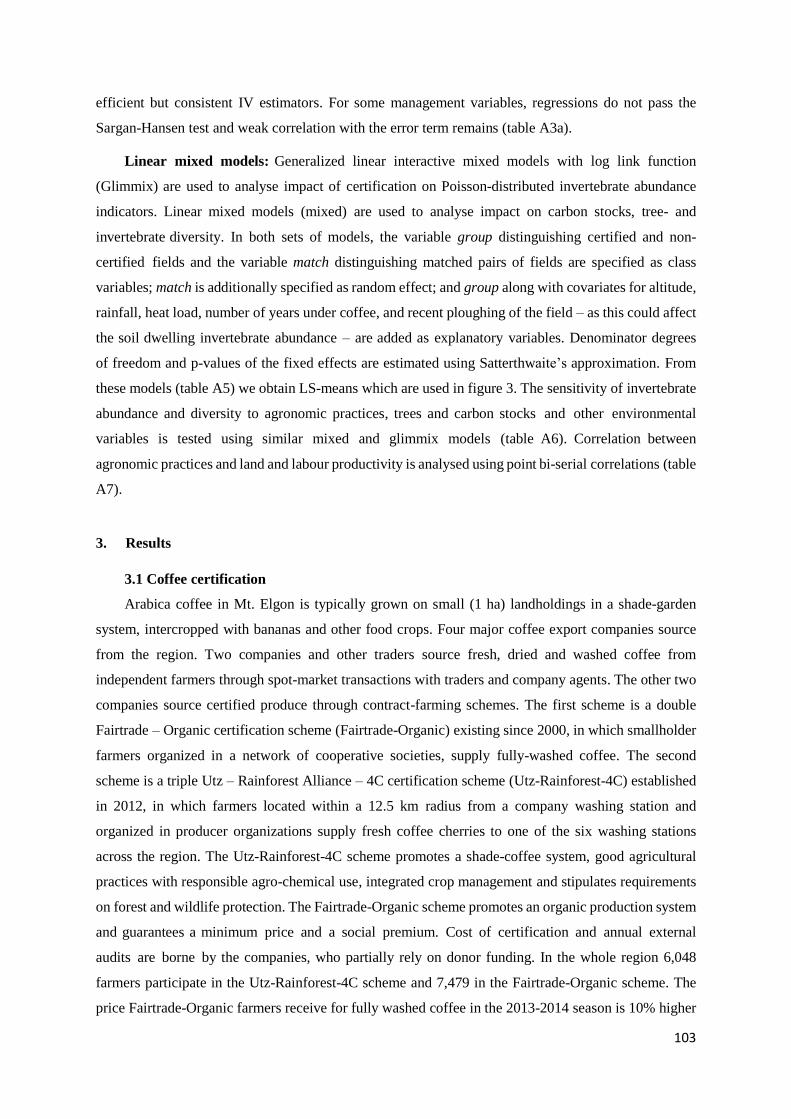
103
efficient but consistent IV estimators. For some management variables, regressions do not pass the
Sargan-Hansen test and weak correlation with the error term remains (table A3a).
Linear mixed models: Generalized linear interactive mixed models with log link function
(Glimmix) are used to analyse impact of certification on Poisson-distributed invertebrate abundance
indicators. Linear mixed models (mixed) are used to analyse impact on carbon stocks, tree- and
invertebrate diversity. In both sets of models, the variable group distinguishing certified and non-
certified fields and the variable match distinguishing matched pairs of fields are specified as class
variables; match is additionally specified as random effect; and group along with covariates for altitude,
rainfall, heat load, number of years under coffee, and recent ploughing of the field – as this could affect
the soil dwelling invertebrate abundance – are added as explanatory variables. Denominator degrees
of freedom and p-values of the fixed effects are estimated using Satterthwaite’s approximation. From
these models (table A5) we obtain LS-means which are used in figure 3. The sensitivity of invertebrate
abundance and diversity to agronomic practices, trees and carbon stocks and other environmental
variables is tested using similar mixed and glimmix models (table A6). Correlation between
agronomic practices and land and labour productivity is analysed using point bi-serial correlations (table
A7).
3. Results
3.1 Coffee certification
Arabica coffee in Mt. Elgon is typically grown on small (1 ha) landholdings in a shade-garden
system, intercropped with bananas and other food crops. Four major coffee export companies source
from the region. Two companies and other traders source fresh, dried and washed coffee from
independent farmers through spot-market transactions with traders and company agents. The other two
companies source certified produce through contract-farming schemes. The first scheme is a double
Fairtrade – Organic certification scheme (Fairtrade-Organic) existing since 2000, in which smallholder
farmers organized in a network of cooperative societies, supply fully-washed coffee. The second
scheme is a triple Utz – Rainforest Alliance – 4C certification scheme (Utz-Rainforest-4C) established
in 2012, in which farmers located within a 12.5 km radius from a company washing station and
organized in producer organizations supply fresh coffee cherries to one of the six washing stations
across the region. The Utz-Rainforest-4C scheme promotes a shade-coffee system, good agricultural
practices with responsible agro-chemical use, integrated crop management and stipulates requirements
on forest and wildlife protection. The Fairtrade-Organic scheme promotes an organic production system
and guarantees a minimum price and a social premium. Cost of certification and annual external
audits are borne by the companies, who partially rely on donor funding. In the whole region 6,048
farmers participate in the Utz-Rainforest-4C scheme and 7,479 in the Fairtrade-Organic scheme. The
price Fairtrade-Organic farmers receive for fully washed coffee in the 2013-2014 season is 10% higher
104
than the price non-certified farmers receive (4,364 UGX/kg on average versus 3,947 UGX/kg) while
Utz-Rainforest-4C farmers receive a similar price for fresh coffee than non-certified farmers (857
UGX/kg on average versus 821 UGX/kg).
3.2 Agronomic practices
Certification has an impact on the agronomic practices applied on coffee fields (figure 1). Utz-
Rainforest-4C certification increases the likelihood of using agro-chemicals – for pesticides with 48
percentage points (pp) (p<0.001), fungicide with 36 pp (p<0.001), and inorganic fertilizer with 58 pp
(p<0.001). It also increases the use of mulching (11 pp, p=0.003) and green manure (22 pp, p<0.001)
but less strongly. Fairtrade-Organic certification reduces but does not completely eliminate the use of
agro-chemical inputsv
– for pesticides with 21 pp (p<0.001) and for fertilizer with 19 pp (p=0.042) –
and strongly increases the use of organic practices such as cultural weed control (38 pp, p<0.001),
mulching (18 pp, p=0.004), animal manure (22 pp, p=0.001) and green manure application (32 pp,
p<0.001). Utz-Rainforest-4C certification increases the likelihood of using shade trees (23 pp,
p<0.001), intercropping with legumes (12 pp, p=0.007), slashing the undergrowth (15 pp,
p=0.001), and planting more coffee shrubs than the recommended spacing (10 pp, p=0.028). Fairtrade-
Organic certification reduces the likelihood of using wind breaks (49 pp, p=0.001) and increases the
likelihood of tilling the soil (54 pp, p<0.001), slashing the undergrowth (26 pp, p<0.001), and using
recommended spacing (18 pp, p=0.017).
105
Figure 1: Effect of certification on agronomic practices applied on coffee fields
Source: Authors’ derivation from survey data; Notes: Least-square means for certified (Fairtrade- Organic,
Utz-Rainforest Alliance-4C) and non-certified fields estimated from farm-household survey data (ns = not
significant,* p<0.1; ** p<0.05; *** p<0.01). Estimated effects obtained from maximum likelihood
instrumental variable estimations at field level (N=1,183).
3.3 Socio-economic performance
The two certification schemes have opposite effects on the socio- economic performance of coffee
farms (figure 2). Coffee yields on Utz-Rainforest-4C fields are 988 kg/ha (p<0.001) or 24% higher than
on control fields. Labour productivity is 7,431 UGX/person-day (p<0.001) higher for Utz-Rainforest-
4C certified households than for non-certified households. Higher land and labour productivity result in
higher net coffee income: the estimated effect of Utz-Rainforest-4C certification on coffee income is
421,002 UGX (p<0.001) or 24% of the coffee income of non-certified households. Effects are opposite
for Fairtrade-Organic certification. Yields, labour productivity and net coffee income are significantly
lower for Fairtrade-Organic fields/households than for non-certified fields/households. Estimates show
that Fairtrade-Organic certification reduces coffee yield with 1,112 kg/ha (p<0.001) or 26%, labour
productivity with 3,263 UGX/person-day (p=0.029), and coffee income with 336,203 UGX (p=0.079)
or 19%. By increasing coffee yields, labour productivity and net farm incomes, Utz-Rainforest-4C
certification creates a poverty reducing effect of 13.8 pp (p=0.022). Given lower yields, net coffee

106
income and labour productivity, FT- Org certification fails to reduce poverty. Estimates indicate a much
higher poverty incidence for FT- Org households (50.2%) than for control households (33.6%) but the
difference is statistically not significant (p=0.142).
Figure 2: Effect of certification on coffee yield, coffee labour productivity, coffee income and
the likelihood of poverty
Source: Authors’ derivation from survey data; Notes: Least-square means for certified (Fairtrade-Organic,
Utz-Rainforest Alliance-4C) and non-certified fields and households estimated from farm-household survey
data (ns not significant,* p<0.1; ** p<0.05; *** p<0.01). Estimated effects obtained from maximum
likelihood instrumental variable estimations at field level (yield) (N=1,183) and farm-household level (labour
productivity, coffee income and poverty) (N=595); PD= person-day.
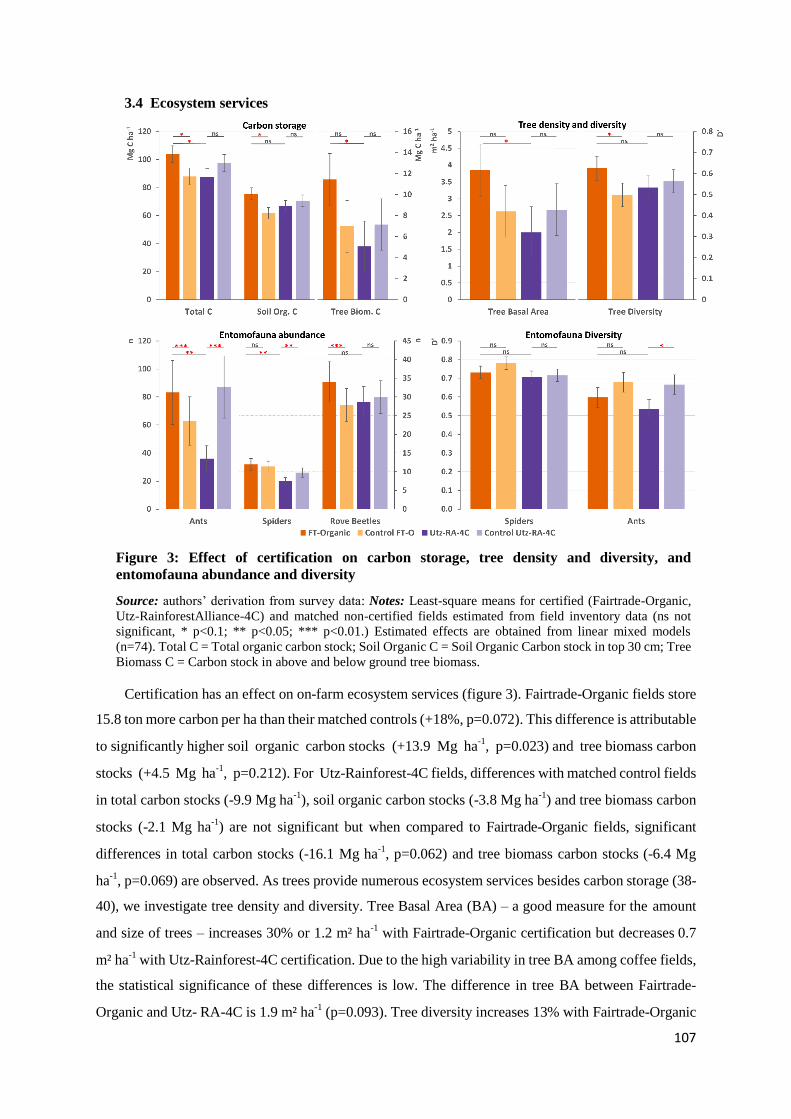
107
3.4 Ecosystem services
Figure 3: Effect of certification on carbon storage, tree density and diversity, and
entomofauna abundance and diversity
Source: authors’ derivation from survey data: Notes: Least-square means for certified (Fairtrade-Organic,
Utz-RainforestAlliance-4C) and matched non-certified fields estimated from field inventory data (ns not
significant, * p<0.1; ** p<0.05; *** p<0.01.) Estimated effects are obtained from linear mixed models
(n=74). Total C = Total organic carbon stock; Soil Organic C = Soil Organic Carbon stock in top 30 cm; Tree
Biomass C = Carbon stock in above and below ground tree biomass.
Certification has an effect on on-farm ecosystem services (figure 3). Fairtrade-Organic fields store
15.8 ton more carbon per ha than their matched controls (+18%, p=0.072). This difference is attributable
to significantly higher soil organic carbon stocks (+13.9 Mg ha-1
, p=0.023) and tree biomass carbon
stocks (+4.5 Mg ha-1
, p=0.212). For Utz-Rainforest-4C fields, differences with matched control fields
in total carbon stocks (-9.9 Mg ha-1
), soil organic carbon stocks (-3.8 Mg ha-1
) and tree biomass carbon
stocks (-2.1 Mg ha-1
) are not significant but when compared to Fairtrade-Organic fields, significant
differences in total carbon stocks (-16.1 Mg ha-1
, p=0.062) and tree biomass carbon stocks (-6.4 Mg
ha-1
, p=0.069) are observed. As trees provide numerous ecosystem services besides carbon storage (38-
40), we investigate tree density and diversity. Tree Basal Area (BA) – a good measure for the amount
and size of trees – increases 30% or 1.2 m² ha-1
with Fairtrade-Organic certification but decreases 0.7
m² ha-1
with Utz-Rainforest-4C certification. Due to the high variability in tree BA among coffee fields,
the statistical significance of these differences is low. The difference in tree BA between Fairtrade-
Organic and Utz- RA-4C is 1.9 m² ha-1
(p=0.093). Tree diversity increases 13% with Fairtrade-Organic
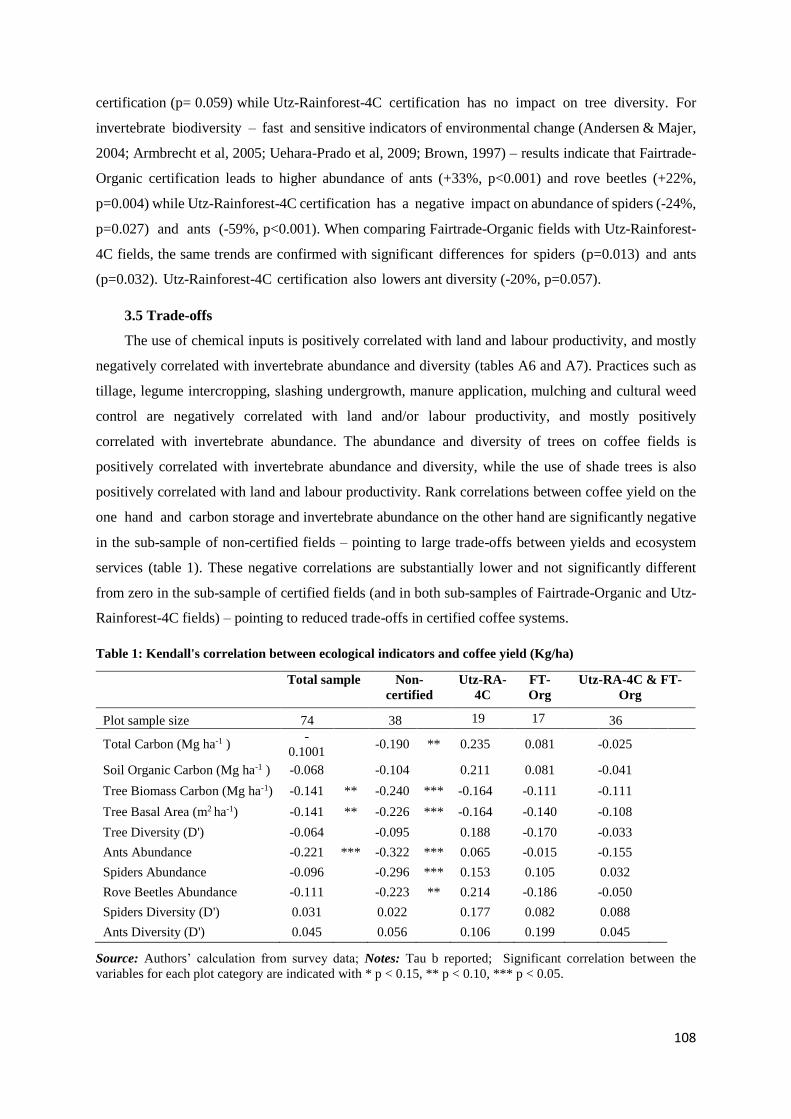
108
certification (p= 0.059) while Utz-Rainforest-4C certification has no impact on tree diversity. For
invertebrate biodiversity – fast and sensitive indicators of environmental change (Andersen & Majer,
2004; Armbrecht et al, 2005; Uehara-Prado et al, 2009; Brown, 1997) – results indicate that Fairtrade-
Organic certification leads to higher abundance of ants (+33%, p<0.001) and rove beetles (+22%,
p=0.004) while Utz-Rainforest-4C certification has a negative impact on abundance of spiders (-24%,
p=0.027) and ants (-59%, p<0.001). When comparing Fairtrade-Organic fields with Utz-Rainforest-
4C fields, the same trends are confirmed with significant differences for spiders (p=0.013) and ants
(p=0.032). Utz-Rainforest-4C certification also lowers ant diversity (-20%, p=0.057).
3.5 Trade-offs
The use of chemical inputs is positively correlated with land and labour productivity, and mostly
negatively correlated with invertebrate abundance and diversity (tables A6 and A7). Practices such as
tillage, legume intercropping, slashing undergrowth, manure application, mulching and cultural weed
control are negatively correlated with land and/or labour productivity, and mostly positively
correlated with invertebrate abundance. The abundance and diversity of trees on coffee fields is
positively correlated with invertebrate abundance and diversity, while the use of shade trees is also
positively correlated with land and labour productivity. Rank correlations between coffee yield on the
one hand and carbon storage and invertebrate abundance on the other hand are significantly negative
in the sub-sample of non-certified fields – pointing to large trade-offs between yields and ecosystem
services (table 1). These negative correlations are substantially lower and not significantly different
from zero in the sub-sample of certified fields (and in both sub-samples of Fairtrade-Organic and Utz-
Rainforest-4C fields) – pointing to reduced trade-offs in certified coffee systems.
Table 1: Kendall's correlation between ecological indicators and coffee yield (Kg/ha)
Total sample Non-
certified
Utz-RA-
4C
FT-
Org
Utz-RA-4C & FT-
Org
Plot sample size 74 38 19 17 36
Total Carbon (Mg ha-1 ) -
0.1001 -0.190 ** 0.235 0.081 -0.025
Soil Organic Carbon (Mg ha-1 ) -0.068 -0.104 0.211 0.081 -0.041
Tree Biomass Carbon (Mg ha-1) -0.141 ** -0.240 *** -0.164 -0.111 -0.111
Tree Basal Area (m2 ha-1) -0.141 ** -0.226 *** -0.164 -0.140 -0.108
Tree Diversity (D') -0.064 -0.095 0.188 -0.170 -0.033
Ants Abundance -0.221 *** -0.322 *** 0.065 -0.015 -0.155
Spiders Abundance -0.096 -0.296 *** 0.153 0.105 0.032
Rove Beetles Abundance -0.111 -0.223 ** 0.214 -0.186 -0.050
Spiders Diversity (D') 0.031 0.022 0.177 0.082 0.088
Ants Diversity (D') 0.045 0.056 0.106 0.199 0.045
Source: Authors’ calculation from survey data; Notes: Tau b reported; Significant correlation between the
variables for each plot category are indicated with * p < 0.15, ** p < 0.10, *** p < 0.05.
109
4. Discussions
Impact of standards: Certification to private coffee standards fails to create a win-win outcome
for economic and ecological sustainability. Utz-Rainforest-4C increases coffee yields, labour
productivity and coffee incomes, and decreases the incidence of poverty but reduces on-farm ecosystem
services. Fairtrade-Organic results in higher ant and rove beetle abundance, larger tree diversity and
larger carbon storage on coffee fields but reduces yield, labour productivity and coffee incomes - despite
higher farm-gate prices. The latter relates to lower yields not being off-set by the Fairtrade-Organic
price premium: on average only 40% of the income loss from yield reduction is compensated by the
price premium of 10%vi. Findings do not uphold the claims private coffee standards make about their
impact. Fairtrade focuses most on improving smallholder wellbeing and reducing poverty but is found
to actually reduce productivity and smallholders’ income while Rainforest focuses more on nature
conservation but is found to create adverse ecological impacts.
Results can be put in perspective to previous studies on the economic and environmental impact
of coffee standards, although evidence from Africa is scarce. First, we find that Utz-Rainforest-4C
certification increases fertilizer, pesticide and fungicide use while other studies find no effect of
Rainforest certification on the use of agro-chemicals and organic fertilizers (Rueda & Lambin, 2013).
The finding that Utz-Rainforest-4C certification increases the use of shade trees, mulch and
intercropping with legumes is in line with results on Rainforest certification from Colombia (Rueda et
al, 2015; Rueda & Lambin, 2013) but contradicts findings from Brazil where no impact is found on soil
conservation measures (Hardt et al, 2015). Organic certification is mostly found to reduce agro-
chemical use and increases the use of organic fertilizer, shade trees and soil conservation measures
(Rueda & Lambin, 2013; Blackman & Naranjo, 2012). The estimated 21 pp reduction in pesticide use,
20 pp reduction in inorganic fertilizer use, 22 pp increase in animal manure use and 32 pp increase in
green manure use are smaller than other estimates of 40 to 70 pp reduction in agro-chemical use and
60 pp increase in organic fertilizer use (Blackman & Naranjo, 2012). Diverging results are likely related
to the overall lower rate of agro-chemical use and more wide-spread use of organic fertilizer in Mount
Elgon. Agronomic studies on Fairtrade certification hardly exist, except for a study on Rwanda
(Elder et al, 2013) reporting no impact on the use of pesticides, mulch and chemical fertilizer.
Second, the finding that Fairtrade-Organic certification adversely affects productivity and does not
improve the wellbeing of smallholder coffee farmers in spite of a price premium, corroborates earlier
results on Fairtrade and double Fairtrade-Organic certification not contributing to yield improvements,
farm incomes and profits, poverty reduction and/or improved living conditions (Mitiku et al, 2017; Jena
& Grote, 2017; Ibanez & Blackman, 2016; Valkila, 2009). Our results on the economic impact of Utz-
Rainforest-4C are in line with previous findings on Rainforest certification outperforming Fairtrade
because of a strong positive yield effect (Ruben & Zuniga, 2011). A study from Central Uganda

110
(Chiputwa et al, 2015) indicates a strong poverty- reducing impact of double Utz-Fairtrade certification
and finds no impact of double Utz-Organic and single Utz certification. Although caution is needed in
comparing results because of different years of observation and different coffee systems, these findings
might imply that from a producer point of view it is more effective to combine Fairtrade with Utz as
their respective focus on fair prices and on good agricultural practices plus yield improvements
respectively, results in reinforcing effects, than it is to combine Fairtrade with Organic certification.
Third, findings contradict earlier results that show no impact of Fairtrade-Organic and Organic
certification on ant and bird species richness (Philpott et al, 2007). We find that Fairtrade-Organic
certification creates substantial ecological benefits, which is in line with previous findings on Organic
certification increasing soil organic carbon (Blackman & Naranjo, 2012); tree diversity, basal area
and biomass (Haggar et al, 2015; Blackman & Naranjo, 2012; Philpott et al, 2007); and leaf litter ant
species richness (Armbrecht et al, 2005). We find adverse ecological effects of Utz-Rainforest-4C
certification while previous studies do point to larger tree diversity but no effect on species abundance
and diversity and on soil organic carbon (Haggar et al, 2015). Previous studies focus on Latin-America
and it is not straightforward to compare such results with findings from Eastern Uganda where poverty
is high, coffee fields a r e small and agro-chemical application i s low, with findings from middle-
income countries in Latin-America where farms are larger, farmers less poor and agro- chemical
application more common. Yet, divergent findings and the lack of on-site ecological benefits likely
relate to the combination of Rainforest certification with Utz that promotes agro-chemical use as good
agricultural practice and stipulates training on agro-chemical application.
Strengths and weaknesses: The multidisciplinary approach in this study results in unique
integrated insights on the socio-economic and ecological benefits and trade-offs of certification, and in
methodological improvements. The economic analysis on productivity, income and poverty effects is
based on econometric analysis of survey data, taking into account a large set of agro-ecological field
characteristics derived from GIS data. The ecological analysis on carbon stocks and tree and
invertebrate diversity is based on field measurements on certified and non-certified coffee fields,
with control fields carefully matched with certified fields based on agro-ecological as well as socio-
economic characteristics. A drawback is that only on-farm impacts are considered – which is
nevertheless in line with the on-field and on-farm sustainability focus of private coffee standards.
Requirements on environmental protection in private coffee standards may create environmental
impacts off-site, which requires landscape ecology in impact studies (Rueda et al, 2015; Tscharntke et
al, 2011). Economic benefits from private coffee standards may include broader village or cooperative
level effects, as suggested particularly for Fairtrade (Raynolds, 2012). Results are case specific but
do imply that there is room for improvement in the design of private coffee standards. The sustainability
implications of private coffee standards may differ in other regions where coffee is produced under
different agro-ecological, economic and institutional circumstances, or in other periods when climate
111
and market conditions are more conducive. Nevertheless, we conclude that private food standards in
the coffee sector do not always walk the talk.
5. Conclusions
In this chapter, we analyse the socio-economic and environmental implications of a double
Fairtrade-Organic and a triple Utz-Rainforest-4c coffee certification schemes in Eastern Uganda. We
combine economic and ecological methods in a multidisciplinary approach. Our results show that
Fairtrade-Organic certification creates ecological benefits at the expense of lower productivity and
income, and Utz-Rainforest-4C certification results in productivity and income gains at the expense of
lower biodiversity and carbon storage. Results imply that adoption of improved agronomic practices
and productivity effects are more important than value-adding and price effects in creating welfare
gains from private coffee standards. The income-enhancing and poverty-reducing effect of Utz-
Rainforest-4C certification is linked to substantial positive effects on land and labour productivity while
there is hardly a price premium for Utz-Rainforest-4C certified coffee and no home-processing. The
negative income effect and the insignificant poverty effect of Fairtrade-Organic certification result from
adverse effects on productivity that are not off-set by the current price premium or by home-processing
to fully washed coffee. Results support the view that improved agronomic practices are key for
increasing coffee productivity (Jassogne et al, 2013; Van Asten et al, 2011); that yields are more
important than prices in increasing returns for smallholder coffee farmers (Barham & Weber, 2012;
Perfecto et al, 2005); and that low intensity agriculture promoted by private food standards can trap
farmers into poverty (Valkila, 2009).
Results suggest that private food standards do not create a win-win outcome for economic and
ecological sustainability. Our results show that Utz-Rainforest-4C certification creates substantial
economic benefits but ecological impacts are adverse. Fairtrade-Organic certification leads to higher
carbon storage and biodiversity conservation but reduces productivity and economic returns. Despite
resulting in win-lose outcomes private food standards do contribute to reducing trade-offs between
economic and ecological goals. The production practices promoted by private food standards do allow
to increase productivity at a lower cost in terms of ecosystem services loss, which implies that
improving the sustainability of smallholder coffee production is possible. Our results do not support the
rationale of multiple certification to exploit the complementarities between private food standards with
a socio-economic focus (such as Fairtrade) and private food standards with an ecological focus (such
as Organic and Rainforest). Rather than multiple certification – which is likely demand-driven
and is strategically used to capture higher niche market share and as a product differentiation tool by
larger players in the chain – private food standards should be designed to compensate for existing trade-
offs between economic and ecological benefits. On the one hand, this might entail harmonization of
112
private food standards into a set of requirements that minimizes trade-offs between economic and
ecological outcomes and leads to win-win outcomes. On the other hand, this might entail differentiation
of private food standards to adapt requirements to local agro-ecological and economic conditionsvii
.
An adverse economic or ecological impact of private food standards could result either from a
lack of effectiveness of private food standards to improve sustainability or from a lack of compliance
to private food standards – or both. We find that private food standards are not strictly complied to but
do affect agronomic practices on coffee fields and that these practices are correlated with productivity,
carbon storage and biodiversity. Improving the sustainability impact of private food standards likely
entails a focus on both better control and enforcement mechanisms, and more effective requirements
linked to the standards. Yet without the latter, the former is meaningless and merely extracts rents from
supply chains. This multidisciplinary analysis of agronomic, economic and environmental impacts of
smallholder coffee certification, shows that private sustainability standards do not always walk
the talk. Results are relevant for 25 million smallholder farmers depending on coffee as main income
source, for consumers concerned about sustainable food consumption, for organizations and companies
initiating and adopting private food standards, and for donors supporting smallholder certification
schemes.

113
i Quoted from www.fairtrade.net, www.rainforest-alliance.org and www.utz.org.
ii The term field is used to refer to coffee gardens, with one farmer often having multiple coffee gardens. The term plot is
used to refer to rectangular areas in a field in which biophysical measurements were made.
iii
Dorylus are not considered because of their nomadic life style and very variable numbers of foraging workers - species
perform huge swarm raids along the ground and lower vegetation with hundreds of thousands of polymorphic workers
(Gotwald, 1995). Pheidole and Myrmicaria species were hard to sort into morphospecies groups because of their extreme
abundance – present in resp. 85% and 99% of plots and over 1000 specimen per plot.
iv
BCU was a state-controlled cooperative that collapsed in 1997 and farmers with a bad experience in BCU are less likely to
engage in coffee cooperatives and contracting schemes again.
v
During in-depth interviews 40% of farmers admits to occasionally use chemical pesticides in Fairtrade-Organic fields.
vi This is derived as follows: for the average farmer the negative income effect of yield reduction is 627,021 UGX (i.e. 1,112
kg/ha yield reduction * 0.6 ha coffee on average * 3,947 UGX / kg for non-certified coffee * 0.2381 conversion from fresh to
fully washed coffee); only 40% of this negative income effect or 248,180 UGX (i.e. a positive price effect of 417 UGX/kg *
4,166 kg / ha for non-certified coffee * 0.6 ha coffee on average * 0.2381 conversion from fresh to fully washed coffee) is
compensated by the price premium of 10% or 417 UGX / kg in the 2013-2014 season.
vii
For Uganda in particular this might imply taking into account the reality of a coffee-banana intercropping system (Van Asten et al, 2011; Jassogne et al, 2013).
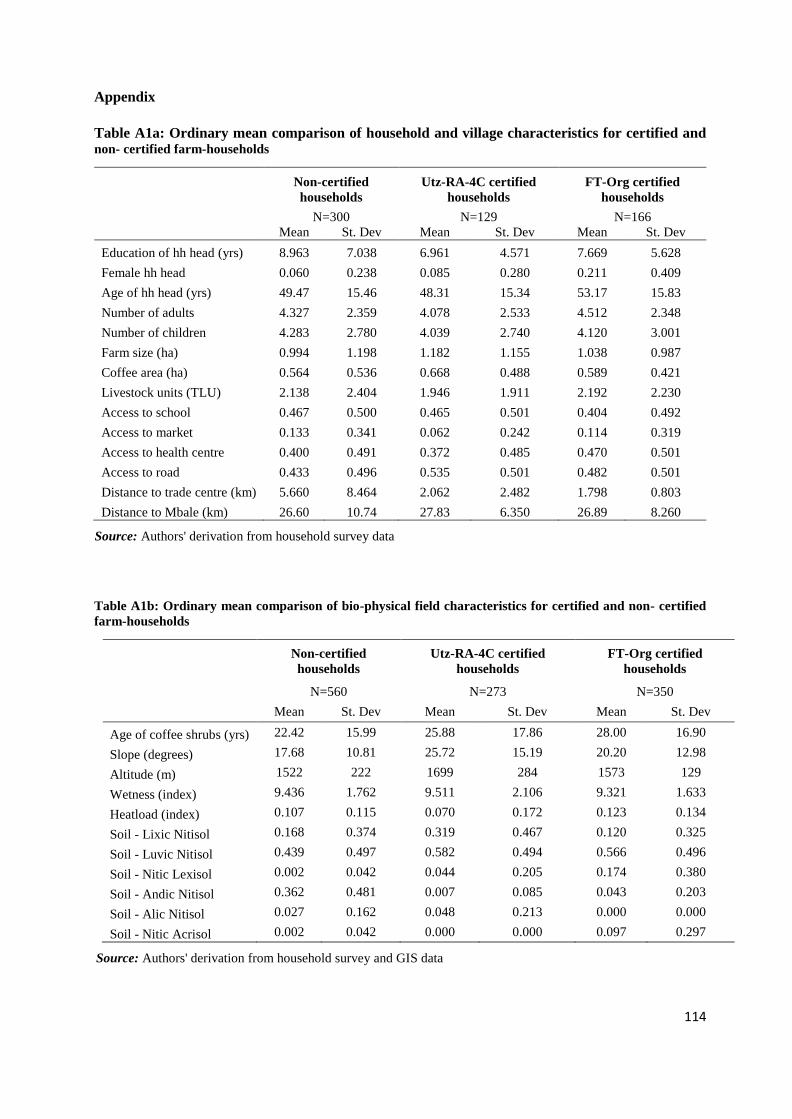
114
Appendix
Table A1a: Ordinary mean comparison of household and village characteristics for certified and non- certified farm-households
Non-certified
households
Utz-RA-4C certified
households
FT-Org certified
households
N=300 N=129 N=166
Mean St. Dev Mean St. Dev Mean St. Dev
Education of hh head (yrs) 8.963 7.038 6.961 4.571 7.669 5.628
Female hh head 0.060 0.238 0.085 0.280 0.211 0.409
Age of hh head (yrs) 49.47 15.46 48.31 15.34 53.17 15.83
Number of adults 4.327 2.359 4.078 2.533 4.512 2.348
Number of children 4.283 2.780 4.039 2.740 4.120 3.001
Farm size (ha) 0.994 1.198 1.182 1.155 1.038 0.987
Coffee area (ha) 0.564 0.536 0.668 0.488 0.589 0.421
Livestock units (TLU) 2.138 2.404 1.946 1.911 2.192 2.230
Access to school 0.467 0.500 0.465 0.501 0.404 0.492
Access to market 0.133 0.341 0.062 0.242 0.114 0.319
Access to health centre 0.400 0.491 0.372 0.485 0.470 0.501
Access to road 0.433 0.496 0.535 0.501 0.482 0.501
Distance to trade centre (km) 5.660 8.464 2.062 2.482 1.798 0.803
Distance to Mbale (km) 26.60 10.74 27.83 6.350 26.89 8.260
Source: Authors' derivation from household survey data
Table A1b: Ordinary mean comparison of bio-physical field characteristics for certified and non- certified
farm-households
Non-certified
households
Utz-RA-4C certified
households
FT-Org certified
households
N=560 N=273 N=350
Mean St. Dev Mean St. Dev Mean St. Dev
Age of coffee shrubs (yrs) 22.42 15.99 25.88 17.86 28.00 16.90
Slope (degrees) 17.68 10.81 25.72 15.19 20.20 12.98
Altitude (m) 1522 222 1699 284 1573 129
Wetness (index) 9.436 1.762 9.511 2.106 9.321 1.633
Heatload (index) 0.107 0.115 0.070 0.172 0.123 0.134
Soil - Lixic Nitisol 0.168 0.374 0.319 0.467 0.120 0.325
Soil - Luvic Nitisol 0.439 0.497 0.582 0.494 0.566 0.496
Soil - Nitic Lexisol 0.002 0.042 0.044 0.205 0.174 0.380
Soil - Andic Nitisol 0.362 0.481 0.007 0.085 0.043 0.203
Soil - Alic Nitisol 0.027 0.162 0.048 0.213 0.000 0.000
Soil - Nitic Acrisol 0.002 0.042 0.000 0.000 0.097 0.297
Source: Authors' derivation from household survey and GIS data
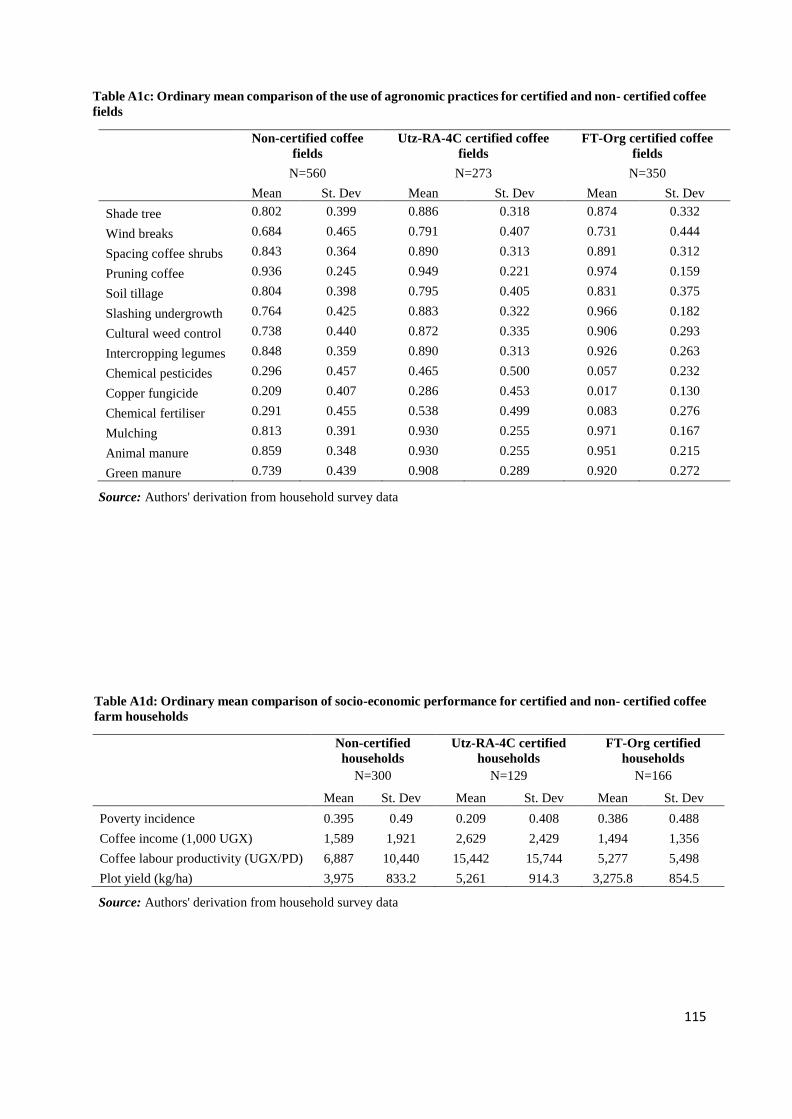
115
Table A1c: Ordinary mean comparison of the use of agronomic practices for certified and non- certified coffee
fields
Non-certified coffee
fields
Utz-RA-4C certified coffee
fields
FT-Org certified coffee
fields
N=560 N=273 N=350
Mean St. Dev Mean St. Dev Mean St. Dev
Shade tree 0.802 0.399 0.886 0.318 0.874 0.332
Wind breaks 0.684 0.465 0.791 0.407 0.731 0.444
Spacing coffee shrubs 0.843 0.364 0.890 0.313 0.891 0.312
Pruning coffee 0.936 0.245 0.949 0.221 0.974 0.159
Soil tillage 0.804 0.398 0.795 0.405 0.831 0.375
Slashing undergrowth 0.764 0.425 0.883 0.322 0.966 0.182
Cultural weed control 0.738 0.440 0.872 0.335 0.906 0.293
Intercropping legumes 0.848 0.359 0.890 0.313 0.926 0.263
Chemical pesticides 0.296 0.457 0.465 0.500 0.057 0.232
Copper fungicide 0.209 0.407 0.286 0.453 0.017 0.130
Chemical fertiliser 0.291 0.455 0.538 0.499 0.083 0.276
Mulching 0.813 0.391 0.930 0.255 0.971 0.167
Animal manure 0.859 0.348 0.930 0.255 0.951 0.215
Green manure 0.739 0.439 0.908 0.289 0.920 0.272
Source: Authors' derivation from household survey data
Table A1d: Ordinary mean comparison of socio-economic performance for certified and non- certified coffee
farm households
Non-certified
households
Utz-RA-4C certified
households
FT-Org certified
households
N=300 N=129 N=166
Mean St. Dev Mean St. Dev Mean St. Dev
Poverty incidence 0.395 0.49 0.209 0.408 0.386 0.488
Coffee income (1,000 UGX) 1,589 1,921 2,629 2,429 1,494 1,356
Coffee labour productivity (UGX/PD) 6,887 10,440 15,442 15,744 5,277 5,498
Plot yield (kg/ha) 3,975 833.2 5,261 914.3 3,275.8 854.5
Source: Authors' derivation from household survey data

116
Table A2: First stage regression results maximum likelihood instrumental variable regressions
Utz-RA-4C certification FT-Org certification
Coefficient
Robust st.
error P-value Coefficient
Robust st.
error P-value
Excluded instruments
Distance to washing st. -0.19409 0.00939 0.00000 -0.05321 0.01219 0.00000
Distance to washing st.2 0.00770 0.00048 0.00000 0.00513 0.00074 0.00000
BCU years -0.00042 0.00131 0.74600 -0.00771 0.00205 0.00000
Included covariates
Education of hh head -0.00213 0.00166 0.19800 -0.00078 0.00308 0.80100
Female hh head -0.04766 0.02846 0.09500 0.14534 0.06117 0.01800
Age of hh head 0.00067 0.00353 0.84900 0.00036 0.00768 0.96300
Age of hh head - square 0.00000 0.00003 0.99200 0.00002 0.00007 0.77000
Number of adults -0.00570 0.00674 0.39800 0.00544 0.01109 0.62400
Number of children 0.00606 0.00575 0.29200 -0.00415 0.00866 0.63200
Coffee area 0.10826 0.06306 0.08700 0.10010 0.09255 0.28000
Coffee area - square -0.02601 0.02667 0.33000 -0.05098 0.03500 0.14600
Livestock units 0.00620 0.00449 0.16800 -0.00251 0.00628 0.69000
Slope (weighted av.) -0.00467 0.00193 0.01600 0.00260 0.00281 0.35500
Altitude (weighted av.) 0.00024 0.00005 0.00000 0.00003 0.00008 0.72000
Wetness (weighted av.) -0.02416 0.00647 0.00000 -0.01675 0.01077 0.12000
Heat load (weighted av.) -0.57538 0.17261 0.00100 0.85210 0.22980 0.00000
Access to school 0.08508 0.02205 0.00000 -0.06047 0.03264 0.06400
Access to market -0.02961 0.02362 0.21100 -0.01578 0.03577 0.65900
Access to health centre 0.02370 0.04783 0.62000 0.16375 0.05511 0.00300
Access to road -0.05574 0.02718 0.04100 0.01708 0.04751 0.71900
Distance to trade centre -0.00257 0.00222 0.24700 -0.01114 0.00274 0.00000
Distance to Mbale -0.00820 0.00272 0.00300 -0.00783 0.00572 0.17200
District - Bulambuli 0.15348 0.05313 0.00400 -0.01224 0.09721 0.90000
District - Kapchorwa 0.44952 0.07622 0.00000 -0.11583 0.14707 0.43100
District - Manafa 0.35514 0.04668 0.00000 -0.35950 0.08550 0.00000
District - Sironko 0.38854 0.04548 0.00000 -0.16778 0.05564 0.00300
Constant 0.88341 0.14299 0.00000 0.53657 0.23738 0.02400
N-observations 595 595
Centred R2 0.597 0.291
Partial R2 of excluded instruments 0.539 0.140
F-test for excluded instruments 245.2 40.12
P-value < 0.0001 < 0.0001
Notes: The Kleibergen-Paap test for overall under identification reveals an LM test statistic of 59.34 and a p-value <
0.0001; The Kleibergen-Paap test for weak identification reveals a Wald F statistic of 34.67, which is above the 10%
Stock-Yogo critical value of 13.43.
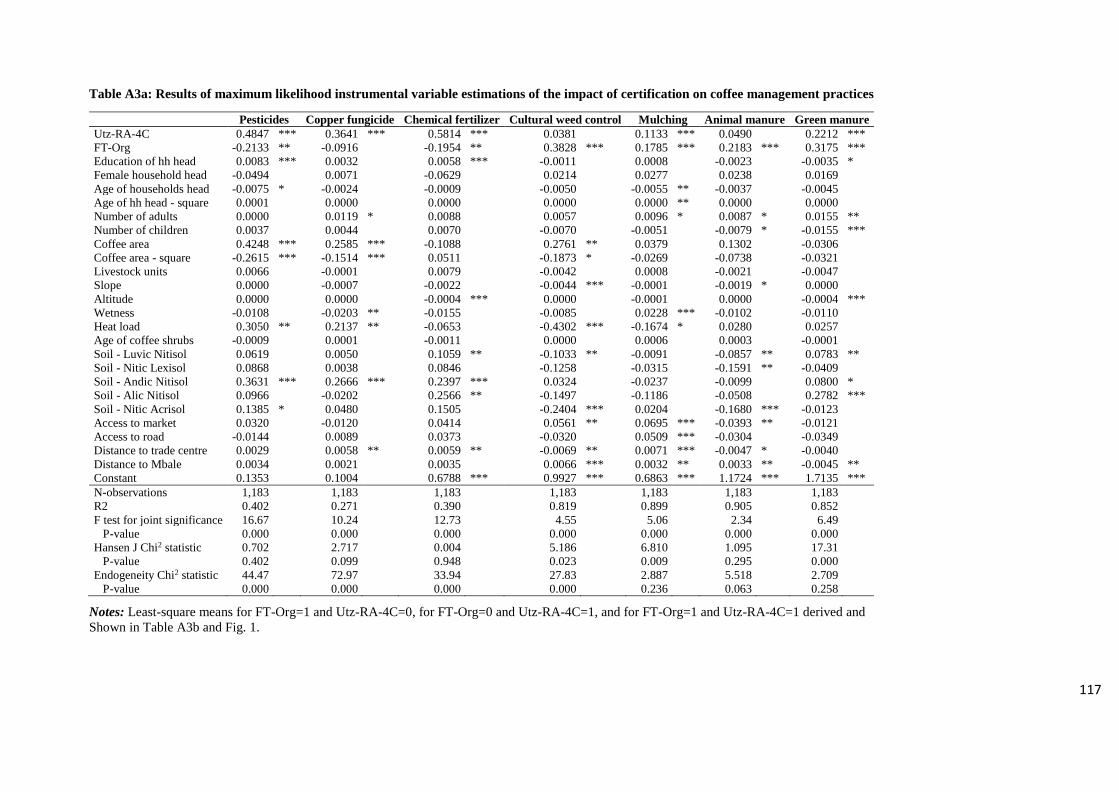
117
Table A3a: Results of maximum likelihood instrumental variable estimations of the impact of certification on coffee management practices
Pesticides Copper fungicide Chemical fertilizer Cultural weed control Mulching Animal manure Green manure
Utz-RA-4C 0.4847 *** 0.3641 *** 0.5814 *** 0.0381 0.1133 *** 0.0490 0.2212 ***
FT-Org -0.2133 ** -0.0916 -0.1954 ** 0.3828 *** 0.1785 *** 0.2183 *** 0.3175 ***
Education of hh head 0.0083 *** 0.0032 0.0058 *** -0.0011 0.0008 -0.0023 -0.0035 *
Female household head -0.0494 0.0071 -0.0629 0.0214 0.0277 0.0238 0.0169 Age of households head -0.0075 * -0.0024 -0.0009 -0.0050 -0.0055 ** -0.0037 -0.0045 Age of hh head - square 0.0001 0.0000 0.0000 0.0000 0.0000 ** 0.0000 0.0000 Number of adults 0.0000 0.0119 * 0.0088 0.0057 0.0096 * 0.0087 * 0.0155 **
Number of children 0.0037 0.0044 0.0070 -0.0070 -0.0051 -0.0079 * -0.0155 ***
Coffee area 0.4248 *** 0.2585 *** -0.1088 0.2761 ** 0.0379 0.1302 -0.0306 Coffee area - square -0.2615 *** -0.1514 *** 0.0511 -0.1873 * -0.0269 -0.0738 -0.0321 Livestock units 0.0066 -0.0001 0.0079 -0.0042 0.0008 -0.0021 -0.0047 Slope 0.0000 -0.0007 -0.0022 -0.0044 *** -0.0001 -0.0019 * 0.0000 Altitude 0.0000 0.0000 -0.0004 *** 0.0000 -0.0001 0.0000 -0.0004 ***
Wetness -0.0108 -0.0203 ** -0.0155 -0.0085 0.0228 *** -0.0102 -0.0110 Heat load 0.3050 ** 0.2137 ** -0.0653 -0.4302 *** -0.1674 * 0.0280 0.0257 Age of coffee shrubs -0.0009 0.0001 -0.0011 0.0000 0.0006 0.0003 -0.0001 Soil - Luvic Nitisol 0.0619 0.0050 0.1059 ** -0.1033 ** -0.0091 -0.0857 ** 0.0783 **
Soil - Nitic Lexisol 0.0868 0.0038 0.0846 -0.1258 -0.0315 -0.1591 ** -0.0409 Soil - Andic Nitisol 0.3631 *** 0.2666 *** 0.2397 *** 0.0324 -0.0237 -0.0099 0.0800 *
Soil - Alic Nitisol 0.0966 -0.0202 0.2566 ** -0.1497 -0.1186 -0.0508 0.2782 ***
Soil - Nitic Acrisol 0.1385 * 0.0480 0.1505 -0.2404 *** 0.0204 -0.1680 *** -0.0123 Access to market 0.0320 -0.0120 0.0414 0.0561 ** 0.0695 *** -0.0393 ** -0.0121 Access to road -0.0144 0.0089 0.0373 -0.0320 0.0509 *** -0.0304 -0.0349 Distance to trade centre 0.0029 0.0058 ** 0.0059 ** -0.0069 ** 0.0071 *** -0.0047 * -0.0040 Distance to Mbale 0.0034 0.0021 0.0035 0.0066 *** 0.0032 ** 0.0033 ** -0.0045 **
Constant 0.1353 0.1004 0.6788 *** 0.9927 *** 0.6863 *** 1.1724 *** 1.7135 ***
N-observations 1,183 1,183 1,183 1,183 1,183 1,183 1,183 R2 0.402 0.271 0.390 0.819 0.899 0.905 0.852 F test for joint significance 16.67 10.24 12.73 4.55 5.06 2.34 6.49 P-value 0.000 0.000 0.000 0.000 0.000 0.000 0.000 Hansen J Chi2 statistic 0.702 2.717 0.004 5.186 6.810 1.095 17.31 P-value 0.402 0.099 0.948 0.023 0.009 0.295 0.000 Endogeneity Chi2 statistic 44.47 72.97 33.94 27.83 2.887 5.518 2.709 P-value 0.000 0.000 0.000 0.000 0.236 0.063 0.258
Notes: Least-square means for FT-Org=1 and Utz-RA-4C=0, for FT-Org=0 and Utz-RA-4C=1, and for FT-Org=1 and Utz-RA-4C=1 derived and
Shown in Table A3b and Fig. 1.

118
Table A3a: Results of maximum likelihood instrumental variable estimations of the impact of certification on coffee management practices (continued)
Shade
trees
Wind
breaks
Soil
tillage
Inter-
cropping Slashing Spacing Pruning
Utz-RA-4C 0.235 *** 0.052 -0.023 0.116 *** 0.155 *** -0.101 *** -0.012 FT-Org 0.096 -0.489 *** 0.539 *** 0.112 0.256 *** 0.181 ** 0.068 Education of hh head 0.005 *** 0.005 ** 0.003 0.001 0.003 * 0.001 -0.001 Female hh head -0.024 0.044 -0.032 0.026 0.001 0.048 0.006 Age of hh head -0.002 0.000 -0.012 *** -0.008 *** -0.001 -0.003 -0.004 **
Age of hh head - square 0.000 0.000 0.000 *** 0.000 ** 0.000 0.000 0.000 **
Number of adults 0.018 *** 0.009 -0.007 0.012 ** -0.005 0.013 ** 0.001 Number of children -0.006 0.002 0.008 -0.005 0.013 ** 0.001 -0.005 Coffee area 0.056 0.212 -0.020 -0.092 -0.093 0.030 0.134 *
Coffee area - square -0.048 -0.156 * 0.022 0.010 0.047 -0.012 -0.080 Livestock units 0.000 0.001 0.001 0.001 * 0.000 0.001 * 0.001 Slope -0.008 * -0.009 * -0.005 -0.008 * -0.004 0.008 ** 0.000 Altitude -0.001 0.005 *** -0.002 0.001 0.000 -0.002 * -0.001 Wetness 0.000 ** 0.000 0.000 0.000 ** 0.000 0.000 * 0.000 Heatload -0.007 0.027 *** 0.001 -0.005 -0.008 0.004 -0.006 Age of coffee schrubs -0.026 0.203 -0.524 *** 0.023 -0.057 -0.266 ** -0.112 *
Soil - Luvic Nitisol -0.032 -0.052 -0.087 ** 0.008 0.155 *** -0.105 *** -0.033 Soil - Nitic Lexisol 0.047 0.336 *** -0.426 *** 0.009 0.084 -0.191 ** -0.034 Soil - Andic Nitisol 0.123 *** -0.249 *** 0.206 *** 0.036 0.186 *** -0.134 *** -0.019 Soil - Alic Nitisol -0.336 *** -0.367 *** -0.137 -0.077 -0.215 * -0.321 *** -0.239 **
Soil - Nitic Acrisol -0.014 0.027 -0.324 *** 0.025 0.133 ** -0.236 *** -0.056 Access to market 0.073 *** 0.051 -0.113 *** 0.033 * 0.012 -0.069 *** -0.005 Access to road -0.004 -0.016 -0.133 *** -0.057 ** -0.026 -0.038 -0.012 Distance to trade center 0.002 0.002 -0.010 *** 0.001 -0.002 0.000 0.000 Distance to Mbale -0.003 * 0.005 0.000 -0.007 *** -0.009 *** 0.000 0.006 ***
Constant 1.197 *** 0.287 1.262 *** 1.529 *** 1.001 *** 0.732 *** 1.106 ***
N-observations 1,183 1,183 1,183 1,183 1,183 1,183 1,183
R2 0.863 0.686 0.782 0.895 0.877 0.867 0.953 F test for joint significance 5.280 4.430 5.460 4.610 9.620 3.000 2.070 P-value 0.000 0.000 0.000 0.000 0.000 0.000 0.000 Hansen J Chi2 statistic 0.208 0.527 15.143 18.543 13.535 1.207 0.006 P-value 0.648 0.468 0.000 0.000 0.000 0.272 0.938 Endogeneity Chi2 statistic 3.751 21.39 30.52 3.909 2.647 37.00 8.660 P-value 0.153 0.000 0.000 0.142 0.266 0.000 0.013
Notes: Least-square means for FT-Org=1 and Utz-RA-4C=0, for FT-Org=0 and Utz-RA-4C=1, and for FT-Org=1 and Utz-RA-4C=1 derived and shown in Table A3b and Figure 1.
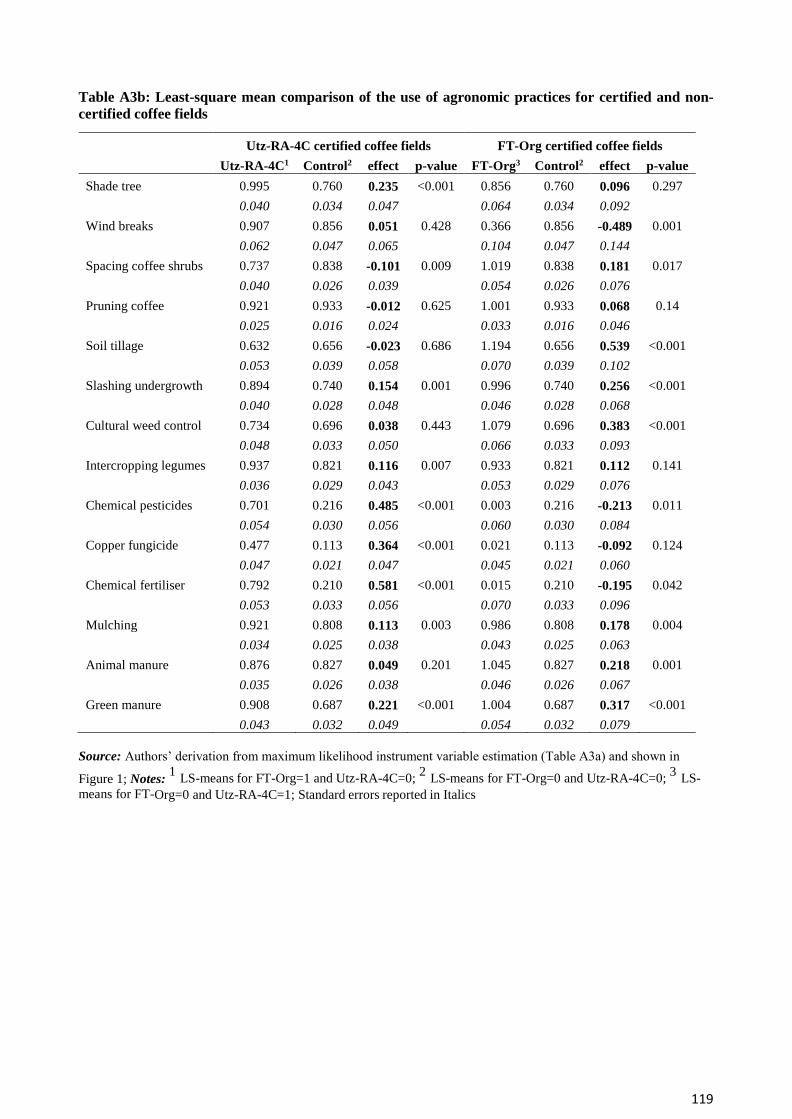
119
Table A3b: Least-square mean comparison of the use of agronomic practices for certified and non-
certified coffee fields
Utz-RA-4C certified coffee fields FT-Org certified coffee fields
Utz-RA-4C1 Control2 effect p-value FT-Org3 Control2 effect p-value
Shade tree 0.995 0.760 0.235 <0.001 0.856 0.760 0.096 0.297
0.040 0.034 0.047 0.064 0.034 0.092
Wind breaks 0.907 0.856 0.051 0.428 0.366 0.856 -0.489 0.001
0.062 0.047 0.065 0.104 0.047 0.144
Spacing coffee shrubs 0.737 0.838 -0.101 0.009 1.019 0.838 0.181 0.017
0.040 0.026 0.039 0.054 0.026 0.076
Pruning coffee 0.921 0.933 -0.012 0.625 1.001 0.933 0.068 0.14
0.025 0.016 0.024 0.033 0.016 0.046
Soil tillage 0.632 0.656 -0.023 0.686 1.194 0.656 0.539 <0.001
0.053 0.039 0.058 0.070 0.039 0.102
Slashing undergrowth 0.894 0.740 0.154 0.001 0.996 0.740 0.256 <0.001
0.040 0.028 0.048 0.046 0.028 0.068
Cultural weed control 0.734 0.696 0.038 0.443 1.079 0.696 0.383 <0.001
0.048 0.033 0.050 0.066 0.033 0.093
Intercropping legumes 0.937 0.821 0.116 0.007 0.933 0.821 0.112 0.141
0.036 0.029 0.043 0.053 0.029 0.076
Chemical pesticides 0.701 0.216 0.485 <0.001 0.003 0.216 -0.213 0.011
0.054 0.030 0.056 0.060 0.030 0.084
Copper fungicide 0.477 0.113 0.364 <0.001 0.021 0.113 -0.092 0.124
0.047 0.021 0.047 0.045 0.021 0.060
Chemical fertiliser 0.792 0.210 0.581 <0.001 0.015 0.210 -0.195 0.042
0.053 0.033 0.056 0.070 0.033 0.096
Mulching 0.921 0.808 0.113 0.003 0.986 0.808 0.178 0.004
0.034 0.025 0.038 0.043 0.025 0.063
Animal manure 0.876 0.827 0.049 0.201 1.045 0.827 0.218 0.001
0.035 0.026 0.038 0.046 0.026 0.067
Green manure 0.908 0.687 0.221 <0.001 1.004 0.687 0.317 <0.001
0.043 0.032 0.049 0.054 0.032 0.079
Source: Authors’ derivation from maximum likelihood instrument variable estimation (Table A3a) and shown in
Figure 1; Notes: 1
LS-means for FT-Org=1 and Utz-RA-4C=0; 2
LS-means for FT-Org=0 and Utz-RA-4C=0; 3
LS-
means for FT-Org=0 and Utz-RA-4C=1; Standard errors reported in Italics
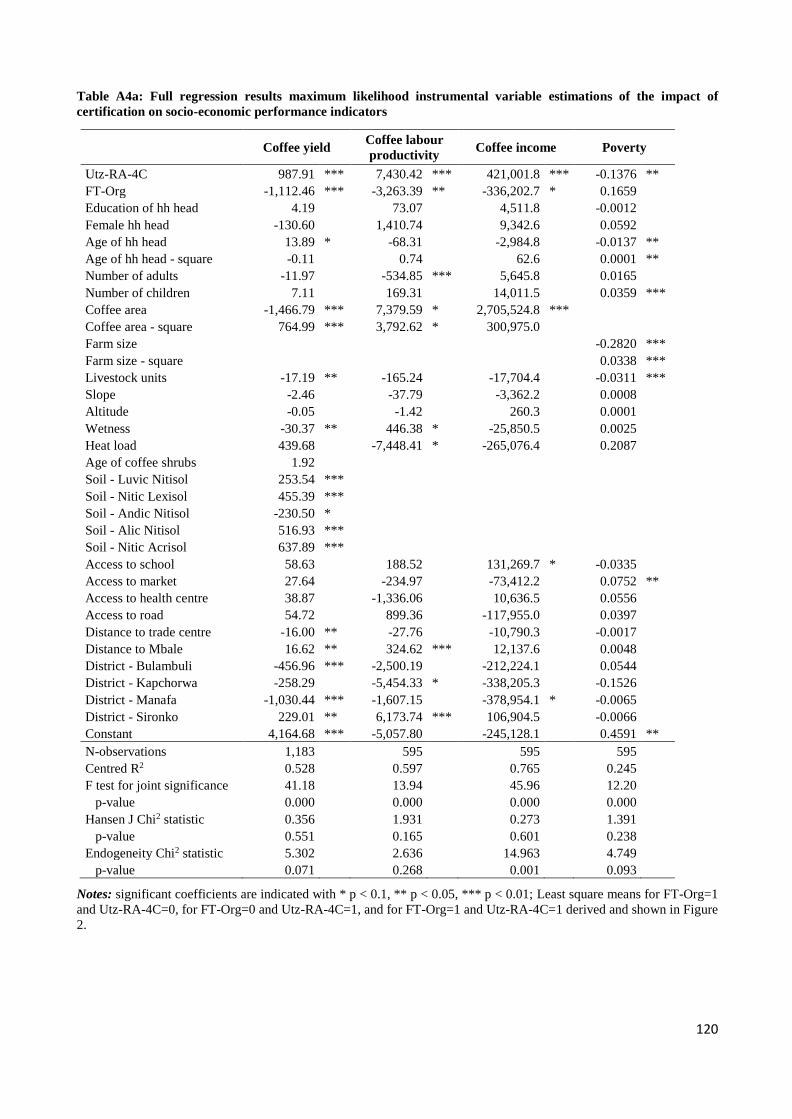
120
Table A4a: Full regression results maximum likelihood instrumental variable estimations of the impact of
certification on socio-economic performance indicators
Coffee yield
Coffee labour
productivity Coffee income Poverty
Utz-RA-4C 987.91 *** 7,430.42 *** 421,001.8 *** -0.1376 **
FT-Org -1,112.46 *** -3,263.39 ** -336,202.7 * 0.1659 Education of hh head 4.19 73.07 4,511.8 -0.0012 Female hh head -130.60 1,410.74 9,342.6 0.0592 Age of hh head 13.89 * -68.31 -2,984.8 -0.0137 **
Age of hh head - square -0.11 0.74 62.6 0.0001 **
Number of adults -11.97 -534.85 *** 5,645.8 0.0165 Number of children 7.11 169.31 14,011.5 0.0359 ***
Coffee area -1,466.79 *** 7,379.59 * 2,705,524.8 *** Coffee area - square 764.99 *** 3,792.62 * 300,975.0 Farm size -0.2820 ***
Farm size - square 0.0338 ***
Livestock units -17.19 ** -165.24 -17,704.4 -0.0311 ***
Slope -2.46 -37.79 -3,362.2 0.0008 Altitude -0.05 -1.42 260.3 0.0001 Wetness -30.37 ** 446.38 * -25,850.5 0.0025 Heat load 439.68 -7,448.41 * -265,076.4 0.2087 Age of coffee shrubs 1.92 Soil - Luvic Nitisol 253.54 *** Soil - Nitic Lexisol 455.39 *** Soil - Andic Nitisol -230.50 * Soil - Alic Nitisol 516.93 *** Soil - Nitic Acrisol 637.89 *** Access to school 58.63 188.52 131,269.7 * -0.0335 Access to market 27.64 -234.97 -73,412.2 0.0752 **
Access to health centre 38.87 -1,336.06 10,636.5 0.0556 Access to road 54.72 899.36 -117,955.0 0.0397 Distance to trade centre -16.00 ** -27.76 -10,790.3 -0.0017 Distance to Mbale 16.62 ** 324.62 *** 12,137.6 0.0048 District - Bulambuli -456.96 *** -2,500.19 -212,224.1 0.0544 District - Kapchorwa -258.29 -5,454.33 * -338,205.3 -0.1526 District - Manafa -1,030.44 *** -1,607.15 -378,954.1 * -0.0065 District - Sironko 229.01 ** 6,173.74 *** 106,904.5 -0.0066 Constant 4,164.68 *** -5,057.80 -245,128.1 0.4591 **
N-observations 1,183 595 595 595 Centred R2 0.528 0.597 0.765 0.245 F test for joint significance 41.18 13.94 45.96 12.20 p-value 0.000 0.000 0.000 0.000 Hansen J Chi2 statistic 0.356 1.931 0.273 1.391 p-value 0.551 0.165 0.601 0.238 Endogeneity Chi2 statistic 5.302 2.636 14.963 4.749 p-value 0.071 0.268 0.001 0.093
Notes: significant coefficients are indicated with * p < 0.1, ** p < 0.05, *** p < 0.01; Least square means for FT-Org=1
and Utz-RA-4C=0, for FT-Org=0 and Utz-RA-4C=1, and for FT-Org=1 and Utz-RA-4C=1 derived and shown in Figure
2.
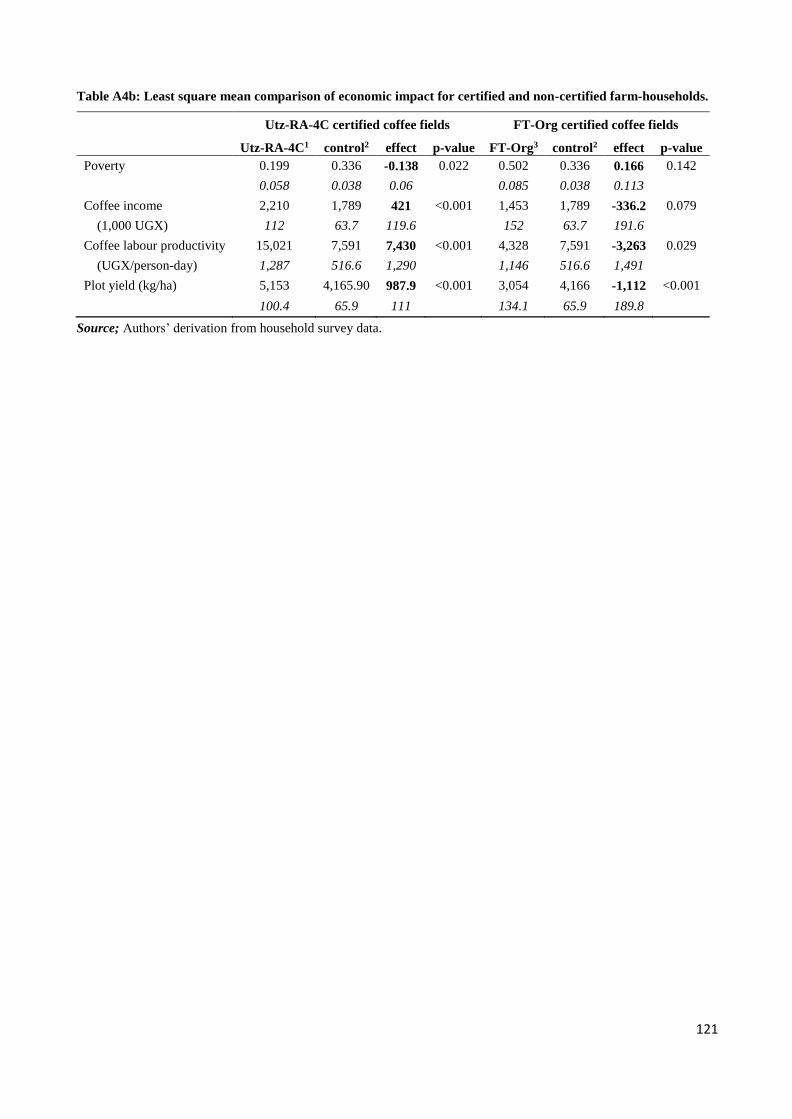
121
Table A4b: Least square mean comparison of economic impact for certified and non-certified farm-households.
Utz-RA-4C certified coffee fields FT-Org certified coffee fields
Utz-RA-4C1 control2 effect p-value FT-Org3 control2 effect p-value
Poverty 0.199 0.336 -0.138 0.022 0.502 0.336 0.166 0.142
0.058 0.038 0.06 0.085 0.038 0.113
Coffee income 2,210 1,789 421 <0.001 1,453 1,789 -336.2 0.079
(1,000 UGX) 112 63.7 119.6 152 63.7 191.6
Coffee labour productivity 15,021 7,591 7,430 <0.001 4,328 7,591 -3,263 0.029
(UGX/person-day) 1,287 516.6 1,290 1,146 516.6 1,491
Plot yield (kg/ha) 5,153 4,165.90 987.9 <0.001 3,054 4,166 -1,112 <0.001
100.4 65.9 111 134.1 65.9 189.8
Source; Authors’ derivation from household survey data.
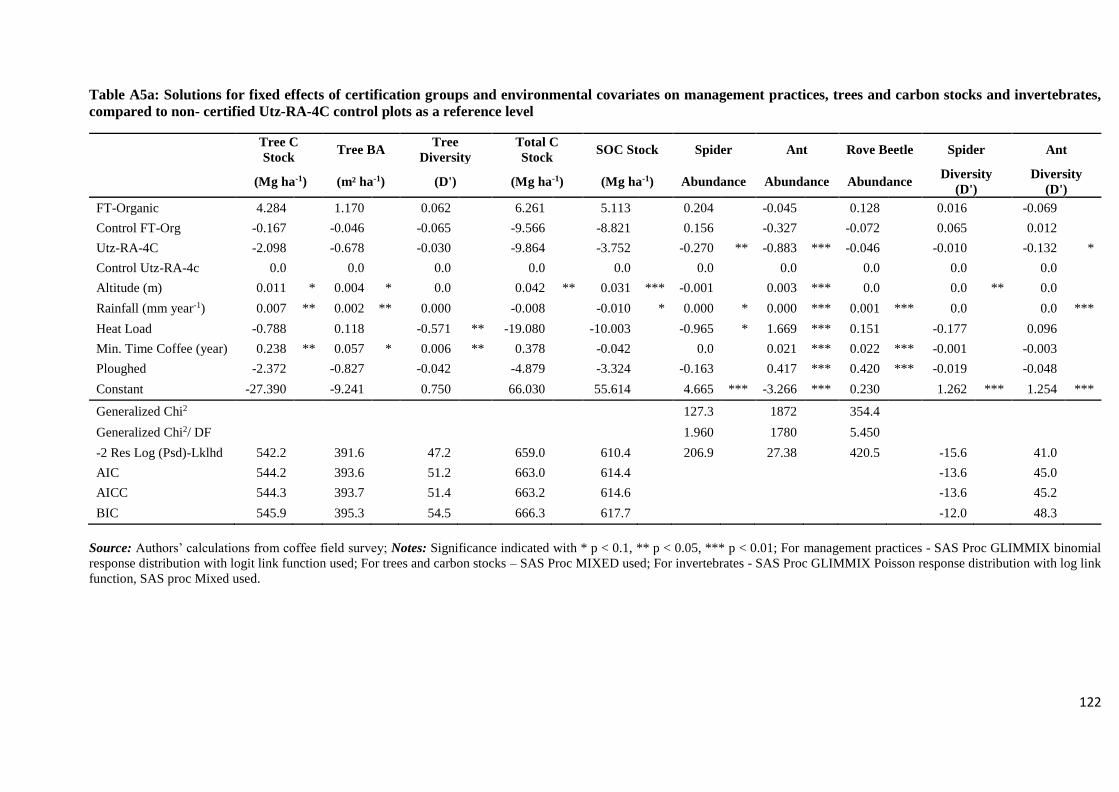
122
Table A5a: Solutions for fixed effects of certification groups and environmental covariates on management practices, trees and carbon stocks and invertebrates,
compared to non- certified Utz-RA-4C control plots as a reference level
Tree C
Stock Tree BA
Tree
Diversity
Total C
Stock SOC Stock Spider Ant Rove Beetle Spider Ant
(Mg ha-1) (m² ha-1) (D') (Mg ha-1) (Mg ha-1) Abundance Abundance Abundance Diversity
(D')
Diversity
(D')
FT-Organic 4.284 1.170 0.062 6.261 5.113 0.204 -0.045 0.128 0.016 -0.069
Control FT-Org -0.167 -0.046 -0.065 -9.566 -8.821 0.156 -0.327 -0.072 0.065 0.012
Utz-RA-4C -2.098 -0.678 -0.030 -9.864 -3.752 -0.270 ** -0.883 *** -0.046 -0.010 -0.132 *
Control Utz-RA-4c 0.0 0.0 0.0 0.0 0.0 0.0 0.0 0.0 0.0 0.0
Altitude (m) 0.011 * 0.004 * 0.0 0.042 ** 0.031 *** -0.001 0.003 *** 0.0 0.0 ** 0.0
Rainfall (mm year-1) 0.007 ** 0.002 ** 0.000 -0.008 -0.010 * 0.000 * 0.000 *** 0.001 *** 0.0 0.0 ***
Heat Load -0.788 0.118 -0.571 ** -19.080 -10.003 -0.965 * 1.669 *** 0.151 -0.177 0.096
Min. Time Coffee (year) 0.238 ** 0.057 * 0.006 ** 0.378 -0.042 0.0 0.021 *** 0.022 *** -0.001 -0.003
Ploughed -2.372 -0.827 -0.042 -4.879 -3.324 -0.163 0.417 *** 0.420 *** -0.019 -0.048
Constant -27.390 -9.241 0.750 66.030 55.614 4.665 *** -3.266 *** 0.230 1.262 *** 1.254 ***
Generalized Chi2 127.3 1872 354.4
Generalized Chi2/ DF 1.960 1780 5.450
-2 Res Log (Psd)-Lklhd 542.2 391.6 47.2 659.0 610.4 206.9 27.38 420.5 -15.6 41.0
AIC 544.2 393.6 51.2 663.0 614.4 -13.6 45.0
AICC 544.3 393.7 51.4 663.2 614.6 -13.6 45.2
BIC 545.9 395.3 54.5 666.3 617.7 -12.0 48.3
Source: Authors’ calculations from coffee field survey; Notes: Significance indicated with * p < 0.1, ** p < 0.05, *** p < 0.01; For management practices - SAS Proc GLIMMIX binomial
response distribution with logit link function used; For trees and carbon stocks – SAS Proc MIXED used; For invertebrates - SAS Proc GLIMMIX Poisson response distribution with log link
function, SAS proc Mixed used.
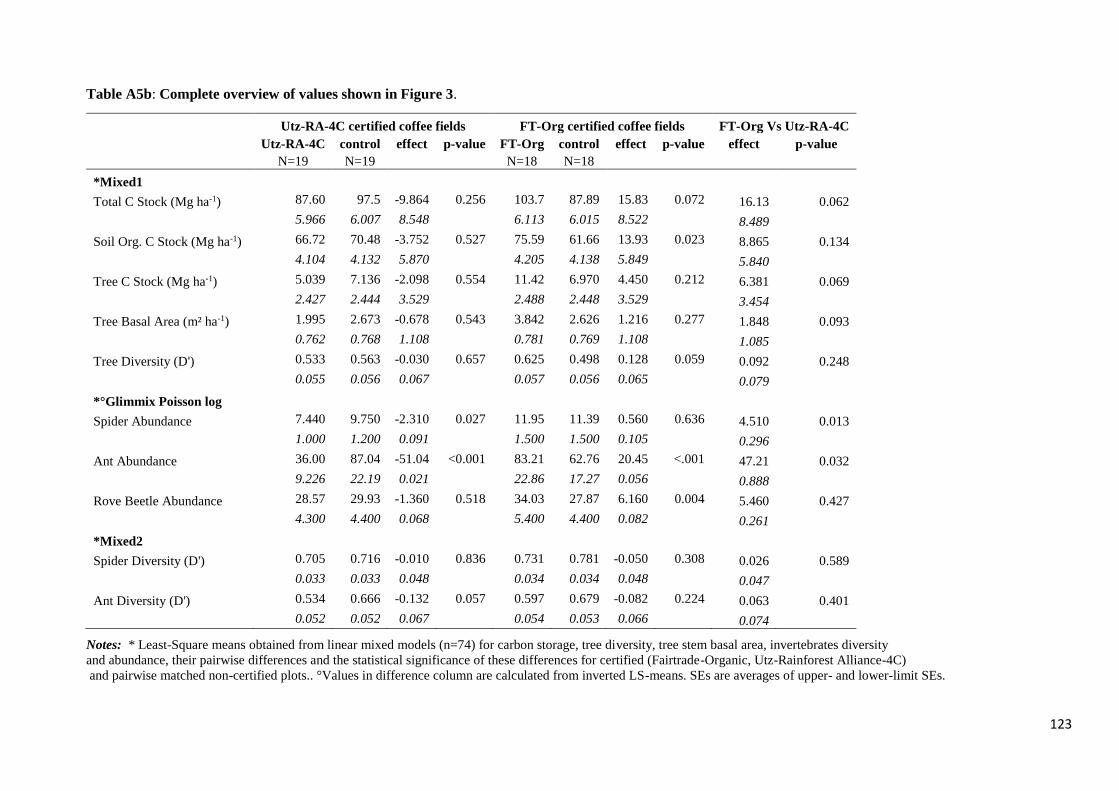
123
Table A5b: Complete overview of values shown in Figure 3.
Utz-RA-4C certified coffee fields FT-Org certified coffee fields FT-Org Vs Utz-RA-4C
Utz-RA-4C control effect p-value FT-Org control effect p-value effect p-value
N=19 N=19 N=18 N=18
*Mixed1
Total C Stock (Mg ha-1) 87.60 97.5 -9.864 0.256 103.7 87.89 15.83 0.072 16.13 0.062
5.966 6.007 8.548 6.113 6.015 8.522 8.489
Soil Org. C Stock (Mg ha-1) 66.72 70.48 -3.752 0.527 75.59 61.66 13.93 0.023 8.865 0.134
4.104 4.132 5.870 4.205 4.138 5.849 5.840
Tree C Stock (Mg ha-1) 5.039 7.136 -2.098 0.554 11.42 6.970 4.450 0.212 6.381 0.069
2.427 2.444 3.529 2.488 2.448 3.529 3.454
Tree Basal Area (m² ha-1) 1.995 2.673 -0.678 0.543 3.842 2.626 1.216 0.277 1.848 0.093
0.762 0.768 1.108 0.781 0.769 1.108 1.085
Tree Diversity (D') 0.533 0.563 -0.030 0.657 0.625 0.498 0.128 0.059 0.092 0.248
0.055 0.056 0.067 0.057 0.056 0.065 0.079
*°Glimmix Poisson log
Spider Abundance 7.440 9.750 -2.310 0.027 11.95 11.39 0.560 0.636 4.510 0.013
1.000 1.200 0.091 1.500 1.500 0.105 0.296
Ant Abundance 36.00 87.04 -51.04 <0.001 83.21 62.76 20.45 <.001 47.21 0.032
9.226 22.19 0.021 22.86 17.27 0.056 0.888
Rove Beetle Abundance 28.57 29.93 -1.360 0.518 34.03 27.87 6.160 0.004 5.460 0.427
4.300 4.400 0.068 5.400 4.400 0.082 0.261
*Mixed2
Spider Diversity (D') 0.705 0.716 -0.010 0.836 0.731 0.781 -0.050 0.308 0.026 0.589
0.033 0.033 0.048 0.034 0.034 0.048 0.047
Ant Diversity (D') 0.534 0.666 -0.132 0.057 0.597 0.679 -0.082 0.224 0.063 0.401
0.052 0.052 0.067 0.054 0.053 0.066 0.074
Notes: * Least-Square means obtained from linear mixed models (n=74) for carbon storage, tree diversity, tree stem basal area, invertebrates diversity
and abundance, their pairwise differences and the statistical significance of these differences for certified (Fairtrade-Organic, Utz-Rainforest Alliance-4C)
and pairwise matched non-certified plots.. °Values in difference column are calculated from inverted LS-means. SEs are averages of upper- and lower-limit SEs.
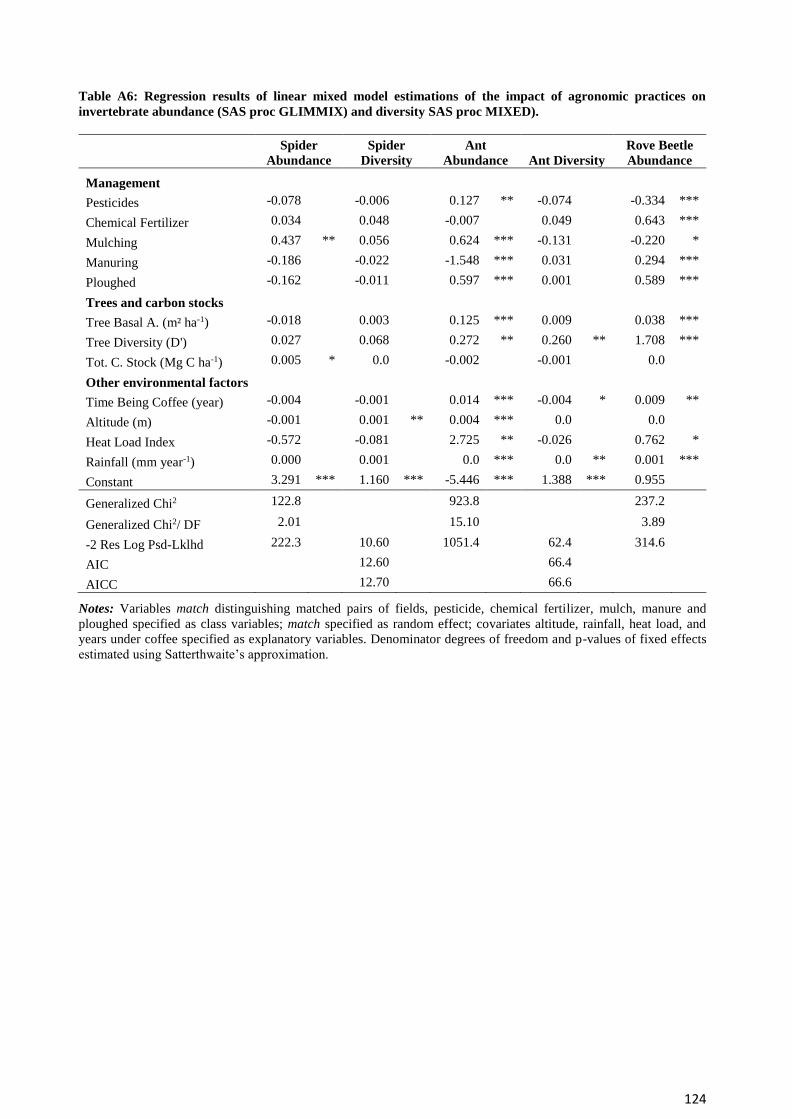
124
Table A6: Regression results of linear mixed model estimations of the impact of agronomic practices on
invertebrate abundance (SAS proc GLIMMIX) and diversity SAS proc MIXED).
Spider
Abundance
Spider
Diversity
Ant
Abundance Ant Diversity
Rove Beetle
Abundance
Management
Pesticides -0.078 -0.006 0.127 ** -0.074 -0.334 ***
Chemical Fertilizer 0.034 0.048 -0.007 0.049 0.643 ***
Mulching 0.437 ** 0.056 0.624 *** -0.131 -0.220 *
Manuring -0.186 -0.022 -1.548 *** 0.031 0.294 ***
Ploughed -0.162 -0.011 0.597 *** 0.001 0.589 ***
Trees and carbon stocks
Tree Basal A. (m² ha-1) -0.018 0.003 0.125 *** 0.009 0.038 ***
Tree Diversity (D') 0.027 0.068 0.272 ** 0.260 ** 1.708 ***
Tot. C. Stock (Mg C ha-1) 0.005 * 0.0 -0.002 -0.001 0.0
Other environmental factors
Time Being Coffee (year) -0.004 -0.001 0.014 *** -0.004 * 0.009 **
Altitude (m) -0.001 0.001 ** 0.004 *** 0.0 0.0
Heat Load Index -0.572 -0.081 2.725 ** -0.026 0.762 *
Rainfall (mm year-1) 0.000 0.001 0.0 *** 0.0 ** 0.001 ***
Constant 3.291 *** 1.160 *** -5.446 *** 1.388 *** 0.955
Generalized Chi2 122.8 923.8 237.2
Generalized Chi2/ DF 2.01 15.10 3.89
-2 Res Log Psd-Lklhd 222.3 10.60 1051.4 62.4 314.6
AIC 12.60 66.4
AICC 12.70 66.6
Notes: Variables match distinguishing matched pairs of fields, pesticide, chemical fertilizer, mulch, manure and
ploughed specified as class variables; match specified as random effect; covariates altitude, rainfall, heat load, and
years under coffee specified as explanatory variables. Denominator degrees of freedom and p-values of fixed effects
estimated using Satterthwaite’s approximation.
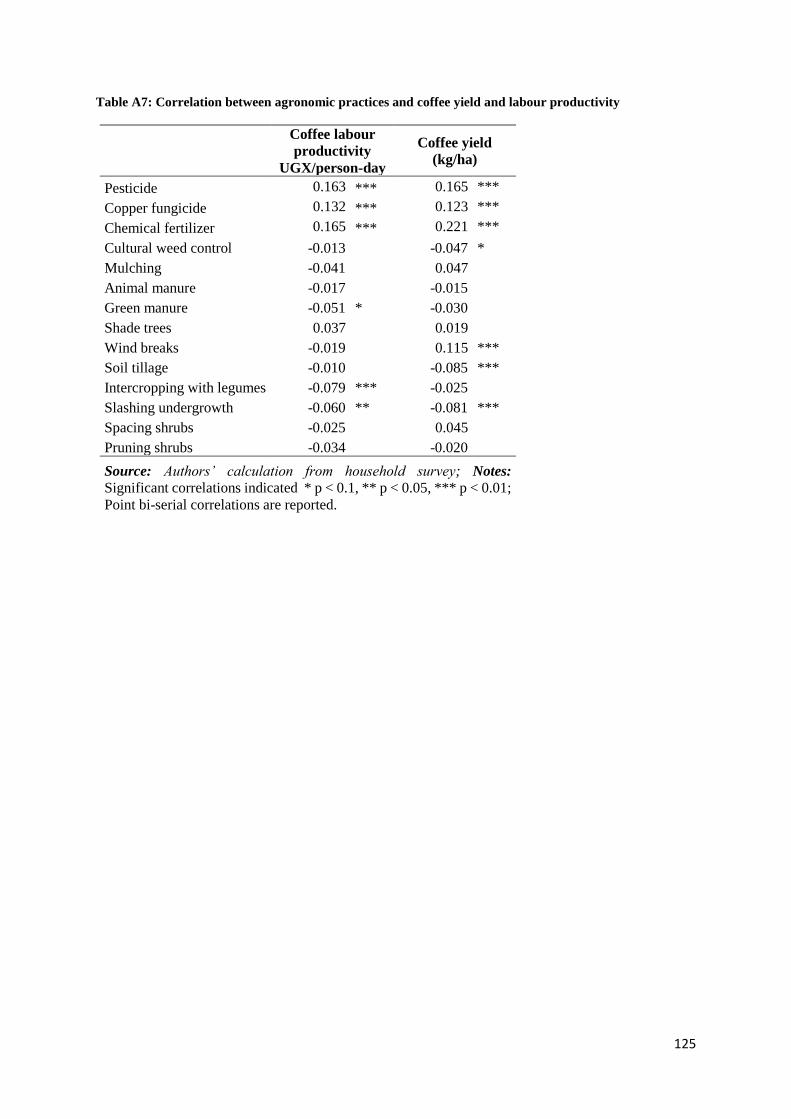
125
Table A7: Correlation between agronomic practices and coffee yield and labour productivity
Coffee labour
productivity
UGX/person-day
Coffee yield
(kg/ha)
Pesticide 0.163 *** 0.165 ***
Copper fungicide 0.132 *** 0.123 ***
Chemical fertilizer 0.165 *** 0.221 ***
Cultural weed control -0.013 -0.047 *
Mulching -0.041 0.047 Animal manure -0.017 -0.015 Green manure -0.051 * -0.030 Shade trees 0.037 0.019 Wind breaks -0.019 0.115 ***
Soil tillage -0.010 -0.085 ***
Intercropping with legumes -0.079 *** -0.025 Slashing undergrowth -0.060 ** -0.081 ***
Spacing shrubs -0.025 0.045 Pruning shrubs -0.034 -0.020 Source: Authors’ calculation from household survey; Notes:
Significant correlations indicated * p < 0.1, ** p < 0.05, *** p < 0.01;
Point bi-serial correlations are reported.
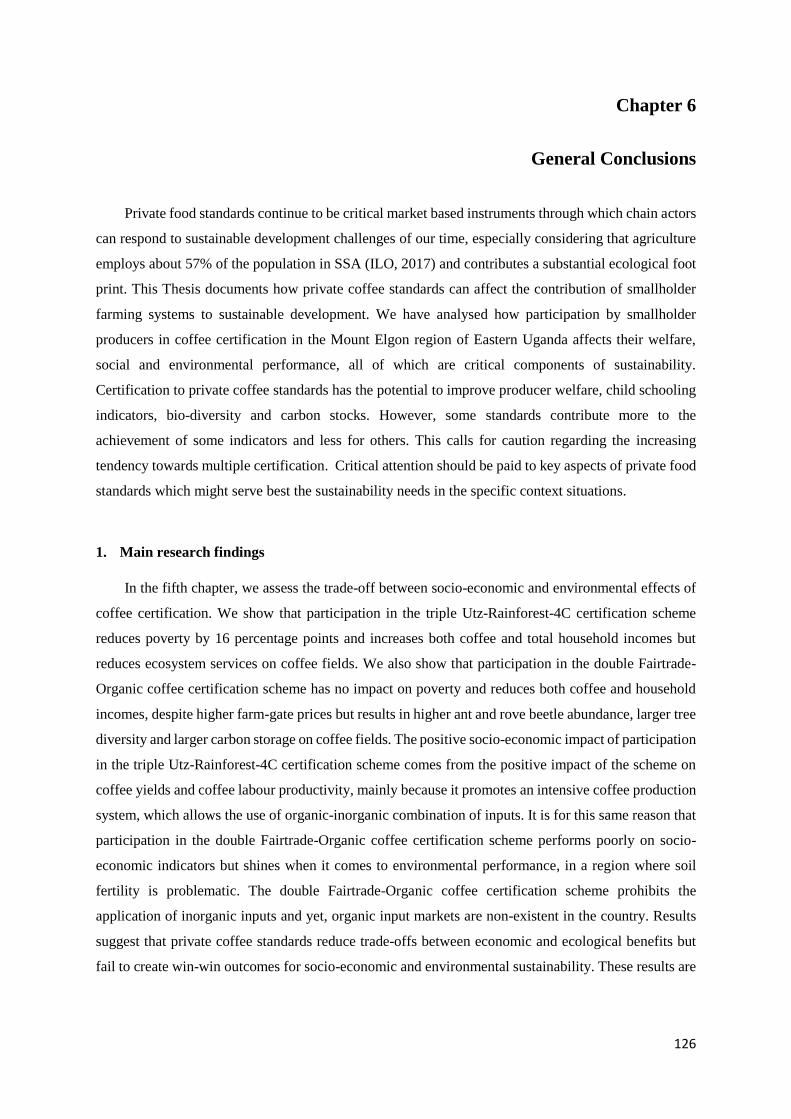
126
Chapter 6
General Conclusions
Private food standards continue to be critical market based instruments through which chain actors
can respond to sustainable development challenges of our time, especially considering that agriculture
employs about 57% of the population in SSA (ILO, 2017) and contributes a substantial ecological foot
print. This Thesis documents how private coffee standards can affect the contribution of smallholder
farming systems to sustainable development. We have analysed how participation by smallholder
producers in coffee certification in the Mount Elgon region of Eastern Uganda affects their welfare,
social and environmental performance, all of which are critical components of sustainability.
Certification to private coffee standards has the potential to improve producer welfare, child schooling
indicators, bio-diversity and carbon stocks. However, some standards contribute more to the
achievement of some indicators and less for others. This calls for caution regarding the increasing
tendency towards multiple certification. Critical attention should be paid to key aspects of private food
standards which might serve best the sustainability needs in the specific context situations.
1. Main research findings
In the fifth chapter, we assess the trade-off between socio-economic and environmental effects of
coffee certification. We show that participation in the triple Utz-Rainforest-4C certification scheme
reduces poverty by 16 percentage points and increases both coffee and total household incomes but
reduces ecosystem services on coffee fields. We also show that participation in the double Fairtrade-
Organic coffee certification scheme has no impact on poverty and reduces both coffee and household
incomes, despite higher farm-gate prices but results in higher ant and rove beetle abundance, larger tree
diversity and larger carbon storage on coffee fields. The positive socio-economic impact of participation
in the triple Utz-Rainforest-4C certification scheme comes from the positive impact of the scheme on
coffee yields and coffee labour productivity, mainly because it promotes an intensive coffee production
system, which allows the use of organic-inorganic combination of inputs. It is for this same reason that
participation in the double Fairtrade-Organic coffee certification scheme performs poorly on socio-
economic indicators but shines when it comes to environmental performance, in a region where soil
fertility is problematic. The double Fairtrade-Organic coffee certification scheme prohibits the
application of inorganic inputs and yet, organic input markets are non-existent in the country. Results
suggest that private coffee standards reduce trade-offs between economic and ecological benefits but
fail to create win-win outcomes for socio-economic and environmental sustainability. These results are
127
similar to others in the literature and they highlight the need to think about better harmonisation of
standards rather than multiple certification.
While companies engage in certification to private coffee standards partly to capture niche markets
and partly because donors fund it, producers engage in it because of higher prices and rarely pay
attention to the standards they are certified to. This implies that key parties in the implementation of
private coffee standards might put more emphasis on ticking their checklist of conditions, rather than
reflecting on and investing in appropriate mechanisms of implementation within a specific context
situation, in order to achieve all outcomes. This is evident in working towards the social outcomes of
private food standards such as child schooling where the double Fairtrade-Organic coffee certification
scheme makes extra investments, with good results. In the fourth chapter, we demonstrate that
participation in the double Fairtrade-Organic coffee certification scheme increases primary school
enrolment by 4%, primary schooling efficiency by 12.5%, secondary school enrolment by 15.4% and
secondary schooling efficiency by 9.6%. For secondary school enrolment, the impact is stronger for
girls than for boys. This positive impact is likely due to a combination of the investment effect at
community level using the social premium and awareness raising effects associated with Fairtrade
certificate, usually implemented in a co-operative structure. Participation in the triple Utz-Rainforest-
4C certification scheme however, has no impact on any of the schooling indicators. The scheme results
in increased yields, which implies increased labour pressure during peak harvest periods yet, it does not
make any extra investments towards enforcing the child-labour-free condition associated with all the
three standards.
Private food standards, linked to liberalised and globalised agri-food trade, form an important part
of the on-going innovations and modernisation processes taking place in global agri-food chains. In the
second chapter we describe the modernisation process taking place in the coffee value in Uganda and
show that over two decades after liberalisation, the sector has transformed from a very simple, mainly
state controlled commodity chain to a complex value chain with few public institutions and many
private actors. The sector is relatively better organised with many technical, commercial and
institutional innovations taking place, led by downstream actors, mainly the exporters. Although the
coffee value chain is modernising, challenges remain regarding low yields, poor quality at bulking stage
where middlemen are involved, unclear coffee extension mechanisms, under-developed input markets
and over-supply of certified coffee. Our results show that private coffee standards play an important
role in the modernisation process of the coffee value chain in Uganda through the contributions they
make to innovations at various levels and to structural re-configuration of the value chain. Overall, our
results show that private coffee standards have the potential to contribute to sustainable smallholder
farming if positive aspects of the various standards could be harmonised for the specific case of Mount
Elgon. On some of the sustainability outcomes, private coffee standards do ‘walk the talk’ while on
others they do not.
128
2. Research Implications
2.1 Contribution to literature
This PhD Thesis makes several contributions to the literature. First, we contribute to the literature
on liberalisation of global agri-food value chains, poverty reduction and the role of the state. Some
authors contend that traditional export crop production and marketing were much better organised in
the pre-liberalisation era, that smallholder producers enjoyed stable prices and produced better quality
products in the state controlled co-operatives (Newman, 2009; World Bank, 2011; Musumba & Gupta,
2013). This view is strongly criticised by others in support of liberalisation and reduced role of
government (Bussolo et al, 2007; Swinnen et al, 2010). They argue that instead of government distorting
competition by engaging in business and service provision, prices and markets should be opened up. In
this way, a higher share of world prices can go directly to producers, raise their incomes and incentivise
them to produce more, leading to economic growth and poverty reduction. We show in this Thesis that
due to liberalisation of coffee trade in Uganda, the coffee chain transformed from a very simple
commodity chain with few, mostly state controlled actors to a complex value chain with many private
actors interlinked in business relationships. Competition among private actors coupled with FDI have
triggered innovations and modernisation processes of the value chain to the benefit of all actors and
these processes are continuing up to today. Mount Elgon region alone has seen the establishment of
seven privately owned modern coffee washing stations since the year 2000. Producers supplying some
of these stations under the Utz-Rainforest-4C certification scheme have experienced poverty reduction.
Employment in the coffee sector which included some hundreds of civil servants and about one million
producers before reforms, is now estimated to involve about five million people. Smallholder co-
operatives which did not get involved in value addition beyond drying coffee, are now exporting coffee.
Resolving the remaining co-ordination challenges beyond the scope of competitive markets alone, will
need strong policy guidance from the government but with close collaboration of the private sector
chain actors and supporters at various levels.
Second, we contribute to the debate on globalisation, inclusion in agri-food value chains and
poverty reduction. Some critics to globalisation argue that as liberalisation deepens and foreign capital
inflows grow, inequalities increase and poorer areas lose out (Naranpanawa & Arora, 2014). They argue
that eventually, smallholder producers are pushed out of production because they cannot comply with
stringent supply conditions and are reduced to providing unskilled labour to companies instead. Other
authors reject this view (Asiedu & Gyimah‐Brempong 2008; Minten et al, 2009; Lee et al, 2012). They
argue that global agri-food value chains create opportunities for smallholder farmers who benefit
through contract farming arrangements. They contend that contract farming facilitates participating
producers to acquire new technologies, skills, upgrade product quality and eventually earn higher
revenues. We show in this Thesis that smallholder producers engaged in production contracts (about
6700 producers) with the triple Utz-Rainforest-4C certification implementing company have
129
experienced poverty reduction by 16% points. This is mainly due to the business model used and the
intensive coffee production system promoted by the implementing company, which increase yields,
labour productivity and incomes. Those producers in a Fairtrade-organic contract (about 7000
producers) on the contrary, have experienced no impact on poverty but score highly on schooling and
environmental outcomes. The issue therefore in not simply exclusion or inclusion in a contract
arrangement but rather the ability to respond to context specific challenges even when in a contract, as
in the case of the private coffee standards in Mount Elgon.
Third, we contribute to the debate on child labour versus child schooling among rural farm
households in Africa and the use of private food standards as market based instruments to address the
problem of child labour in global value chains. Some authors advocate for these kinds of instruments,
arguing that efforts by governments through signing several conventions at international level are not
effective (Chakrabarty & Grote, 2009; Chakrabarty et al, 2011). They highlight the consensus among
scientists that keeping children in school will keep them out of work, contribute to their wellbeing and
bring higher long term returns to society through higher labour productivity. The few studies available
on the child schooling impact of private food standards in global agri-food chains confirm that
certification has a positive impact on various child schooling indicators (Arnould et al 2009; Gitter et
al, 2012; Becchetti et al, 2013). It probably explains why most private food standards incorporate the
child-labour-free condition. In this Thesis, I show that the double Fairtrade-Organic coffee certification
scheme in the Mount Elgon region has positive significant effects on all child schooling outcomes, even
when it reduces coffee and total household incomes. This strong effect is likely from a combination of
investment and awareness raising effects, implying that including the child-labour-free condition alone
in private food standards, without extra efforts to ensure effectiveness, is not enough.
Fourth, we contribute to the literature on the trade-off between the economic and environmental
impact of private food standards. In various disciplinary studies, authors have shown that some
standards which have positive welfare impact do not perform well on environmental indicators.
Examples include: welfare impact studies (Barham & Weber, 2012; Beuchelt & Zeller, 2011; Méndez
et al., 2010; Chiputwa et al, 2015; Mitiku et al, 2017); agronomic impact studies (Blackman & Naranjo
(2012); Rueda & Lambin (2013); ecological impact studies (Haggar et al, 2015; Hardt et al, 2015). The
trade-off literature is rather scarce even when the tendency is for companies to engage in multiple
certification, some of which counteract each other’s impact on specific outcomes. Moreover, all
available studies use cases from Latin America (Perfecto et al, 2005; Gordon et al, 2007; Philpott et al,
2007). Literature using cases from Africa are critical, to give insights towards policy and design of
private coffee standards which can contribute to sustainable production of the 11.7 million smallholder
coffee farmers in Africa. We show in this Thesis that participation in the triple Utz-Rainforest-4C
certification scheme brings positive welfare effect and negative environmental effects while

130
participation in the Fairtrade-Organic certification scheme has the opposite effect. While certification
reduces the trade-off, it does not eradicate it in order to result into a win-win situation.
2.2 Strengths and weaknesses
A novelty in this PhD dissertation is the fact that it is based on a case study in which five key
coffee standards are being implemented. Although there is a large body of literature on the impact of
private food standards in general (see Beghin et al, 2015 for a review), most case studies focus on
Fairtrade and Organic standards or a combination of the two (Bolwig, 2009; Jena et al., 2012; Dragusanu
et al., 2014). Yet the tendency towards multiple certification among smallholder producers in contract
arrangement with exporting companies, is on the rise. Implementation of private coffee standards is
usually initiated by export companies, as both a commercial and an institutional innovation used to
respond to social, ethical and environmental demands of consumers but evidence on impact of multiple
certification is scarce (Chiputwa et al., 2015; Mitiku et al., 2017). We use data from smallholder coffee
producers engaged in production contracts with companies implementing the five key coffee standards
within the same context. Moreover, we focus on the impact of private coffee standards on all aspects of
sustainability namely economic, social and environmental.
From a methodological standpoint, this PhD dissertation makes several contributions. First, we use
a large database of cross-sectional household survey data to analyse the impact of the two categories of
private coffee standards. Second, we use instrumental variables, with instruments which pass the weak
and over-identification restrictions which means they are strong, relevant and plausibly exogenous. This
technique has been applied only in a limited number of studies evaluating the impact of private food
standards. Examples are Chiputwa et al (2015) for coffee in Uganda; Hansen & Trifković (2014) for
the pangasius chain in Vietnam; Maertens & Verhofstadt (2013) for the horticultural export chain in
Senegal. We use instrumental variables in chapters three and five to analyse the welfare impact of
private coffee standards on smallholder producers in Eastern Uganda. The use of instrumental variables
is helpful in addressing bias from heterogeneity due to unobserved factors such as farmer motivation
and experience which are correlated with certification. Moreover in all the IV models, we use district
fixed effects to help capture unobserved district specific heterogeneity.
Third, we use the difference-in-difference estimation technique with cross-section data. Most
studies in the agri-food value chain literature use this method with panel data (Van den Broeck &
Maertens, 2015). We use the difference-in-difference estimation technique in chapter four, to analyse
the child schooling impact of private coffee standards on smallholder producers households. The
difference-in-difference estimation technique allows the calculation of unobserved difference in means
of the counterfactual outcome indicators between certified and non-certified households. Since this
unobserved difference in means is itself a source of selection bias, it means results derived from
application of this technique are more robust.
131
Fourth, we use socio-economic and agronomic practices results at household level, plus
productivity results at plot level for trade-off analysis against environmental indicators. Most studies
on environmental impact of private food standards stick to specific disciplines. Some authors focus only
on impact of agronomic practices (Blackman & Naranjo, 2012; Rueda & Lambin, 2013) while others
focus only on ecological impact (Haggar et al, 2015; Hardt et al, 2015). Only a few studies do a trade-
off analysis but on case studies from Latin America (Perfecto et al, 2005; Gordon et al, 2007). In a
unique collaboration with ecologists we contribute results from impact of private coffee standards on
coffee yield, coffee labour productivity, net coffee income and poverty, and combine with results from
analysis of the impact of the same standards on carbon stocks in soil and tree biomass, and on
biodiversity (abundance and diversity of trees species, ants, spiders and rove beetles). This approach
allows us the use of data on the same combination of private coffee standards within the same context.
To the best of our knowledge this is the first such trade-off analysis using a case study from Africa.
Fifth, we control for a large set of agro-ecological indicators. Different agro-ecological conditions
under which agricultural production occurs can have a big influence on program outcomes. Most studies
on the impact of coffee certification usually do not control for differences in agro-ecological conditions,
or they do so only to a small extent, for example, by controlling for altitude of coffee plots (Bolwig et
al.,2009; Chiputwa et al., 2015; Wollni & Zeller, 2007). We calculate plot-size weighted averages of
agro-ecological indicators at the household level, to better control for agro-ecological heterogeneity.
By overlaying GPS data of coffee plots from the household survey, with available GIS data for the
research area, including a Digital Elevation Model (DEM) - based on void filled Shuttle Radar
Topography Mission (SRTM) data at a resolution of 1 arc-second (USGS, 2015), we are able to
calculate plot slope, in percentage; altitude, in metres above sea level; topographic wetness, as a
dimension-less index; and heat load, in trigonometric units. Topographic wetness indicates rainfall and
run-off flows and is a good proxy for soil nutrient flows (Sorensen et al., 2006). Heat load is a good
proxy for the amount of sunshine a plot receives (McCune & Keon, 2002). Together these four variables
capture variation in the suitability of land for coffee cultivation.
Sixth, during the household survey round in 2014, even though coffee production and marketing
related data were collected at household level, we gathered detailed information on all members of the
sampled households. This helps in investigating impact of participation of a household in coffee
certification at individual household member level. We carry out such analysis in chapter four of the
Thesis, to assess the impact of coffee certification on child schooling for all school age children within
the sampled households.
Although this PhD project has made several methodological contributions, the analysis is based on
one case study of two categories of coffee certification schemes in the region. While the case study
approach allows in-depth analysis, it poses the difficulty of generalising conclusions for other regions
due to limitations of representativeness. Uganda is a low income country and although the country is
132
heavily dependent on the export of coffee for foreign exchange earnings, it makes only few investments
in the coffee sector and on infrastructural development. The impact of standards might differ in richer
tropical countries where government might be investing in institutional and infrastructural support to
smallholder producers. Furthermore, certification to private food standards in Uganda is growing faster
in the Non-Traditional Agricultural Exports (NTAEs), which include high value agri-food value chains
in the fresh fruit and vegetable sector and their impact might differ in such sectors as well.
A second limitation of this PhD research is linked to location specific issues and the difference in
the models of implementation by different farmer organisational types. Although all farmers were
sampled from either a co-operative or other forms of Producer Organisations (POs) and we controlled
for a large set of location variables and used district fixed effects models in analysis, the impact of a
household’s participation in a coffee certification scheme is linked to a certain extent to the functioning
of specific POs. It is difficult therefore, to claim that the impact of certification was completely
disentangled from the impact of the co-operatives or POs. In order to account better for cooperative and
contract heterogeneity, and to distinguish better the impact of certification, one would need a larger and
more varied sample, with farmers certified to the same standards, with different contracts and in
different cooperative schemes and this was not possible in our research area. Yet, even with a larger
and more varied sample, it would still be difficult to guarantee that the confounding effects of
cooperatives, themselves heterogeneous, are addressed. Available literature shows that the impact of
cooperatives depends on the type of cooperatives (Ito et al, 2012), the type of value chain members are
engaged in (Bernard & Spielman; Markelova et al, 2009), the size of farm (Ma & Abdulai, 2016) and
composition of groups (Fischer & Qaim, 2012). Other authors further confirm that cooperatives are
highly diverse and this diversity leads to heterogeneous impacts (Verhofstadt & Maertens, 2014) and
often with structural trade-offs between different components of activities (Chagwiza et al, 2016).
2.3 Scope for future research
Based on the conclusions of this PhD Thesis, there is scope for future research. First, we conducted
the household survey at household level in order to assess the impact of coffee certification. Fairtrade
has a specifically interesting attribute associated with it, which is the payment of social premium by
international coffee buyers. The social premium fund is part of the proceeds of coffee within a coffee
year, which is re-invested in the local community where the coffee is produced. It is given to a Fairtrade
certified coffee co-operative and the priority for investing such funds is supposed to be decided in a
democratic manner at a co-operative level. More research is needed to evaluate the impact of Fairtrade
at community level as well. Second, although coffee in Mount Elgon is a man’s crop due to land
ownership issues, and indeed most of our respondents were men (89%), the women are critical in
providing labour for coffee production and some of the marketing activities. This means these standards
could have different impact on women and it would be interesting to undertake a gendered impact study.
Empirical evidence on the impact of private food standards on women, especially in Africa are rare
133
(Maertens & Swinnen, 2012). Third, we do not investigate the effects of coffee certification on youth
employment. Since the government has prioritised expansion of sustainable coffees in its export strategy
and the country has serious problems of youth unemployment (Kristensen & Birch-Thomsen, 2013),
investments in the expansion of sustainable coffee production could help reduce producers’ poverty and
address youth unemployment, thereby killing two birds with one stone. The World Bank (2009),
estimates that about 78% of the Ugandan population is below age 30 and the estimated unemployment
among the age category between 15-35 is as high as 83%. Finally, the issue of confounding effects of
co-operatives in agricultural programs is an important question that needs to be tackled in future impact
studies that involve organised producers.
2.4 Policy Implications
The conclusions of this PhD Thesis have policy implications for public and private sectors in
developing countries, as well as standard setters and consumers in high income countries. We first
discuss the policy implications for the public sector. We show that the coffee value chain in Uganda is
vibrant, with a multitude of private actors, operating in a highly competitive environment, engaging in
innovations at all stages of the chain and leading to on-going modernisation processes. If the
government of Uganda hopes to reduce poverty among the 1.7 million smallholder coffee producers in
the country then it needs to tackle the low yields across the coffee producing regions. There is need for
clear policy guidance on the provision of extension services, given its public good nature. The policy
framework should incorporate various models of coffee extension service provision, accompanied by
clear institutional arrangements that facilitate efficient co-ordination of various actors, the flow of agro-
ecological specific research information to producers, and adequate flexibility for adaptation by key
implementers.
The second policy implication is both for the public and the private sectors in Uganda. We
demonstrate that private coffee standards, an institutional innovation which emerged in the post-reform
era, have the potential of reducing poverty among smallholder coffee producers. These standards
however, are implemented by private export companies and there is a tendency towards multiple
certification. We also demonstrate that while the trade-off between socio-economic and environmental
indicators is reduced, it is not eliminated. If the government hopes to work with the private sector to
expand the production of sustainable coffees as a way to re-position itself in the international coffee
market, there is need to consider different combinations of private coffee standards appropriate to agro-
ecological context, particularly taking into account the urgent need to increase yields, given the poor
state of soils in most coffee producing regions in the country.
The third policy implication is for public-private partnership in Uganda. We show that although
the double Fairtrade-Organic certification scheme has no impact on poverty and reduces income, due
to low yields which is likely coming from prohibiting the use of inorganic inputs, the scheme however,
scores highly as far as ecological benefits are concerned. This is an opportunity for coffee stakeholders
134
to build on the existing organic coffee production in the country to make a contribution to climate
change mitigation. Survey findings reveal that the biggest challenge faced by organic coffee producers
is lack of organic inputs. Stakeholders need to work together to develop organic input markets in the
country, building on the few initiatives of organic input production and distribution, already started by
cooperatives and individual producers in the country. Furthermore, such organic input markets need to
make use of scientific information regarding organic-inorganic input combinations appropriate for the
various agro-ecological zones, in order that they are can revitalise the soils, while at the same
contributing to increased bio-diversity and carbon stocks. If input markets are developed and producers
are supported with effective extension models to address the current productivity problems, the trade-
off of socio-economic and environmental benefits could be further reduced, going forward.
The fourth policy implication is for companies and organisations which adopt the standards
voluntarily and commit to implement them, as well as those who carry out independent audits and
feedback information regarding compliance. Most private food standards prohibit child labour in order
to promote child welfare. We reveal that the double Fairtrade-organic certification scheme has a positive
impact on school enrolment and schooling efficiency for all school age children. We show that this
positive impact is likely due to a combination of the investment effect at community level using the
Fairtrade social premium and awareness raising effects on individual producers, as they use the
cooperative model to comply with Fairtrade conditions and mobilise peer pressure for effective
compliance monitoring. It highlights the importance of going beyond mere listing of the child-labour-
free condition in private food standards, in order to ensure impact on child schooling. In order to ensure
effectiveness of private coffee standards at producer level, it will be critical for standard implementers,
to work together to establish robust internal monitoring systems. Such a system would include
awareness raising on all certification conditions and the reasons behind them, and would engage
producer organisations, extension agents and coffee buyers at producer level in peer monitoring
processes with clear feedback mechanisms and consequences for non-compliance. Furthermore,
outcomes should be linked to national targets and monitoring mechanisms in order to ensure that
education outcomes are achieved.
The fifth policy implication is for standard setting organisations. We show that there is a trade-off
between socio-economic and ecological impact of private coffee standards and multiple certification
does not result in a win-win situation. We also show that despite resulting in a win-lose situation, private
coffee standards contribute to reducing trade-offs between socio-economic and ecological goals,
implying that improving smallholder coffee sustainability is possible. Instead of investing in multiple
certification with the aim of exploiting complementarities of those standards with a socio-economic
focus (for example Fairtrade) and those with environmental focus (for example organic), standard
setters should improve the design of private food standards to compensate for existing trade-offs
between socio-economic and ecological benefits. This might entail either harmonising private food

135
standards into a set of requirements that minimises trade-offs and leads to win-win outcomes or
differentiating them to adapt to requirements of local agro-ecological and economic conditions or both.
The sixth policy implication is for consumers in high income countries. As a response to their
demand for improved social, ethical and environmental performance of smallholder production
systems, coffee exporting companies in developing countries are gradually moving into multiple
certification. Furthermore, these companies also use multiple certification to capture a higher share of
the niche market and to reduce supply and reputational risks. We show that Fairtrade-Organic certified
producers receive the highest coffee prices and perform better on child schooling outcomes. Although
coffee producers in Mount Elgon enjoy these positive impacts often associated with Fairtrade, their
household poverty is not reduced, likely because of depressed coffee yields from combining Fairtrade
with Organic certification. The latter prohibits the use of inorganic inputs and yet the scheme is being
implemented in a region where soils are highly degraded and organic input markets are non-existent.
Although we do not have the data to dis-entangle the impacts of the various standards, survey findings
indicate that combining Fairtrade which attracts a high premium and either Utz or Rainforest, both of
which allow the use of inorganic yield enhancing inputs, would be best for the welfare of producers in
regions with low productivity and limited availability of organic inputs. Other authors confirm that
when Fairtrade is implemented alone it performs much better and actually raises household expenditure
(Chiputwa et al, 2015).
The seventh policy implication is for public and private policy makers. We show that there is a
large gap between certified coffee production and certified coffee export in Uganda, meaning that two
decades after the first private coffee standard was implemented, certified coffee trade remains restricted
to a niche market on the one hand, and maximises complementarities on the other. We show that while
11% of the total national coffee production is certified to the five main private coffee standards, UCDA
records indicate that only 2% of coffee exports in 2014 left the country as sustainable coffee (UCDA,
2016). At international level, similar trends occur. While 39% of global coffee production in 2012 was
standards compliant, only 12% of global coffee exports was standards compliant. This means coffee
value chain actors incur costs and donors spend money to support certified coffee production and yet,
the actors do not reap the full benefits in terms of premiums. It also implies a downward pressure on
prices of certified coffee (Potts et al, 2014). This problem could be tackled by mainstreaming important
welfare, social, ethical and environmental indicators of sustainability, in the global coffee trade and
agreeing on the best mechanisms to reward the extra efforts made by chain actors in transitioning
towards sustainability. This should be a multi-stakeholder initiative towards a paradigm shift in making
coffee production and trade sustainable. It should include public and private coffee policy makers at
local and international levels, standard setters, implementing companies, as well as key coffee buying
and roasting companies internationally. All these stakeholders need to work together to agree on a
common list of sustainability indicators applicable to coffee but at the same time leaving room for
136
adaptation of private coffee standards to specific socio-economic and agro-ecological needs, given the
diversity of coffee producing regions. It is important to integrate an enforcement mechanism at all stages
of the coffee value chain to ensure compliance with commonly developed indicators. Stakeholders
should also work together to develop effective mechanisms to ensure continuous re-investment of part
of coffee proceeds in developing the sector in producing countries. This will be the best way of
supporting coffee chain actors, especially smallholder producers to contribute to Sustainable
Development Goals (SDGs) and move away from relegating trade in sustainable coffees to niche
markets.
I end this Thesis by advocating for caution regarding multiple certification and more importantly
urging actors and supporters of the coffee value chain in Uganda, to base their choices on well
researched information, bearing in mind that additional certification comes with extra costs at producer
level. Furthermore, it is important for all stakeholders to realise that private food standards is not a
panacea for all smallholder farming challenges and should be presented to producers with adequate
information, and more importantly allowing them room for decision making. It will go a long way in
solving the current problem of producers making the effort to produce certified coffee, which is then
sold as conventional.
137
References
Admassie, A. (2003). Child labour and schooling in the context of a subsistence, rural economy: can
they be compatible? International Journal of Educational Development, 23(2), 167-185.
Agosti, D. M., Alonso, J. D., Schultz, L. E., & Ted, R. (2000). Antsstandard methods for measuring
and monitoring biodiversity (No. 595.796 A5).
Aizer, A., Eli, S., Ferrie, J., & Lleras-Muney, A. (2016). The long-run impact of cash transfers to poor
families. The American Economic Review, 106(4), 935-971.
Akiyama, T. (2001). Coffee market liberalization since 1990. Commodity market reforms: Lessons of
two decades, 83-120.
Akiyama, T., Baffes, J., Larson, D. F., & Varangis, P. (2003). Commodity market reform in Africa:
some recent experience. Economic systems, 27(1), 83-115.
Akoyi, K. T., & Maertens, M. (2017). Walk the Talk: Private Sustainability Standards in the Ugandan
Coffee Sector. The Journal of Development Studies, 1-27.
Andersen, A. N., & Majer, J. D. (2004). Ants show the way Down Under: invertebrates as bioindicators
in land management. Frontiers in Ecology and the Environment, 2(6), 291-298.
Armbrecht, I., Rivera, L., & Perfecto, I. (2005). Reduced Diversity and Complexity in the Leaf‐Litter
Ant Assemblage of Colombian Coffee Plantations. Conservation Biology, 19(3), 897-907.
Arnould, E.J., Plastina, A. & Ball, D. (2009). Does Fair Trade Deliver on Its Core Value Proposition?
Effects on Income, Educational Attainment, and Health in Three Countries. Journal of Public
Policy and Marketing, 28(2), 186-201.
Asfaw, S., Mithöfer, D., & Waibel, H. (2010). What impact are EU supermarket standards having on
developing countries' export of high-value horticultural products? Evidence from Kenya. Journal
of International Food & Agribusiness Marketing, 22(3-4), 252-276.
Asiedu, E., & Gyimah‐Brempong, K. (2008). The effect of the liberalization of investment policies on
employment and investment of multinational corporations in Africa. African Development
Review, 20(1), 49-66.
Bacon, C. (2005). Confronting the coffee crisis: can fair trade, organic, and specialty coffees reduce
small-scale farmer vulnerability in northern Nicaragua? World development, 33(3), 497-511.
Bacon, C. M., Ernesto Mendez, V., Gómez, M. E. F., Stuart, D., & Flores, S. R. D. (2008). Are
sustainable coffee certifications enough to secure farmer livelihoods? The Millennium
Development Goals and Nicaragua’s Fair trade cooperatives. Globalizations, 5(2), 259–274.
Baffes, J. (2006). Restructuring Uganda’s Coffee Industry: Why Going Back to the Basics Matters.
World Bank Policy Research paper.
Baffes, J., Lewin, B. & Varangis, P. (2005) ‘Coffee: Market Setting and Policies’, in M. Ataman Aksoy
and John C. Beghin (eds), Global Agricultural Trade and Developing Countries. Washington,
DC: World Bank.
Baland, J. M., & Duprez, C. (2009). Are labels effective against child labor? Journal of Public
Economics, 93(11), 1125-1130.
Balineau, G. (2013). Disentangling the effects of fair trade on the quality of Malian cotton. World
Development, 44, 241–255.
Barham, B. L. & Weber, J. G. (2012). The economic sustainability of certified coffee: Recent evidence
from Mexico and Peru. World Development, 40(6), 1269-1279.
Becchetti, L., Castriota, S & Michetti, M. (2013). The effect of fair trade affiliation on child schooling:
evidence from a sample of Chilean honey producers. Applied Economics, (2013)45, 3552-3563.
Becchetti, L., & Costantino, M. (2008). The effects of fair trade on affiliated producers: An impact
analysis on Kenyan farmers. World Development, 36, 823-842.
Beegle, K., Dehejia, R., & Gatti, R. (2003). Child labor, crop shocks, and credit constraints (No.
w10088), National Bureau of Economic Research.
Beghin, J. C., Maertens, M., & Swinnen, J. (2015). Nontariff measures and standards in trade and global
value chains. Annual Review of Resource Economics, 7(1), 425-450.
Belshaw, D., Lawrence, P., & Hubbard, M. (1999). Agricultural tradables and economic recovery in
Uganda: The limitations of structural adjustment in practice. World Development, 27(4), 673-
690.

138
Bernard, T., & Spielman, D. J. (2009). Reaching the rural poor through rural producer organizations?
A study of agricultural marketing cooperatives in Ethiopia. Food policy, 34(1), 60-69.
Beuchelt, T. D., & Zeller, M. (2013). The role of cooperative business models for the success of
smallholder coffee certification in Nicaragua: A comparison of conventional, organic and
Organic-Fairtrade certified cooperatives. Renewable Agriculture and Food Systems, 28(03), 195-
211.
Beuchelt, T.D. & Zeller, M. (2011). Profits and poverty: Certification's troubled link for Nicaragua's
organic and fair trade coffee producers. Ecological Economics, 70, 1316-1324.
Blackman, A., & Naranjo, M. A. (2012). Does eco-certification have environmental benefits? Organic
coffee in Costa Rica. Ecological Economics, 83, 58-66.
Bolwig, S., Gibbon, P. & Jones, S. (2009). The economics of smallholder organic contract farming in
tropical Africa. World Development, 37(6), 1094–1104.
Bongers, G., Fleskens, L., Van de Ven, G., Mukasa, D., Giller, K. E. N., & Van Asten, P. (2015).
Diversity in smallholder farms growing coffee and their use of recommended coffee management
practices in Uganda. Experimental Agriculture, 51(4), 594-614.
Bos, M. M., Steffan-Dewenter, I., & Tscharntke, T. (2007). The contribution of cacao agroforests to the
conservation of lower canopy ant and beetle diversity in Indonesia. Biodiversity and
Conservation, 16(8), 2429-2444.
Brown, K. S. (1997). Diversity, disturbance, and sustainable use of Neotropical forests: insects as
indicators for conservation monitoring. Journal of Insect conservation, 1(1), 25-42.
Bussolo, M., Godart, O., Lay, J., & Thiele, R. (2007). The impact of coffee price changes on rural
households in Uganda. Agricultural Economics, 37(2‐3), 293-303.
Chagwiza, C., Muradian, R., & Ruben, R. (2016). Cooperative membership and dairy performance
among smallholders in Ethiopia. Food Policy, 59, 165-173.
Chakrabarty, S., & Grote, U. (2009). Child labour in carpet weaving: impact of social labelling in India
and Nepal. World Development, 37(10), 1683-1693.
Chakrabarty, S., Grote, U., & Lüchters, G. (2011). Does social labelling encourage child schooling and
discourage child labour in Nepal?. International Journal of Educational Development, 31(5),
489-495.
Chave, J., Réjou‐Méchain, M., Búrquez, A., Chidumayo, E., Colgan, M. S., Delitti, W. B., ... & Henry,
M. (2014). Improved allometric models to estimate the aboveground biomass of tropical
trees. Global change biology, 20(10), 3177-3190.
Chenery, E. M. (1960). An introduction to the soils of the Uganda protectorate. Memoria of the
Research Division, Department of Agriculture, Uganda, Series 1, No. 1.
Chiputwa, B., Spielman, D.J. & Qaim, M. (2015). Food standards, certification, and poverty among
coffee farmers in Uganda. World Development, 66, 400–412.
Chiputwa, B., & Qaim, M. (2016). Sustainability standards, gender, and nutrition among smallholder
farmers in Uganda. The Journal of Development Studies, 52(9), 1241-1257.
Claessens, L., Knapen, A., Kitutu, M. G., Poesen, J., & Deckers, J. A. (2007). Modelling landslide
hazard, soil redistribution and sediment yield of landslides on the Ugandan footslopes of Mount
Elgon. Geomorphology, 90(1), 23-35.
Daviron, B., & Ponte, S. (2005). The coffee paradox: Global markets, commodity trade and the elusive
promise of development. London: Zed Books.
De Janvry, A., Finan, F., Sadoulet, E., & Vakis, R. (2006). Can conditional cash transfer programs serve
as safety nets in keeping children at school and from working when exposed to shocks?. Journal
of development economics, 79(2), 349-373.
DeFries, R. S., Fanzo, J., Mondal, P., Remans, R., & Wood, S. A. (2017). Is voluntary certification of
tropical agricultural commodities achieving sustainability goals for small-scale producers? A
review of the evidence. Environmental Research Letters, 12(3), 033001.
Deininger, K. (2003). Does cost of schooling affect enrollment by the poor? Universal primary
education in Uganda. Economics of Education review, 22(3), 291-305.
Deininger, K., & Okidi, J. (2001). “Rural households: Incomes, productivity, and nonfarm enterprises”.
In R. Reinikka & P. Collier (Eds.), Uganda’s recovery: The role of farms, firms, and government.
The World Bank, Washington, DC.

139
Delpeuch, C. & Vandeplas, A. (2013). Revisiting the “cotton problem” - A comparative analysis of
cotton reforms in sub-Saharan Africa. World Development, 42, 209-221.
Dragusanu, R., Giovannucci, D., & Nunn, N. (2014). The economics of fair trade. The Journal of
Economic Perspectives, 28(3), 217-236.
Eakin H, Winkels A, Sendzimir J (2009) Nested vulnerability: exploring cross-scale linkages and
vulnerability teleconnections in Mexican and Vietnamese coffee systems. Environment Science
and Policy 12(4): 398-412.
Eggleston, H. S., Buendia, L., Miwa, K., Ngara, T., & Tanabe, K. (2006). IPCC guidelines for national
greenhouse gas inventories. Institute for Global Environmental Strategies, Hayama, Japan, 2,
48-56.
Elder, S. D., Zerriffi, H., & Le Billon, P. (2013). Is Fairtrade certification greening agricultural
practices? An analysis of Fairtrade environmental standards in Rwanda. Journal of Rural
Studies, 32, 264-274.
Emerson, P. M., & Souza, A. P. (2007). Child labour, school attendance, and intra-household gender
bias in Brazil. The World Bank Economic Review, 21(2), 301-316.
Fafchamps, M. & Hill, R.V. (2005). Selling at the Farm-Gate or Travelling to Market, American Journal
of Agricultural Economics 87 (3), 717-734.
Fafchamps, M., & Hill, R. V. (2008). Price transmission and trader entry in domestic commodity
markets. Economic Development and cultural change, 56(4), 729-766.
Fairtrade International, (2015, 2016 & 2017). What is Fairtrade? www.fairtrade.net.
FAO, F. (2015, 2016 & 2017). FAO statistical database. Food and Agricultural Organisation, Rome,
Italy. [accessed, June, 2015, December, 2016 & July, 2017].
FiBL (Research Institute for Organic Agriculture). (2016). The world of organic agriculture: Statistics
and emerging trends, 2016. Retrieved from www.organic-world.net.
Fischer, E., & Qaim, M. (2012). Linking smallholders to markets: determinants and impacts of farmer
collective action in Kenya. World Development, 40(6), 1255-1268.
Ganimian, A. J., & Murnane, R. J. (2016). Improving Education in Developing Countries Lessons From
Rigorous Impact Evaluations. Review of Educational Research, 86(3), 719-755.
GCCE (Gumutindo Coffee Cooperative Enterprises) (2017). Social premium,
www.gumutindocoffee.coop, [accessed, February, 2017].
GCP (Global Coffee Platform) (2016). Overview, www.globalcoffeeplatform.org, [accessed,
December, 2016].
Gereffi, G., Humphrey, J., & Sturgeon, T. (2005). The governance of global value chains. Review of
International Political Economy, 12(1), 78-104.
Gibbon, P. (2006). An overview of the certified organic export sector in Uganda (No. 2006: 13). DIIS
Working Paper.
Gilbert, C. L. (2008). Value chain analysis and market power in commodity processing with application
to the cocoa and coffee sectors. Commodity market review, 2007, 5.
Gilbert, C., & Varangis, P. (2004). Globalization and international commodity trade with specific
reference to the West African cocoa producers. In Challenges to Globalization: Analyzing the
Economics (pp. 131-166). University of Chicago Press.
Giovannucci, D., & Koekoek, F. J. (2003). The state of sustainable coffee: A study of twelve major
markets.
Gitter, S. R., Weber, J. G., Barham, B. L., Callenes, M., & Valentine, J. L. (2012). Fair trade-organic
coffee cooperatives, migration, and secondary schooling in Southern Mexico. Journal of
Development Studies, 48(3), 445-463.
Gitter, S.R. & Barham, B.L. (2007). Credit, Natural Disasters, Coffee, and Educational Attainment in
Rural Honduras, World Development, 35(3), 498-511.
Gitter, S.R., Barham, B.L., 2008. Women’s power, conditional cash transfers, and schooling in
Nicaragua. World Bank Economic Review, 22 (2), 271-290.
Gitter, S.R., Weber, J.G., Barham, B.L., Callenes, M. & Valentine, J.L. (2012). Fair trade-organic coffee
cooperatives, migration, and secondary schooling in southern Mexico; Journal of Development
Studies, 48(3), 445-463.
140
Gitter, S.R., Weber, J.G., Barham, B.L., Callenes, M. & Valentine, J.L. (2011). Fair trade-organic coffee
cooperatives, migration, and secondary schooling in southern Mexico; Journal of Development
Studies, 48(3), 445-463.
Gómez, M. I., Barrett, C. B., Buck, L. E., De Groote, H., Ferris, S., Gao, H. O., ... & Reardon, T. (2011).
Research principles for developing country food value chains. Science, 332(6034), 1154-1155.
Gordon, C., Manson, R., Sundberg, J., & Cruz-Angón, A. (2007). Biodiversity, profitability, and
vegetation structure in a Mexican coffee agroecosystem. Agriculture, ecosystems &
environment, 118(1), 256-266.
Goreux, L. M. (1978). Stabilization of Commodity Prices and Export Earnings: The Coffee and Sugar
Agreements. International Trade Law Journal, 4, 140.
Gotwald, W.H. Jr (1995) Army ants: the biology of social predation. (Cornell University Press, Ithaca,
N.Y.)
Graeme, A. (2010). Assessing Certification as Governance: Effects and Broader Consequences for
Coffee, The Journal of Environment & Development, 19(2) 215–241.
Haggar, J., Asigbaase, M., Bonilla, G., Pico, J., & Quilo, A. (2015). Tree diversity on sustainably
certified and conventional coffee farms in Central America. Biodiversity and
Conservation, 24(5), 1175-1194.
Hairiah, K., Dewi, S., Agus, F., Velarde, S., Ekadinata, A., Rahayu, S., & van Noordwijk, M.
(2011). Measuring carbon stocks: across land use systems: a manual. Brawijaya University and
ICALRRD (Indonesian Center for Agricultural Land Resources Research and Development).
Handa, S. (2002). Raising primary school enrolment in developing countries: The relative importance
of supply and demand, Journal of Development Economics, 69 (2002) 103-128.
Handa, S., Simler, K.R & Harrower, S. (2004). Human Capital, Household Welfare, and Children’s
Schooling in Mozambique, Research Report No. 134, International Food Policy Research
Institute, Washington, DC.
Handschuch, C., Wollni, M., & Villalobos, P. (2013). Adoption of food safety and quality standards
among Chilean raspberry producers–Do smallholders benefit?. Food Policy, 40, 64-73.
Hansen, H., & Trifković, N. (2014). Food standards are good–for middle-class farmers. World
Development, 56, 226-242.
Hardt, E., Borgomeo, E., dos Santos, R. F., Pinto, L. F. G., Metzger, J. P., & Sparovek, G. (2015). Does
certification improve biodiversity conservation in Brazilian coffee farms?. Forest Ecology and
Management, 357, 181-194.
Harvey, C. A., Komar, O., Chazdon, R., Ferguson, B. G., Finegan, B., Griffith, D. M., ... & Van Breugel,
M. (2008). Integrating agricultural landscapes with biodiversity conservation in the
Mesoamerican hotspot. Conservation Biology, 22(1), 8-15.
Henson, S. & Humphrey, J. (2010). Understanding the complexities of private standards in global agri-
food chains as they impact developing countries. The Journal of Development Studies, 46, 1628-
1646.
Henson, S., & Reardon, T. (2005). Private agri-food standards: Implications for food policy and the
agri-food system. Food policy, 30(3), 241-253.
Henstridge, M., & Kasekende, L. (2001). Exchange Reforms, Stabilization, and Fiscal
Management. Uganda’s Recovery - The Role of Farms, Firms, and Government, Kampala,
Uganda: Fountain Publishers, 49-80.
Hidayat, N. K., Glasbergen, P., & Offermans, A. (2015). Sustainability certification and palm oil
smallholders’ livelihood: a comparison between scheme smallholders and independent
smallholders in Indonesia. International Food and Agribusiness Management Review, 18(3), 25-
48.
Holzapfel, S. & Wollni, M. (2014). Is global gap certification of small-scale farmers sustainable?
evidence from Thailand. The Journal of Development Studies, 50, 731-747.
Ibanez, M., & Blackman, A. (2016). Is eco-certification a win–win for developing country agriculture?
Organic coffee certification in Colombia. World Development, 82, 14-27.
ICO (International Coffee organisation) (2015). Total production, export, export prices and producer
prices of all exporting countries, www.ico.org [accessed June, 2015].
IFER (Institute of Forest Ecosystem Research) (2002) Methodology for Carbon Stock Monitoring (Ver.
3.2.). Unpublished report for Face Foundation. (Jílové u Prahy, Czech Republic).
141
IFOAM (International Federation of Organic Agriculture Movement) (2016). About international
organic movement. www.ifoam.bio
ILO (International Labour Organisation) (2017). ILO statistics. www.ilo.org, [Accessed 15 August
2017].
International Trade Centre (ITC) (2012). Uganda national export strategy: Coffee sector export strategy
update 2012-2017, ITC 54-56, rue de Montbrillant 1202 Geneva, Switzerland.
IPCC (Intergovernmental Panel on Climate Change) (2007). Fourth Assessment Report: Climate
Change 2007, Cambridge University Press, Cambridge, 2007.
Jassogne, L., van Asten, P. J., Wanyama, I., & Baret, P. V. (2013). Perceptions and outlook on
intercropping coffee with banana as an opportunity for smallholder coffee farmers in
Uganda. International Journal of Agricultural Sustainability, 11(2), 144-158.
Jayne, T. S., Govereh, J., Mwanaumo, A., Nyoro, J. K., & Chapoto, A. (2002). False promise or false
premise? The experience of food and input market reform in Eastern and Southern Africa. World
Development, 30(11), 1967-1985.
Jena, P. R. & Grote, U. (2017). Fairtrade Certification and Livelihood Impacts on Small-scale Coffee
Producers in a Tribal Community of India. Applied Economic Perspectives and Policy, 39(1), 87-
110.
Jena, P. R., Chichaibelu, B.B., Stellmacher, T. & Grote, U. (2012). The impact of coffee certification
on small-scale producers’ livelihoods: A case study from the Jimma zone, Ethiopia. Agricultural
Economics, 43, 429-440.
Jones, N. & Samuels, F. (2015). The role of cash transfers in maximising schools’ protective effects for
children in extreme settings: An ecological approach. International Journal of Educational
Development, 41, 217-225.
Jose, S. (2009). Agroforestry for ecosystem services and environmental benefits: an
overview. Agroforestry systems, 76(1), 1-10.
Kaganzi, E., Ferris, S., Barham, J., Abenakyo, A., Sanginga, P., & Njuki, J. (2009). Sustaining linkages
to high value markets through collective action in Uganda. Food policy, 34(1), 23-30.
Kaplinsky, R. (2004). Competitions Policy and the Global Coffee and Cocoa Value Chains, Institute of
Development Studies, Sussex, Brighton, UK.
Kaweri (2016). Kaweri Coffee Plantation. www.kaweri.com [accessed April, 2016].
Khandker, S. R., Koolwal, B., G. & Samad, H. A. (2010). Handbook on Impact Evaluation:
Quantitative Methods and Practices. The World Bank, Washington DC.
Kherallah, M., Delgado, C., Gabre-Madhin, E., Minot, N. & Jonson, M. (2002). Reforming Markets in
Africa. The John Hopkins University Press, Baltimore, Maryland USA.
Kiers, E. T., Leakey, R. R., Izac, A. M., Heinemann, J. A., Rosenthal, E., Nathan, D., & Jiggins, J.
(2008). Agriculture at a crossroads.
Knapen, A., Kitutu, M. G., Poesen, J., Breugelmans, W., Deckers, J., & Muwanga, A. (2006).
Landslides in a densely populated county at the footslopes of Mount Elgon (Uganda):
Characteristics and causal factors. Geomorphology, 73, 149–165.
Kogut, B. (1985). Designing global strategies: Comparative and competitive value-added chains. Sloan
Management Review, 26(4), 15-28.
Kremer, M., Brannen, C., & Glennerster, R. (2013). The challenge of education and learning in the
developing world. Science, 340(6130), 297-300.
Kristensen, S., & Birch-Thomsen, T. (2013). Should I stay or should I go? Rural youth employment in
Uganda and Zambia. International Development Planning Review, 35(2), 175-201.
Krivonos, E. (2004). The impact of coffee market reforms on producer prices and price transmission.
World Bank Policy Research Working Paper (2004), 3358.
Kruger, I. D. (2007). Coffee production effects on child labour and schooling in rural Brazil, Journal
of Development Economics, 82(2), pp. 448–463.
Langsten, R. (2014). Measuring Progress toward Universal Primary Education: An Examination of
Indicators. Comparative Education Review, 58(4), 653-677.
Langsten, R. (2017). School fee abolition and changes in education indicators. International Journal of
Educational Development, 53, 163-175.

142
Lee, J., Gereffi, G., & Beauvais, J. (2012). Global value chains and agri-food standards: challenges and
possibilities for smallholders in developing countries. Proceedings of the National Academy of
Sciences, 109(31), 12326-12331.
Lenzen, M., Moran, D., Kanemoto, K., Foran, B., Lobefaro, L., & Geschke, A. (2012). International
trade drives biodiversity threats in developing nations. Nature, 486(7401), 109-112.
Lernoud, J., Potts, J., Sampson, G., Voora, V., Willer, H., & Wozniak, J. (2016). The State of
Sustainable Markets-Statistics and Emerging Trends 2015.
Lincove, J. A. (2009). Determinants of schooling for boys and girls in Nigeria under a policy of free
primary education. Economics of Education Review, 28(4), 474-484.
Lincove, J. A., & Parker, A. (2016). The influence of conditional cash transfers on eligible children and
their siblings. Education Economics, 24(4), 352-373.
Lundvall, B. Å. (1985). Product innovation and user-producer interaction. The Learning Economy and
the Economics of Hope, 19.
Lyon, S., Bezaury, J. A., & Mutersbaugh, T. (2010). Gender equity in fairtrade–organic coffee producer
organizations: Cases from Mesoamerica. Geoforum, 41(1), 93-103.
Ma, W., & Abdulai, A. (2016). Does cooperative membership improve household welfare? Evidence
from apple farmers in China. Food Policy, 58, 94-102.
MAAIF (Ministry of Agriculture, Animal Industry & Fisheries) of Uganda (2010). Agriculture for Food
and Income Security: Agriculture Sector Development Strategy and Investment Plan: 2010/11-
2014/15. Uganda Printing and Publishing Corporation, P. O. Box 33, Entebbe.
MAAIF (Ministry of Agriculture, Animal Industry & Fisheries) of Uganda (2013). Agriculture for Food
and Income Security: The National coffee policy, 2013. Uganda Printing and Publishing
Corporation, P. O. Box 33, Entebbe.
Maertens, M. & Swinnen, J. F. (2012). Gender and modern supply chains in developing countries. The
Journal of Development Studies, 48(10), 1412-1430.
Maertens, M. & Verhofstadt, E. (2013). Horticultural exports, female wage employment and primary
school enrolment: Theory and evidence from Senegal. Food Policy, 43, 118-131.
Maertens, M., & Vande Velde, K. (2017). Contract farming in staple food chains: Rice in Benin. World
Development, 95, 73–87.
Magona, I. (2010). “Sectorwide approaches and sector working groups”: In F. Kuteesa, E. Tumusiime-
Mutebile, A. Whitworth and T. Williamson (Eds), Uganda’s Economic Reforms: Insider
Accounts; Oxford University Press Inc., New York, 355-373.
Mani, S., Hoddinott, J., & Strauss, J. (2013), “Determinants of Schooling: Empirical Evidence from
Rural Ethiopia”, Journal of African Economies, 22(5), 693-731.
Markelova, H., Meinzen-Dick, R., Hellin, J., & Dohrn, S. (2009). Collective action for smallholder
market access. Food policy, 34(1), 1-7.
McCune, B. & Keon, D. (2002). Equations for potential annual direct incident radiation and heat load.
Journal of Vegetation Science, 13, 603-606.
McIntyre, B. D. (Ed.). (2009). Synthesis report: A synthesis of the global and sub-global IAASTD
reports (Vol. 7). Island Press, 1718 Connecticut Avenue, NW, Suite 300, Washington, DC 20009.
Méndez, V. E., Bacon, C. M., Olson, M., Petchers, S., Herrador, D., Carranza, C., ... & Mendoza, A.
(2010). Effects of Fair Trade and organic certifications on small-scale coffee farmer households
in Central America and Mexico. Renewable Agriculture and Food Systems, 25(03), 236-251.
MFPED (Ministry of Finance, Planning and Economic Development) of Uganda (2015). Uganda
Poverty Status Report 2014: Structural Change and Poverty Reduction in Uganda. Uganda
Printing and Publishing Corporation, P. O. Box 33, Entebbe.
Minten, B., Randrianarison, L., & Swinnen, J. (2007). Spillovers from high‐value agriculture for exports
on land use in developing countries: evidence from Madagascar. Agricultural Economics, 37(2‐3), 265-275.
Minten, B., Randrianarison, L., & Swinnen, J. F. (2009). Global retail chains and poor farmers:
Evidence from Madagascar. World Development, 37(11), 1728-1741.
Mitiku, F., de Mey, Y., Nyssen, J., & Maertens, M. (2017). Do Private Sustainability Standards
Contribute to Income Growth and Poverty Alleviation? A Comparison of Different Coffee
Certification Schemes in Ethiopia. Sustainability, 9(2), 246.
143
MoESTS (Ministry of Education, Science, Technology and Sports) (2017). Education Management
Information System (EMIS), www.education.go.ug, [accessed, February, 2017].
Mokany, K., Raison, R., & Prokushkin, A. S. (2006). Critical analysis of root: shoot ratios in terrestrial
biomes. Global Change Biology, 12(1), 84-96.
Molden, D. Ed. (2007). Water for Food, Water for Life: A Comprehensive Assessment of Water
Management in Agriculture. Earthscan, London.
Montaud, J. M., & Tankari, M. (2016). When Social and Economic Goals Meet: The Double Dividend
of Improving Farmers’ Health Capital in Uganda. The Journal of Development Studies, 52(9),
1258-1272.
Moseley, W. G., Carney, J., & Becker, L. (2010). Neoliberal policy, rural livelihoods, and urban food
security in West Africa: A comparative study of The Gambia, Côte d'Ivoire, and
Mali. Proceedings of the National Academy of Sciences, 107(13), 5774-5779.
Mundial, B. (2006). World Development Report 2007: Development and the next generation. The
World Bank, Washington, DC.
Musumba, M., & Gupta, R. S. (2013). Transmission of World Prices to Ugandan Coffee Growers in a
Liberalised Economy. Development Policy Review, 31(2), 219-234.
Muyinda, H., & Mugisha, J. (2015). Stock-outs, uncertainty and improvisation in access to healthcare
in war-torn Northern Uganda. Social Science & Medicine, 146, 316-323.
Naranpanawa, A., & Arora, R. (2014). Does trade liberalization promote regional disparities? Evidence
from a multiregional CGE model of India. World Development, 64, 339-349.
Negash, M., Starr, M., Kanninen, M., & Berhe, L. (2013). Allometric equations for estimating
aboveground biomass of Coffea arabica L. grown in the Rift Valley escarpment of
Ethiopia. Agroforestry Systems, 87(4), 953-966.
Neilson, J. (2008). Global private regulation and value-chain restructuring in Indonesian smallholder
coffee systems. World Development, 36(9), 1607-1622.
Newman, S. A. (2009). Financialization and changes in the social relations along commodity chains:
The case of coffee. Review of Radical Political Economics, 41(4), 539-559.
Nishimura, M., Yamano, T., & Sasaoka, Y. (2008). Impacts of the universal primary education policy
on educational attainment and private costs in rural Uganda. international Journal of Educational
development, 28(2), 161-175.
Nkonya, E. (Ed.). (2004). Strategies for sustainable land management and poverty reduction in
Uganda (Vol. 133). International Food Policy Research Institute, Washington, DC.
Nyirinkindi, E. & Opagi, M. (2010). “Privatisation and Parastatal reform”: In F. Kuteesa, E.
Tumusiime-Mutebile, A. Whitworth & T. Williamson (Eds), Uganda’s Economic Reforms:
Insider Accounts; Oxford University Press Inc., New York, 355-373.
Oketch, M., Mutisya, M., Ngware, M., & Ezeh, A. C. (2010). Why are there proportionately more poor
pupils enrolled in non-state schools in urban Kenya in spite of FPE policy? International Journal
of Educational Development, 30(1), 23-32.
Okidi J.A., Ssewanyana S., Bategeka, L. & Muhumuza, F. (2007). “Uganda’s experience with
operationalizing pro-poor growth, 1992-2003”: In: T. Besley and L.J. Cord (Eds), Delivering on
the promise of pro-poor growth: insights and lessons from country experiences, World Bank and
Palgrave Macmillan, New York, 169-198.
Omoeva, C., & Gale, C. (2016). Universal, but not free: Household schooling costs and equity effects
of Uganda’s Universal Secondary Education policy. International Journal of Educational
Development, 50, 41-50.
OWW (Oxfam Wereld Winkels) (2013). Wie heft de macht?
Penny, A., Ward, M., Read, T., & Bines, H. (2008). Education sector reform: The Ugandan
experience. International Journal of Educational Development, 28(3), 268-285.
Perfecto, I., Vandermeer, J., Mas, A., & Pinto, L. S. (2005). Biodiversity, yield, and shade coffee
certification. Ecological Economics, 54(4), 435-446.
Petkova, I. (2006). Shifting regimes of governance in the coffee market: From secular crisis to a new
equilibrium?. Review of International Political Economy, 13(2), 313-339.
Philpott, S. M., Arendt, W. J., Armbrecht, I., Bichier, P., Diestch, T. V., Gordon, C., ... & TEJEDA‐CRUZ, C. E. S. A. R. (2008). Biodiversity loss in Latin American coffee landscapes: review of
the evidence on ants, birds, and trees. Conservation Biology, 22(5), 1093-1105.
144
Philpott, S. M., Bichier, P., Rice, R., & Greenberg, R. (2007). Field‐testing ecological and economic
benefits of coffee certification programs. Conservation Biology, 21(4), 975-985.
Pochet P. & Flémal J. (2001). “Beverage and stimulant crops: Coffee”, In: R.H. Raemaekers (Eds),
Crop Production in Tropical Africa, Directorate general for international Cooperation (DGIC),
Karmelietenstraat 15 - Rue des Petits Carmes 15, B-1000 Brussels, Belgium.
Ponte, S. (2002a). The “Latte Revolution”? Regulation, markets and consumption in the global coffee
chain. World Development, 30 (7) (2002), pp. 1099–1122.
Ponte, S. (2002b). Brewing a Bitter Cup? Deregulation, Quality and the Re‐organization of Coffee
Marketing in East Africa. Journal of agrarian change, 2(2), 248-272.
Potts, J., Lynch, M., Wilkings, A., Huppé, G. A., Cunningham, M., & Voora, V. A. (2014). The state
of sustainability initiatives review 2014: Standards and the green economy. Winnepeg:
International Institute for Sustainable Development.
Poulton, C., Dorward, A. & Kydd, J. (2010). The Future of Small Farms: New Directions for Services,
Institutions, and Intermediation, World Development, (38)10, 1413-1428.
Poulton, C., Gibbon, P., Hanyani-Mlambo, B., Kydd, J., Maro, W., Larsen, M. N., ... & Zulu, B. (2004).
Competition and coordination in liberalized African cotton market systems. World
Development, 32(3), 519-536.
Poulton, C., Kydd, J. Wiggins, S. & Dorward, A (2006). State intervention for food price stabilisation
in Africa: Can it work?, Food Policy, 31(2006), 342–356.
Rainforest Alliance (2016 & 2017). About rainforest alliance, www.rainforest-alliance.org.
Rawlings, L.B. & Rubio, G.M. (2005). Evaluating the impact of Conditional cash transfer programs.
The World Bank Research Observer, 20(1), 29-55.
Raynolds, L. T. (2012). Fair Trade: Social regulation in global food markets. Journal of Rural
Studies, 28(3), 276-287.
Reardon, T. (2015). The hidden middle: the quiet revolution in the midstream of agri-food value chains
in developing countries, Oxford Review of Economic Policy, 31(1), 45-63.
Reardon, T., Barrett, C. B., Berdegué, J. A., & Swinnen, J. F. (2009). Agrifood industry transformation
and small farmers in developing countries. World development, 37(11), 1717-1727.
Reinecke, J., Manning, S., & Von Hagen, O. (2012). The emergence of a standards market: Multiplicity
of sustainability standards in the global coffee industry. Organization Studies, 33(5-6), 791-814.
Riddell, J. B. (1992). Things fall apart again: structural adjustment programmes in sub-Saharan
Africa. The Journal of Modern African Studies, 30(01), 53-68.
Röling N. (2009). “Conceptual and methodological developments in innovation”, In: P.S. Sanginga, A.
Waters-Bayer, S. Kaaria, J. Njuki, J. and C. Wettasinha (Eds), Innovation Africa: enriching
Farmers’ Livelihoods. Earthscan, Dunstan House, 14a St Cross St, London EC1N 8XA, UK, 9-
34.
Rosenbaum, P. R., & Rubin, D. B. (1983). The central role of the propensity score in observational
studies for causal effects. Biometrika, 70(1), 41-55.
Rousseau, S. (2015). The role of organic and fair trade labels when choosing chocolate. Food Quality
and Preference, 44, 92-100.
Ruben, R. & Fort, R. (2012). The impact of fair trade certification for coffee farmers in Peru. World
development, 40(3), 570-582.
Ruben, R., & Zuniga, G. (2011). How standards compete: comparative impact of coffee certification
schemes in Northern Nicaragua. Supply Chain Management: An International Journal, 16(2), 98-
109.
Rueda, X., & Lambin, E. (2013). Responding to globalization: impacts of certification on Colombian
small-scale coffee growers. Ecology and Society, 18(3).
Rueda, X., Thomas, N. E., & Lambin, E. F. (2015). Eco-certification and coffee cultivation enhance
tree cover and forest connectivity in the Colombian coffee landscapes. Regional environmental
change, 15(1), 25-33.
Russell, B., Mohan, S. & Banerjee, A. (2012). Coffee Market Liberalisation and the Implications for
Producers in Brazil, Guatemala and India, World Bank Economic Review, 26(3), 514-538.
Rutherford, M. A. (2006). Current knowledge of coffee wilt disease, a major constraint to coffee
production in Africa. Phytopathology, 96(6), 663-666.
145
SAN (Sustainable Agriculture Network) (2014). Our standard. www.san.ag [Accessed December
2014].
SAPRI, S. A. (2004). The Policy Roots of Economic Crisis, Poverty and Inequality, SAPRIN, London,
NY, Penang.
Schiff, M. W., & Vald, A. (1992). The plundering of agriculture in developing countries. World Bank
Publications.
Schuster, M., & Maertens, M. (2015). The impact of private food standards on developing countries’
export performance: An analysis of asparagus firms in Peru. World Development, 66 (66), 208–
221.
Simpson, E.H. (1949). Measurement of Diversity. Nature 163, 688.
Sörensen, R., Zinko, U., & Seibert, J. (2006). On the calculation of the topographic wetness index:
evaluation of different methods based on field observations. Hydrology and Earth System
Sciences Discussions, 10(1), 101-112.
Steffan-Dewenter, I., Kessler, M., Barkmann, J., Bos, M. M., Buchori, D., Erasmi, S., ... & Guhardja,
E. (2007). Tradeoffs between income, biodiversity, and ecosystem functioning during tropical
rainforest conversion and agroforestry intensification. Proceedings of the National Academy of
Sciences, 104(12), 4973-4978.
Swinnen, J. F., & Maertens, M. (2007). Globalization, privatization, and vertical coordination in food
value chains in developing and transition countries. Agricultural economics, 37(s1), 89-102.
Swinnen, J., & Vandeplas, A. (2011). Rich consumers and poor producers: quality and rent distribution
in global value chains. Journal of Globalization and Development, 2(2).
Swinnen, J.F.M., Vandenplas, A. & Maertens, M. (2010). Liberalization, Endogenous Institutions and
Growth: A Comparative Analysis of Agricultural Reform in Africa, Asia, and Europe, The World
Bank Economic Review, 1-33.
Tenywa, M. M., Isabirye, M. I., Lal, R., Lufafa, A., & Achan, P. (1999). Cultural practices and
production constraints in smallholder banana-based cropping systems of Uganda’s Lake Victoria
Basin. African Crop Science Journal, 7(4), 541-550.
Teuscher, M., Vorlaufer, M., Wollni, M., Brose, U., Mulyani, Y., & Clough, Y. (2015). Trade-offs
between bird diversity and abundance, yields and revenue in smallholder oil palm plantations in
Sumatra, Indonesia. Biological Conservation, 186, 306-318.
Thiery, W., Davin, E. L., Panitz, H. J., Demuzere, M., Lhermitte, S., & Van Lipzig, N. (2015). The
impact of the African Great Lakes on the regional climate. Journal of Climate, 28(10), 4061-
4085.
Tscharntke, T., Clough, Y., Bhagwat, S. A., Buchori, D., Faust, H., Hertel, D., ... & Scherber, C. (2011).
Multifunctional shade‐tree management in tropical agroforestry landscapes–a review. Journal of
Applied Ecology, 48(3), 619-629.
Tscharntke, T., Milder, J. C., Schroth, G., Clough, Y., DeClerck, F., Waldron, A., ... & Ghazoul, J.
(2015). Conserving biodiversity through certification of tropical agroforestry crops at local and
landscape scales. Conservation Letters, 8(1), 14-23.
Tumusiime, E., Brorsen, B. W., & Vitale, J. D. (2014). Vertical integration in West Africa's cotton
industry: are parastatals a second best solution?. Agricultural Economics, 45(S1), 129-143.
UBOS (Uganda Bureau of Statistics) (2014). National population and housing census report, Kampala,
Uganda.
UCDA (Uganda Coffee Development Authority) (2014 & 2015). Annual reports, (Vol. 22 & 23),
Kampala, Uganda.
UCDA (Uganda Coffee Development Authority) (2016 & 2017). Fact sheet. www.ugandacoffee.go.ug,
[Accessed 15 December 2016 & February 2017].
UCF (Uganda Coffee Federation) (1997/98 to 2011/12). The Coffee Year Book, Kampala, Uganda.
Uehara-Prado, M., de Oliveira Fernandes, J., de Moura Bello, A., Machado, G., Santos, A. J., Vaz-de-
Mello, F. Z., & Freitas, A. V. L. (2009). Selecting terrestrial arthropods as indicators of small-
scale disturbance: A first approach in the Brazilian Atlantic Forest. Biological
Conservation, 142(6), 1220-1228.
UNDP (United Nations Development Programme) (2012). Value Chain Analysis (VCA) of the Coffee
Sub-sector in Uganda: Feasibility study for the Development of Inclusive Markets in Agriculture
and Trade (DIMAT) project, Kampala, Uganda .
146
UNESCO (United Nations Education and Scientific Organisation) (2017). Education indicators.
www.uis.unesco.org [Accessed 20 June 2016].
United Nations (2015). The Millennium Development Goals Report. www.un.org [Accessed 10 March
2017].
United Nations (2017). Sustainable Development Goals. www.un.org [Accessed on 3 June, 2017].
USGS (United States Geological Survey) (2015). www.earthexplorer.usgs.gov, [Accessed 15 February
2015].
Utz-certified (2016). About Utz. www.utz.org. [Accessed 10 March 2016].
Valkila, J. (2009). Fair Trade organic coffee production in Nicaragua - Sustainable development or a
poverty trap?. Ecological Economics, 68(12), 3018-3025.
Valkila, J., & Nygren, A. (2010). Impacts of Fair Trade certification on coffee farmers, cooperatives,
and laborers in Nicaragua. Agriculture and Human Values, 27(3), 321-333.
Van Asten, P. J. A., Wairegi, L. W. I., Mukasa, D., & Uringi, N. O. (2011). Agronomic and economic
benefits of coffee–banana intercropping in Uganda’s smallholder farming systems. Agricultural
systems, 104(4), 326-334.
Van den Broeck, G. & Maertens, M. (2015). Female employment reduces fertility in rural Senegal. PloS
one, 10(3), e0122086.
Van Rijsbergen, B., Elbers, W., Ruben, R. & Njuguna, S.N. (2016). The ambivalent impact of coffee
certification on farmers’ welfare: A matched panel approach for cooperatives in Central Kenya.
World Development, 77, 277–292.
Varangis, P., & Schreiber, G. (2001). Cocoa market reforms in West Africa. Commodity market
reforms: Lessons of two decades, 35-82.
Vecchio, R., & Annunziata, A. (2015). Willingness-to-pay for sustainability-labelled chocolate: an
experimental auction approach. Journal of Cleaner Production, 86, 335-342.
Verhofstadt, E., & Maertens, M. (2014). Smallholder cooperatives and agricultural performance in
Rwanda: do organizational differences matter?. Agricultural economics, 45(S1), 39-52.
Wang, N., Jassogne, L., van Asten, P.J.A., Mukasa, D., Wanyama, I., Kagezi, G. and Giller, K.E.
(2015). Evaluating coffee yield gaps and important biotic, abiotic, and management factors
limiting coffee production in Uganda, European Journal of Agronomy, 63 (2015) 1-11.
Ward, M., Penny, A & Read, T. (2006). Education reform in Uganda - 1997 to 2004: Reflections on
policy, Partnership strategy and implementation. London: DFID.
Weatherspoon, D.D., & Reardon, T. (2003). The rise of supermarkets in Africa: implications for agri-
food systems and the rural poor. Development policy review, 21(3), 333-355.
Weber, J. G. (2011). How much more do growers receive for fair trade-organic coffee? Food Policy,
36(5), 678–685.
Wilcox, M. D. & Abbott, P. C. (2004). Market power and structural adjustment: the case of West
African cocoa market liberalization. In American Agricultural Economics Association Annual
Meeting (1-4).
Wollni, M. & Zeller, M. (2007). Do Farmers Benefit from Participating in Specialty Markets and
Cooperatives? The Case of Coffee Marketing in Costa Rica. Agricultural Economics, 37(2), 243-
248.
World Bank (2006). The World Development Report, 2007: Enhancing Agricultural Innovation: How
to Go beyond the strengthening of research systems. Washington DC: The WB, Agricultural and
Rural Development Division.
World Bank (2007). The World Development Report, 2008: Agriculture for Development. Washington
DC: The WB, Agricultural and Rural Development Division.
World Bank (2009). Africa development indicators 2008/2009: youth and employment in Africa: the
potential, the problem, the promise. Washington DC: The WB, Agricultural and Rural
Development Division.
World Bank (2011). Uganda Coffee Supply Chain Risk Assessment.
www.agriskmanagementforum.org [Accessed 19 September 2013].
World Bank (2015 & 2017). World Development Indicators. www.worldbank.org. [Accessed 20
October 2015 & 19 June 2017]
Yadessa, G. (2014). Genetic Diversity, Pollination Ecology and Organoleptic Characteristics of Coffea
arabica L. in Ethiopian Moist Forests of Different Management Intensity.
147
Zanne, A. E., Lopez-Gonzalez, G., Coomes, D. A., Ilic, J., Jansen, S., Lewis, S. L., ... & Chave, J.
(2009). Global wood density database. Retrieved from http://hdl.handle.net.
Zhao, M., & Glewwe, P. (2010). What determines basic school attainment in developing countries?
Evidence from rural China. Economics of Education Review, 29(3), 451-460. Ito, J., Bao, Z., &
Su, Q. (2012). Distributional effects of agricultural cooperatives in China: Exclusion of
smallholders and potential gains on participation. Food Policy, 37(6), 700-709.
148
Popular Summary
Private food standards in global agri-food value chains are rapidly spreading, in response to concerns
of consumers in high income countries about the impact of liberalised trade on smallholder producers
in developing countries, and on the environment. These standards focus on a wide range of societal
concerns including food safety, food quality, ethics and care for the environment. As liberalisation of
trade deepens, private food standards have become a global phenomenon, with a key role in
modernisation processes of global agri-food value chains and impact on all chain actors including
producers, traders, bulkers and distributors. These standards make many promises on sustainable
development outcomes at smallholder producer level and it is imperative therefore, to understand the
impact of private food standards, regarding these promises in order to justify the extra efforts by
producers in developing countries and the extra premium paid by consumers in high income countries.
Such studies are also important for several reasons: many developing countries depend heavily on agri-
food exports; majority of the smallholder producers in these export chains are living in poverty;
empirical evidence on the impact of private food standards on smallholders is still scarce; there is no
consensus as to whether private food standards keep the many promises they make; and yet certification
to multiple standards is on the rise as companies compete for the niche markets that certified production
occupy.
This dissertation aims to unravel the link between private standards in the coffee sector and smallholder
producer performance on sustainable development outcomes. We focus on the Mount Elgon region of
Eastern Uganda, where all the five major private coffee standards namely; Fairtrade, Organic, Utz,
Rainforest alliance and 4C, are being implemented since 2000. We use qualitative, cross-sectional and
secondary data and apply various analytical methods to describe the coffee value chain and investigate
the impact of private coffee standards on producer welfare and on child schooling. We also explore the
trade-off between socio-economic and environmental impact of private coffee standards.
Findings and conclusions
We demonstrate that over two decades after liberalisation, the value chain has transformed from
a simple state controlled commodity chain to a complex value chain which is better organised,
receives foreign direct investment and with many innovations at technical, commercial and
institutional levels. Although there are many improvements, results show that challenges
remain regarding low yields, poor quality at bulking stage, unclear agricultural extension
mechanisms, under-developed input markets and oversupply of certified coffee.
We show that participation in a triple Utz-Rainforest Alliance-Common Code of Conduct for
Coffee (Utz-Rainforest-4C) coffee certification scheme increases coffee yields, coffee income,
total household income, labour productivity and reduces poverty by 16 percentage points. We
show that participation in a double Fairtrade-Organic coffee certification scheme, reduces
coffee yields, coffee income, total household income, labour productivity and has no impact on
poverty. These results imply that although private food standards have the potential to improve
producer welfare, they do not always walk the talk as in the case of Fairtrade-Organic.
We find that the double Fairtrade-Organic certification increases the likelihood of children to
be enrolled in primary school, the likelihood to be enrolled in secondary school, primary
schooling efficiency and secondary schooling efficiency. We find that the triple Utz-Rainforest-
4C certification has no impact on both school enrolment and schooling efficiency. The results
imply that prohibition of child labour alone is not sufficient to improve schooling outcomes and
private food standards need to make extra investments in order to yield positive results. The
149
results also imply that in the Mount Elgon region, Fairtrade keeps its promise regarding child
schooling.
We find that the triple Utz-Rainforest-4C certification increases coffee yields, labour
productivity and coffee incomes, and decreases the incidence of poverty but reduces ecosystem
services on coffee fields. The double Fairtrade-Organic certification results in higher ant and
rove beetle abundance, larger tree diversity and larger carbon storage on coffee fields but
reduces yield, labour productivity and coffee incomes – despite higher farm-gate prices. Results
suggest that private food standards reduce trade-offs between economic and ecological benefits
but fail to create win-win outcomes for economic and environmental sustainability.
Overall, this dissertation shows that private coffee standards play an important role in the modernisation
process of the coffee value chain in Uganda through the contributions they make to value chain
innovations and structural re-configuration. Private coffee standards have the potential to contribute to
sustainable smallholder coffee production if positive aspects of the various standards could be
harmonised for the specific case of Mount Elgon.
150
CURRICULUM VITAE - Kevin Teopista AKOYI
Address Leuvensebaan 97, 3040 Ottenburg
E-mail [email protected]
Telephone +32 497 69 11 42; +256 758 86 11 51
Skype kvn.teo.akoyi
Nationality Ugandan
EDUCATION
2013 - 2017 PhD in Agricultural and Development Economics, KU Leuven: “Private
Coffee Standards and Sustainable Development: A Case Study from
Uganda”. Supervisor: Prof. Miet Maertens.
1991 - 1993 MSc. Agricultural Economics. Makerere University, P.O. Box 7062,
KAMPALA, Uganda. Major: Economic Adjustment and Agricultural Policies;
Msc Thesis: "Price Risk in Supply Analysis: The Case of Cotton in Uganda."
Supervisors: Prof. Manuel Vanegas, Prof. Peter Ngategize.
1986 – 1990 BSc. Agriculture (Management/Economics option) Honours. Makerere
University, P.O. Box 7062, KAMPALA, Uganda.
PROFESSIONAL EXPERIENCE
Research Assistant 2013 – 2017 at the division of Bio-economics, KU Leuven
MSc Thesis supervision Daily supervision of research design, data collection, analysis and
writing
Teaching Exercise sessions for the course “Natural Resource Economics and
Policies”
Reviewing students’ essays for the course “Agricultural Economics and
Food Policy in Developing Countries”
Data collection
February – May 2014 Quantitative survey of 600 coffee producing households,
Quantitative survey of 300 village leaders,
August – September 2013 Qualitative semi-structured interviews with coffee value chain
stakeholders in Uganda,
Coffee value chain mapping.
Data analysis
Impact evaluation Cross-sectional data, OLS regressions, fixed effects modelling,
Instrumental Variable techniques, Difference-in-Difference estimation.
Trade-off assessment Generalized linear interactive mixed models with log link function
(GLIMMIX), Kendall’s correlation analysis, least square means.
Value chain mapping Innovations systems and value chain concepts
151
Research Assistant 1993 at the department of Agricultural Economics, Makerere University.
MSc Thesis supervision Daily supervision of research design, data collection, analysis and
writing
Teaching Exercise sessions for the course “Production Economics”
Design, implementation, monitoring and management of development programs
2013 Regional Program Manager Vredeseilanden East Africa. P.O. Box 7844,
KAMPALA.: Strategic and operational management of Vredeseilanden
programs East Africa. Vredeseilanden core business – Facilitating value
chain development with smallholder producers in South.
2003 – 2011 Program Director, Vredeseilanden Head Office, Blijde Inkomststraat 50,
3000 LEUVEN, Belgium. Strategic and operational management of
Vredeseilanden programs Africa, South East Asia and Latin America.
1997 – 2002 Country Representative, Vredeseilanden in Uganda; Strategic and
operational management of Vredeseilanden programs Uganda.
1995 – 1997 Programme Officer, Vredeseilanden in Uganda; Methodological,
technical and managerial support of partners organisations, regular
follow up of activities, networking and advocacy.
1993 – 1995 Administrator/Research Officer, the Smallholder Irrigation Scheme
Development Organisation (SISDO). P. O. Box 76622 Nairobi, Kenya.
Design and implementation of credit and organisational administrative
and research systems. SISDO core business – credit administration to
smallholder horticultural farmers for community development of
irrigated horticultural production.
Technical input in national and international policy and research initiatives
2000 - 2002 Member of the national committee on The National Agricultural
Research Systems (NARs) review in Uganda; Restructuring agricultural
research in Uganda.
2000 – 2001 Member of the task force for the review Poverty Eradication Action Plan
(PEAP) of the Government of Uganda; Updating the national poverty
eradication strategy.
2001 – 2002 Member of the National Steering Committee - monitoring and evaluation
sub-committee of the Plan for Modernisation of Agriculture (PMA) of
the Government of Uganda; Monitoring progress of PMA
implementation.
1998 – 2002 Member of the international steering committee of The Structural
Adjustment Participatory Review Initiative (SAPRI) Network;
Secretariat – The Development GAP, 3179 18th Street NW, Washington

152
DC, 20010, USA; Designing, implementing and communicating results
of SAPRI research.
2004 – 2008 Member of a multi-stakeholder steering committee of the International
Assessment for Agricultural Science and Technology for Development
(IAASTD; Secretariat – The World Bank, 1818 H St. NW, Washington,
DC 20006, USA; Tel: +1-202-473 1000. Designing and monitoring the
IAASTD assessment process.
GRANTS
1991 USAID/MFAD scholarship for manpower development - agricultural
policies in Uganda
2013 OT KU Leuven scholarship program
2014 DBOF KU Leuven scholarship program
SKILLS
Languages English: Excellent
French: Good
Dutch: Good
Swahili: Fair
Software SPSS, Stata, CSPro, Microsoft Office (Word, Excel and PowerPoint)
MISCELLANEOUS
Hobbies Hiking and Singing
Interests Research on trade impact on development, cooking, reading, travelling
Short course certificates Social Development, Advanced Management, Consultancy Skills
Development, Project Design and Facilitation using the Logical
Framework, Gender for Development Practice in Africa; Advocacy
Skills, Change Management, Outcome Mapping for Monitoring and
Evaluation, Sustainable Agriculture Chain development (SACD)
strategies:
PUBLICATIONS
Articles in internationally peer reviewed journals
Akoyi, K. T. & Maertens, M. (2017). Walk the Talk: Private Sustainability Standards in the Ugandan
Coffee Sector. The Journal of Development Studies, 1-27.
Book chapters
153
Graham, Y., Anyemedu, K. & Akoyi-Makokha, K.T. (2004). The Impact of Agricultural Sector
Adjustment Policies on Small Farmers and Food Security, pp 132-152: In: SAPRI (Eds), Structural
Adjustment: The Policy Roots of Economic Crisis, Poverty and Inequality, Zed Books – London &
New York, TWN – Malaysia and IBON – the Philippines.
154
Working papers
Akoyi, K.T. & Maertens, M. (2016). Private Sustainability Standards in the Ugandan Coffee Sector:
Empty Promises or Catalysts for Development? Bioeconomics Working Paper Series, 2016/3.
Akoyi, K. T. & Maertens, M. (2017). Liberalisation and Modernisation in the Coffee Value Chain in
Uganda. Division of Bio-economics Working paper Series, 2017, Leuven.
Akoyi, K. T. & Maertens, M. (2017). Do private food standards fulfil their child welfare promises? Coffee
certification and schooling in Uganda. Division of Bio-economics Working paper Series, 2017,
Leuven.
Vanderhaegen, K., Akoyi, K.T., Dekoninck, W., Jocqué, R., Muys, B., Verbist, B. & Maertens, M. (2017).
Do Private Coffee Standards ‘Walk the Talk’ in Improving Economic and Environmental
Sustainability?
Conference papers
Akoyi, K. T., & Maertens, M. (2015). Do private sustainability standards improve smallholder welfare?
The case of coffee in Mount Elgon, Uganda. Policy seminar of the European Association of
Agricultural Economists. Den Haag, 30th November, 2015.
Akoyi, K. T., & Maertens, M. (2015). Do Private Sustainability Standards Improve Smallholder Welfare?
The Case of Coffee in Mount Elgon, Uganda. Conference on Global Food Security. Cornell
University, Ithaca, NY, 11th – 14th October, 2015.
Akoyi, K. T., & Maertens, M. (2015). Private Sustainability Standards: What is in it for coffee farmers
in Uganda? Ghent – Africa platform symposium. Ghent, 17th December, 2015.
Akoyi, K. T. (2016).Impact of Private Sustainability Standards on Land Productivity: The case of Coffee
in Uganda? PhD Symposium of the Belgian Association of Agricultural Economists. Antwerp, 11th
March, 2016.
Vanderhaegen, K.. & Akoyi, K.T. (2016). Voluntary Sustainability Standards: What is in it for producers
& the environment in Uganda? ACademic Research Organisation for POLIcy Support
(ACROPOLIS) for the Belgian Development Cooperation - KLIMOS - Generating Capacity for
Sustainability Transition. Brussels, 18th April, 2016.
Akoyi, K. T., & Maertens, M. (2017).Do Private Sustainability Standards Improve Child Schooling?
The Case of Coffee in Uganda. Third Global Food Symposium. Georg-August Universtat,
Goettingen, 28th – 29th April, 2017.