Prisoners in 2010 - bjs.govbjs.gov/content/pub/pdf/p10.pdf · 2 PRISoNeRS IN 2010 State...
38
U.S. Department of Justice Office of Justice Programs Bureau of Justice Statistics BJS Bulletin For a list of all publications in this series, go to http://www.bjs.gov/index.cfm?ty=pbse&sid=32. December 2011, NCJ 236096 Prisoners in 2010 Paul Guerino, Paige M. Harrison, and William J. Sabol, BJS Statisticians O n December 31, 2010, state and federal correctional authorities had jurisdiction over 1,612,395 prisoners, a decrease of 5,575 prisoners from yearend 2009 (figure 1). e combined U.S. prison population decreased 0.3% in 2010, the first decline since 1972. e 2010 imprisonment rate for the nation was 500 sentenced prisoners per 100,000 U.S. residents, which is 1 in 200 residents. e statistics in this report are drawn from the Bureau of Justice Statistics’ (BJS) National Prisoner Statistics (NPS) series, which annually collects data on prisoner counts and characteristics, as well as admissions, releases, and capacity, from the 50 states and the Federal Bureau of Prisons. e 2010 NPS collection is the 85th in a series begun in 1925. HIGHLIGHTS The overall U.S. prison population declined in 2010 for the first time since 1972. State and federal prisoners numbered 1,612,395 at yearend 2010, a decrease of 0.3% (5,575 prisoners) from yearend 2009. The federal prison population increased by 0.8% (1,653 prisoners), while the number of prisoners under state authority declined by 0.5% (7,228 prisoners). Half of state departments of corrections (25) reported decreases in their prison populations during 2010. California (down 6,213) reported the largest decline in absolute numbers, while Rhode Island (down 8.6%) reported the largest percentage decrease. During 2010, prison releases (708,677) exceeded prison admissions (703,798) for the first time since BJS began collecting jurisdictional data in 1977. The stability in prison release rates and expected time to be served indicates that the change in the state prison population between 2009 and 2010 was the result of a decrease in state prison admissions. The imprisonment rate was 500 inmates per 100,000 U.S. residents in 2010, continuing the decline since imprisonment rates peaked at 506 per 100,000 in 2007. In 2009, the most recent data available, 53% of state prison inmates were serving time for violent offenses, 19% for property, 18% for drug, and 9% for public- order offenses. About half (51%) of federal inmates in 2010 were serving time for drug offenses, 35% for public-order offenses (largely weapons and immigration), and less than 10% each for violent and property offenses. States held 2,295 inmates under age 18 in custody at midyear 2010, down from 2,779 at midyear 2009. A reported 95,977 non citizens were held in state custody at midyear 2010, down from 97,133 at midyear 2009. Revised 2/9/12 1,000,000 1,250,000 1,500,000 1,750,000 Number 2010 2009 2008 2007 2006 2005 2004 2003 2002 2001 2000 Annual percent change On December 31 Number -1.0 0.0 1.0 2.0 3.0 Annual percent change FIGURE 1 Prisoners under state and federal jurisdiction at yearend, 2000–2010 Note: Jurisdiction refers to the legal authority of state or federal correctional officials over a prisoner regardless of where the prisoner is held. Source: BJS, National Prisoner Statistics Program.
Transcript of Prisoners in 2010 - bjs.govbjs.gov/content/pub/pdf/p10.pdf · 2 PRISoNeRS IN 2010 State...
U.S. Department of JusticeOffice of Justice ProgramsBureau of Justice Statistics
BJS
Bu
lletin
For a list of all publications in this series, go to http://www.bjs.gov/index.cfm?ty=pbse&sid=32.
December 2011, NCJ 236096
Prisoners in 2010Paul Guerino, Paige M. Harrison, and William J. Sabol, BJS Statisticians
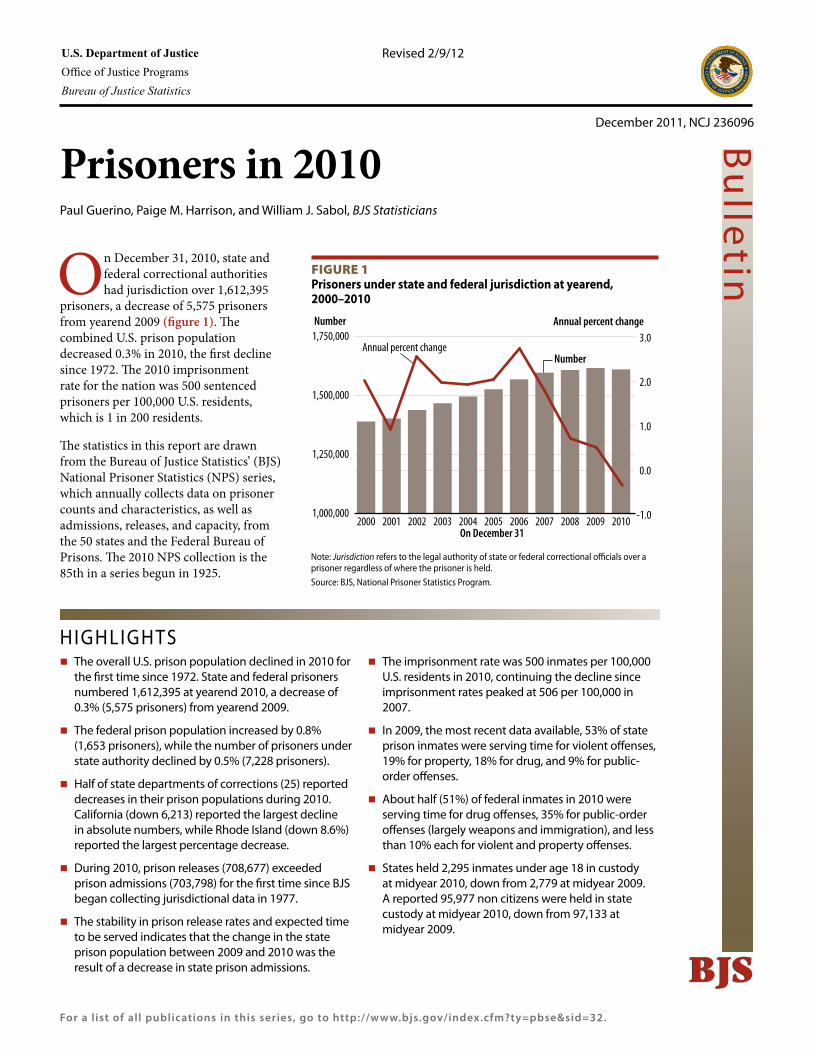
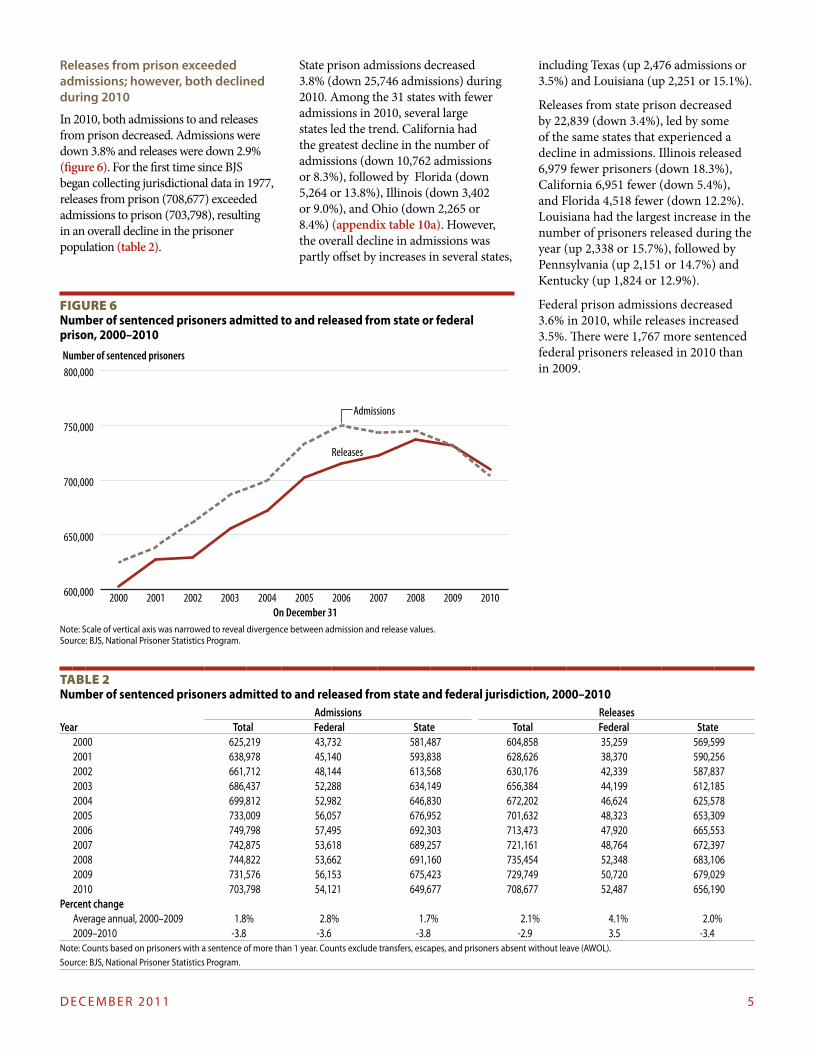
On December 31, 2010, state and federal correctional authorities had jurisdiction over 1,612,395
prisoners, a decrease of 5,575 prisoners from yearend 2009 (figure 1). The combined U.S. prison population decreased 0.3% in 2010, the first decline since 1972. The 2010 imprisonment rate for the nation was 500 sentenced prisoners per 100,000 U.S. residents, which is 1 in 200 residents.
The statistics in this report are drawn from the Bureau of Justice Statistics’ (BJS)National Prisoner Statistics (NPS) series, which annually collects data on prisoner counts and characteristics, as well as admissions, releases, and capacity, from the 50 states and the Federal Bureau of Prisons. The 2010 NPS collection is the 85th in a series begun in 1925.
HIGHLIGHTS � The overall U.S. prison population declined in 2010 for
the first time since 1972. State and federal prisoners numbered 1,612,395 at yearend 2010, a decrease of 0.3% (5,575 prisoners) from yearend 2009.
� The federal prison population increased by 0.8% (1,653 prisoners), while the number of prisoners under state authority declined by 0.5% (7,228 prisoners).
� Half of state departments of corrections (25) reported decreases in their prison populations during 2010. California (down 6,213) reported the largest decline in absolute numbers, while Rhode Island (down 8.6%) reported the largest percentage decrease.
� During 2010, prison releases (708,677) exceeded prison admissions (703,798) for the first time since BJS began collecting jurisdictional data in 1977.
� The stability in prison release rates and expected time to be served indicates that the change in the state prison population between 2009 and 2010 was the result of a decrease in state prison admissions.
� The imprisonment rate was 500 inmates per 100,000 U.S. residents in 2010, continuing the decline since imprisonment rates peaked at 506 per 100,000 in 2007.
� In 2009, the most recent data available, 53% of state prison inmates were serving time for violent offenses, 19% for property, 18% for drug, and 9% for public-order offenses.
� About half (51%) of federal inmates in 2010 were serving time for drug offenses, 35% for public-order offenses (largely weapons and immigration), and less than 10% each for violent and property offenses.
� States held 2,295 inmates under age 18 in custody at midyear 2010, down from 2,779 at midyear 2009. A reported 95,977 non citizens were held in state custody at midyear 2010, down from 97,133 at midyear 2009.
Revised 2/9/12
1,000,000
1,250,000
1,500,000
1,750,000Number
20102009200820072006200520042003200220012000
Annual percent change
On December 31
Number
-1.0
0.0
1.0
2.0
3.0Annual percent change
Figure 1Prisoners under state and federal jurisdiction at yearend, 2000–2010
Note: Jurisdiction refers to the legal authority of state or federal correctional officials over a prisoner regardless of where the prisoner is held.Source: BJS, National Prisoner Statistics Program.
2 P R I S o N e R S I N 2010
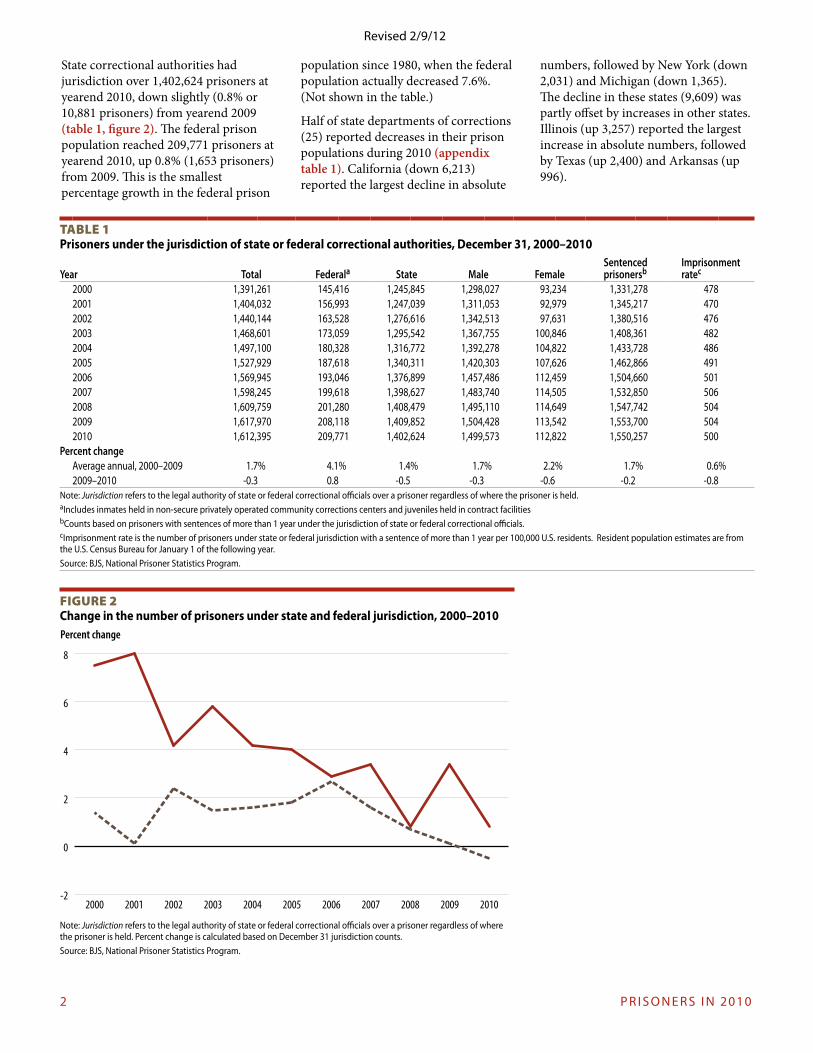
State correctional authorities had jurisdiction over 1,402,624 prisoners at yearend 2010, down slightly (0.8% or 10,881 prisoners) from yearend 2009 (table 1, figure 2). The federal prison population reached 209,771 prisoners at yearend 2010, up 0.8% (1,653 prisoners) from 2009. This is the smallest percentage growth in the federal prison
population since 1980, when the federal population actually decreased 7.6%. (Not shown in the table.)
Half of state departments of corrections (25) reported decreases in their prison populations during 2010 (appendix table 1). California (down 6,213) reported the largest decline in absolute
numbers, followed by New York (down 2,031) and Michigan (down 1,365). The decline in these states (9,609) was partly offset by increases in other states. Illinois (up 3,257) reported the largest increase in absolute numbers, followed by Texas (up 2,400) and Arkansas (up 996).
Figure 2 Change in the number of prisoners under state and federal jurisdiction, 2000–2010
-2
0
2
4
6
8
20102009200820072006200520042003200220012000
Percent change
Note: Jurisdiction refers to the legal authority of state or federal correctional officials over a prisoner regardless of where the prisoner is held. Percent change is calculated based on December 31 jurisdiction counts.Source: BJS, National Prisoner Statistics Program.
Table 1Prisoners under the jurisdiction of state or federal correctional authorities, December 31, 2000–2010
Year Total Federala State Male FemaleSentenced prisonersb
Imprisonment ratec
2000 1,391,261 145,416 1,245,845 1,298,027 93,234 1,331,278 4782001 1,404,032 156,993 1,247,039 1,311,053 92,979 1,345,217 4702002 1,440,144 163,528 1,276,616 1,342,513 97,631 1,380,516 4762003 1,468,601 173,059 1,295,542 1,367,755 100,846 1,408,361 4822004 1,497,100 180,328 1,316,772 1,392,278 104,822 1,433,728 4862005 1,527,929 187,618 1,340,311 1,420,303 107,626 1,462,866 4912006 1,569,945 193,046 1,376,899 1,457,486 112,459 1,504,660 5012007 1,598,245 199,618 1,398,627 1,483,740 114,505 1,532,850 5062008 1,609,759 201,280 1,408,479 1,495,110 114,649 1,547,742 5042009 1,617,970 208,118 1,409,852 1,504,428 113,542 1,553,700 5042010 1,612,395 209,771 1,402,624 1,499,573 112,822 1,550,257 500
Percent changeAverage annual, 2000–2009 1.7% 4.1% 1.4% 1.7% 2.2% 1.7% 0.6%2009–2010 -0.3 0.8 -0.5 -0.3 -0.6 -0.2 -0.8
Note: Jurisdiction refers to the legal authority of state or federal correctional officials over a prisoner regardless of where the prisoner is held. aIncludes inmates held in non-secure privately operated community corrections centers and juveniles held in contract facilities bCounts based on prisoners with sentences of more than 1 year under the jurisdiction of state or federal correctional officials.cImprisonment rate is the number of prisoners under state or federal jurisdiction with a sentence of more than 1 year per 100,000 U.S. residents. Resident population estimates are from the U.S. Census Bureau for January 1 of the following year. Source: BJS, National Prisoner Statistics Program.
Revised 2/9/12
D e C e M B e R 2011 3
1In Rhode Island and Vermont prisons and jails form one integrated system. Data include jail and prison populations.
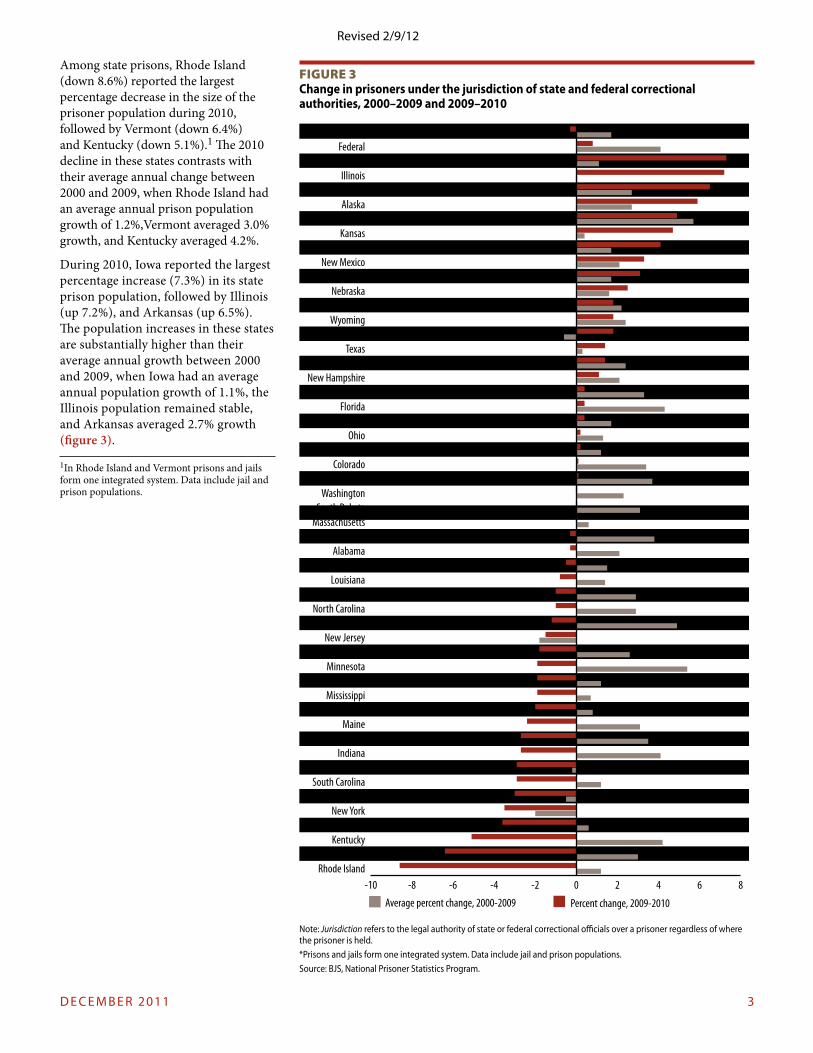
Among state prisons, Rhode Island (down 8.6%) reported the largest percentage decrease in the size of the prisoner population during 2010, followed by Vermont (down 6.4%) and Kentucky (down 5.1%).1 The 2010 decline in these states contrasts with their average annual change between 2000 and 2009, when Rhode Island had an average annual prison population growth of 1.2%,Vermont averaged 3.0% growth, and Kentucky averaged 4.2%.
During 2010, Iowa reported the largest percentage increase (7.3%) in its state prison population, followed by Illinois (up 7.2%), and Arkansas (up 6.5%). The population increases in these states are substantially higher than their average annual growth between 2000 and 2009, when Iowa had an average annual population growth of 1.1%, the Illinois population remained stable, and Arkansas averaged 2.7% growth (figure 3).
Figure 3 Change in prisoners under the jurisdiction of state and federal correctional authorities, 2000–2009 and 2009–2010
-10 -8 -6 -4 -2 0 2 4 6 8
Average percent change, 2000-2009 Percent change, 2009-2010
Rhode IslandVermont
KentuckyCaliforniaNew YorkMichigan
South CarolinaDelaware
IndianaOregon
MaineConnecticut
MississippiWisconsin
MinnesotaVirginia
New JerseyArizona
North CarolinaGeorgia
LouisianaOklahoma
AlabamaPennsylvania
MassachusettsSouth Dakota
WashingtonNorth Dakota
ColoradoMissouri
OhioHawaiiFlorida
IdahoNew Hampshire
NevadaTexas
MarylandWyoming
TennesseeNebraskaMontana
New MexicoUtah
KansasWest Virginia
AlaskaArkansas
IllinoisIowa
FederalU.S. Total
Note: Jurisdiction refers to the legal authority of state or federal correctional officials over a prisoner regardless of where the prisoner is held.*Prisons and jails form one integrated system. Data include jail and prison populations.Source: BJS, National Prisoner Statistics Program.
Revised 2/9/12
4 P R I S o N e R S I N 2010
The imprisonment rate declined in 2010
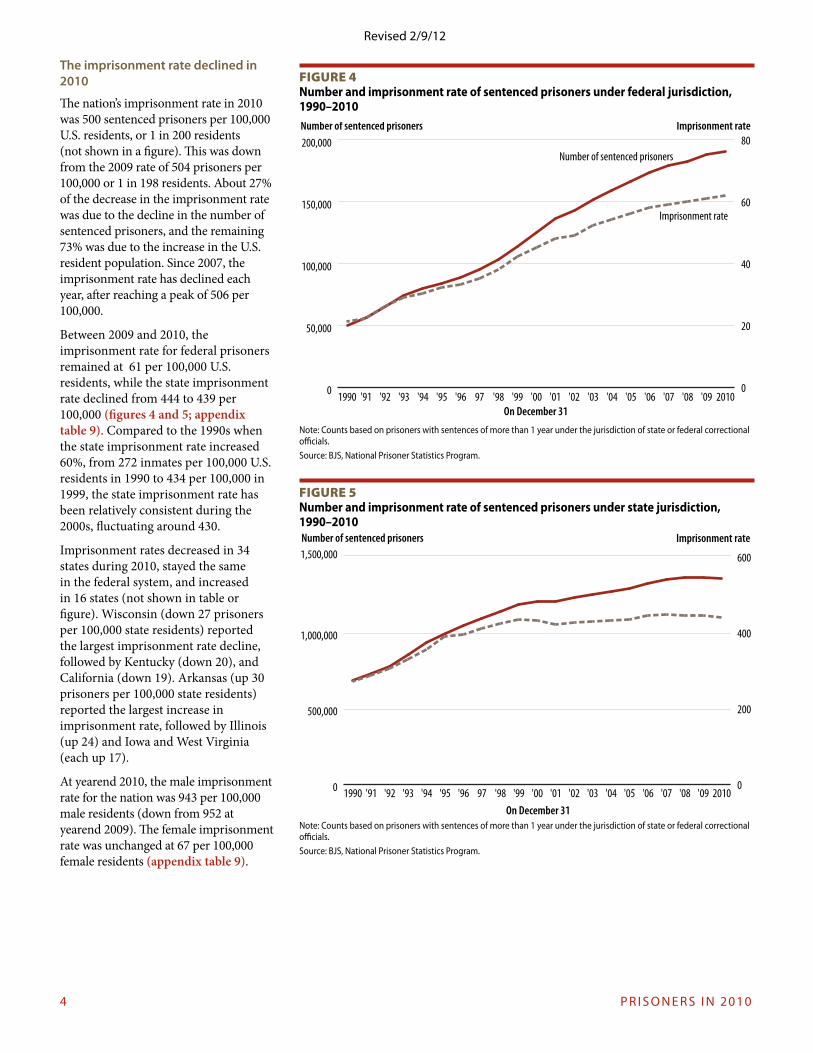
The nation’s imprisonment rate in 2010 was 500 sentenced prisoners per 100,000 U.S. residents, or 1 in 200 residents (not shown in a figure). This was down from the 2009 rate of 504 prisoners per 100,000 or 1 in 198 residents. About 27% of the decrease in the imprisonment rate was due to the decline in the number of sentenced prisoners, and the remaining 73% was due to the increase in the U.S. resident population. Since 2007, the imprisonment rate has declined each year, after reaching a peak of 506 per 100,000.
Between 2009 and 2010, the imprisonment rate for federal prisoners remained at 61 per 100,000 U.S. residents, while the state imprisonment rate declined from 444 to 439 per 100,000 (figures 4 and 5; appendix table 9). Compared to the 1990s when the state imprisonment rate increased 60%, from 272 inmates per 100,000 U.S. residents in 1990 to 434 per 100,000 in 1999, the state imprisonment rate has been relatively consistent during the 2000s, fluctuating around 430.
Imprisonment rates decreased in 34 states during 2010, stayed the same in the federal system, and increased in 16 states (not shown in table or figure). Wisconsin (down 27 prisoners per 100,000 state residents) reported the largest imprisonment rate decline, followed by Kentucky (down 20), and California (down 19). Arkansas (up 30 prisoners per 100,000 state residents) reported the largest increase in imprisonment rate, followed by Illinois (up 24) and Iowa and West Virginia (each up 17).
At yearend 2010, the male imprisonment rate for the nation was 943 per 100,000 male residents (down from 952 at yearend 2009). The female imprisonment rate was unchanged at 67 per 100,000 female residents (appendix table 9).
0
50,000
100,000
150,000
200,000Number of sentenced prisoners
Number of sentenced prisoners
2010'09'08'07'06'05'04'03'02'01'00'99'9897'96'95'94'93'92'9119900
20
40
60
80
Imprisonment rate
Imprisonment rate
On December 31
Figure 4 Number and imprisonment rate of sentenced prisoners under federal jurisdiction, 1990–2010
Note: Counts based on prisoners with sentences of more than 1 year under the jurisdiction of state or federal correctional officials.Source: BJS, National Prisoner Statistics Program.
Figure 5 Number and imprisonment rate of sentenced prisoners under state jurisdiction, 1990–2010
0
500,000
1,000,000
1,500,000Number of sentenced prisoners
2010'09'08'07'06'05'04'03'02'01'00'99'9897'96'95'94'93'92'9119900
200
400
600
Imprisonment rate
On December 31Note: Counts based on prisoners with sentences of more than 1 year under the jurisdiction of state or federal correctional officials.Source: BJS, National Prisoner Statistics Program.
Revised 2/9/12
D e C e M B e R 2011 5
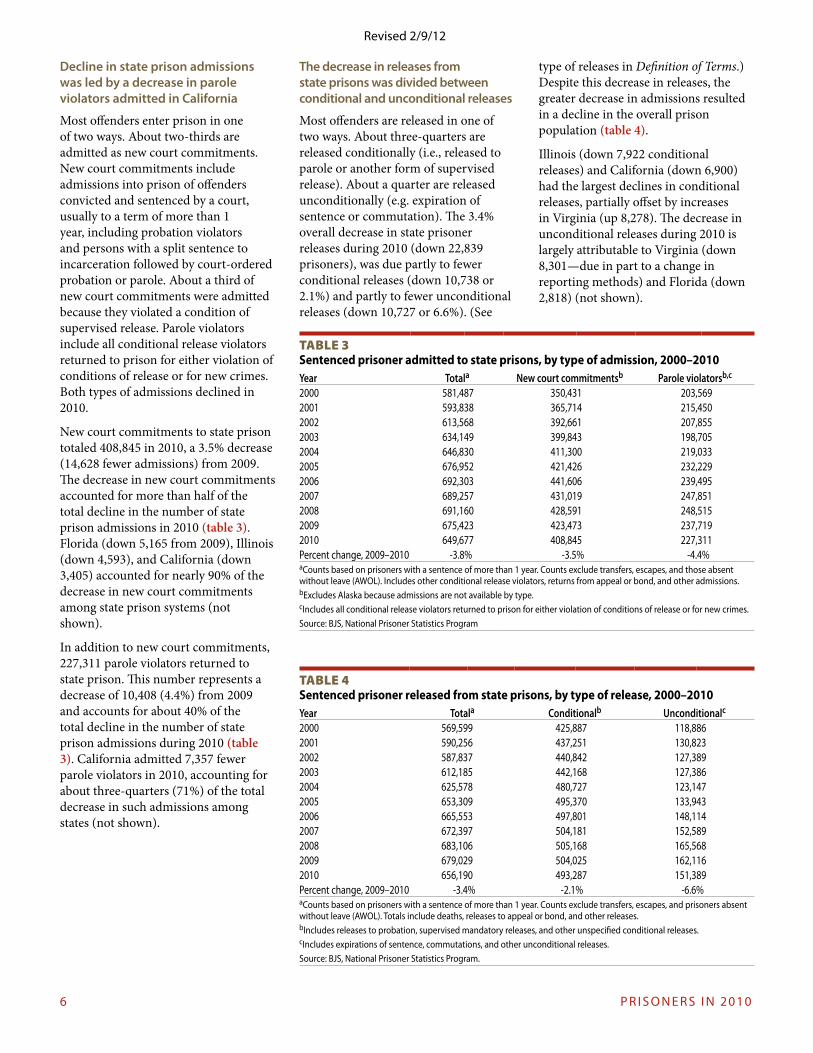
Releases from prison exceeded admissions; however, both declined during 2010
In 2010, both admissions to and releases from prison decreased. Admissions were down 3.8% and releases were down 2.9% (figure 6). For the first time since BJS began collecting jurisdictional data in 1977, releases from prison (708,677) exceeded admissions to prison (703,798), resulting in an overall decline in the prisoner population (table 2).
State prison admissions decreased 3.8% (down 25,746 admissions) during 2010. Among the 31 states with fewer admissions in 2010, several large states led the trend. California had the greatest decline in the number of admissions (down 10,762 admissions or 8.3%), followed by Florida (down 5,264 or 13.8%), Illinois (down 3,402 or 9.0%), and Ohio (down 2,265 or 8.4%) (appendix table 10a). However, the overall decline in admissions was partly offset by increases in several states,
including Texas (up 2,476 admissions or 3.5%) and Louisiana (up 2,251 or 15.1%).
Releases from state prison decreased by 22,839 (down 3.4%), led by some of the same states that experienced a decline in admissions. Illinois released 6,979 fewer prisoners (down 18.3%), California 6,951 fewer (down 5.4%), and Florida 4,518 fewer (down 12.2%). Louisiana had the largest increase in the number of prisoners released during the year (up 2,338 or 15.7%), followed by Pennsylvania (up 2,151 or 14.7%) and Kentucky (up 1,824 or 12.9%).
Federal prison admissions decreased 3.6% in 2010, while releases increased 3.5%. There were 1,767 more sentenced federal prisoners released in 2010 than in 2009.
Table 2Number of sentenced prisoners admitted to and released from state and federal jurisdiction, 2000–2010
Admissions ReleasesYear Total Federal State Total Federal State
2000 625,219 43,732 581,487 604,858 35,259 569,5992001 638,978 45,140 593,838 628,626 38,370 590,2562002 661,712 48,144 613,568 630,176 42,339 587,8372003 686,437 52,288 634,149 656,384 44,199 612,1852004 699,812 52,982 646,830 672,202 46,624 625,5782005 733,009 56,057 676,952 701,632 48,323 653,3092006 749,798 57,495 692,303 713,473 47,920 665,5532007 742,875 53,618 689,257 721,161 48,764 672,3972008 744,822 53,662 691,160 735,454 52,348 683,1062009 731,576 56,153 675,423 729,749 50,720 679,0292010 703,798 54,121 649,677 708,677 52,487 656,190
Percent changeAverage annual, 2000–2009 1.8% 2.8% 1.7% 2.1% 4.1% 2.0%2009–2010 -3.8 -3.6 -3.8 -2.9 3.5 -3.4
Note: Counts based on prisoners with a sentence of more than 1 year. Counts exclude transfers, escapes, and prisoners absent without leave (AWoL).Source: BJS, National Prisoner Statistics Program.
Figure 6Number of sentenced prisoners admitted to and released from state or federal prison, 2000–2010
600,000
650,000
700,000
750,000
800,000
Releases
Admissions
20102009200820072006200520042003200220012000On December 31
Number of sentenced prisoners
Note: Scale of vertical axis was narrowed to reveal divergence between admission and release values. Source: BJS, National Prisoner Statistics Program.
6 P R I S o N e R S I N 2010
Table 3Sentenced prisoner admitted to state prisons, by type of admission, 2000–2010Year Totala New court commitmentsb Parole violatorsb,c
2000 581,487 350,431 203,5692001 593,838 365,714 215,4502002 613,568 392,661 207,8552003 634,149 399,843 198,7052004 646,830 411,300 219,0332005 676,952 421,426 232,2292006 692,303 441,606 239,4952007 689,257 431,019 247,8512008 691,160 428,591 248,5152009 675,423 423,473 237,7192010 649,677 408,845 227,311Percent change, 2009–2010 -3.8% -3.5% -4.4%aCounts based on prisoners with a sentence of more than 1 year. Counts exclude transfers, escapes, and those absent without leave (AWoL). Includes other conditional release violators, returns from appeal or bond, and other admissions.bexcludes Alaska because admissions are not available by type.cIncludes all conditional release violators returned to prison for either violation of conditions of release or for new crimes.Source: BJS, National Prisoner Statistics Program
Table 4Sentenced prisoner released from state prisons, by type of release, 2000–2010Year Totala Conditionalb Unconditionalc
2000 569,599 425,887 118,8862001 590,256 437,251 130,8232002 587,837 440,842 127,3892003 612,185 442,168 127,3862004 625,578 480,727 123,1472005 653,309 495,370 133,9432006 665,553 497,801 148,1142007 672,397 504,181 152,5892008 683,106 505,168 165,5682009 679,029 504,025 162,1162010 656,190 493,287 151,389Percent change, 2009–2010 -3.4% -2.1% -6.6%aCounts based on prisoners with a sentence of more than 1 year. Counts exclude transfers, escapes, and prisoners absent without leave (AWoL). Totals include deaths, releases to appeal or bond, and other releases.bIncludes releases to probation, supervised mandatory releases, and other unspecified conditional releases.cIncludes expirations of sentence, commutations, and other unconditional releases.Source: BJS, National Prisoner Statistics Program.
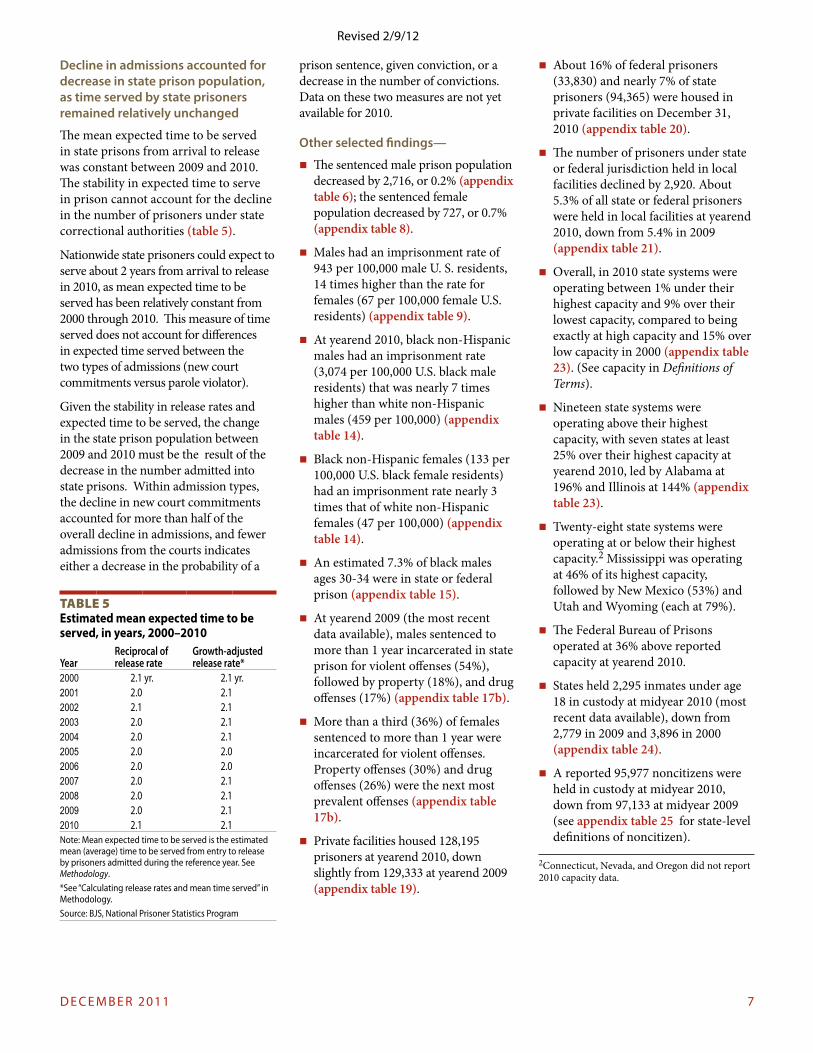
Decline in state prison admissions was led by a decrease in parole violators admitted in California
Most offenders enter prison in one of two ways. About two-thirds are admitted as new court commitments. New court commitments include admissions into prison of offenders convicted and sentenced by a court, usually to a term of more than 1 year, including probation violators and persons with a split sentence to incarceration followed by court-ordered probation or parole. About a third of new court commitments were admitted because they violated a condition of supervised release. Parole violators include all conditional release violators returned to prison for either violation of conditions of release or for new crimes. Both types of admissions declined in 2010.
New court commitments to state prison totaled 408,845 in 2010, a 3.5% decrease (14,628 fewer admissions) from 2009. The decrease in new court commitments accounted for more than half of the total decline in the number of state prison admissions in 2010 (table 3). Florida (down 5,165 from 2009), Illinois (down 4,593), and California (down 3,405) accounted for nearly 90% of the decrease in new court commitments among state prison systems (not shown).
In addition to new court commitments, 227,311 parole violators returned to state prison. This number represents a decrease of 10,408 (4.4%) from 2009 and accounts for about 40% of the total decline in the number of state prison admissions during 2010 (table 3). California admitted 7,357 fewer parole violators in 2010, accounting for about three-quarters (71%) of the total decrease in such admissions among states (not shown).
The decrease in releases from state prisons was divided between conditional and unconditional releases
Most offenders are released in one of two ways. About three-quarters are released conditionally (i.e., released to parole or another form of supervised release). About a quarter are released unconditionally (e.g. expiration of sentence or commutation). The 3.4% overall decrease in state prisoner releases during 2010 (down 22,839 prisoners), was due partly to fewer conditional releases (down 10,738 or 2.1%) and partly to fewer unconditional releases (down 10,727 or 6.6%). (See
type of releases in Definition of Terms.) Despite this decrease in releases, the greater decrease in admissions resulted in a decline in the overall prison population (table 4).
Illinois (down 7,922 conditional releases) and California (down 6,900) had the largest declines in conditional releases, partially offset by increases in Virginia (up 8,278). The decrease in unconditional releases during 2010 is largely attributable to Virginia (down 8,301—due in part to a change in reporting methods) and Florida (down 2,818) (not shown).
Revised 2/9/12
D e C e M B e R 2011 7
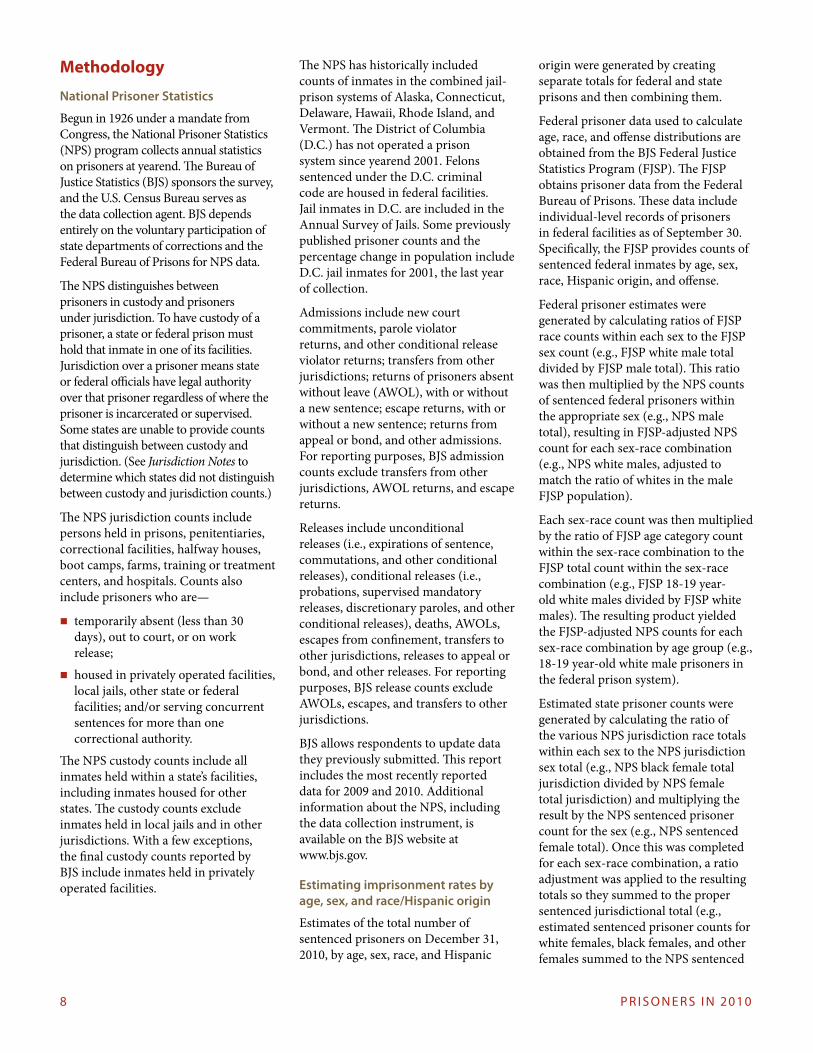
Decline in admissions accounted for decrease in state prison population, as time served by state prisoners remained relatively unchanged
The mean expected time to be served in state prisons from arrival to release was constant between 2009 and 2010. The stability in expected time to serve in prison cannot account for the decline in the number of prisoners under state correctional authorities (table 5).
Nationwide state prisoners could expect to serve about 2 years from arrival to release in 2010, as mean expected time to be served has been relatively constant from 2000 through 2010. This measure of time served does not account for differences in expected time served between the two types of admissions (new court commitments versus parole violator).
Given the stability in release rates and expected time to be served, the change in the state prison population between 2009 and 2010 must be the result of the decrease in the number admitted into state prisons. Within admission types, the decline in new court commitments accounted for more than half of the overall decline in admissions, and fewer admissions from the courts indicates either a decrease in the probability of a
prison sentence, given conviction, or a decrease in the number of convictions. Data on these two measures are not yet available for 2010.
Other selected findings—
� The sentenced male prison population decreased by 2,716, or 0.2% (appendix table 6); the sentenced female population decreased by 727, or 0.7% (appendix table 8).
� Males had an imprisonment rate of 943 per 100,000 male U. S. residents, 14 times higher than the rate for females (67 per 100,000 female U.S. residents) (appendix table 9).
� At yearend 2010, black non-Hispanic males had an imprisonment rate (3,074 per 100,000 U.S. black male residents) that was nearly 7 times higher than white non-Hispanic males (459 per 100,000) (appendix table 14).
� Black non-Hispanic females (133 per 100,000 U.S. black female residents) had an imprisonment rate nearly 3 times that of white non-Hispanic females (47 per 100,000) (appendix table 14).
� An estimated 7.3% of black males ages 30-34 were in state or federal prison (appendix table 15).
� At yearend 2009 (the most recent data available), males sentenced to more than 1 year incarcerated in state prison for violent offenses (54%), followed by property (18%), and drug offenses (17%) (appendix table 17b).
� More than a third (36%) of females sentenced to more than 1 year were incarcerated for violent offenses. Property offenses (30%) and drug offenses (26%) were the next most prevalent offenses (appendix table 17b).
� Private facilities housed 128,195 prisoners at yearend 2010, down slightly from 129,333 at yearend 2009 (appendix table 19).
� About 16% of federal prisoners (33,830) and nearly 7% of state prisoners (94,365) were housed in private facilities on December 31, 2010 (appendix table 20).
� The number of prisoners under state or federal jurisdiction held in local facilities declined by 2,920. About 5.3% of all state or federal prisoners were held in local facilities at yearend 2010, down from 5.4% in 2009 (appendix table 21).
� Overall, in 2010 state systems were operating between 1% under their highest capacity and 9% over their lowest capacity, compared to being exactly at high capacity and 15% over low capacity in 2000 (appendix table 23). (See capacity in Definitions of Terms).
� Nineteen state systems were operating above their highest capacity, with seven states at least 25% over their highest capacity at yearend 2010, led by Alabama at 196% and Illinois at 144% (appendix table 23).
� Twenty-eight state systems were operating at or below their highest capacity.2 Mississippi was operating at 46% of its highest capacity, followed by New Mexico (53%) and Utah and Wyoming (each at 79%).
� The Federal Bureau of Prisons operated at 36% above reported capacity at yearend 2010.
� States held 2,295 inmates under age 18 in custody at midyear 2010 (most recent data available), down from 2,779 in 2009 and 3,896 in 2000 (appendix table 24).
� A reported 95,977 noncitizens were held in custody at midyear 2010, down from 97,133 at midyear 2009 (see appendix table 25 for state-level definitions of noncitizen).
2Connecticut, Nevada, and Oregon did not report 2010 capacity data.
Table 5Estimated mean expected time to be served, in years, 2000–2010
YearReciprocal of release rate
Growth-adjusted release rate*
2000 2.1 yr. 2.1 yr.2001 2.0 2.12002 2.1 2.12003 2.0 2.12004 2.0 2.12005 2.0 2.02006 2.0 2.02007 2.0 2.12008 2.0 2.12009 2.0 2.12010 2.1 2.1Note: Mean expected time to be served is the estimated mean (average) time to be served from entry to release by prisoners admitted during the reference year. See Methodology. *See “Calculating release rates and mean time served” in Methodology.Source: BJS, National Prisoner Statistics Program
Revised 2/9/12
8 P R I S o N e R S I N 2010
Methodology
National Prisoner Statistics
Begun in 1926 under a mandate from Congress, the National Prisoner Statistics (NPS) program collects annual statistics on prisoners at yearend. The Bureau of Justice Statistics (BJS) sponsors the survey, and the U.S. Census Bureau serves as the data collection agent. BJS depends entirely on the voluntary participation of state departments of corrections and the Federal Bureau of Prisons for NPS data.
The NPS distinguishes between prisoners in custody and prisoners under jurisdiction. To have custody of a prisoner, a state or federal prison must hold that inmate in one of its facilities. Jurisdiction over a prisoner means state or federal officials have legal authority over that prisoner regardless of where the prisoner is incarcerated or supervised. Some states are unable to provide counts that distinguish between custody and jurisdiction. (See Jurisdiction Notes to determine which states did not distinguish between custody and jurisdiction counts.)
The NPS jurisdiction counts include persons held in prisons, penitentiaries, correctional facilities, halfway houses, boot camps, farms, training or treatment centers, and hospitals. Counts also include prisoners who are—
� temporarily absent (less than 30 days), out to court, or on work release;
� housed in privately operated facilities, local jails, other state or federal facilities; and/or serving concurrent sentences for more than one correctional authority.
The NPS custody counts include all inmates held within a state’s facilities, including inmates housed for other states. The custody counts exclude inmates held in local jails and in other jurisdictions. With a few exceptions, the final custody counts reported by BJS include inmates held in privately operated facilities.
The NPS has historically included counts of inmates in the combined jail-prison systems of Alaska, Connecticut, Delaware, Hawaii, Rhode Island, and Vermont. The District of Columbia (D.C.) has not operated a prison system since yearend 2001. Felons sentenced under the D.C. criminal code are housed in federal facilities. Jail inmates in D.C. are included in the Annual Survey of Jails. Some previously published prisoner counts and the percentage change in population include D.C. jail inmates for 2001, the last year of collection.
Admissions include new court commitments, parole violator returns, and other conditional release violator returns; transfers from other jurisdictions; returns of prisoners absent without leave (AWOL), with or without a new sentence; escape returns, with or without a new sentence; returns from appeal or bond, and other admissions. For reporting purposes, BJS admission counts exclude transfers from other jurisdictions, AWOL returns, and escape returns.
Releases include unconditional releases (i.e., expirations of sentence, commutations, and other conditional releases), conditional releases (i.e., probations, supervised mandatory releases, discretionary paroles, and other conditional releases), deaths, AWOLs, escapes from confinement, transfers to other jurisdictions, releases to appeal or bond, and other releases. For reporting purposes, BJS release counts exclude AWOLs, escapes, and transfers to other jurisdictions.
BJS allows respondents to update data they previously submitted. This report includes the most recently reported data for 2009 and 2010. Additional information about the NPS, including the data collection instrument, is available on the BJS website at www.bjs.gov.
Estimating imprisonment rates by age, sex, and race/Hispanic origin
Estimates of the total number of sentenced prisoners on December 31, 2010, by age, sex, race, and Hispanic
origin were generated by creating separate totals for federal and state prisons and then combining them.
Federal prisoner data used to calculate age, race, and offense distributions are obtained from the BJS Federal Justice Statistics Program (FJSP). The FJSP obtains prisoner data from the Federal Bureau of Prisons. These data include individual-level records of prisoners in federal facilities as of September 30. Specifically, the FJSP provides counts of sentenced federal inmates by age, sex, race, Hispanic origin, and offense.
Federal prisoner estimates were generated by calculating ratios of FJSP race counts within each sex to the FJSP sex count (e.g., FJSP white male total divided by FJSP male total). This ratio was then multiplied by the NPS counts of sentenced federal prisoners within the appropriate sex (e.g., NPS male total), resulting in FJSP-adjusted NPS count for each sex-race combination (e.g., NPS white males, adjusted to match the ratio of whites in the male FJSP population).
Each sex-race count was then multiplied by the ratio of FJSP age category count within the sex-race combination to the FJSP total count within the sex-race combination (e.g., FJSP 18-19 year-old white males divided by FJSP white males). The resulting product yielded the FJSP-adjusted NPS counts for each sex-race combination by age group (e.g., 18-19 year-old white male prisoners in the federal prison system).
Estimated state prisoner counts were generated by calculating the ratio of the various NPS jurisdiction race totals within each sex to the NPS jurisdiction sex total (e.g., NPS black female total jurisdiction divided by NPS female total jurisdiction) and multiplying the result by the NPS sentenced prisoner count for the sex (e.g., NPS sentenced female total). Once this was completed for each sex-race combination, a ratio adjustment was applied to the resulting totals so they summed to the proper sentenced jurisdictional total (e.g., estimated sentenced prisoner counts for white females, black females, and other females summed to the NPS sentenced
D e C e M B e R 2011 9
female prisoner count). A similar ratio adjustment was applied to the NPS jurisdiction counts to create sentenced prisoner counts by race. Once these totals were created, a method similar to the one used with federal prisoners was employed, adjusting National Corrections Reporting Program (NCRP) data by age, sex, race, and Hispanic origin to match the estimated NPS sentenced prisoner counts for each sex-race combination.3
The resulting totals were finally ratio-adjusted so the totals within each sex-race category matched the NPS sentenced prisoner counts, adjusted for the difference between administrative race data and the self-reported race data from the 2008-2009 National Inmate Survey.4 As described above, the resulting totals were combined with the federal prisoner counts to create estimates of the total number of sentenced prisoners on December 31, 2010, by age, sex, race, and Hispanic origin.
Age-specific imprisonment rates for each age-sex-race group were calculated by dividing the estimated number of sentenced prisoners within each age group by the estimated number of U.S. residents in each age group on January 1, 2011. The result was multiplied by 100,000 and rounded to the nearest whole number. Totals by sex include all prisoners and U.S. residents regardless of race or Hispanic origin. Detailed race and Hispanic origin imprisonment rates exclude persons identifying as two or more races.
Calculating release rates and mean time served
Mean expected time to be served was estimated using two methods that take into account growth in the prison population (table 5). The measure of expected time to be served is an estimate of mean time to be served by persons entering prison. This measure differs from other estimates that are based on the actual time served by persons released from prison. Research has shown that estimates of time served for exiting cohorts are biased estimates of time served for persons entering prison, especially when prison population size is changing or the number of admissions is changing. (For example, see Patterson, E.J. and S.H. Preston (2008). “Estimating Mean Length of Stay in Prisons: Methods and Applications,” Journal of Quantitative Criminology, 24, 33-49.)
The adjustment for growth in the prison population reduces bias in estimates of time served based only on exits. The two adjusted measures of expected time served were a growth-adjusted release rate measure and a growth-adjusted entry rate measure. The growth-adjusted exit rate measure applies the mean rate of growth in the prison population to the reciprocal of the release rate, or—
Mean expected time served=(Pt–Pt-1)/r/Rt
Where:
t=year
P=the number of sentenced prisoners
r=mean growth rate, calculated as ln(Pt/Pt-1)
R=number of releases
The entry rate estimate of mean time to be served, corrected for growth, was estimated as follows.
1/[(Pt/At)*(1-rAp)]
Where t, P, and r are as above, and At= the number of sentenced admissions, and Ap equals the mean duration of the prison population, that is mean time served from admission until yearend. Estimates of mean duration of the prison population came from NCRP data.
Prison capacities
State and federal correctional authorities provide three measures of their facilities’ capacity: design capacity, operational capacity, and rated capacity. Estimates of the prison populations as a percentage of capacity are based on a state or federal custody population. In general, state capacity and custody counts exclude inmates held in private facilities, although six states include prisoners held in private facilities as part of the capacity of their prison systems: Georgia, Idaho, Louisiana, Mississippi, Oklahoma, and New Mexico. For these states, prison population as a percent of capacity includes private facilities.
3The NCRP data used in 2010 are improved from prior years in their completeness and timeliness. Use caution when comparing totals and imprisonment rates by age, sex, and race/Hispanic origin over time. 4Prior year administrative data were adjusted to the 2004 Survey of Inmates in State and Local Correctional Facilities.
Revised 2/9/12
10 P R I S o N e R S I N 2010
NPS jurisdiction notes Alabama—Operational capacity represents physical capacity to hold inmates, but is not based on staffing, programs, and services.
Alaska—Prisons and jails form one integrated system. Data include jail and prison populations unless otherwise specified. Jurisdiction totals include individuals in electronic and special monitoring programs. Noncitizen data include only offenders known to be noncitizens and do not include offenders of unknown citizenship.
The Alaska Department of Corrections was unable to provide admissions and releases by type. These counts were imputed using a ratio adjustment based on the 2009 admission and release data reported by the state. Capacity counts were not provided in 2010; the 2009 capacity counts were imputed by BJS at the the state’s request.
Arizona—Population counts are based on custody data and inmates in contracted beds. The Arizona Department of Corrections added about 4,000 state beds rated as operational capacity and some inmates previously housed out of state or in private facilties were transferred to state beds. This transfer is reflected in the change between 2009 and 2010 in the private and noncitizen counts.
California—Jurisdiction counts include felons who are temporarily absent (i.e., housed in local jails, out to court, or in hospitals) and include offenders in the California Civil Addict Program (CAP) who are temporarily absent and typically returned to prison within 30 days. The CAP is a drug abuse treatment program offering treatment both onsite and offsite.
Colorado—Population counts for prisoners with a sentence of more than 1 year include an undetermined number of prisoners with sentences of 1 year or less. Counts include 259 male and 11 female inmates in the Youthful Offender System, which was established primarily for violent juvenile offenders. Mandatory releases have increased due to a legislative revision that went into effect July 2009. Operational and design capacity do not include privately run facilities. Noncitizen is defined as foreign born.
Connecticut—Prisons and jails form one integrated system. Data include jail and prison populations unless otherwise specified. Legislation in July 1995 abolished the capacity law. The capacity of a facility is a fluid number based upon the needs of the department. The needs are dictated by security issues, populations, court decrees, legal mandates, staffing, and physical plant areas or facilities that are serving other purposes or have been decommissioned. The actual capacity of a facility is subject to change.
Delaware—Prisons and jails form one integrated system. Data include jail and prison populations unless otherwise specified. Capacity counts include halfway houses under the Department of Corrections.
Federal Bureau of Prisons—Counts include inmates housed in secure facilities through private contracts and subcontracts. They also included 8,629 inmates held in nonsecure privately operated community corrections centers and 2,548 offenders on home confinement. Expirations of sentence include good conduct releases that usually have a separate and distinct term of supervision. The Federal Bureau of Prisons does not house inmates under age 18 in federal facilities; 142 such inmates were housed in contract facilities.
Florida—Noncitizen counts includes both confirmed and suspected alien inmates.
Georgia—Population counts exclude an undetermined number of inmates housed in local jails, awaiting transfer to prison. Counts may not compare to previous years due to a data system conversion.
The Georgia Department of Corrections (GDC) was unable to provide jurisdiction counts of admissions by type or releases by type. Jurisdiction counts by race, type of admission, and type of release were imputed using ratio adjustments based on counts reported by GDC in 2009.
The GDC total admissions and releases for 2010 are reported, but the breakdown by type has been suppressed at their request. These breakouts are included in national totals. All imputations were reviewed and approved by GDC staff.
Hawaii—Prisons and jails form one integrated system. Data include jail and prison populations unless otherwise specified. Noncitizen data are self reported.
Illinois—Population counts for prisoners with a sentence of more than 1 year include an undetermined number of prisoners with sentences of 1 year. Noncitizen count is estimated.
Idaho—Capacity is defined as 100% of maximum capacity and operational capacity as 95% of maximum capacity. Design capacity is based on original facility occupancy.
Iowa—Population counts for prisoners with a sentence of more than 1 year include an undetermined number of prisoners with sentences of 1 year or less. In 2009, Iowa began including offenders on work release, operating while under the influence continuum status, and Iowa inmates housed in prisons out of state per BJS counting rules. Previously, counts were based on custody data.
Revised 2/9/12
D e C e M B e R 2011 11
NPS jurisdiction notes (continued)Kansas—Population counts for prisoners with a sentence of more than 1 year include an undetermined number of prisoners with sentences of 1 year or less. Noncitizen count is estimated.
Maine—Main does not use the term parole. Parole releases and parole violator admissions are reported as inmates on post-sentence probation.
Massachusetts—Jurisdiction count excludes approximately 3,271 inmates in local jails and houses of corrections serving a sentence of more than 1 year. By law, offenders in Massachusetts may be sentenced to terms of up to 30 months in locally operated jails and correctional institutions. Noncitizen data are self-reported.
Michigan—Operational capacity includes the net operating capacities of institutions, as well as the population of community programs.
Missouri—Operational capacity is the number of available beds, including those temporarily offline. Noncitizen is defined as foreign born.
Mississippi—Citizenship data were not collected.
Nebraska—Operational capacity is defined as stress capacity, which is 125% of design capacity for designated facilities. This capacity is ordered by the governor, but set by the Department of Corrections.
Nevada—Noncitizen data are not available.
New Jersey—Jurisdiction counts for prisoners with sentences of more than 1 year include prisoners with sentences of 1 year. Noncitizen data were not collected on every inmate.
New York—Noncitizen is defined as foreign born.
North Carolina—Prison inmates held in local jails are not counted in the prison population until admission to prison.
North Dakota—Capacity accounts for double-bunking in the state penitentiary.
Ohio—Population counts for prisoners with a sentence of more than 1 year include an undetermined number of prisoners with sentences of 1 year or less. Reporting methods for admissions and releases and for private facilities have been revised and are not comparable to previous years.
Oklahoma—Population counts for inmates with sentences of less than 1 year consist mainly of offenders ordered by the court to the Delayed Sentencing Program for Young Adults pursuant to 22 O.S. 996 through 996.3. Oklahoma has only one type of capacity, which includes state prisons, private prisons, and contract jails. Noncitizen is defined as a person with Immigration and Customs Enforcement detainers.
Oregon— Population counts for prisoners with a sentence of more than 1 year include an undetermined number of prisoners with sentences of 1 year or less. County authorities retain jurisdiction over the majority of these types of inmates. The operational capacity reported is planned capacity.”
Rhode Island—Prisons and jails form one integrated system. Data include jail and prison populations unless otherwise specified. Capacity counts reflect the opening of a new women’s facility in 2010.
South Carolina—Noncitizen data are self-reported.
South Dakota—Operational capacity reported is planned capacity.
Tennessee—Noncitizen is defined as foreign born.
Texas—Jurisdiction count includes offenders in custody as well as those held in privately operated prisons, substance abuse felony punishment facilities, halfway houses, offenders temporarily released to a county jail for less than 30 days, and offenders awaiting paperwork for transfer to state-funded custody.
Vermont—Prisons and jails form one integrated system. Data include jail and prison populations unless otherwise specified.
Virginia—Virginia Department of Corrections maintains a count of beds which most closely fits the definition for rated capacity. Number of beds assigned by rating officials takes into account the number of inmates who can be accommodated based on staff, programs, services, and design. Noncitizen is defined as foreign born.
Wisconsin—Counts include 698 temporary probation and parole placements. Capacity includes two adult state prison facilities, one juvenile facility under the jurisdiction of Wisconsin Department of Corrections (DOC), and one nonDOC facility. Local jails and other federal, state, and private facilities are excluded from capacity.
Wyoming—A new male correctional facility was opened in January 2010.
12 P R I S o N e R S I N 2010
Definition of TermsAverage annual change—average (mean) annual change across a specific period.
Capacity, design—the number of inmates that planners or architects intended for a facility.
Capacity, highest—the maximum number of beds reported across the three capacity measures: design capacity, operational capacity, and rated capacity.
Capacity, lowest—the minimum number of beds across three capacity measures: design capacity, operational capacity, and rated capacity.
Capacity, operational—the number of inmates that can be accommodated based on a facility’s staff, existing programs, and services.
Capacity, rated—the number of beds or inmates assigned by a rating official to institutions within a jurisdiction.
Conditional releases—includes discretionary parole, mandatory parole, post-custody probation, and other unspecified conditional releases.
Conditional release violators—re-admission to prison of persons released to discretionary parole, mandatory parole, post-custody probation, and other unspecified conditional releases.
Custody—prisoners held in the physical custody of state or federal prisons or local jails, regardless of sentence length or authority having jurisdiction.
Imprisonment rate—the number of prisoners under state or federal jurisdiction sentenced to more than 1 year per 100,000 U.S. residents.
Inmate—person incarcerated in a local jail, state or federal prison, or private facility under contract to federal, state or local authorities.
Jail—confinement facility usually administered by a local law enforcement agency; intended for adults, but sometimes holding juveniles; for confinement before and after adjudication. Such facilities include jails and city/county correctional centers, special jail facilities such as medical treatment or release centers, halfway houses, work farms, and temporary holding or lockup facilities that are part of the jail’s combined function. Inmates sentenced to jail facilities usually have a sentence of 1 year or less. Connecticut, Rhode Island, Vermont, Delaware, Alaska, and Hawaii operate integrated systems, which combine prisons and jails.
Jurisdiction—the legal authority of state or federal correctional officials over a prisoner regardless of where the prisoner is held.
New court commitments—admissions into prison of offenders convicted and sentenced by a court, usually to a term of more than 1 year, including probation violators and persons with a split sentence to incarceration followed by court-
ordered probation or parole.
Parole violators—all conditional release violators returned to prison for either violation of conditions of release or for new crimes.
Prisons—long-term confinement facilities run by a state or the federal government that typically hold felons and offenders with sentences of more than 1 year. However, sentence length may vary by state. Connecticut, Rhode Island, Vermont, Delaware, Alaska, and Hawaii operate integrated systems, which combine prisons and jails.
Prisoners—individuals confined in correctional facilities under the legal authority (jurisdiction) of state and federal correctional officials.
Sentenced prisoner—a prisoner sentenced to more than 1 year.
Supervised mandatory releases—conditional release with post-custody supervision generally occurring in jurisdictions using determinate sentencing statutes.
Unconditional release—expirations of sentences, commutations, and other unspecified unconditional releases.
D e C e M B e R 2011 13
List of appendix tablesAppendix table 1. Prisoners under the jurisdiction of state or federal correctional authorities, by jurisdiction, December 31, 2000, 2009, and 2010
Appendix table 2. Male prisoners under the jurisdiction of state and federal correctional authorities, by jurisdiction, December 31, 2000, 2009, and 2010
Appendix table 3. Female prisoners under the jurisdiction of state and federal correctional authorities, by jurisdiction, December 31, 2000, 2009, and 2010
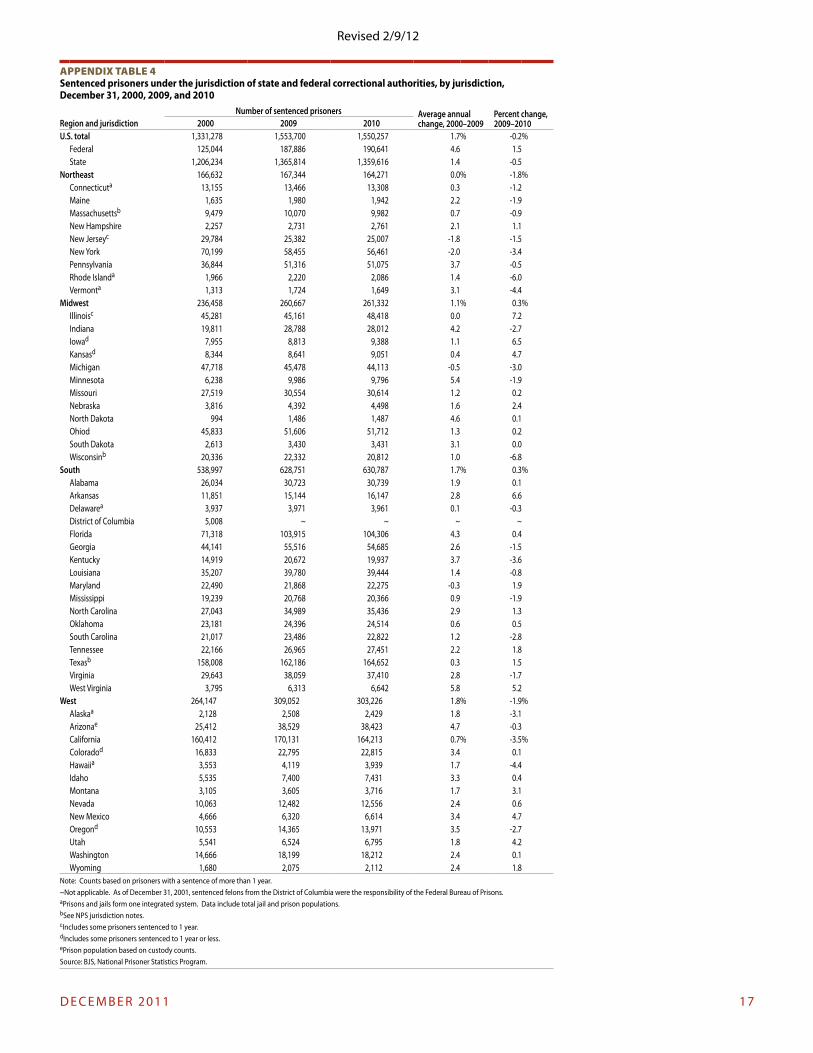
Appendix table 4. Sentenced prisoners under the jurisdiction of state and federal correctional authorities, by jurisdiction, December 31, 2000, 2009, and 2010
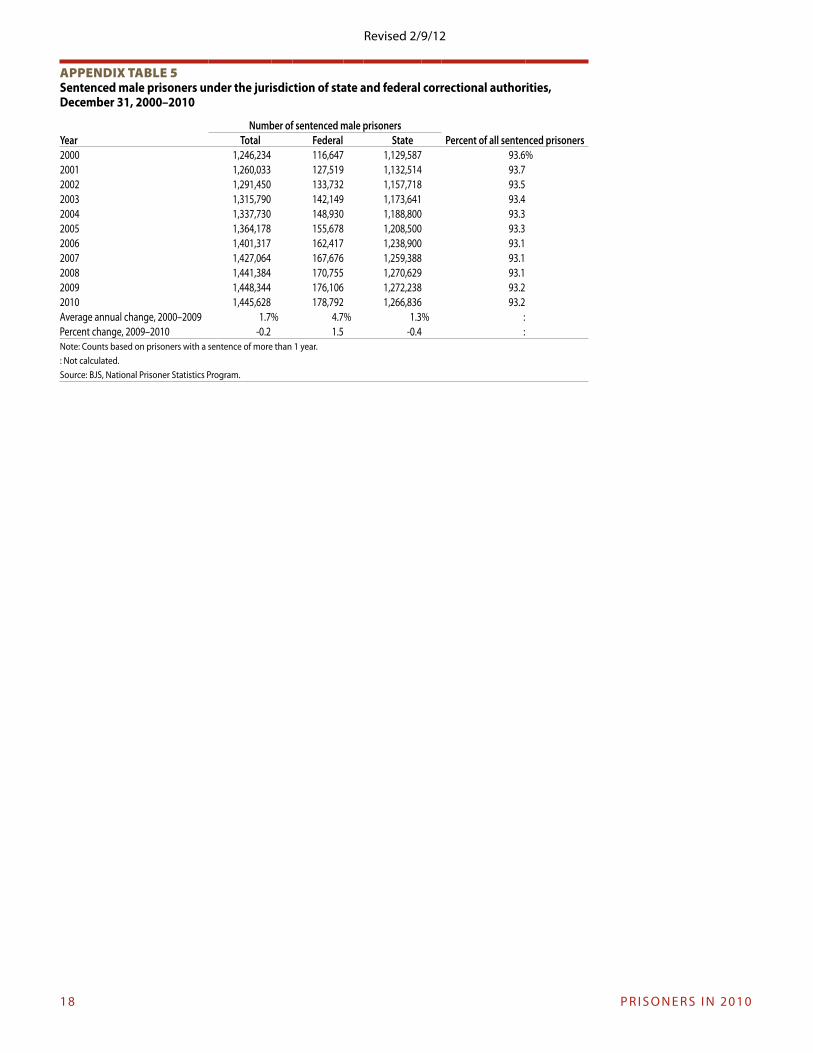
Appendix table 5. Sentenced male prisoners under the jurisdiction of state and federal correctional authorities, December 31, 2000-2010
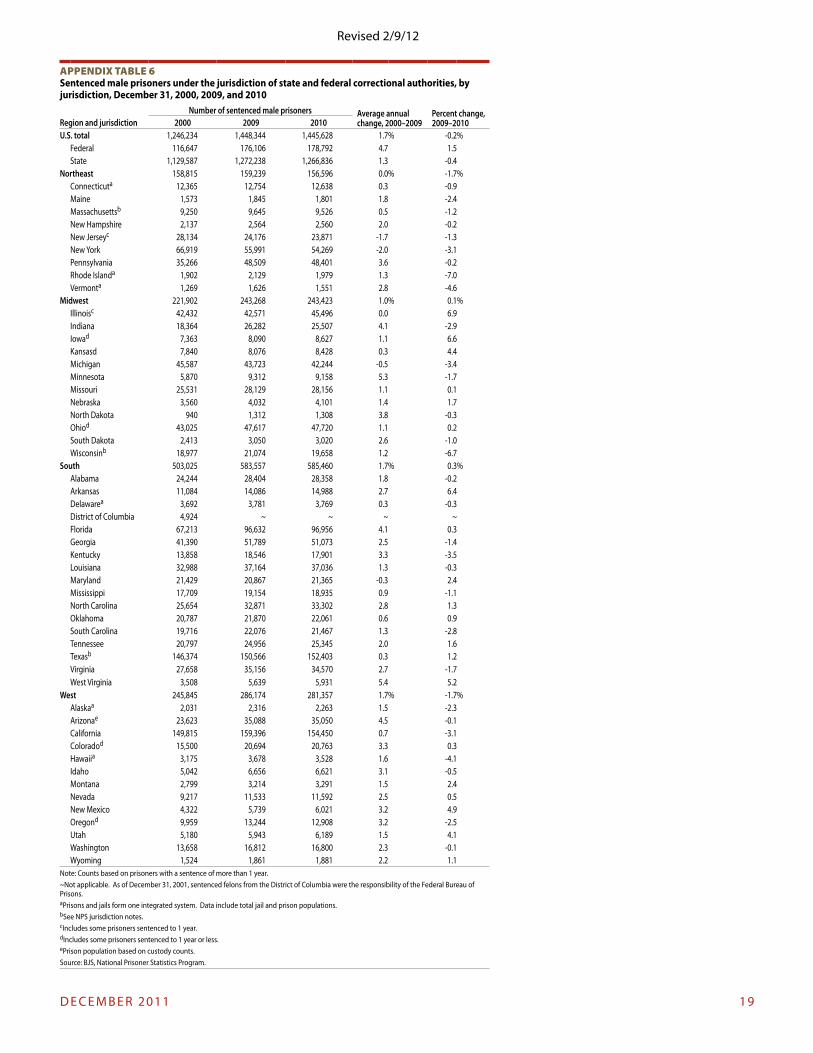
Appendix table 6. Sentenced male prisoners under the jurisdiction of state and federal correctional authorities, by jurisdiction, December 31, 2000, 2009, and 2010
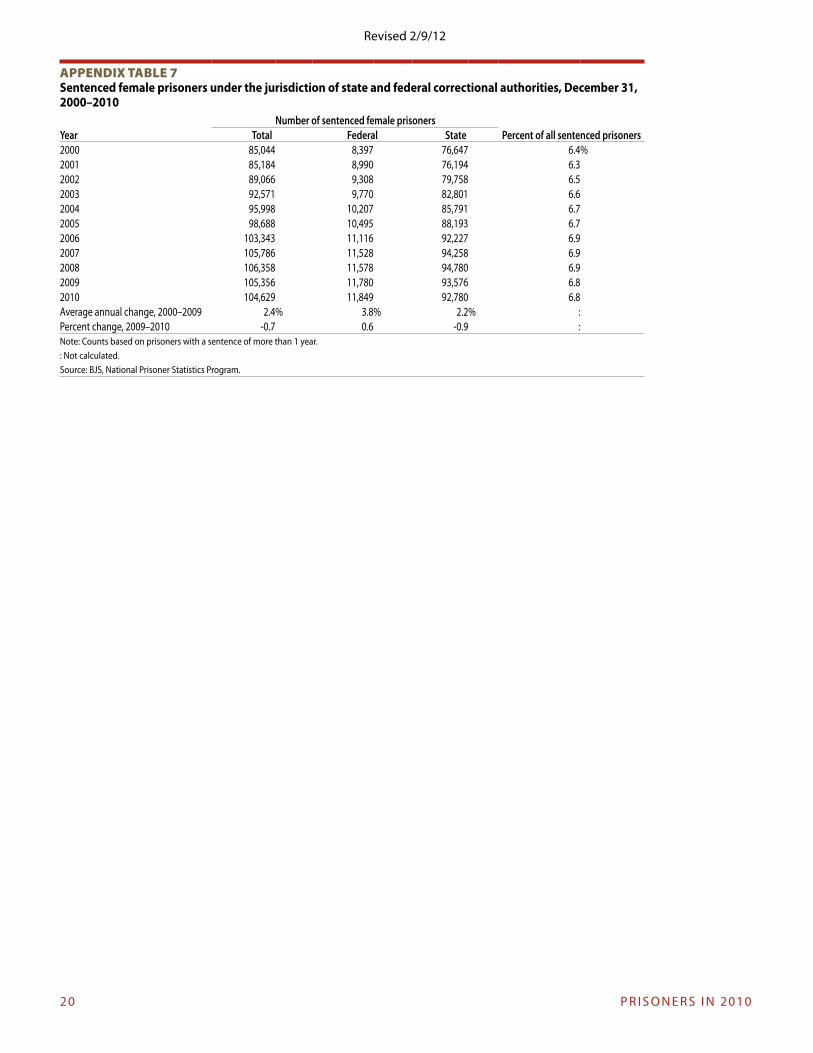
Appendix table 7. Sentenced female prisoners under the jurisdiction of state and federal correctional authorities, December 31, 2000-2010
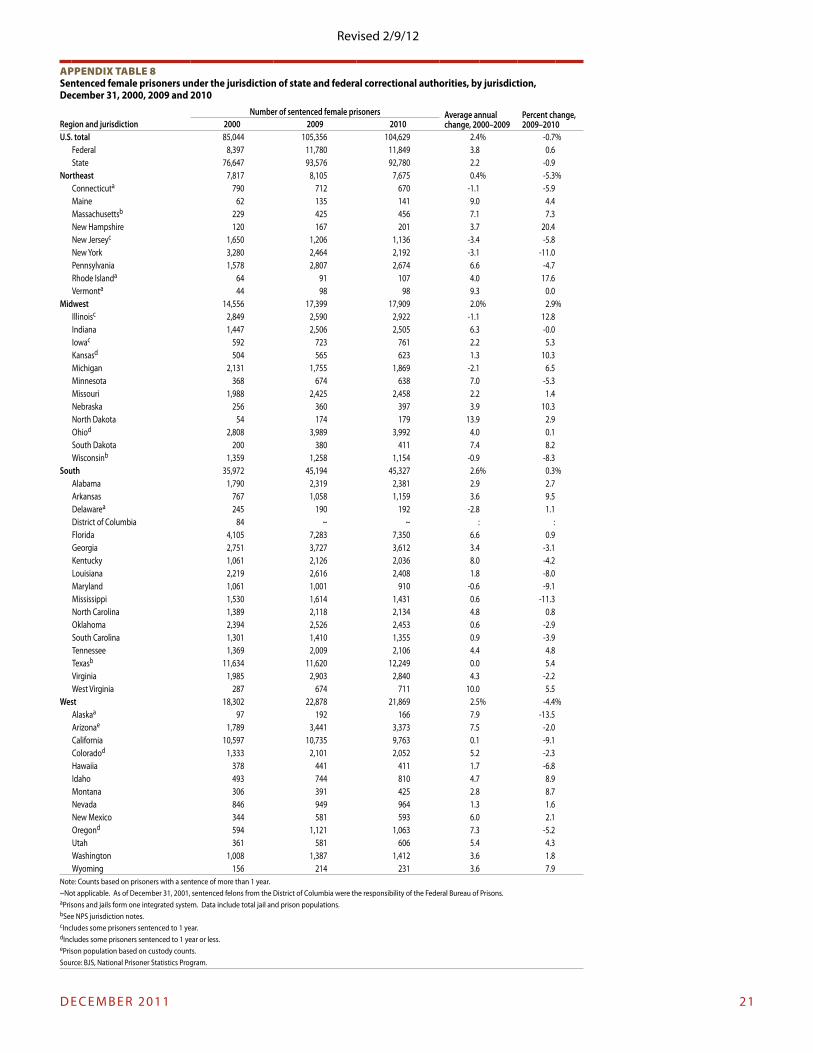
Appendix table 8. Sentenced female prisoners under the jurisdiction of state and federal correctional authorities, by jurisdiction, December 31, 2000, 2009, and 2010
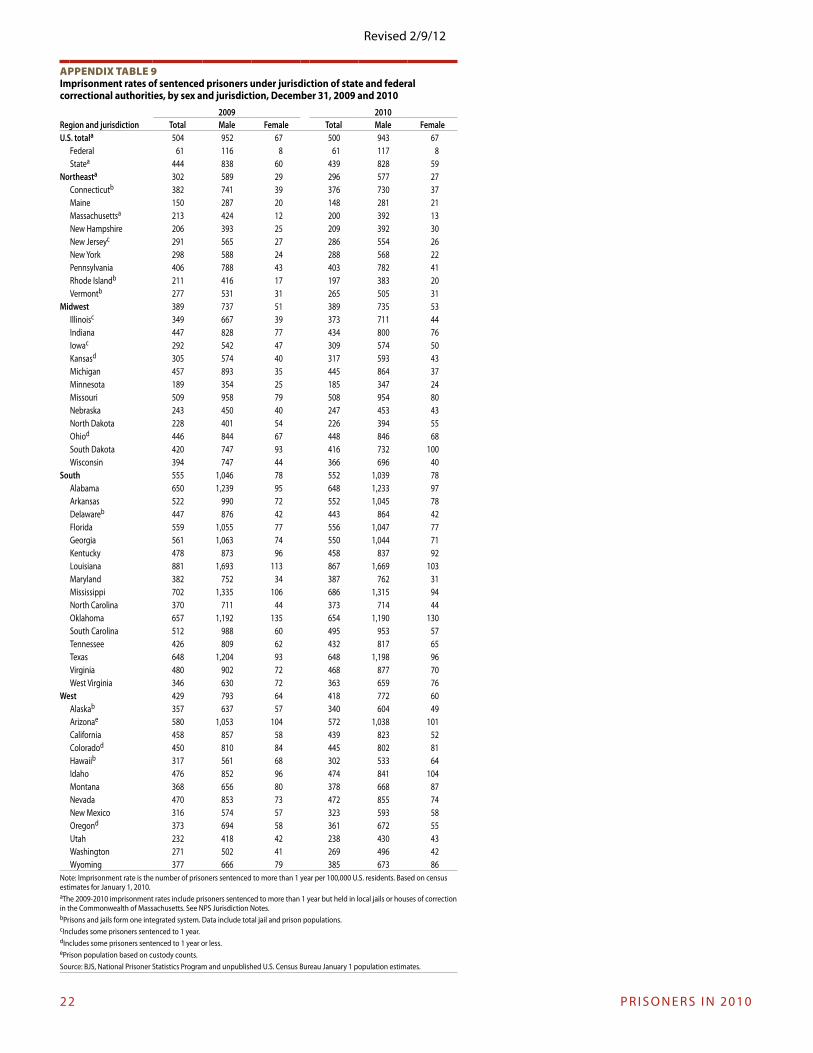
Appendix table 9. Imprisonment rates of sentenced prisoners under jurisdiction of state and federal correctional authorities, by sex and jurisdiction, December 31, 2009 and 2010
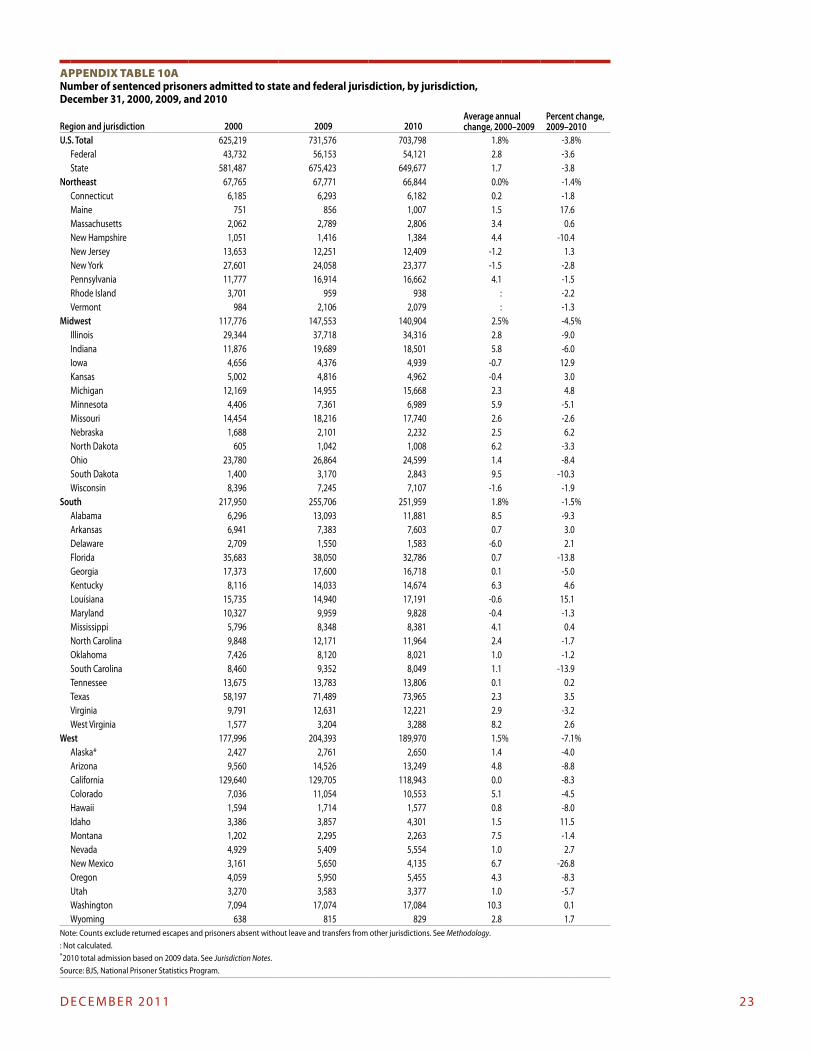
Appendix table 10a. Sentenced prisoners admitted to state or federal jurisdiction, by jurisdiction, December 31, 2000, 2009, and 2010
Appendix table 10b. Sentenced prisoners released from state or federal jurisdiction, by jurisdiction, December 31, 2000, 2009, and 2010
Appendix table 11. Sentenced prisoners admitted to and released from state and federal jurisdiction, by type, December 31, 2010
Appendix table 12. estimated number of sentenced prisoners under state and federal jurisdiction, by sex, race, and Hispanic origin, December 31, 2000-2010
Appendix table 13. estimated number of sentenced prisoners under state and federal jurisdiction, by sex, race, Hispanic origin, and age, December 31, 2010
Appendix table 14. estimated rate of sentenced prisoners under state and federal jurisdiction, per 100,000 U.S. residents, by sex, race, and Hispanic origin, December 31, 2000-2010
Appendix table 15. estimated number of sentenced prisoners under state and federal jurisdiction per 100,000 U.S. residents, by sex, race, Hispanic origin, and age, December 31, 2010
Appendix table 16a. estimated number of sentenced prisoners under state jurisdiction, by offense, sex, race, and Hispanic origin, December 31, 2008
Appendix table 16b. estimated number of sentenced prisoners under state jurisdiction, by offense, sex, race, and Hispanic origin, December 31, 2009
Appendix table 17a. estimated percent of sentenced prisoners under state jurisdiction, by offense, sex, race, and Hispanic origin, December 31, 2008
Appendix table 17b. estimated percent of sentenced prisoners under state jurisdiction, by offense, sex, race, and Hispanic origin, December 31, 2009
Appendix table 18. Sentenced prisoners under federal jurisdiction, by most serious offense, 2000, 2009, and 2010
Appendix table 19. State and federal prisoners in private facilities, December 31, 2000-2010
Appendix table 20. State and federal prisoners in private facilities, by jurisdiction, December 31, 2000, 2009, and 2010
Appendix table 21. State and federal prisoners in local facilities, December 31, 2000-2010
Appendix table 22. State and federal prisoners in local facilities, by jurisdiction, December 31, 2000
Appendix table 23. Reported state and federal prison capacities, December 31, 2010
Appendix table 24. Reported number of inmates under age 18 held in custody in state or federal prisons, by sex, region, and jurisdiction, June 30, 2009 and 2010
Appendix table 25. Reported number of inmates under age 18 held in custody in state or federal prisons, by sex, region, and jurisdiction, June 30, 2009 and 2010
14 P R I S o N e R S I N 2010
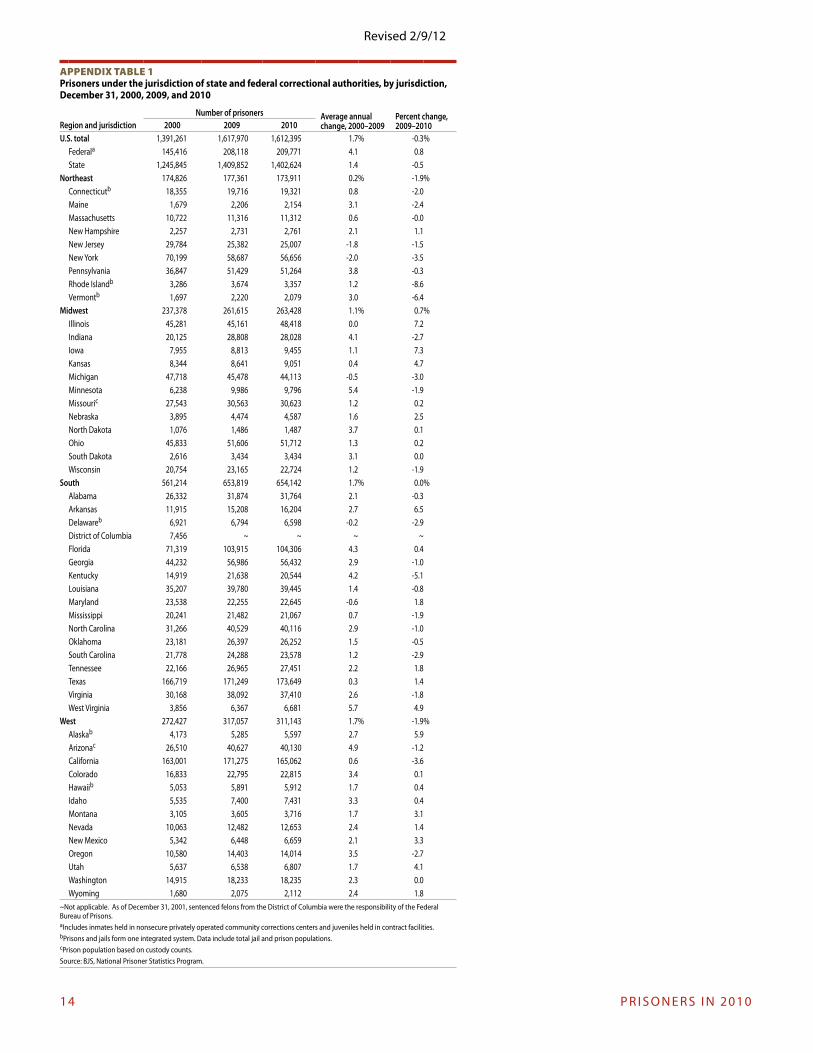
appendix Table 1Prisoners under the jurisdiction of state and federal correctional authorities, by jurisdiction, December 31, 2000, 2009, and 2010
Number of prisoners Average annual change, 2000–2009
Percent change, 2009–2010Region and jurisdiction 2000 2009 2010
U.S. total 1,391,261 1,617,970 1,612,395 1.7% -0.3%Federala 145,416 208,118 209,771 4.1 0.8State 1,245,845 1,409,852 1,402,624 1.4 -0.5
Northeast 174,826 177,361 173,911 0.2% -1.9%Connecticutb 18,355 19,716 19,321 0.8 -2.0Maine 1,679 2,206 2,154 3.1 -2.4Massachusetts 10,722 11,316 11,312 0.6 -0.0New Hampshire 2,257 2,731 2,761 2.1 1.1New Jersey 29,784 25,382 25,007 -1.8 -1.5New York 70,199 58,687 56,656 -2.0 -3.5Pennsylvania 36,847 51,429 51,264 3.8 -0.3Rhode Islandb 3,286 3,674 3,357 1.2 -8.6Vermontb 1,697 2,220 2,079 3.0 -6.4
Midwest 237,378 261,615 263,428 1.1% 0.7%Illinois 45,281 45,161 48,418 0.0 7.2Indiana 20,125 28,808 28,028 4.1 -2.7Iowa 7,955 8,813 9,455 1.1 7.3Kansas 8,344 8,641 9,051 0.4 4.7Michigan 47,718 45,478 44,113 -0.5 -3.0Minnesota 6,238 9,986 9,796 5.4 -1.9Missouric 27,543 30,563 30,623 1.2 0.2Nebraska 3,895 4,474 4,587 1.6 2.5North Dakota 1,076 1,486 1,487 3.7 0.1ohio 45,833 51,606 51,712 1.3 0.2South Dakota 2,616 3,434 3,434 3.1 0.0Wisconsin 20,754 23,165 22,724 1.2 -1.9
South 561,214 653,819 654,142 1.7% 0.0%Alabama 26,332 31,874 31,764 2.1 -0.3Arkansas 11,915 15,208 16,204 2.7 6.5Delawareb 6,921 6,794 6,598 -0.2 -2.9District of Columbia 7,456 ~ ~ ~ ~Florida 71,319 103,915 104,306 4.3 0.4Georgia 44,232 56,986 56,432 2.9 -1.0Kentucky 14,919 21,638 20,544 4.2 -5.1Louisiana 35,207 39,780 39,445 1.4 -0.8Maryland 23,538 22,255 22,645 -0.6 1.8Mississippi 20,241 21,482 21,067 0.7 -1.9North Carolina 31,266 40,529 40,116 2.9 -1.0oklahoma 23,181 26,397 26,252 1.5 -0.5South Carolina 21,778 24,288 23,578 1.2 -2.9Tennessee 22,166 26,965 27,451 2.2 1.8Texas 166,719 171,249 173,649 0.3 1.4Virginia 30,168 38,092 37,410 2.6 -1.8West Virginia 3,856 6,367 6,681 5.7 4.9
West 272,427 317,057 311,143 1.7% -1.9%Alaskab 4,173 5,285 5,597 2.7 5.9Arizonac 26,510 40,627 40,130 4.9 -1.2California 163,001 171,275 165,062 0.6 -3.6Colorado 16,833 22,795 22,815 3.4 0.1Hawaiib 5,053 5,891 5,912 1.7 0.4Idaho 5,535 7,400 7,431 3.3 0.4Montana 3,105 3,605 3,716 1.7 3.1Nevada 10,063 12,482 12,653 2.4 1.4New Mexico 5,342 6,448 6,659 2.1 3.3oregon 10,580 14,403 14,014 3.5 -2.7Utah 5,637 6,538 6,807 1.7 4.1Washington 14,915 18,233 18,235 2.3 0.0Wyoming 1,680 2,075 2,112 2.4 1.8
~Not applicable. As of December 31, 2001, sentenced felons from the District of Columbia were the responsibility of the Federal Bureau of Prisons.aIncludes inmates held in nonsecure privately operated community corrections centers and juveniles held in contract facilities.bPrisons and jails form one integrated system. Data include total jail and prison populations.cPrison population based on custody counts.Source: BJS, National Prisoner Statistics Program.
Revised 2/9/12
D e C e M B e R 2011 15
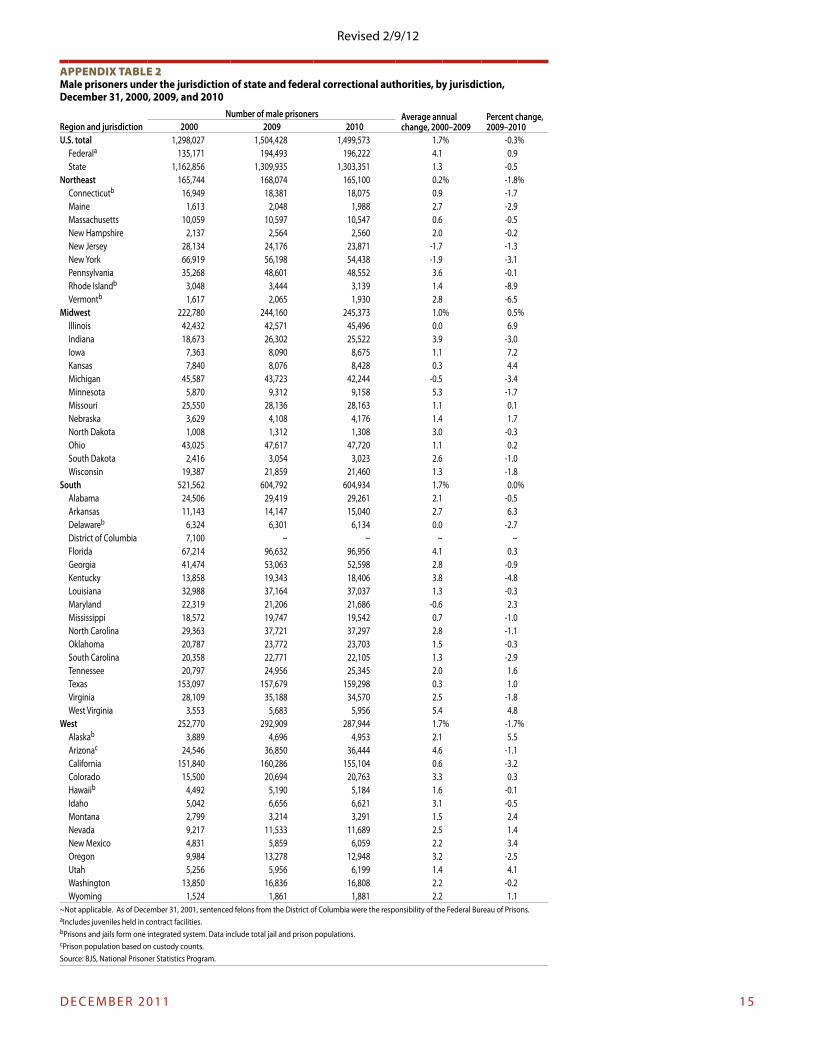
appendix Table 2Male prisoners under the jurisdiction of state and federal correctional authorities, by jurisdiction, December 31, 2000, 2009, and 2010
Number of male prisoners Average annual change, 2000–2009
Percent change, 2009–2010Region and jurisdiction 2000 2009 2010
U.S. total 1,298,027 1,504,428 1,499,573 1.7% -0.3%Federala 135,171 194,493 196,222 4.1 0.9State 1,162,856 1,309,935 1,303,351 1.3 -0.5
Northeast 165,744 168,074 165,100 0.2% -1.8%Connecticutb 16,949 18,381 18,075 0.9 -1.7Maine 1,613 2,048 1,988 2.7 -2.9Massachusetts 10,059 10,597 10,547 0.6 -0.5New Hampshire 2,137 2,564 2,560 2.0 -0.2New Jersey 28,134 24,176 23,871 -1.7 -1.3New York 66,919 56,198 54,438 -1.9 -3.1Pennsylvania 35,268 48,601 48,552 3.6 -0.1Rhode Islandb 3,048 3,444 3,139 1.4 -8.9Vermontb 1,617 2,065 1,930 2.8 -6.5
Midwest 222,780 244,160 245,373 1.0% 0.5%Illinois 42,432 42,571 45,496 0.0 6.9Indiana 18,673 26,302 25,522 3.9 -3.0Iowa 7,363 8,090 8,675 1.1 7.2Kansas 7,840 8,076 8,428 0.3 4.4Michigan 45,587 43,723 42,244 -0.5 -3.4Minnesota 5,870 9,312 9,158 5.3 -1.7Missouri 25,550 28,136 28,163 1.1 0.1Nebraska 3,629 4,108 4,176 1.4 1.7North Dakota 1,008 1,312 1,308 3.0 -0.3ohio 43,025 47,617 47,720 1.1 0.2South Dakota 2,416 3,054 3,023 2.6 -1.0Wisconsin 19,387 21,859 21,460 1.3 -1.8
South 521,562 604,792 604,934 1.7% 0.0%Alabama 24,506 29,419 29,261 2.1 -0.5Arkansas 11,143 14,147 15,040 2.7 6.3Delawareb 6,324 6,301 6,134 0.0 -2.7District of Columbia 7,100 ~ ~ ~ ~Florida 67,214 96,632 96,956 4.1 0.3Georgia 41,474 53,063 52,598 2.8 -0.9Kentucky 13,858 19,343 18,406 3.8 -4.8Louisiana 32,988 37,164 37,037 1.3 -0.3Maryland 22,319 21,206 21,686 -0.6 2.3Mississippi 18,572 19,747 19,542 0.7 -1.0North Carolina 29,363 37,721 37,297 2.8 -1.1oklahoma 20,787 23,772 23,703 1.5 -0.3South Carolina 20,358 22,771 22,105 1.3 -2.9Tennessee 20,797 24,956 25,345 2.0 1.6Texas 153,097 157,679 159,298 0.3 1.0Virginia 28,109 35,188 34,570 2.5 -1.8West Virginia 3,553 5,683 5,956 5.4 4.8
West 252,770 292,909 287,944 1.7% -1.7%Alaskab 3,889 4,696 4,953 2.1 5.5Arizonac 24,546 36,850 36,444 4.6 -1.1California 151,840 160,286 155,104 0.6 -3.2Colorado 15,500 20,694 20,763 3.3 0.3Hawaiib 4,492 5,190 5,184 1.6 -0.1Idaho 5,042 6,656 6,621 3.1 -0.5Montana 2,799 3,214 3,291 1.5 2.4Nevada 9,217 11,533 11,689 2.5 1.4New Mexico 4,831 5,859 6,059 2.2 3.4oregon 9,984 13,278 12,948 3.2 -2.5Utah 5,256 5,956 6,199 1.4 4.1Washington 13,850 16,836 16,808 2.2 -0.2Wyoming 1,524 1,861 1,881 2.2 1.1
~Not applicable. As of December 31, 2001, sentenced felons from the District of Columbia were the responsibility of the Federal Bureau of Prisons.aIncludes juveniles held in contract facilities.bPrisons and jails form one integrated system. Data include total jail and prison populations.cPrison population based on custody counts.Source: BJS, National Prisoner Statistics Program.
Revised 2/9/12
16 P R I S o N e R S I N 2010
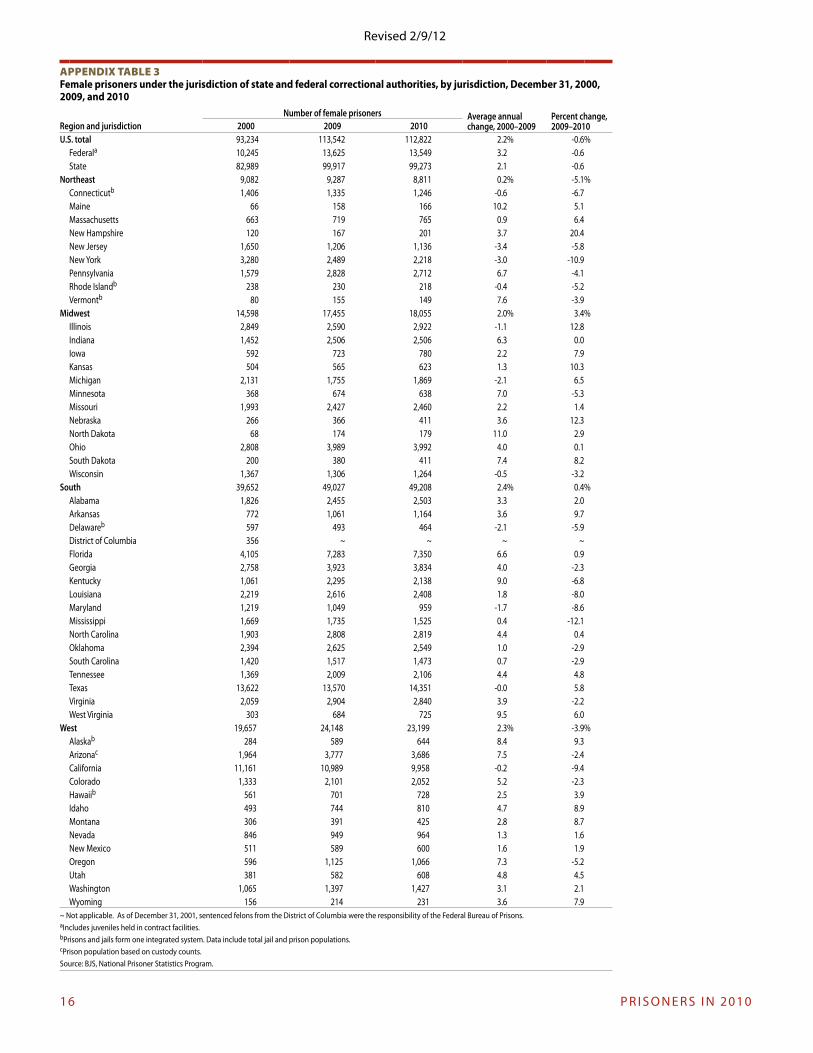
appendix Table 3Female prisoners under the jurisdiction of state and federal correctional authorities, by jurisdiction, December 31, 2000, 2009, and 2010
Region and jurisdictionNumber of female prisoners Average annual
change, 2000–2009Percent change, 2009–20102000 2009 2010
U.S. total 93,234 113,542 112,822 2.2% -0.6%Federala 10,245 13,625 13,549 3.2 -0.6State 82,989 99,917 99,273 2.1 -0.6
Northeast 9,082 9,287 8,811 0.2% -5.1%Connecticutb 1,406 1,335 1,246 -0.6 -6.7Maine 66 158 166 10.2 5.1Massachusetts 663 719 765 0.9 6.4New Hampshire 120 167 201 3.7 20.4New Jersey 1,650 1,206 1,136 -3.4 -5.8New York 3,280 2,489 2,218 -3.0 -10.9Pennsylvania 1,579 2,828 2,712 6.7 -4.1Rhode Islandb 238 230 218 -0.4 -5.2Vermontb 80 155 149 7.6 -3.9
Midwest 14,598 17,455 18,055 2.0% 3.4%Illinois 2,849 2,590 2,922 -1.1 12.8Indiana 1,452 2,506 2,506 6.3 0.0Iowa 592 723 780 2.2 7.9Kansas 504 565 623 1.3 10.3Michigan 2,131 1,755 1,869 -2.1 6.5Minnesota 368 674 638 7.0 -5.3Missouri 1,993 2,427 2,460 2.2 1.4Nebraska 266 366 411 3.6 12.3North Dakota 68 174 179 11.0 2.9ohio 2,808 3,989 3,992 4.0 0.1South Dakota 200 380 411 7.4 8.2Wisconsin 1,367 1,306 1,264 -0.5 -3.2
South 39,652 49,027 49,208 2.4% 0.4%Alabama 1,826 2,455 2,503 3.3 2.0Arkansas 772 1,061 1,164 3.6 9.7Delawareb 597 493 464 -2.1 -5.9District of Columbia 356 ~ ~ ~ ~Florida 4,105 7,283 7,350 6.6 0.9Georgia 2,758 3,923 3,834 4.0 -2.3Kentucky 1,061 2,295 2,138 9.0 -6.8Louisiana 2,219 2,616 2,408 1.8 -8.0Maryland 1,219 1,049 959 -1.7 -8.6Mississippi 1,669 1,735 1,525 0.4 -12.1North Carolina 1,903 2,808 2,819 4.4 0.4oklahoma 2,394 2,625 2,549 1.0 -2.9South Carolina 1,420 1,517 1,473 0.7 -2.9Tennessee 1,369 2,009 2,106 4.4 4.8Texas 13,622 13,570 14,351 -0.0 5.8Virginia 2,059 2,904 2,840 3.9 -2.2West Virginia 303 684 725 9.5 6.0
West 19,657 24,148 23,199 2.3% -3.9%Alaskab 284 589 644 8.4 9.3Arizonac 1,964 3,777 3,686 7.5 -2.4California 11,161 10,989 9,958 -0.2 -9.4Colorado 1,333 2,101 2,052 5.2 -2.3Hawaiib 561 701 728 2.5 3.9Idaho 493 744 810 4.7 8.9Montana 306 391 425 2.8 8.7Nevada 846 949 964 1.3 1.6New Mexico 511 589 600 1.6 1.9oregon 596 1,125 1,066 7.3 -5.2Utah 381 582 608 4.8 4.5Washington 1,065 1,397 1,427 3.1 2.1Wyoming 156 214 231 3.6 7.9
~ Not applicable. As of December 31, 2001, sentenced felons from the District of Columbia were the responsibility of the Federal Bureau of Prisons.aIncludes juveniles held in contract facilities.bPrisons and jails form one integrated system. Data include total jail and prison populations.cPrison population based on custody counts.Source: BJS, National Prisoner Statistics Program.
Revised 2/9/12
D e C e M B e R 2011 17
appendix Table 4Sentenced prisoners under the jurisdiction of state and federal correctional authorities, by jurisdiction, December 31, 2000, 2009, and 2010
Region and jurisdictionNumber of sentenced prisoners Average annual
change, 2000–2009Percent change, 2009–20102000 2009 2010
U.S. total 1,331,278 1,553,700 1,550,257 1.7% -0.2%Federal 125,044 187,886 190,641 4.6 1.5State 1,206,234 1,365,814 1,359,616 1.4 -0.5
Northeast 166,632 167,344 164,271 0.0% -1.8%Connecticuta 13,155 13,466 13,308 0.3 -1.2Maine 1,635 1,980 1,942 2.2 -1.9Massachusettsb 9,479 10,070 9,982 0.7 -0.9New Hampshire 2,257 2,731 2,761 2.1 1.1New Jerseyc 29,784 25,382 25,007 -1.8 -1.5New York 70,199 58,455 56,461 -2.0 -3.4Pennsylvania 36,844 51,316 51,075 3.7 -0.5Rhode Islanda 1,966 2,220 2,086 1.4 -6.0Vermonta 1,313 1,724 1,649 3.1 -4.4
Midwest 236,458 260,667 261,332 1.1% 0.3%Illinoisc 45,281 45,161 48,418 0.0 7.2Indiana 19,811 28,788 28,012 4.2 -2.7Iowad 7,955 8,813 9,388 1.1 6.5Kansasd 8,344 8,641 9,051 0.4 4.7Michigan 47,718 45,478 44,113 -0.5 -3.0Minnesota 6,238 9,986 9,796 5.4 -1.9Missouri 27,519 30,554 30,614 1.2 0.2Nebraska 3,816 4,392 4,498 1.6 2.4North Dakota 994 1,486 1,487 4.6 0.1ohiod 45,833 51,606 51,712 1.3 0.2South Dakota 2,613 3,430 3,431 3.1 0.0Wisconsinb 20,336 22,332 20,812 1.0 -6.8
South 538,997 628,751 630,787 1.7% 0.3%Alabama 26,034 30,723 30,739 1.9 0.1Arkansas 11,851 15,144 16,147 2.8 6.6Delawarea 3,937 3,971 3,961 0.1 -0.3District of Columbia 5,008 ~ ~ ~ ~Florida 71,318 103,915 104,306 4.3 0.4Georgia 44,141 55,516 54,685 2.6 -1.5Kentucky 14,919 20,672 19,937 3.7 -3.6Louisiana 35,207 39,780 39,444 1.4 -0.8Maryland 22,490 21,868 22,275 -0.3 1.9Mississippi 19,239 20,768 20,366 0.9 -1.9North Carolina 27,043 34,989 35,436 2.9 1.3oklahoma 23,181 24,396 24,514 0.6 0.5South Carolina 21,017 23,486 22,822 1.2 -2.8Tennessee 22,166 26,965 27,451 2.2 1.8Texasb 158,008 162,186 164,652 0.3 1.5Virginia 29,643 38,059 37,410 2.8 -1.7West Virginia 3,795 6,313 6,642 5.8 5.2
West 264,147 309,052 303,226 1.8% -1.9%Alaskaa 2,128 2,508 2,429 1.8 -3.1Arizonae 25,412 38,529 38,423 4.7 -0.3California 160,412 170,131 164,213 0.7% -3.5%Coloradod 16,833 22,795 22,815 3.4 0.1Hawaiia 3,553 4,119 3,939 1.7 -4.4Idaho 5,535 7,400 7,431 3.3 0.4Montana 3,105 3,605 3,716 1.7 3.1Nevada 10,063 12,482 12,556 2.4 0.6New Mexico 4,666 6,320 6,614 3.4 4.7oregond 10,553 14,365 13,971 3.5 -2.7Utah 5,541 6,524 6,795 1.8 4.2Washington 14,666 18,199 18,212 2.4 0.1Wyoming 1,680 2,075 2,112 2.4 1.8
Note: Counts based on prisoners with a sentence of more than 1 year.~Not applicable. As of December 31, 2001, sentenced felons from the District of Columbia were the responsibility of the Federal Bureau of Prisons. aPrisons and jails form one integrated system. Data include total jail and prison populations. bSee NPS jurisdiction notes.cIncludes some prisoners sentenced to 1 year. dIncludes some prisoners sentenced to 1 year or less. ePrison population based on custody counts.Source: BJS, National Prisoner Statistics Program.
Revised 2/9/12
18 P R I S o N e R S I N 2010
appendix Table 5Sentenced male prisoners under the jurisdiction of state and federal correctional authorities, December 31, 2000–2010
YearNumber of sentenced male prisoners
Percent of all sentenced prisonersTotal Federal State2000 1,246,234 116,647 1,129,587 93.6%2001 1,260,033 127,519 1,132,514 93.72002 1,291,450 133,732 1,157,718 93.52003 1,315,790 142,149 1,173,641 93.42004 1,337,730 148,930 1,188,800 93.32005 1,364,178 155,678 1,208,500 93.32006 1,401,317 162,417 1,238,900 93.12007 1,427,064 167,676 1,259,388 93.12008 1,441,384 170,755 1,270,629 93.12009 1,448,344 176,106 1,272,238 93.22010 1,445,628 178,792 1,266,836 93.2Average annual change, 2000–2009 1.7% 4.7% 1.3% :Percent change, 2009–2010 -0.2 1.5 -0.4 :Note: Counts based on prisoners with a sentence of more than 1 year.: Not calculated.Source: BJS, National Prisoner Statistics Program.
Revised 2/9/12
D e C e M B e R 2011 19
appendix Table 6Sentenced male prisoners under the jurisdiction of state and federal correctional authorities, by jurisdiction, December 31, 2000, 2009, and 2010
Region and jurisdictionNumber of sentenced male prisoners Average annual
change, 2000–2009Percent change, 2009–20102000 2009 2010
U.S. total 1,246,234 1,448,344 1,445,628 1.7% -0.2%Federal 116,647 176,106 178,792 4.7 1.5State 1,129,587 1,272,238 1,266,836 1.3 -0.4
Northeast 158,815 159,239 156,596 0.0% -1.7%Connecticuta 12,365 12,754 12,638 0.3 -0.9Maine 1,573 1,845 1,801 1.8 -2.4Massachusettsb 9,250 9,645 9,526 0.5 -1.2New Hampshire 2,137 2,564 2,560 2.0 -0.2New Jerseyc 28,134 24,176 23,871 -1.7 -1.3New York 66,919 55,991 54,269 -2.0 -3.1Pennsylvania 35,266 48,509 48,401 3.6 -0.2Rhode Islanda 1,902 2,129 1,979 1.3 -7.0Vermonta 1,269 1,626 1,551 2.8 -4.6
Midwest 221,902 243,268 243,423 1.0% 0.1%Illinoisc 42,432 42,571 45,496 0.0 6.9Indiana 18,364 26,282 25,507 4.1 -2.9Iowad 7,363 8,090 8,627 1.1 6.6Kansasd 7,840 8,076 8,428 0.3 4.4Michigan 45,587 43,723 42,244 -0.5 -3.4Minnesota 5,870 9,312 9,158 5.3 -1.7Missouri 25,531 28,129 28,156 1.1 0.1Nebraska 3,560 4,032 4,101 1.4 1.7North Dakota 940 1,312 1,308 3.8 -0.3ohiod 43,025 47,617 47,720 1.1 0.2South Dakota 2,413 3,050 3,020 2.6 -1.0Wisconsinb 18,977 21,074 19,658 1.2 -6.7
South 503,025 583,557 585,460 1.7% 0.3%Alabama 24,244 28,404 28,358 1.8 -0.2Arkansas 11,084 14,086 14,988 2.7 6.4Delawarea 3,692 3,781 3,769 0.3 -0.3District of Columbia 4,924 ~ ~ ~ ~Florida 67,213 96,632 96,956 4.1 0.3Georgia 41,390 51,789 51,073 2.5 -1.4Kentucky 13,858 18,546 17,901 3.3 -3.5Louisiana 32,988 37,164 37,036 1.3 -0.3Maryland 21,429 20,867 21,365 -0.3 2.4Mississippi 17,709 19,154 18,935 0.9 -1.1North Carolina 25,654 32,871 33,302 2.8 1.3oklahoma 20,787 21,870 22,061 0.6 0.9South Carolina 19,716 22,076 21,467 1.3 -2.8Tennessee 20,797 24,956 25,345 2.0 1.6Texasb 146,374 150,566 152,403 0.3 1.2Virginia 27,658 35,156 34,570 2.7 -1.7West Virginia 3,508 5,639 5,931 5.4 5.2
West 245,845 286,174 281,357 1.7% -1.7%Alaskaa 2,031 2,316 2,263 1.5 -2.3Arizonae 23,623 35,088 35,050 4.5 -0.1California 149,815 159,396 154,450 0.7 -3.1Coloradod 15,500 20,694 20,763 3.3 0.3Hawaiia 3,175 3,678 3,528 1.6 -4.1Idaho 5,042 6,656 6,621 3.1 -0.5Montana 2,799 3,214 3,291 1.5 2.4Nevada 9,217 11,533 11,592 2.5 0.5New Mexico 4,322 5,739 6,021 3.2 4.9oregond 9,959 13,244 12,908 3.2 -2.5Utah 5,180 5,943 6,189 1.5 4.1Washington 13,658 16,812 16,800 2.3 -0.1Wyoming 1,524 1,861 1,881 2.2 1.1
Note: Counts based on prisoners with a sentence of more than 1 year.~Not applicable. As of December 31, 2001, sentenced felons from the District of Columbia were the responsibility of the Federal Bureau of Prisons. aPrisons and jails form one integrated system. Data include total jail and prison populations. bSee NPS jurisdiction notes.cIncludes some prisoners sentenced to 1 year. dIncludes some prisoners sentenced to 1 year or less. ePrison population based on custody counts.Source: BJS, National Prisoner Statistics Program.
Revised 2/9/12
20 P R I S o N e R S I N 2010
appendix Table 7Sentenced female prisoners under the jurisdiction of state and federal correctional authorities, December 31, 2000–2010
Number of sentenced female prisonersPercent of all sentenced prisonersYear Total Federal State
2000 85,044 8,397 76,647 6.4%2001 85,184 8,990 76,194 6.32002 89,066 9,308 79,758 6.52003 92,571 9,770 82,801 6.62004 95,998 10,207 85,791 6.72005 98,688 10,495 88,193 6.72006 103,343 11,116 92,227 6.92007 105,786 11,528 94,258 6.92008 106,358 11,578 94,780 6.92009 105,356 11,780 93,576 6.82010 104,629 11,849 92,780 6.8Average annual change, 2000–2009 2.4% 3.8% 2.2% :Percent change, 2009–2010 -0.7 0.6 -0.9 :Note: Counts based on prisoners with a sentence of more than 1 year.: Not calculated.Source: BJS, National Prisoner Statistics Program.
Revised 2/9/12
D e C e M B e R 2011 21
appendix Table 8Sentenced female prisoners under the jurisdiction of state and federal correctional authorities, by jurisdiction, December 31, 2000, 2009 and 2010
Number of sentenced female prisoners Average annual change, 2000–2009
Percent change, 2009–2010Region and jurisdiction 2000 2009 2010
U.S. total 85,044 105,356 104,629 2.4% -0.7%Federal 8,397 11,780 11,849 3.8 0.6State 76,647 93,576 92,780 2.2 -0.9
Northeast 7,817 8,105 7,675 0.4% -5.3%Connecticuta 790 712 670 -1.1 -5.9Maine 62 135 141 9.0 4.4Massachusettsb 229 425 456 7.1 7.3New Hampshire 120 167 201 3.7 20.4New Jerseyc 1,650 1,206 1,136 -3.4 -5.8New York 3,280 2,464 2,192 -3.1 -11.0Pennsylvania 1,578 2,807 2,674 6.6 -4.7Rhode Islanda 64 91 107 4.0 17.6Vermonta 44 98 98 9.3 0.0
Midwest 14,556 17,399 17,909 2.0% 2.9%Illinoisc 2,849 2,590 2,922 -1.1 12.8Indiana 1,447 2,506 2,505 6.3 -0.0Iowac 592 723 761 2.2 5.3Kansasd 504 565 623 1.3 10.3Michigan 2,131 1,755 1,869 -2.1 6.5Minnesota 368 674 638 7.0 -5.3Missouri 1,988 2,425 2,458 2.2 1.4Nebraska 256 360 397 3.9 10.3North Dakota 54 174 179 13.9 2.9ohiod 2,808 3,989 3,992 4.0 0.1South Dakota 200 380 411 7.4 8.2Wisconsinb 1,359 1,258 1,154 -0.9 -8.3
South 35,972 45,194 45,327 2.6% 0.3%Alabama 1,790 2,319 2,381 2.9 2.7Arkansas 767 1,058 1,159 3.6 9.5Delawarea 245 190 192 -2.8 1.1District of Columbia 84 ~ ~ : :Florida 4,105 7,283 7,350 6.6 0.9Georgia 2,751 3,727 3,612 3.4 -3.1Kentucky 1,061 2,126 2,036 8.0 -4.2Louisiana 2,219 2,616 2,408 1.8 -8.0Maryland 1,061 1,001 910 -0.6 -9.1Mississippi 1,530 1,614 1,431 0.6 -11.3North Carolina 1,389 2,118 2,134 4.8 0.8oklahoma 2,394 2,526 2,453 0.6 -2.9South Carolina 1,301 1,410 1,355 0.9 -3.9Tennessee 1,369 2,009 2,106 4.4 4.8Texasb 11,634 11,620 12,249 0.0 5.4Virginia 1,985 2,903 2,840 4.3 -2.2West Virginia 287 674 711 10.0 5.5
West 18,302 22,878 21,869 2.5% -4.4%Alaskaa 97 192 166 7.9 -13.5Arizonae 1,789 3,441 3,373 7.5 -2.0California 10,597 10,735 9,763 0.1 -9.1Coloradod 1,333 2,101 2,052 5.2 -2.3Hawaiia 378 441 411 1.7 -6.8Idaho 493 744 810 4.7 8.9Montana 306 391 425 2.8 8.7Nevada 846 949 964 1.3 1.6New Mexico 344 581 593 6.0 2.1oregond 594 1,121 1,063 7.3 -5.2Utah 361 581 606 5.4 4.3Washington 1,008 1,387 1,412 3.6 1.8Wyoming 156 214 231 3.6 7.9
Note: Counts based on prisoners with a sentence of more than 1 year.~Not applicable. As of December 31, 2001, sentenced felons from the District of Columbia were the responsibility of the Federal Bureau of Prisons. aPrisons and jails form one integrated system. Data include total jail and prison populations. bSee NPS jurisdiction notes.cIncludes some prisoners sentenced to 1 year. dIncludes some prisoners sentenced to 1 year or less. ePrison population based on custody counts.Source: BJS, National Prisoner Statistics Program.
Revised 2/9/12
22 P R I S o N e R S I N 2010
appendix Table 9Imprisonment rates of sentenced prisoners under jurisdiction of state and federal correctional authorities, by sex and jurisdiction, December 31, 2009 and 2010
Region and jurisdiction2009 2010
Total Male Female Total Male FemaleU.S. totala 504 952 67 500 943 67
Federal 61 116 8 61 117 8Statea 444 838 60 439 828 59
Northeasta 302 589 29 296 577 27Connecticutb 382 741 39 376 730 37Maine 150 287 20 148 281 21Massachusettsa 213 424 12 200 392 13New Hampshire 206 393 25 209 392 30New Jerseyc 291 565 27 286 554 26New York 298 588 24 288 568 22Pennsylvania 406 788 43 403 782 41Rhode Islandb 211 416 17 197 383 20Vermontb 277 531 31 265 505 31
Midwest 389 737 51 389 735 53Illinoisc 349 667 39 373 711 44Indiana 447 828 77 434 800 76Iowac 292 542 47 309 574 50Kansasd 305 574 40 317 593 43Michigan 457 893 35 445 864 37Minnesota 189 354 25 185 347 24Missouri 509 958 79 508 954 80Nebraska 243 450 40 247 453 43North Dakota 228 401 54 226 394 55ohiod 446 844 67 448 846 68South Dakota 420 747 93 416 732 100Wisconsin 394 747 44 366 696 40
South 555 1,046 78 552 1,039 78Alabama 650 1,239 95 648 1,233 97Arkansas 522 990 72 552 1,045 78Delawareb 447 876 42 443 864 42Florida 559 1,055 77 556 1,047 77Georgia 561 1,063 74 550 1,044 71Kentucky 478 873 96 458 837 92Louisiana 881 1,693 113 867 1,669 103Maryland 382 752 34 387 762 31Mississippi 702 1,335 106 686 1,315 94North Carolina 370 711 44 373 714 44oklahoma 657 1,192 135 654 1,190 130South Carolina 512 988 60 495 953 57Tennessee 426 809 62 432 817 65Texas 648 1,204 93 648 1,198 96Virginia 480 902 72 468 877 70West Virginia 346 630 72 363 659 76
West 429 793 64 418 772 60Alaskab 357 637 57 340 604 49Arizonae 580 1,053 104 572 1,038 101California 458 857 58 439 823 52Coloradod 450 810 84 445 802 81Hawaiib 317 561 68 302 533 64Idaho 476 852 96 474 841 104Montana 368 656 80 378 668 87Nevada 470 853 73 472 855 74New Mexico 316 574 57 323 593 58oregond 373 694 58 361 672 55Utah 232 418 42 238 430 43Washington 271 502 41 269 496 42Wyoming 377 666 79 385 673 86
Note: Imprisonment rate is the number of prisoners sentenced to more than 1 year per 100,000 U.S. residents. Based on census estimates for January 1, 2010.aThe 2009-2010 imprisonment rates include prisoners sentenced to more than 1 year but held in local jails or houses of correction in the Commonwealth of Massachusetts. See NPS Jurisdiction Notes.bPrisons and jails form one integrated system. Data include total jail and prison populations.cIncludes some prisoners sentenced to 1 year.dIncludes some prisoners sentenced to 1 year or less.ePrison population based on custody counts. Source: BJS, National Prisoner Statistics Program and unpublished U.S. Census Bureau January 1 population estimates.
Revised 2/9/12
D e C e M B e R 2011 23
appendix Table 10aNumber of sentenced prisoners admitted to state and federal jurisdiction, by jurisdiction, December 31, 2000, 2009, and 2010
Region and jurisdiction 2000 2009 2010Average annual change, 2000–2009
Percent change, 2009–2010
U.S. Total 625,219 731,576 703,798 1.8% -3.8%Federal 43,732 56,153 54,121 2.8 -3.6State 581,487 675,423 649,677 1.7 -3.8
Northeast 67,765 67,771 66,844 0.0% -1.4%Connecticut 6,185 6,293 6,182 0.2 -1.8Maine 751 856 1,007 1.5 17.6Massachusetts 2,062 2,789 2,806 3.4 0.6New Hampshire 1,051 1,416 1,384 4.4 -10.4New Jersey 13,653 12,251 12,409 -1.2 1.3New York 27,601 24,058 23,377 -1.5 -2.8Pennsylvania 11,777 16,914 16,662 4.1 -1.5Rhode Island 3,701 959 938 : -2.2Vermont 984 2,106 2,079 : -1.3
Midwest 117,776 147,553 140,904 2.5% -4.5%Illinois 29,344 37,718 34,316 2.8 -9.0Indiana 11,876 19,689 18,501 5.8 -6.0Iowa 4,656 4,376 4,939 -0.7 12.9Kansas 5,002 4,816 4,962 -0.4 3.0Michigan 12,169 14,955 15,668 2.3 4.8Minnesota 4,406 7,361 6,989 5.9 -5.1Missouri 14,454 18,216 17,740 2.6 -2.6Nebraska 1,688 2,101 2,232 2.5 6.2North Dakota 605 1,042 1,008 6.2 -3.3ohio 23,780 26,864 24,599 1.4 -8.4South Dakota 1,400 3,170 2,843 9.5 -10.3Wisconsin 8,396 7,245 7,107 -1.6 -1.9
South 217,950 255,706 251,959 1.8% -1.5%Alabama 6,296 13,093 11,881 8.5 -9.3Arkansas 6,941 7,383 7,603 0.7 3.0Delaware 2,709 1,550 1,583 -6.0 2.1Florida 35,683 38,050 32,786 0.7 -13.8Georgia 17,373 17,600 16,718 0.1 -5.0Kentucky 8,116 14,033 14,674 6.3 4.6Louisiana 15,735 14,940 17,191 -0.6 15.1Maryland 10,327 9,959 9,828 -0.4 -1.3Mississippi 5,796 8,348 8,381 4.1 0.4North Carolina 9,848 12,171 11,964 2.4 -1.7oklahoma 7,426 8,120 8,021 1.0 -1.2South Carolina 8,460 9,352 8,049 1.1 -13.9Tennessee 13,675 13,783 13,806 0.1 0.2Texas 58,197 71,489 73,965 2.3 3.5Virginia 9,791 12,631 12,221 2.9 -3.2West Virginia 1,577 3,204 3,288 8.2 2.6
West 177,996 204,393 189,970 1.5% -7.1%Alaska* 2,427 2,761 2,650 1.4 -4.0Arizona 9,560 14,526 13,249 4.8 -8.8California 129,640 129,705 118,943 0.0 -8.3Colorado 7,036 11,054 10,553 5.1 -4.5Hawaii 1,594 1,714 1,577 0.8 -8.0Idaho 3,386 3,857 4,301 1.5 11.5Montana 1,202 2,295 2,263 7.5 -1.4Nevada 4,929 5,409 5,554 1.0 2.7New Mexico 3,161 5,650 4,135 6.7 -26.8oregon 4,059 5,950 5,455 4.3 -8.3Utah 3,270 3,583 3,377 1.0 -5.7Washington 7,094 17,074 17,084 10.3 0.1Wyoming 638 815 829 2.8 1.7
Note: Counts exclude returned escapes and prisoners absent without leave and transfers from other jurisdictions. See Methodology.: Not calculated.*2010 total admission based on 2009 data. See Jurisdiction Notes. Source: BJS, National Prisoner Statistics Program.
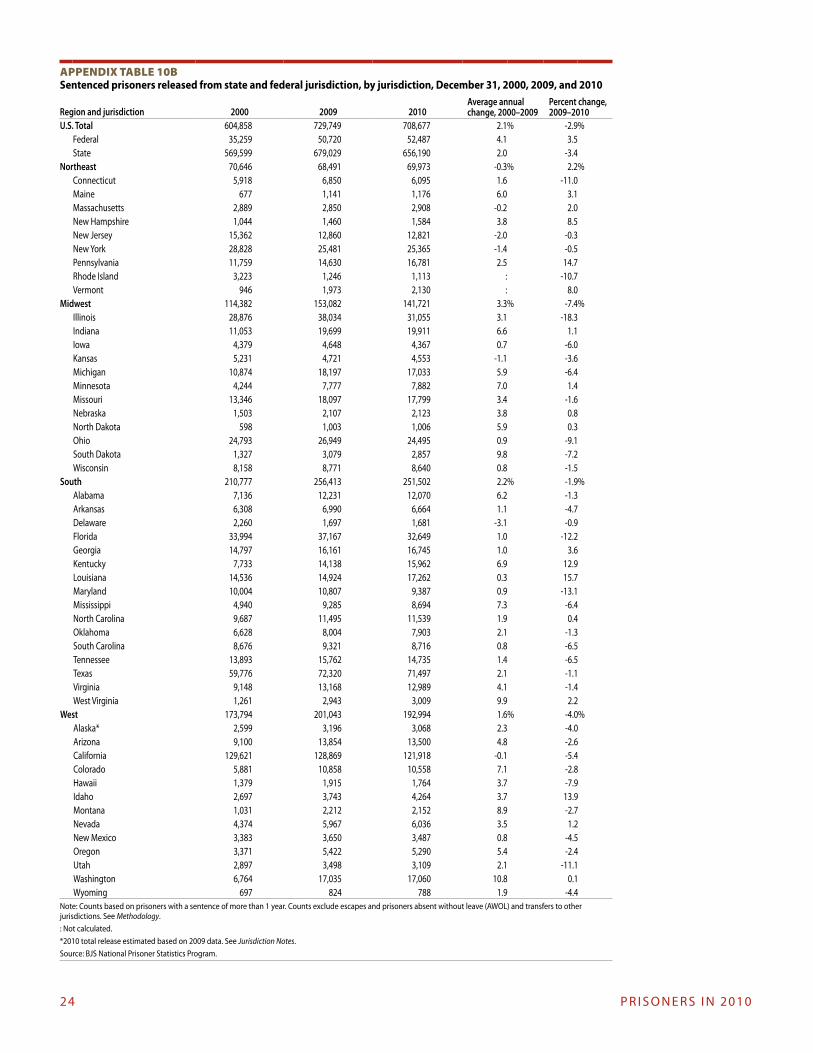
24 P R I S o N e R S I N 2010
appendix Table 10bSentenced prisoners released from state and federal jurisdiction, by jurisdiction, December 31, 2000, 2009, and 2010
Region and jurisdiction 2000 2009 2010Average annual change, 2000–2009
Percent change, 2009–2010
U.S. Total 604,858 729,749 708,677 2.1% -2.9%Federal 35,259 50,720 52,487 4.1 3.5State 569,599 679,029 656,190 2.0 -3.4
Northeast 70,646 68,491 69,973 -0.3% 2.2%Connecticut 5,918 6,850 6,095 1.6 -11.0Maine 677 1,141 1,176 6.0 3.1Massachusetts 2,889 2,850 2,908 -0.2 2.0New Hampshire 1,044 1,460 1,584 3.8 8.5New Jersey 15,362 12,860 12,821 -2.0 -0.3New York 28,828 25,481 25,365 -1.4 -0.5Pennsylvania 11,759 14,630 16,781 2.5 14.7Rhode Island 3,223 1,246 1,113 : -10.7Vermont 946 1,973 2,130 : 8.0
Midwest 114,382 153,082 141,721 3.3% -7.4%Illinois 28,876 38,034 31,055 3.1 -18.3Indiana 11,053 19,699 19,911 6.6 1.1Iowa 4,379 4,648 4,367 0.7 -6.0Kansas 5,231 4,721 4,553 -1.1 -3.6Michigan 10,874 18,197 17,033 5.9 -6.4Minnesota 4,244 7,777 7,882 7.0 1.4Missouri 13,346 18,097 17,799 3.4 -1.6Nebraska 1,503 2,107 2,123 3.8 0.8North Dakota 598 1,003 1,006 5.9 0.3ohio 24,793 26,949 24,495 0.9 -9.1South Dakota 1,327 3,079 2,857 9.8 -7.2Wisconsin 8,158 8,771 8,640 0.8 -1.5
South 210,777 256,413 251,502 2.2% -1.9%Alabama 7,136 12,231 12,070 6.2 -1.3Arkansas 6,308 6,990 6,664 1.1 -4.7Delaware 2,260 1,697 1,681 -3.1 -0.9Florida 33,994 37,167 32,649 1.0 -12.2Georgia 14,797 16,161 16,745 1.0 3.6Kentucky 7,733 14,138 15,962 6.9 12.9Louisiana 14,536 14,924 17,262 0.3 15.7Maryland 10,004 10,807 9,387 0.9 -13.1Mississippi 4,940 9,285 8,694 7.3 -6.4North Carolina 9,687 11,495 11,539 1.9 0.4oklahoma 6,628 8,004 7,903 2.1 -1.3South Carolina 8,676 9,321 8,716 0.8 -6.5Tennessee 13,893 15,762 14,735 1.4 -6.5Texas 59,776 72,320 71,497 2.1 -1.1Virginia 9,148 13,168 12,989 4.1 -1.4West Virginia 1,261 2,943 3,009 9.9 2.2
West 173,794 201,043 192,994 1.6% -4.0%Alaska* 2,599 3,196 3,068 2.3 -4.0Arizona 9,100 13,854 13,500 4.8 -2.6California 129,621 128,869 121,918 -0.1 -5.4Colorado 5,881 10,858 10,558 7.1 -2.8Hawaii 1,379 1,915 1,764 3.7 -7.9Idaho 2,697 3,743 4,264 3.7 13.9Montana 1,031 2,212 2,152 8.9 -2.7Nevada 4,374 5,967 6,036 3.5 1.2New Mexico 3,383 3,650 3,487 0.8 -4.5oregon 3,371 5,422 5,290 5.4 -2.4Utah 2,897 3,498 3,109 2.1 -11.1Washington 6,764 17,035 17,060 10.8 0.1Wyoming 697 824 788 1.9 -4.4
Note: Counts based on prisoners with a sentence of more than 1 year. Counts exclude escapes and prisoners absent without leave (AWoL) and transfers to other jurisdictions. See Methodology.: Not calculated.*2010 total release estimated based on 2009 data. See Jurisdiction Notes. Source: BJS National Prisoner Statistics Program.
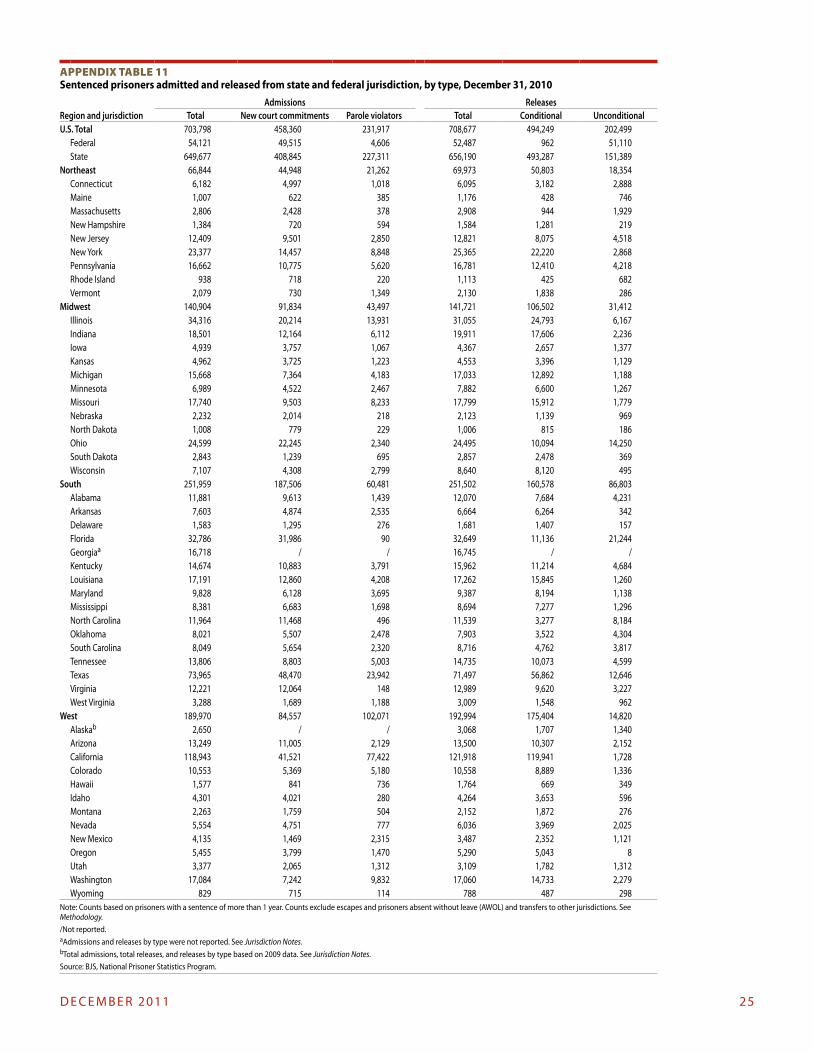
D e C e M B e R 2011 25
appendix Table 11Sentenced prisoners admitted and released from state and federal jurisdiction, by type, December 31, 2010
Region and jurisdictionAdmissions Releases
Total New court commitments Parole violators Total Conditional UnconditionalU.S. Total 703,798 458,360 231,917 708,677 494,249 202,499
Federal 54,121 49,515 4,606 52,487 962 51,110State 649,677 408,845 227,311 656,190 493,287 151,389
Northeast 66,844 44,948 21,262 69,973 50,803 18,354Connecticut 6,182 4,997 1,018 6,095 3,182 2,888Maine 1,007 622 385 1,176 428 746Massachusetts 2,806 2,428 378 2,908 944 1,929New Hampshire 1,384 720 594 1,584 1,281 219New Jersey 12,409 9,501 2,850 12,821 8,075 4,518New York 23,377 14,457 8,848 25,365 22,220 2,868Pennsylvania 16,662 10,775 5,620 16,781 12,410 4,218Rhode Island 938 718 220 1,113 425 682Vermont 2,079 730 1,349 2,130 1,838 286
Midwest 140,904 91,834 43,497 141,721 106,502 31,412Illinois 34,316 20,214 13,931 31,055 24,793 6,167Indiana 18,501 12,164 6,112 19,911 17,606 2,236Iowa 4,939 3,757 1,067 4,367 2,657 1,377Kansas 4,962 3,725 1,223 4,553 3,396 1,129Michigan 15,668 7,364 4,183 17,033 12,892 1,188Minnesota 6,989 4,522 2,467 7,882 6,600 1,267Missouri 17,740 9,503 8,233 17,799 15,912 1,779Nebraska 2,232 2,014 218 2,123 1,139 969North Dakota 1,008 779 229 1,006 815 186ohio 24,599 22,245 2,340 24,495 10,094 14,250South Dakota 2,843 1,239 695 2,857 2,478 369Wisconsin 7,107 4,308 2,799 8,640 8,120 495
South 251,959 187,506 60,481 251,502 160,578 86,803Alabama 11,881 9,613 1,439 12,070 7,684 4,231Arkansas 7,603 4,874 2,535 6,664 6,264 342Delaware 1,583 1,295 276 1,681 1,407 157Florida 32,786 31,986 90 32,649 11,136 21,244Georgiaa 16,718 / / 16,745 / /Kentucky 14,674 10,883 3,791 15,962 11,214 4,684Louisiana 17,191 12,860 4,208 17,262 15,845 1,260Maryland 9,828 6,128 3,695 9,387 8,194 1,138Mississippi 8,381 6,683 1,698 8,694 7,277 1,296North Carolina 11,964 11,468 496 11,539 3,277 8,184oklahoma 8,021 5,507 2,478 7,903 3,522 4,304South Carolina 8,049 5,654 2,320 8,716 4,762 3,817Tennessee 13,806 8,803 5,003 14,735 10,073 4,599Texas 73,965 48,470 23,942 71,497 56,862 12,646Virginia 12,221 12,064 148 12,989 9,620 3,227West Virginia 3,288 1,689 1,188 3,009 1,548 962
West 189,970 84,557 102,071 192,994 175,404 14,820Alaskab 2,650 / / 3,068 1,707 1,340Arizona 13,249 11,005 2,129 13,500 10,307 2,152California 118,943 41,521 77,422 121,918 119,941 1,728Colorado 10,553 5,369 5,180 10,558 8,889 1,336Hawaii 1,577 841 736 1,764 669 349Idaho 4,301 4,021 280 4,264 3,653 596Montana 2,263 1,759 504 2,152 1,872 276Nevada 5,554 4,751 777 6,036 3,969 2,025New Mexico 4,135 1,469 2,315 3,487 2,352 1,121oregon 5,455 3,799 1,470 5,290 5,043 8Utah 3,377 2,065 1,312 3,109 1,782 1,312Washington 17,084 7,242 9,832 17,060 14,733 2,279Wyoming 829 715 114 788 487 298
Note: Counts based on prisoners with a sentence of more than 1 year. Counts exclude escapes and prisoners absent without leave (AWoL) and transfers to other jurisdictions. See Methodology./Not reported.aAdmissions and releases by type were not reported. See Jurisdiction Notes. bTotal admissions, total releases, and releases by type based on 2009 data. See Jurisdiction Notes.Source: BJS, National Prisoner Statistics Program.
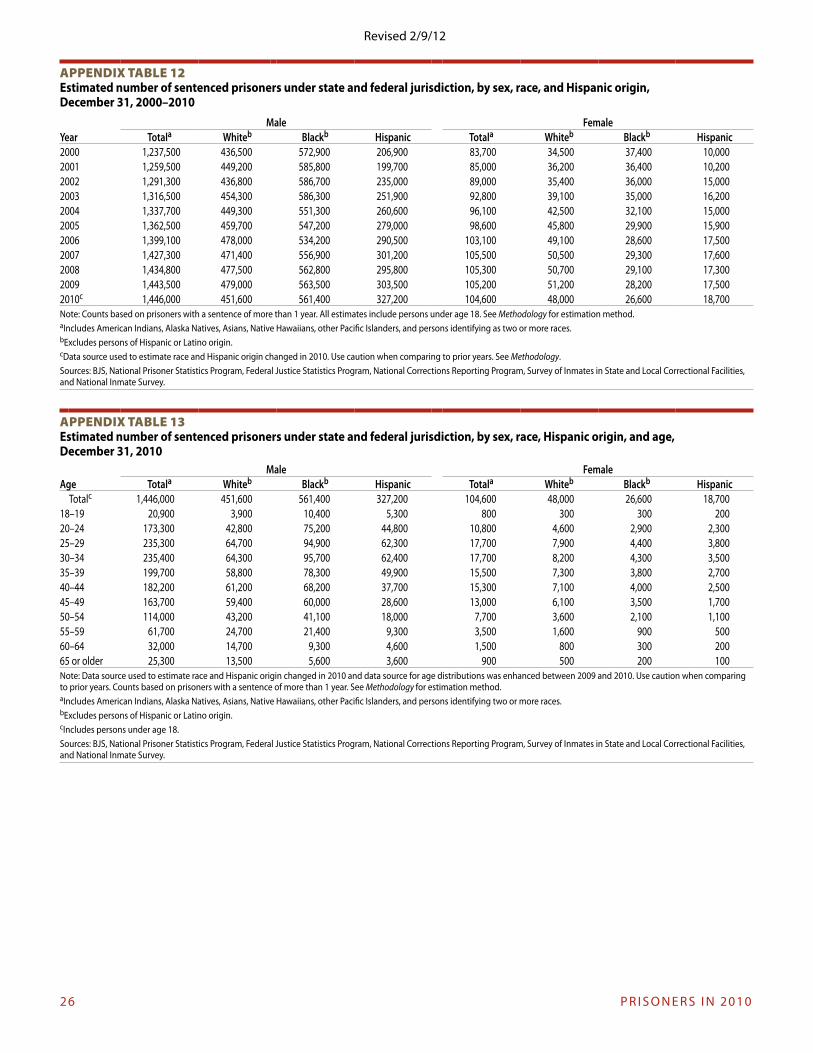
26 P R I S o N e R S I N 2010
appendix Table 12Estimated number of sentenced prisoners under state and federal jurisdiction, by sex, race, and Hispanic origin, December 31, 2000–2010
Male FemaleYear Totala Whiteb Blackb Hispanic Totala Whiteb Blackb Hispanic2000 1,237,500 436,500 572,900 206,900 83,700 34,500 37,400 10,0002001 1,259,500 449,200 585,800 199,700 85,000 36,200 36,400 10,2002002 1,291,300 436,800 586,700 235,000 89,000 35,400 36,000 15,0002003 1,316,500 454,300 586,300 251,900 92,800 39,100 35,000 16,2002004 1,337,700 449,300 551,300 260,600 96,100 42,500 32,100 15,0002005 1,362,500 459,700 547,200 279,000 98,600 45,800 29,900 15,9002006 1,399,100 478,000 534,200 290,500 103,100 49,100 28,600 17,5002007 1,427,300 471,400 556,900 301,200 105,500 50,500 29,300 17,6002008 1,434,800 477,500 562,800 295,800 105,300 50,700 29,100 17,3002009 1,443,500 479,000 563,500 303,500 105,200 51,200 28,200 17,5002010c 1,446,000 451,600 561,400 327,200 104,600 48,000 26,600 18,700Note: Counts based on prisoners with a sentence of more than 1 year. All estimates include persons under age 18. See Methodology for estimation method. aIncludes American Indians, Alaska Natives, Asians, Native Hawaiians, other Pacific Islanders, and persons identifying as two or more races.bexcludes persons of Hispanic or Latino origin.cData source used to estimate race and Hispanic origin changed in 2010. Use caution when comparing to prior years. See Methodology. Sources: BJS, National Prisoner Statistics Program, Federal Justice Statistics Program, National Corrections Reporting Program, Survey of Inmates in State and Local Correctional Facilities, and National Inmate Survey.
appendix Table 13Estimated number of sentenced prisoners under state and federal jurisdiction, by sex, race, Hispanic origin, and age, December 31, 2010
Male FemaleAge Totala Whiteb Blackb Hispanic Totala Whiteb Blackb Hispanic
Totalc 1,446,000 451,600 561,400 327,200 104,600 48,000 26,600 18,70018–19 20,900 3,900 10,400 5,300 800 300 300 20020–24 173,300 42,800 75,200 44,800 10,800 4,600 2,900 2,30025–29 235,300 64,700 94,900 62,300 17,700 7,900 4,400 3,80030–34 235,400 64,300 95,700 62,400 17,700 8,200 4,300 3,50035–39 199,700 58,800 78,300 49,900 15,500 7,300 3,800 2,70040–44 182,200 61,200 68,200 37,700 15,300 7,100 4,000 2,50045–49 163,700 59,400 60,000 28,600 13,000 6,100 3,500 1,70050–54 114,000 43,200 41,100 18,000 7,700 3,600 2,100 1,10055–59 61,700 24,700 21,400 9,300 3,500 1,600 900 50060–64 32,000 14,700 9,300 4,600 1,500 800 300 20065 or older 25,300 13,500 5,600 3,600 900 500 200 100Note: Data source used to estimate race and Hispanic origin changed in 2010 and data source for age distributions was enhanced between 2009 and 2010. Use caution when comparing to prior years. Counts based on prisoners with a sentence of more than 1 year. See Methodology for estimation method.aIncludes American Indians, Alaska Natives, Asians, Native Hawaiians, other Pacific Islanders, and persons identifying two or more races.bexcludes persons of Hispanic or Latino origin. cIncludes persons under age 18. Sources: BJS, National Prisoner Statistics Program, Federal Justice Statistics Program, National Corrections Reporting Program, Survey of Inmates in State and Local Correctional Facilities, and National Inmate Survey.
Revised 2/9/12
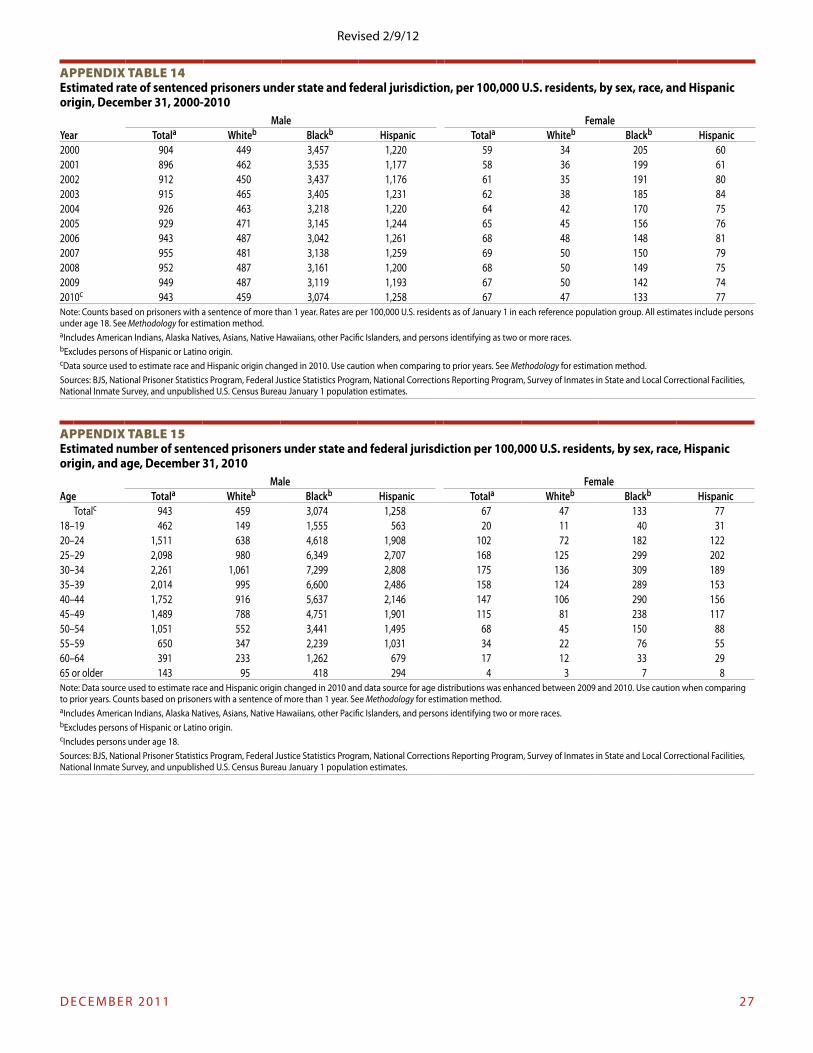
D e C e M B e R 2011 27
appendix Table 14Estimated rate of sentenced prisoners under state and federal jurisdiction, per 100,000 U.S. residents, by sex, race, and Hispanic origin, December 31, 2000-2010
Male FemaleYear Totala Whiteb Blackb Hispanic Totala Whiteb Blackb Hispanic2000 904 449 3,457 1,220 59 34 205 602001 896 462 3,535 1,177 58 36 199 612002 912 450 3,437 1,176 61 35 191 802003 915 465 3,405 1,231 62 38 185 842004 926 463 3,218 1,220 64 42 170 752005 929 471 3,145 1,244 65 45 156 762006 943 487 3,042 1,261 68 48 148 812007 955 481 3,138 1,259 69 50 150 792008 952 487 3,161 1,200 68 50 149 752009 949 487 3,119 1,193 67 50 142 742010c 943 459 3,074 1,258 67 47 133 77Note: Counts based on prisoners with a sentence of more than 1 year. Rates are per 100,000 U.S. residents as of January 1 in each reference population group. All estimates include persons under age 18. See Methodology for estimation method.aIncludes American Indians, Alaska Natives, Asians, Native Hawaiians, other Pacific Islanders, and persons identifying as two or more races.bexcludes persons of Hispanic or Latino origin.cData source used to estimate race and Hispanic origin changed in 2010. Use caution when comparing to prior years. See Methodology for estimation method.Sources: BJS, National Prisoner Statistics Program, Federal Justice Statistics Program, National Corrections Reporting Program, Survey of Inmates in State and Local Correctional Facilities, National Inmate Survey, and unpublished U.S. Census Bureau January 1 population estimates.
appendix Table 15Estimated number of sentenced prisoners under state and federal jurisdiction per 100,000 U.S. residents, by sex, race, Hispanic origin, and age, December 31, 2010
Male FemaleAge Totala Whiteb Blackb Hispanic Totala Whiteb Blackb Hispanic
Totalc 943 459 3,074 1,258 67 47 133 7718–19 462 149 1,555 563 20 11 40 3120–24 1,511 638 4,618 1,908 102 72 182 12225–29 2,098 980 6,349 2,707 168 125 299 20230–34 2,261 1,061 7,299 2,808 175 136 309 18935–39 2,014 995 6,600 2,486 158 124 289 15340–44 1,752 916 5,637 2,146 147 106 290 15645–49 1,489 788 4,751 1,901 115 81 238 11750–54 1,051 552 3,441 1,495 68 45 150 8855–59 650 347 2,239 1,031 34 22 76 5560–64 391 233 1,262 679 17 12 33 2965 or older 143 95 418 294 4 3 7 8Note: Data source used to estimate race and Hispanic origin changed in 2010 and data source for age distributions was enhanced between 2009 and 2010. Use caution when comparing to prior years. Counts based on prisoners with a sentence of more than 1 year. See Methodology for estimation method.aIncludes American Indians, Alaska Natives, Asians, Native Hawaiians, other Pacific Islanders, and persons identifying two or more races.bexcludes persons of Hispanic or Latino origin. cIncludes persons under age 18. Sources: BJS, National Prisoner Statistics Program, Federal Justice Statistics Program, National Corrections Reporting Program, Survey of Inmates in State and Local Correctional Facilities, National Inmate Survey, and unpublished U.S. Census Bureau January 1 population estimates.
Revised 2/9/12
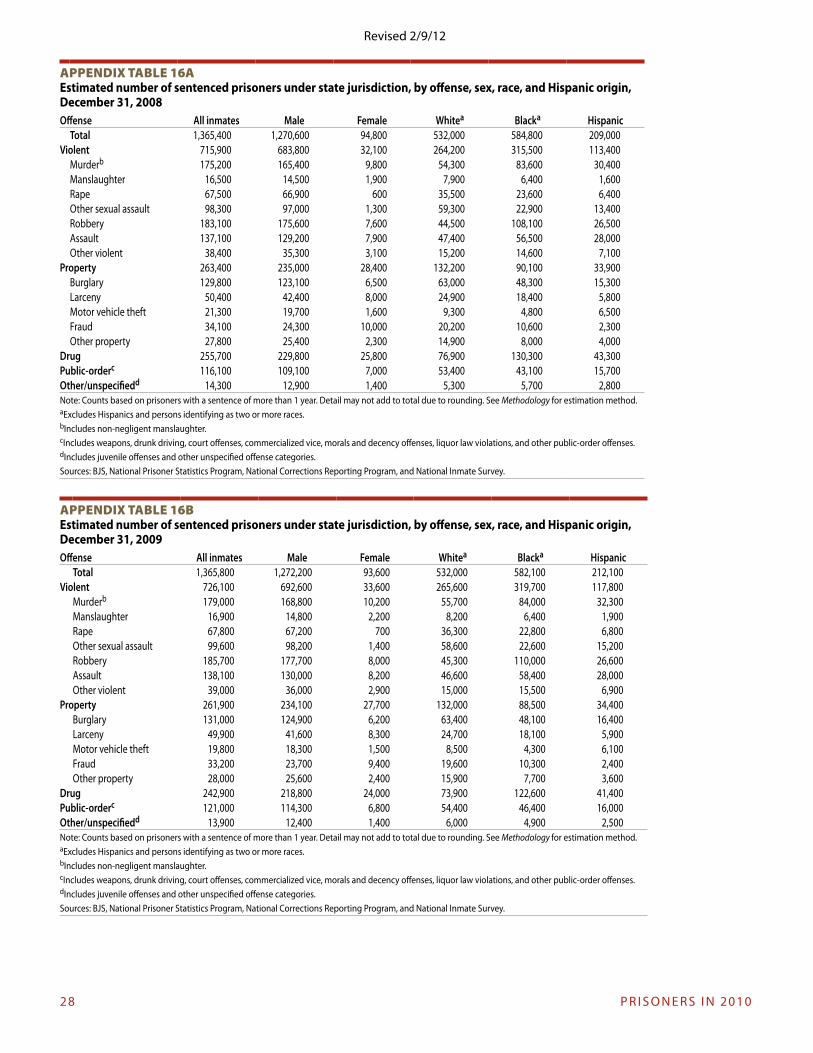
28 P R I S o N e R S I N 2010
appendix Table 16aEstimated number of sentenced prisoners under state jurisdiction, by offense, sex, race, and Hispanic origin, December 31, 2008Offense All inmates Male Female Whitea Blacka Hispanic
Total 1,365,400 1,270,600 94,800 532,000 584,800 209,000Violent 715,900 683,800 32,100 264,200 315,500 113,400
Murderb 175,200 165,400 9,800 54,300 83,600 30,400Manslaughter 16,500 14,500 1,900 7,900 6,400 1,600Rape 67,500 66,900 600 35,500 23,600 6,400other sexual assault 98,300 97,000 1,300 59,300 22,900 13,400Robbery 183,100 175,600 7,600 44,500 108,100 26,500Assault 137,100 129,200 7,900 47,400 56,500 28,000other violent 38,400 35,300 3,100 15,200 14,600 7,100
Property 263,400 235,000 28,400 132,200 90,100 33,900Burglary 129,800 123,100 6,500 63,000 48,300 15,300Larceny 50,400 42,400 8,000 24,900 18,400 5,800Motor vehicle theft 21,300 19,700 1,600 9,300 4,800 6,500Fraud 34,100 24,300 10,000 20,200 10,600 2,300other property 27,800 25,400 2,300 14,900 8,000 4,000
Drug 255,700 229,800 25,800 76,900 130,300 43,300Public-orderc 116,100 109,100 7,000 53,400 43,100 15,700Other/unspecifiedd 14,300 12,900 1,400 5,300 5,700 2,800Note: Counts based on prisoners with a sentence of more than 1 year. Detail may not add to total due to rounding. See Methodology for estimation method.aexcludes Hispanics and persons identifying as two or more races.bIncludes non-negligent manslaughter.cIncludes weapons, drunk driving, court offenses, commercialized vice, morals and decency offenses, liquor law violations, and other public-order offenses.dIncludes juvenile offenses and other unspecified offense categories.Sources: BJS, National Prisoner Statistics Program, National Corrections Reporting Program, and National Inmate Survey.
appendix Table 16bEstimated number of sentenced prisoners under state jurisdiction, by offense, sex, race, and Hispanic origin, December 31, 2009Offense All inmates Male Female Whitea Blacka Hispanic
Total 1,365,800 1,272,200 93,600 532,000 582,100 212,100Violent 726,100 692,600 33,600 265,600 319,700 117,800
Murderb 179,000 168,800 10,200 55,700 84,000 32,300Manslaughter 16,900 14,800 2,200 8,200 6,400 1,900Rape 67,800 67,200 700 36,300 22,800 6,800other sexual assault 99,600 98,200 1,400 58,600 22,600 15,200Robbery 185,700 177,700 8,000 45,300 110,000 26,600Assault 138,100 130,000 8,200 46,600 58,400 28,000other violent 39,000 36,000 2,900 15,000 15,500 6,900
Property 261,900 234,100 27,700 132,000 88,500 34,400Burglary 131,000 124,900 6,200 63,400 48,100 16,400Larceny 49,900 41,600 8,300 24,700 18,100 5,900Motor vehicle theft 19,800 18,300 1,500 8,500 4,300 6,100Fraud 33,200 23,700 9,400 19,600 10,300 2,400other property 28,000 25,600 2,400 15,900 7,700 3,600
Drug 242,900 218,800 24,000 73,900 122,600 41,400Public-orderc 121,000 114,300 6,800 54,400 46,400 16,000Other/unspecifiedd 13,900 12,400 1,400 6,000 4,900 2,500Note: Counts based on prisoners with a sentence of more than 1 year. Detail may not add to total due to rounding. See Methodology for estimation method.aexcludes Hispanics and persons identifying as two or more races.bIncludes non-negligent manslaughter.cIncludes weapons, drunk driving, court offenses, commercialized vice, morals and decency offenses, liquor law violations, and other public-order offenses.dIncludes juvenile offenses and other unspecified offense categories.Sources: BJS, National Prisoner Statistics Program, National Corrections Reporting Program, and National Inmate Survey.
Revised 2/9/12
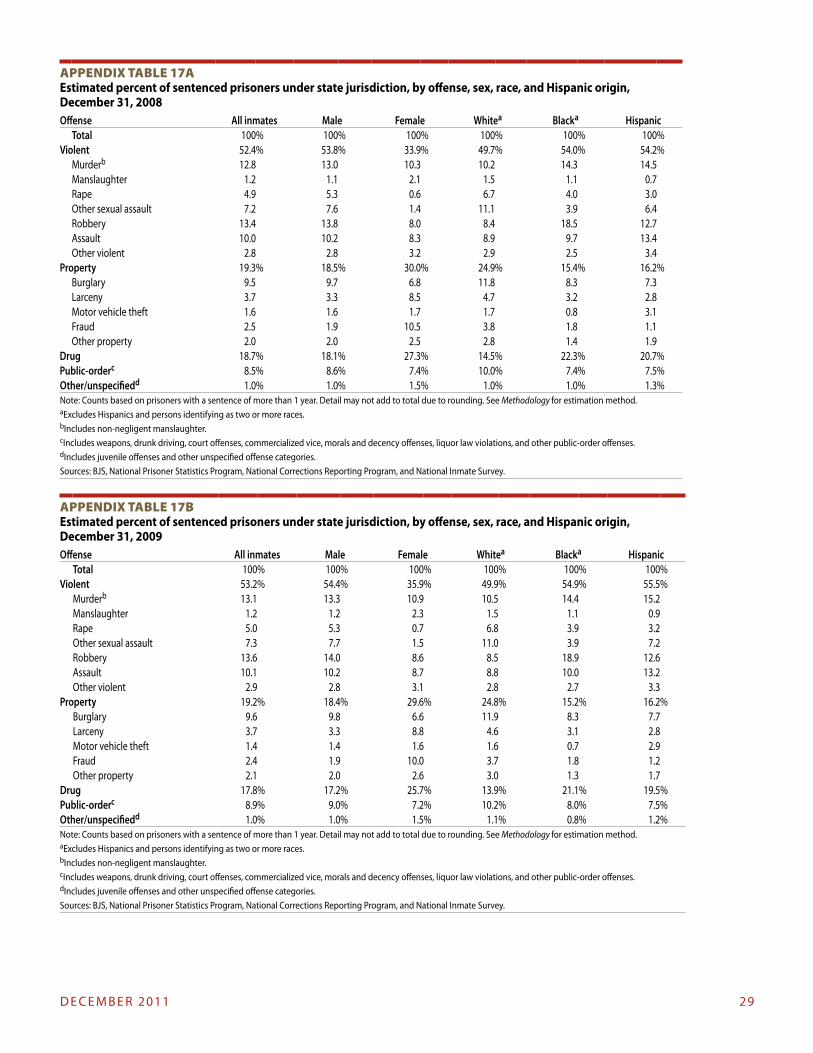
D e C e M B e R 2011 29
appendix Table 17aEstimated percent of sentenced prisoners under state jurisdiction, by offense, sex, race, and Hispanic origin, December 31, 2008Offense All inmates Male Female Whitea Blacka Hispanic
Total 100% 100% 100% 100% 100% 100%Violent 52.4% 53.8% 33.9% 49.7% 54.0% 54.2%
Murderb 12.8 13.0 10.3 10.2 14.3 14.5Manslaughter 1.2 1.1 2.1 1.5 1.1 0.7Rape 4.9 5.3 0.6 6.7 4.0 3.0other sexual assault 7.2 7.6 1.4 11.1 3.9 6.4Robbery 13.4 13.8 8.0 8.4 18.5 12.7Assault 10.0 10.2 8.3 8.9 9.7 13.4other violent 2.8 2.8 3.2 2.9 2.5 3.4
Property 19.3% 18.5% 30.0% 24.9% 15.4% 16.2%Burglary 9.5 9.7 6.8 11.8 8.3 7.3Larceny 3.7 3.3 8.5 4.7 3.2 2.8Motor vehicle theft 1.6 1.6 1.7 1.7 0.8 3.1Fraud 2.5 1.9 10.5 3.8 1.8 1.1other property 2.0 2.0 2.5 2.8 1.4 1.9
Drug 18.7% 18.1% 27.3% 14.5% 22.3% 20.7%Public-orderc 8.5% 8.6% 7.4% 10.0% 7.4% 7.5%Other/unspecifiedd 1.0% 1.0% 1.5% 1.0% 1.0% 1.3%Note: Counts based on prisoners with a sentence of more than 1 year. Detail may not add to total due to rounding. See Methodology for estimation method.aexcludes Hispanics and persons identifying as two or more races.bIncludes non-negligent manslaughter.cIncludes weapons, drunk driving, court offenses, commercialized vice, morals and decency offenses, liquor law violations, and other public-order offenses.dIncludes juvenile offenses and other unspecified offense categories.Sources: BJS, National Prisoner Statistics Program, National Corrections Reporting Program, and National Inmate Survey.
appendix Table 17bEstimated percent of sentenced prisoners under state jurisdiction, by offense, sex, race, and Hispanic origin, December 31, 2009Offense All inmates Male Female Whitea Blacka Hispanic
Total 100% 100% 100% 100% 100% 100%Violent 53.2% 54.4% 35.9% 49.9% 54.9% 55.5%
Murderb 13.1 13.3 10.9 10.5 14.4 15.2Manslaughter 1.2 1.2 2.3 1.5 1.1 0.9Rape 5.0 5.3 0.7 6.8 3.9 3.2other sexual assault 7.3 7.7 1.5 11.0 3.9 7.2Robbery 13.6 14.0 8.6 8.5 18.9 12.6Assault 10.1 10.2 8.7 8.8 10.0 13.2other violent 2.9 2.8 3.1 2.8 2.7 3.3
Property 19.2% 18.4% 29.6% 24.8% 15.2% 16.2%Burglary 9.6 9.8 6.6 11.9 8.3 7.7Larceny 3.7 3.3 8.8 4.6 3.1 2.8Motor vehicle theft 1.4 1.4 1.6 1.6 0.7 2.9Fraud 2.4 1.9 10.0 3.7 1.8 1.2other property 2.1 2.0 2.6 3.0 1.3 1.7
Drug 17.8% 17.2% 25.7% 13.9% 21.1% 19.5%Public-orderc 8.9% 9.0% 7.2% 10.2% 8.0% 7.5%Other/unspecifiedd 1.0% 1.0% 1.5% 1.1% 0.8% 1.2%Note: Counts based on prisoners with a sentence of more than 1 year. Detail may not add to total due to rounding. See Methodology for estimation method.aexcludes Hispanics and persons identifying as two or more races.bIncludes non-negligent manslaughter.cIncludes weapons, drunk driving, court offenses, commercialized vice, morals and decency offenses, liquor law violations, and other public-order offenses.dIncludes juvenile offenses and other unspecified offense categories.Sources: BJS, National Prisoner Statistics Program, National Corrections Reporting Program, and National Inmate Survey.
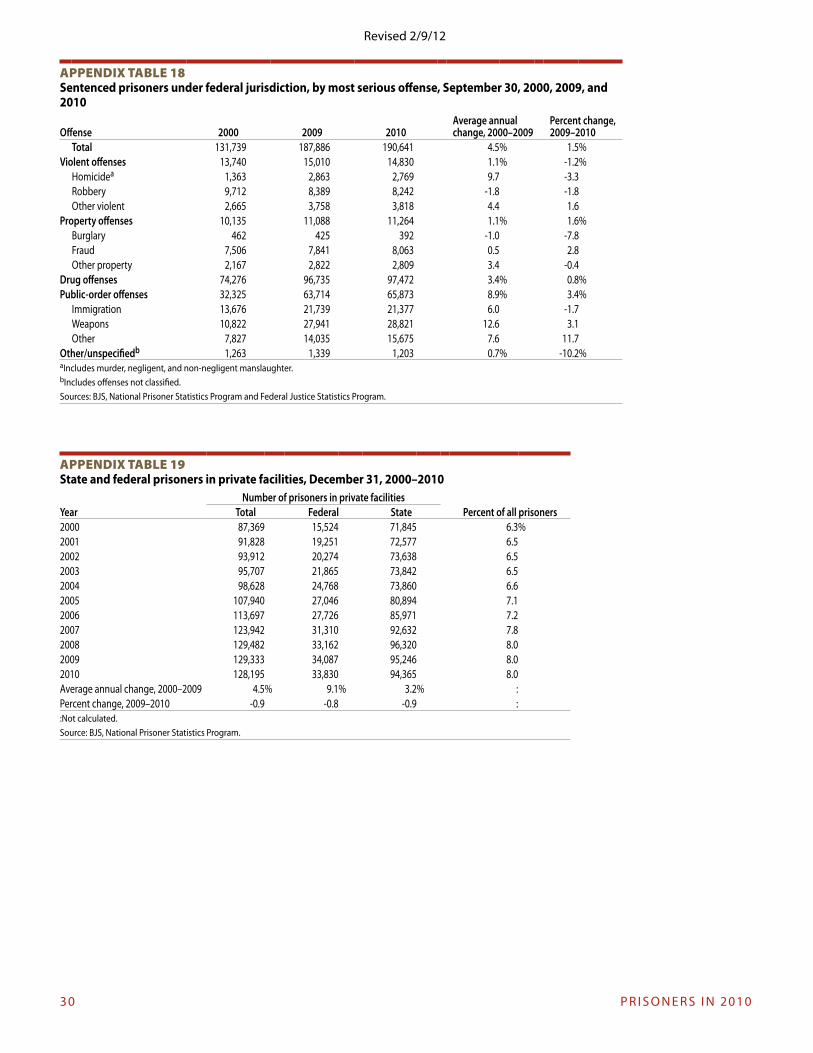
30 P R I S o N e R S I N 2010
appendix Table 18Sentenced prisoners under federal jurisdiction, by most serious offense, September 30, 2000, 2009, and 2010
Offense 2000 2009 2010Average annual change, 2000–2009
Percent change, 2009–2010
Total 131,739 187,886 190,641 4.5% 1.5%Violent offenses 13,740 15,010 14,830 1.1% -1.2%
Homicidea 1,363 2,863 2,769 9.7 -3.3Robbery 9,712 8,389 8,242 -1.8 -1.8other violent 2,665 3,758 3,818 4.4 1.6
Property offenses 10,135 11,088 11,264 1.1% 1.6%Burglary 462 425 392 -1.0 -7.8Fraud 7,506 7,841 8,063 0.5 2.8other property 2,167 2,822 2,809 3.4 -0.4
Drug offenses 74,276 96,735 97,472 3.4% 0.8%Public-order offenses 32,325 63,714 65,873 8.9% 3.4%
Immigration 13,676 21,739 21,377 6.0 -1.7Weapons 10,822 27,941 28,821 12.6 3.1other 7,827 14,035 15,675 7.6 11.7
Other/unspecifiedb 1,263 1,339 1,203 0.7% -10.2%aIncludes murder, negligent, and non-negligent manslaughter.bIncludes offenses not classified.Sources: BJS, National Prisoner Statistics Program and Federal Justice Statistics Program.
appendix Table 19State and federal prisoners in private facilities, December 31, 2000–2010
Number of prisoners in private facilitiesPercent of all prisonersYear Total Federal State
2000 87,369 15,524 71,845 6.3%2001 91,828 19,251 72,577 6.52002 93,912 20,274 73,638 6.52003 95,707 21,865 73,842 6.52004 98,628 24,768 73,860 6.62005 107,940 27,046 80,894 7.12006 113,697 27,726 85,971 7.22007 123,942 31,310 92,632 7.82008 129,482 33,162 96,320 8.02009 129,333 34,087 95,246 8.02010 128,195 33,830 94,365 8.0Average annual change, 2000–2009 4.5% 9.1% 3.2% :Percent change, 2009–2010 -0.9 -0.8 -0.9 ::Not calculated. Source: BJS, National Prisoner Statistics Program.
Revised 2/9/12
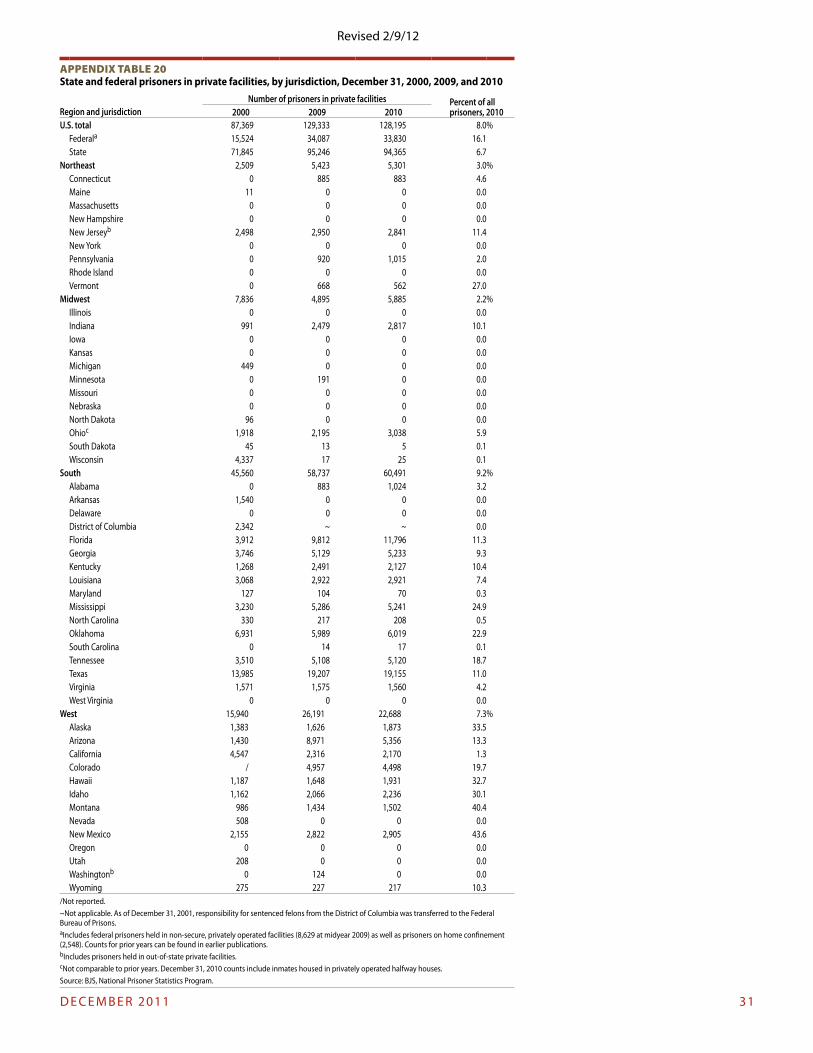
D e C e M B e R 2011 31
appendix Table 20State and federal prisoners in private facilities, by jurisdiction, December 31, 2000, 2009, and 2010
Number of prisoners in private facilities Percent of all prisoners, 2010Region and jurisdiction 2000 2009 2010
U.S. total 87,369 129,333 128,195 8.0%Federala 15,524 34,087 33,830 16.1State 71,845 95,246 94,365 6.7
Northeast 2,509 5,423 5,301 3.0%Connecticut 0 885 883 4.6Maine 11 0 0 0.0Massachusetts 0 0 0 0.0New Hampshire 0 0 0 0.0New Jerseyb 2,498 2,950 2,841 11.4New York 0 0 0 0.0Pennsylvania 0 920 1,015 2.0Rhode Island 0 0 0 0.0Vermont 0 668 562 27.0
Midwest 7,836 4,895 5,885 2.2%Illinois 0 0 0 0.0Indiana 991 2,479 2,817 10.1Iowa 0 0 0 0.0Kansas 0 0 0 0.0Michigan 449 0 0 0.0Minnesota 0 191 0 0.0Missouri 0 0 0 0.0Nebraska 0 0 0 0.0North Dakota 96 0 0 0.0ohioc 1,918 2,195 3,038 5.9South Dakota 45 13 5 0.1Wisconsin 4,337 17 25 0.1
South 45,560 58,737 60,491 9.2%Alabama 0 883 1,024 3.2Arkansas 1,540 0 0 0.0Delaware 0 0 0 0.0District of Columbia 2,342 ~ ~ 0.0Florida 3,912 9,812 11,796 11.3Georgia 3,746 5,129 5,233 9.3Kentucky 1,268 2,491 2,127 10.4Louisiana 3,068 2,922 2,921 7.4Maryland 127 104 70 0.3Mississippi 3,230 5,286 5,241 24.9North Carolina 330 217 208 0.5oklahoma 6,931 5,989 6,019 22.9South Carolina 0 14 17 0.1Tennessee 3,510 5,108 5,120 18.7Texas 13,985 19,207 19,155 11.0Virginia 1,571 1,575 1,560 4.2West Virginia 0 0 0 0.0
West 15,940 26,191 22,688 7.3%Alaska 1,383 1,626 1,873 33.5Arizona 1,430 8,971 5,356 13.3California 4,547 2,316 2,170 1.3Colorado / 4,957 4,498 19.7Hawaii 1,187 1,648 1,931 32.7Idaho 1,162 2,066 2,236 30.1Montana 986 1,434 1,502 40.4Nevada 508 0 0 0.0New Mexico 2,155 2,822 2,905 43.6oregon 0 0 0 0.0Utah 208 0 0 0.0Washingtonb 0 124 0 0.0Wyoming 275 227 217 10.3
/Not reported.~Not applicable. As of December 31, 2001, responsibility for sentenced felons from the District of Columbia was transferred to the Federal Bureau of Prisons.aIncludes federal prisoners held in non-secure, privately operated facilities (8,629 at midyear 2009) as well as prisoners on home confinement (2,548). Counts for prior years can be found in earlier publications.bIncludes prisoners held in out-of-state private facilities.cNot comparable to prior years. December 31, 2010 counts include inmates housed in privately operated halfway houses.Source: BJS, National Prisoner Statistics Program.
Revised 2/9/12
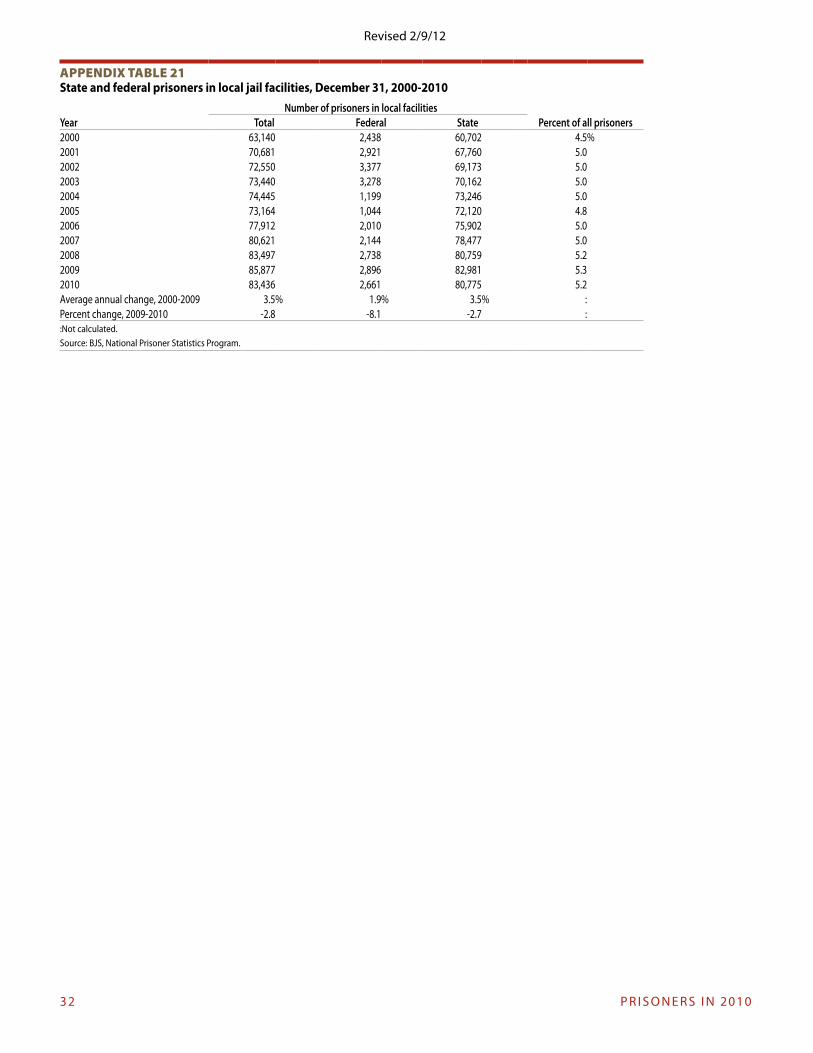
32 P R I S o N e R S I N 2010
appendix Table 21State and federal prisoners in local jail facilities, December 31, 2000-2010
Number of prisoners in local facilitiesPercent of all prisonersYear Total Federal State
2000 63,140 2,438 60,702 4.5%2001 70,681 2,921 67,760 5.02002 72,550 3,377 69,173 5.02003 73,440 3,278 70,162 5.02004 74,445 1,199 73,246 5.02005 73,164 1,044 72,120 4.82006 77,912 2,010 75,902 5.02007 80,621 2,144 78,477 5.02008 83,497 2,738 80,759 5.22009 85,877 2,896 82,981 5.32010 83,436 2,661 80,775 5.2Average annual change, 2000-2009 3.5% 1.9% 3.5% :Percent change, 2009-2010 -2.8 -8.1 -2.7 ::Not calculated.Source: BJS, National Prisoner Statistics Program.
Revised 2/9/12
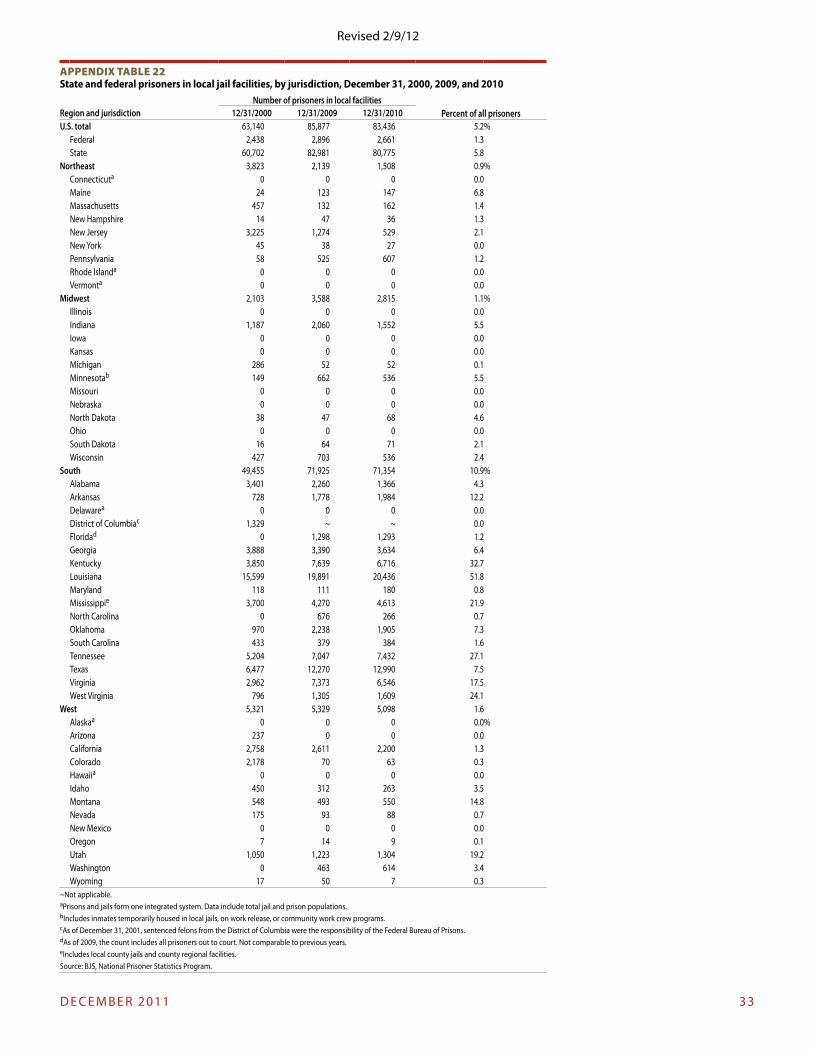
D e C e M B e R 2011 33
appendix Table 22State and federal prisoners in local jail facilities, by jurisdiction, December 31, 2000, 2009, and 2010
Region and jurisdictionNumber of prisoners in local facilities
Percent of all prisoners12/31/2000 12/31/2009 12/31/2010U.S. total 63,140 85,877 83,436 5.2%
Federal 2,438 2,896 2,661 1.3State 60,702 82,981 80,775 5.8
Northeast 3,823 2,139 1,508 0.9%Connecticuta 0 0 0 0.0Maine 24 123 147 6.8Massachusetts 457 132 162 1.4New Hampshire 14 47 36 1.3New Jersey 3,225 1,274 529 2.1New York 45 38 27 0.0Pennsylvania 58 525 607 1.2Rhode Islanda 0 0 0 0.0Vermonta 0 0 0 0.0
Midwest 2,103 3,588 2,815 1.1%Illinois 0 0 0 0.0Indiana 1,187 2,060 1,552 5.5Iowa 0 0 0 0.0Kansas 0 0 0 0.0Michigan 286 52 52 0.1Minnesotab 149 662 536 5.5Missouri 0 0 0 0.0Nebraska 0 0 0 0.0North Dakota 38 47 68 4.6ohio 0 0 0 0.0South Dakota 16 64 71 2.1Wisconsin 427 703 536 2.4
South 49,455 71,925 71,354 10.9%Alabama 3,401 2,260 1,366 4.3Arkansas 728 1,778 1,984 12.2Delawarea 0 0 0 0.0District of Columbiac 1,329 ~ ~ 0.0Floridad 0 1,298 1,293 1.2Georgia 3,888 3,390 3,634 6.4Kentucky 3,850 7,639 6,716 32.7Louisiana 15,599 19,891 20,436 51.8Maryland 118 111 180 0.8Mississippie 3,700 4,270 4,613 21.9North Carolina 0 676 266 0.7oklahoma 970 2,238 1,905 7.3South Carolina 433 379 384 1.6Tennessee 5,204 7,047 7,432 27.1Texas 6,477 12,270 12,990 7.5Virginia 2,962 7,373 6,546 17.5West Virginia 796 1,305 1,609 24.1
West 5,321 5,329 5,098 1.6Alaskaa 0 0 0 0.0%Arizona 237 0 0 0.0California 2,758 2,611 2,200 1.3Colorado 2,178 70 63 0.3Hawaiia 0 0 0 0.0Idaho 450 312 263 3.5Montana 548 493 550 14.8Nevada 175 93 88 0.7New Mexico 0 0 0 0.0oregon 7 14 9 0.1Utah 1,050 1,223 1,304 19.2Washington 0 463 614 3.4Wyoming 17 50 7 0.3
~Not applicable.aPrisons and jails form one integrated system. Data include total jail and prison populations.bIncludes inmates temporarily housed in local jails, on work release, or community work crew programs.cAs of December 31, 2001, sentenced felons from the District of Columbia were the responsibility of the Federal Bureau of Prisons. dAs of 2009, the count includes all prisoners out to court. Not comparable to previous years. eIncludes local county jails and county regional facilities.Source: BJS, National Prisoner Statistics Program.
Revised 2/9/12
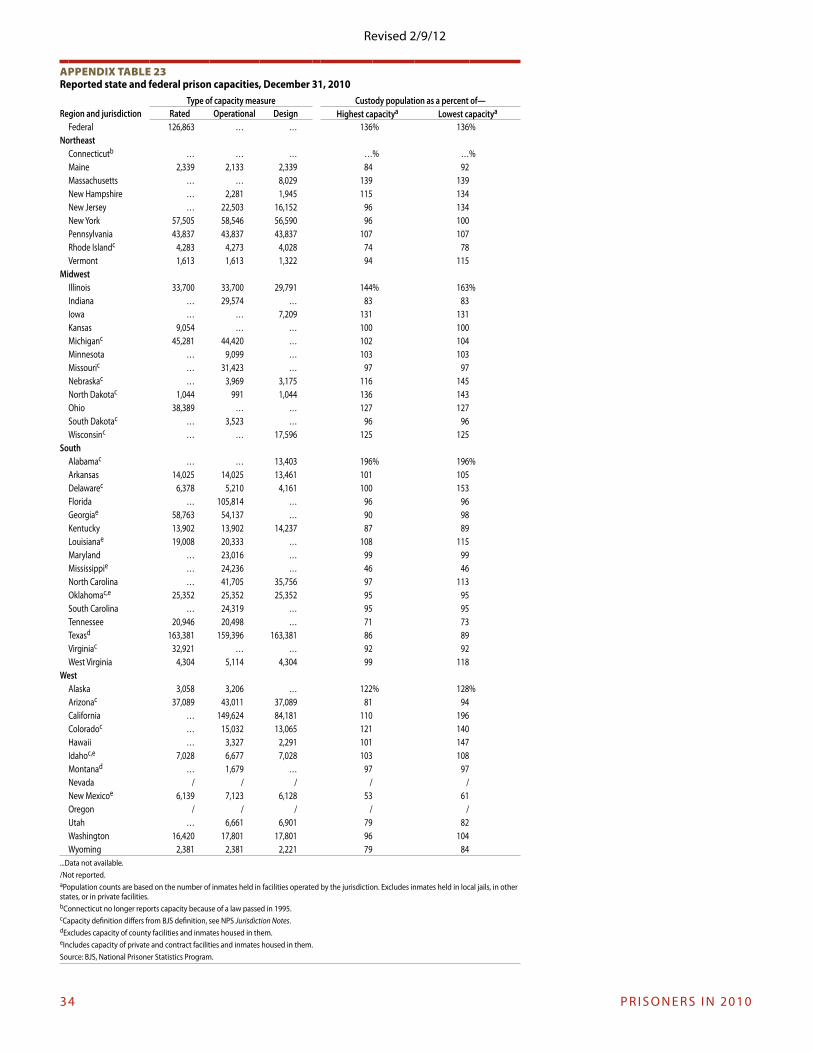
34 P R I S o N e R S I N 2010
appendix Table 23Reported state and federal prison capacities, December 31, 2010
Region and jurisdictionType of capacity measure Custody population as a percent of—
Rated Operational Design Highest capacitya Lowest capacitya
Federal 126,863 … … 136% 136%Northeast
Connecticutb … … … …% …%Maine 2,339 2,133 2,339 84 92Massachusetts … … 8,029 139 139New Hampshire … 2,281 1,945 115 134New Jersey … 22,503 16,152 96 134New York 57,505 58,546 56,590 96 100Pennsylvania 43,837 43,837 43,837 107 107Rhode Islandc 4,283 4,273 4,028 74 78Vermont 1,613 1,613 1,322 94 115
MidwestIllinois 33,700 33,700 29,791 144% 163%Indiana … 29,574 … 83 83Iowa … … 7,209 131 131Kansas 9,054 … … 100 100Michiganc 45,281 44,420 … 102 104Minnesota … 9,099 … 103 103Missouric … 31,423 … 97 97Nebraskac … 3,969 3,175 116 145North Dakotac 1,044 991 1,044 136 143ohio 38,389 … … 127 127South Dakotac … 3,523 … 96 96Wisconsinc … … 17,596 125 125
SouthAlabamac … … 13,403 196% 196%Arkansas 14,025 14,025 13,461 101 105Delawarec 6,378 5,210 4,161 100 153Florida … 105,814 … 96 96Georgiae 58,763 54,137 … 90 98Kentucky 13,902 13,902 14,237 87 89Louisianae 19,008 20,333 … 108 115Maryland … 23,016 … 99 99Mississippie … 24,236 … 46 46North Carolina … 41,705 35,756 97 113oklahomac,e 25,352 25,352 25,352 95 95South Carolina … 24,319 … 95 95Tennessee 20,946 20,498 … 71 73Texasd 163,381 159,396 163,381 86 89Virginiac 32,921 … … 92 92West Virginia 4,304 5,114 4,304 99 118
WestAlaska 3,058 3,206 … 122% 128%Arizonac 37,089 43,011 37,089 81 94California … 149,624 84,181 110 196Coloradoc … 15,032 13,065 121 140Hawaii … 3,327 2,291 101 147Idahoc,e 7,028 6,677 7,028 103 108Montanad … 1,679 … 97 97Nevada / / / / /New Mexicoe 6,139 7,123 6,128 53 61oregon / / / / /Utah … 6,661 6,901 79 82Washington 16,420 17,801 17,801 96 104Wyoming 2,381 2,381 2,221 79 84
...Data not available. /Not reported.aPopulation counts are based on the number of inmates held in facilities operated by the jurisdiction. excludes inmates held in local jails, in other states, or in private facilities.bConnecticut no longer reports capacity because of a law passed in 1995.cCapacity definition differs from BJS definition, see NPS Jurisdiction Notes.dexcludes capacity of county facilities and inmates housed in them.eIncludes capacity of private and contract facilities and inmates housed in them.Source: BJS, National Prisoner Statistics Program.
Revised 2/9/12
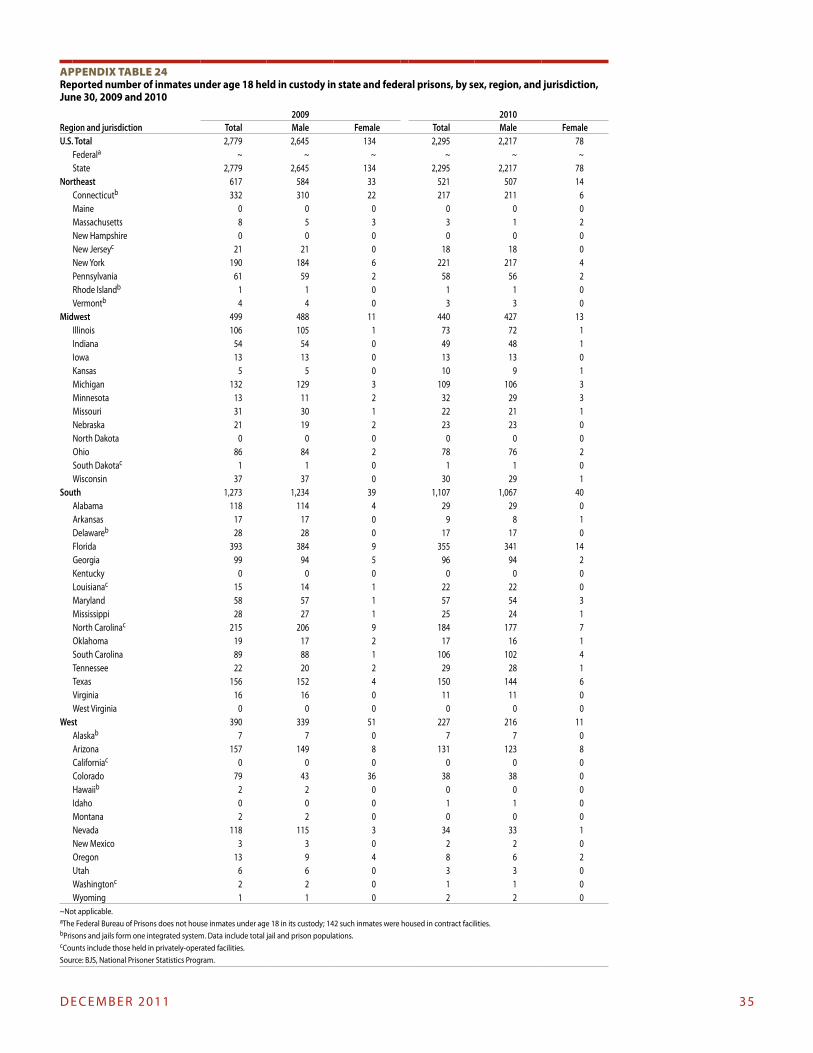
D e C e M B e R 2011 35
appendix Table 24Reported number of inmates under age 18 held in custody in state and federal prisons, by sex, region, and jurisdiction, June 30, 2009 and 2010
2009 2010Region and jurisdiction Total Male Female Total Male FemaleU.S. Total 2,779 2,645 134 2,295 2,217 78
Federala ~ ~ ~ ~ ~ ~State 2,779 2,645 134 2,295 2,217 78
Northeast 617 584 33 521 507 14Connecticutb 332 310 22 217 211 6Maine 0 0 0 0 0 0Massachusetts 8 5 3 3 1 2New Hampshire 0 0 0 0 0 0New Jerseyc 21 21 0 18 18 0New York 190 184 6 221 217 4Pennsylvania 61 59 2 58 56 2Rhode Islandb 1 1 0 1 1 0Vermontb 4 4 0 3 3 0
Midwest 499 488 11 440 427 13Illinois 106 105 1 73 72 1Indiana 54 54 0 49 48 1Iowa 13 13 0 13 13 0Kansas 5 5 0 10 9 1Michigan 132 129 3 109 106 3Minnesota 13 11 2 32 29 3Missouri 31 30 1 22 21 1Nebraska 21 19 2 23 23 0North Dakota 0 0 0 0 0 0ohio 86 84 2 78 76 2South Dakotac 1 1 0 1 1 0Wisconsin 37 37 0 30 29 1
South 1,273 1,234 39 1,107 1,067 40Alabama 118 114 4 29 29 0Arkansas 17 17 0 9 8 1Delawareb 28 28 0 17 17 0Florida 393 384 9 355 341 14Georgia 99 94 5 96 94 2Kentucky 0 0 0 0 0 0Louisianac 15 14 1 22 22 0Maryland 58 57 1 57 54 3Mississippi 28 27 1 25 24 1North Carolinac 215 206 9 184 177 7oklahoma 19 17 2 17 16 1South Carolina 89 88 1 106 102 4Tennessee 22 20 2 29 28 1Texas 156 152 4 150 144 6Virginia 16 16 0 11 11 0West Virginia 0 0 0 0 0 0
West 390 339 51 227 216 11Alaskab 7 7 0 7 7 0Arizona 157 149 8 131 123 8Californiac 0 0 0 0 0 0Colorado 79 43 36 38 38 0Hawaiib 2 2 0 0 0 0Idaho 0 0 0 1 1 0Montana 2 2 0 0 0 0Nevada 118 115 3 34 33 1New Mexico 3 3 0 2 2 0oregon 13 9 4 8 6 2Utah 6 6 0 3 3 0Washingtonc 2 2 0 1 1 0Wyoming 1 1 0 2 2 0
~Not applicable. aThe Federal Bureau of Prisons does not house inmates under age 18 in its custody; 142 such inmates were housed in contract facilities. bPrisons and jails form one integrated system. Data include total jail and prison populations.cCounts include those held in privately-operated facilities.Source: BJS, National Prisoner Statistics Program.
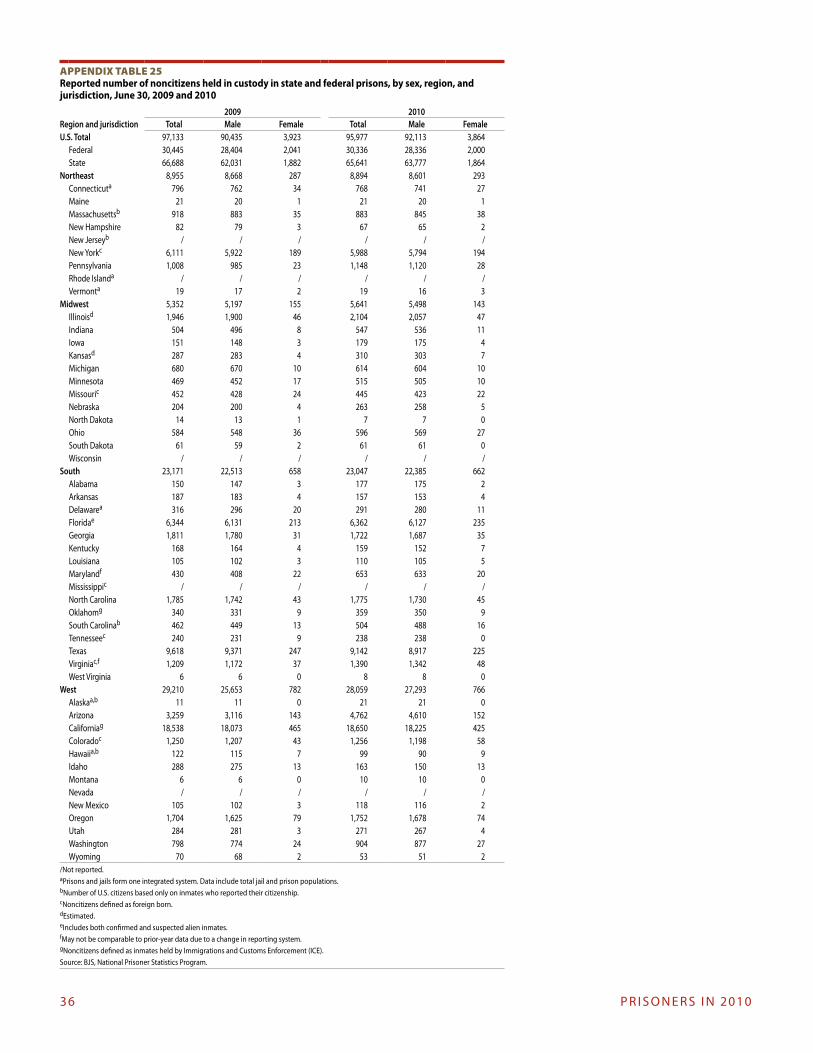
36 P R I S o N e R S I N 2010
appendix Table 25Reported number of noncitizens held in custody in state and federal prisons, by sex, region, and jurisdiction, June 30, 2009 and 2010
Region and jurisdiction2009 2010
Total Male Female Total Male FemaleU.S. Total 97,133 90,435 3,923 95,977 92,113 3,864
Federal 30,445 28,404 2,041 30,336 28,336 2,000State 66,688 62,031 1,882 65,641 63,777 1,864
Northeast 8,955 8,668 287 8,894 8,601 293Connecticuta 796 762 34 768 741 27Maine 21 20 1 21 20 1Massachusettsb 918 883 35 883 845 38New Hampshire 82 79 3 67 65 2New Jerseyb / / / / / /New Yorkc 6,111 5,922 189 5,988 5,794 194Pennsylvania 1,008 985 23 1,148 1,120 28Rhode Islanda / / / / / /Vermonta 19 17 2 19 16 3
Midwest 5,352 5,197 155 5,641 5,498 143Illinoisd 1,946 1,900 46 2,104 2,057 47Indiana 504 496 8 547 536 11Iowa 151 148 3 179 175 4Kansasd 287 283 4 310 303 7Michigan 680 670 10 614 604 10Minnesota 469 452 17 515 505 10Missouric 452 428 24 445 423 22Nebraska 204 200 4 263 258 5North Dakota 14 13 1 7 7 0ohio 584 548 36 596 569 27South Dakota 61 59 2 61 61 0Wisconsin / / / / / /
South 23,171 22,513 658 23,047 22,385 662Alabama 150 147 3 177 175 2Arkansas 187 183 4 157 153 4Delawarea 316 296 20 291 280 11Floridae 6,344 6,131 213 6,362 6,127 235Georgia 1,811 1,780 31 1,722 1,687 35Kentucky 168 164 4 159 152 7Louisiana 105 102 3 110 105 5Marylandf 430 408 22 653 633 20Mississippic / / / / / /North Carolina 1,785 1,742 43 1,775 1,730 45oklahomg 340 331 9 359 350 9South Carolinab 462 449 13 504 488 16Tennesseec 240 231 9 238 238 0Texas 9,618 9,371 247 9,142 8,917 225Virginiac,f 1,209 1,172 37 1,390 1,342 48West Virginia 6 6 0 8 8 0
West 29,210 25,653 782 28,059 27,293 766Alaskaa,b 11 11 0 21 21 0Arizona 3,259 3,116 143 4,762 4,610 152Californiag 18,538 18,073 465 18,650 18,225 425Coloradoc 1,250 1,207 43 1,256 1,198 58Hawaiia,b 122 115 7 99 90 9Idaho 288 275 13 163 150 13Montana 6 6 0 10 10 0Nevada / / / / / /New Mexico 105 102 3 118 116 2oregon 1,704 1,625 79 1,752 1,678 74Utah 284 281 3 271 267 4Washington 798 774 24 904 877 27Wyoming 70 68 2 53 51 2
/Not reported.aPrisons and jails form one integrated system. Data include total jail and prison populations.bNumber of U.S. citizens based only on inmates who reported their citizenship. cNoncitizens defined as foreign born.destimated. eIncludes both confirmed and suspected alien inmates. fMay not be comparable to prior-year data due to a change in reporting system. gNoncitizens defined as inmates held by Immigrations and Customs enforcement (ICe). Source: BJS, National Prisoner Statistics Program.

D e C e M B e R 2011 37
Office of Justice Programs • Innovation • Partnerships • Safer Neighborhoods • http://www.ojp.gov
U.S. Department of Justice Office of Justice Programs Bureau of Justice Statistics
Washington, DC 20531
Official Business Penalty for Private Use $300
PRESORTED STANDARDPOSTAGE & FEES PAID
DOJ/BJSPermit No. G-91
NCJ236096
The Bureau of Justice Statistics is the statistical agency of the U.S. Department of Justice. James P. Lynch is the director.
This report was written by Paul Guerino, Paige M. Harrison, and William J. Sabol. E. Ann Carson provided statistical review. Sheri Simmons and Tracy L. Snell provided verification of the report.
Catherine Bird edited the report, Barbara Quinn produced the report, and Jayne Robinson prepared the report for final printing under the supervision of Doris J. James.
December 2011, NCJ 236096
The full text of each report is available in PDF and ASCII formats on the BJS website at www.bjs.gov. Tables are also available in PDF and CSV formats. Related datasets are made available on the National Archive of Criminal Justice Data website at http://www.icpsr.umich.edu/icpsrweb/NACJD/index.jsp.