Prison and Jail Deaths in Custody, 2000-2009 - Statistical Tables · 2011-12-14 · 2 Prison and...
34
U.S. Department of Justice Office of Justice Programs Bureau of Justice Statistics Bureau of Justice Statistics · Statistical Tables BJS December 2011, NCJ 236219 T his report provides an update to annual tables based on the Bureau of Justice Statistics’ (BJS) Deaths in Custody Reporting Program (DCRP), a data collection that measures inmate mortality data in state prisons and local jails by the number and causes of deaths. In 2008, 960 inmates died in U.S. jails (a mortality rate of 123 deaths per 100,000 jail inmates). In 2009, 948 inmates died in U.S. jails (a rate of 127 deaths per 100,000 jail inmates). State prison facilities reported 3,452 inmate deaths in 2008 (a rate of 260 deaths per 100,000 prison inmates) and 3,408 inmate deaths in 2009 (257 deaths per 100,000 prison inmates). Consistent with data from previous years, local jail deaths constituted approximately 25% of inmate deaths in adult correctional facilities nationwide. e number of inmate deaths in jails increased each year between 2000 and 2007 (from 904 to 1,102 inmate deaths), increasing 22% during this period. In 2008, the number of deaths in jails declined 13% to 960 inmate deaths, and decreased an additional 1% in 2009 to 948 deaths (figure 1). e decline in 2008 was the first decline in jail mortality data since BJS began collecting data annually for the DCRP in 2000. From 2007 to 2008, 918 jails reported a change in the number of deaths to the DCRP. Among these jails, 324 reported a total increase of 452 deaths and 402 jails reported a total decrease of 594 deaths, for a net decrease of 142 deaths in 2008. e majority of jails reporting a decline (74%) registered one less death in 2008 than in 2007. Nine jails reported a total decrease of 69 deaths (12% of the total decline). All nine of these jails held at least 2,500 inmates on an average day in 2007 and 2008. In general, the number of deaths in state prisons rose each year between 2001 and 2008 (from 2,877 to 3,452 inmate deaths), a 20% increase (figure 2). In 2009, the number of deaths in prisons dropped to 3,408, a 1% decrease. Statistical tables in this report detail prison and jail deaths in custody. e tables present mortality data by cause of death, selected decedent characteristics, and state. Prison and Jail Deaths in Custody, 2000-2009 - Statistical Tables by Margaret E. Noonan and E. Ann Carson, BJS Statisticians Number of deaths Rate per 100,000 inmates 0 1,000 2,000 3,000 4,000 Number 2009 2008 2007 2006 2005 2004 2003 2002 2001 0 75 150 225 300 Mortality rate FIGURE 2 Prison inmate deaths in custody, 2001–2009 FIGURE 1 Jail inmate deaths in custody, 2000–2009 Number of deaths Rate per 100,000 inmates 0 200 400 600 800 1,000 1,200 Number 2009 2008 2007 2006 2005 2004 2003 2002 2001 2000 0 40 80 120 160 Mortality rate
Transcript of Prison and Jail Deaths in Custody, 2000-2009 - Statistical Tables · 2011-12-14 · 2 Prison and...

U.S. Department of JusticeOffi ce of Justice ProgramsBureau of Justice Statistics
Bureau of Justice Statistics·Statistical Tables
BJS
December 2011, NCJ 236219
This report provides an update to annual tables based on the Bureau of Justice Statistics’ (BJS) Deaths in Custody Reporting Program
(DCRP), a data collection that measures inmate mortality data in state prisons and local jails by the number and causes of deaths. In 2008, 960 inmates died in U.S. jails (a mortality rate of 123 deaths per 100,000 jail inmates). In 2009, 948 inmates died in U.S. jails (a rate of 127 deaths per 100,000 jail inmates). State prison facilities reported 3,452 inmate deaths in 2008 (a rate of 260 deaths per 100,000 prison inmates) and 3,408 inmate deaths in 2009 (257 deaths per 100,000 prison inmates). Consistent with data from previous years, local jail deaths constituted approximately 25% of inmate deaths in adult correctional facilities nationwide.
� e number of inmate deaths in jails increased each year between 2000 and 2007 (from 904 to 1,102 inmate deaths), increasing 22% during this period. In 2008, the number of deaths in jails declined 13% to 960 inmate deaths, and decreased an additional 1% in 2009 to 948 deaths (� gure 1). � e decline in 2008 was
the � rst decline in jail mortality data since BJS began collecting data annually for the DCRP in 2000.
From 2007 to 2008, 918 jails reported a change in the number of deaths to the DCRP. Among these jails, 324 reported a total increase of 452 deaths and 402 jails reported a total decrease of 594 deaths, for a net decrease of 142 deaths in 2008. � e majority of jails reporting a decline (74%) registered one less death in 2008 than in 2007. Nine jails reported a total decrease of 69 deaths (12% of the total decline). All nine of these jails held at least 2,500 inmates on an average day in 2007 and 2008.
In general, the number of deaths in state prisons rose each year between 2001 and 2008 (from 2,877 to 3,452 inmate deaths), a 20% increase (� gure 2). In 2009, the number of deaths in prisons dropped to 3,408, a 1% decrease.
Statistical tables in this report detail prison and jail deaths in custody. � e tables present mortality data by cause of death, selected decedent characteristics, and state.
Prison and Jail Deaths in Custody, 2000-2009 - Statistical Tablesby Margaret E. Noonan and E. Ann Carson, BJS Statisticians
Number of deaths Rate per 100,000 inmates
0
1,000
2,000
3,000
4,000Number
2009200820072006200520042003200220010
75
150
225
300Mortality rate
FIGURE 2 Prison inmate deaths in custody, 2001–2009
FIGURE 1 Jail inmate deaths in custody, 2000–2009Number of deaths Rate per 100,000 inmates
0
200
400
600
800
1,000
1,200
Number
20092008200720062005200420032002200120000
40
80
120
160Mortality rate

2 Prison and Jail Deaths in Custody, 2000-2009 - Statistical Tables
SuMMArY FiNDiNgS: JAilSCause of death�� After increasing an average of 3% annually between 2000
and 2007, the number of inmate deaths in jails declined 13% in 2008. In 2009, the number of jail deaths remained relatively stable (down 1% from 2008) (table 1).
�� Among the causes of inmate deaths in jails, AIDS-related deaths had the largest decline, decreasing by more than half (54%) between 2000 and 2009.
�� Between 2000 and 2009, suicide (29%) and heart disease (22%) were the leading causes of deaths in jails, accounting for over half (51%) of all deaths in jails (table 2).
�� Death by drug or alcohol intoxication (7%) was the third leading single cause of death in jails between 2000 and 2009. No other single cause of death accounted for more than 5% of jail deaths during this period.
�� Suicide rates in jails dropped every year between 2001 and 2007 (from 49 to 36 deaths per 100,000), before increasing in 2009 (41 deaths per 100,000) (table 3).
�� The jail mortality rate declined 13% between 2007 and 2008 (from 141 to 123 deaths per 100,000 jail inmates). The mortality rate increased in 2009 (127 deaths per 100,000), but this rate was still lower than the rate in 2007.
Decedent characteristics�� Males constituted 88% of the jail population and 88% of
jail deaths over the 10-year period. Females (132 deaths per 100,000) and males (141 deaths per 100,000) died at nearly equal rates between 2000 and 2009 (table 4).
�� Whites (43% of the jail population) had a mortality rate in jails between 1.6 and 4.7 times that of any other race or ethnic group.
�� American Indians and Alaska Natives accounted for about 2% of jail deaths, and Asians, Hawaiians, or other Pacific Islanders accounted for less than 1% of deaths in jails between 2000 and 2009 (table 5).
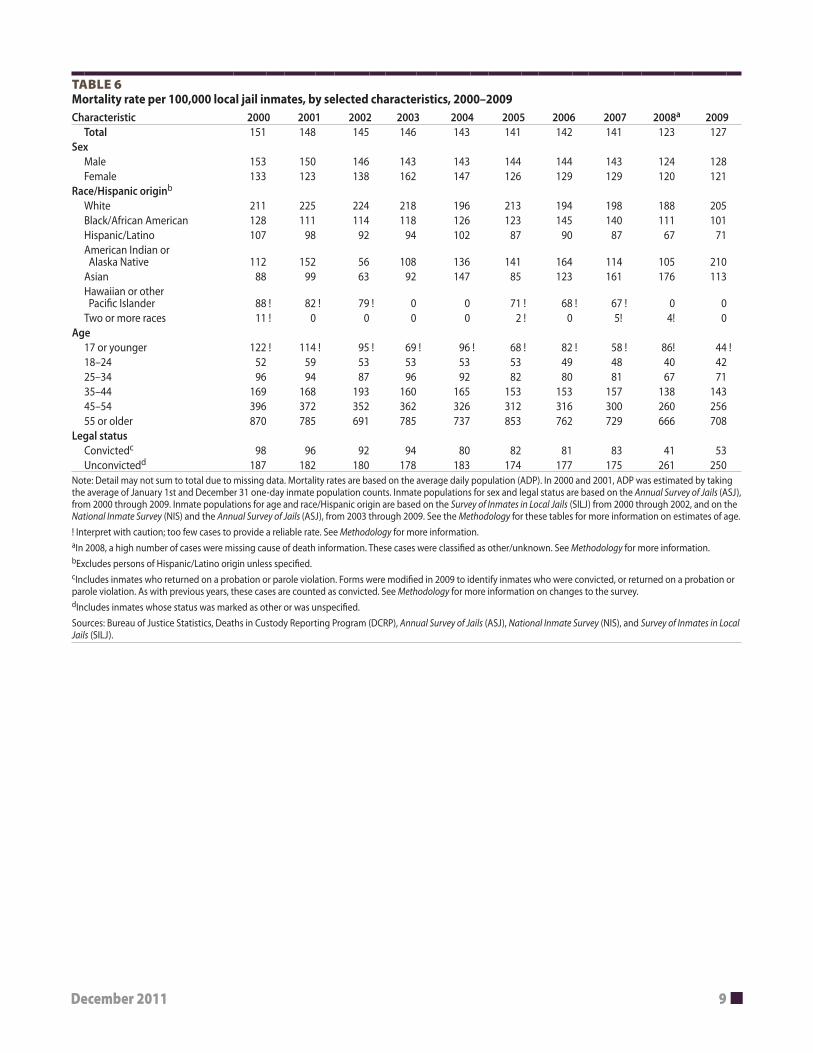
�� Between 2000 and 2009, jail inmates age 55 or older were between 5 and 7 times more likely to die than inmates age 54 or younger. During this period, the annual mortality rate for jail inmates age 55 or older ranged from 666 to 870 deaths per 100,000 (table 6).
State-level jail populations�� California, Texas, New York, and Florida reported 35%
of all jail deaths. These states also had the largest jail populations and averaged 32% of the total jail average daily population reported to the DCRP between 2000 and 2009 (table 7).
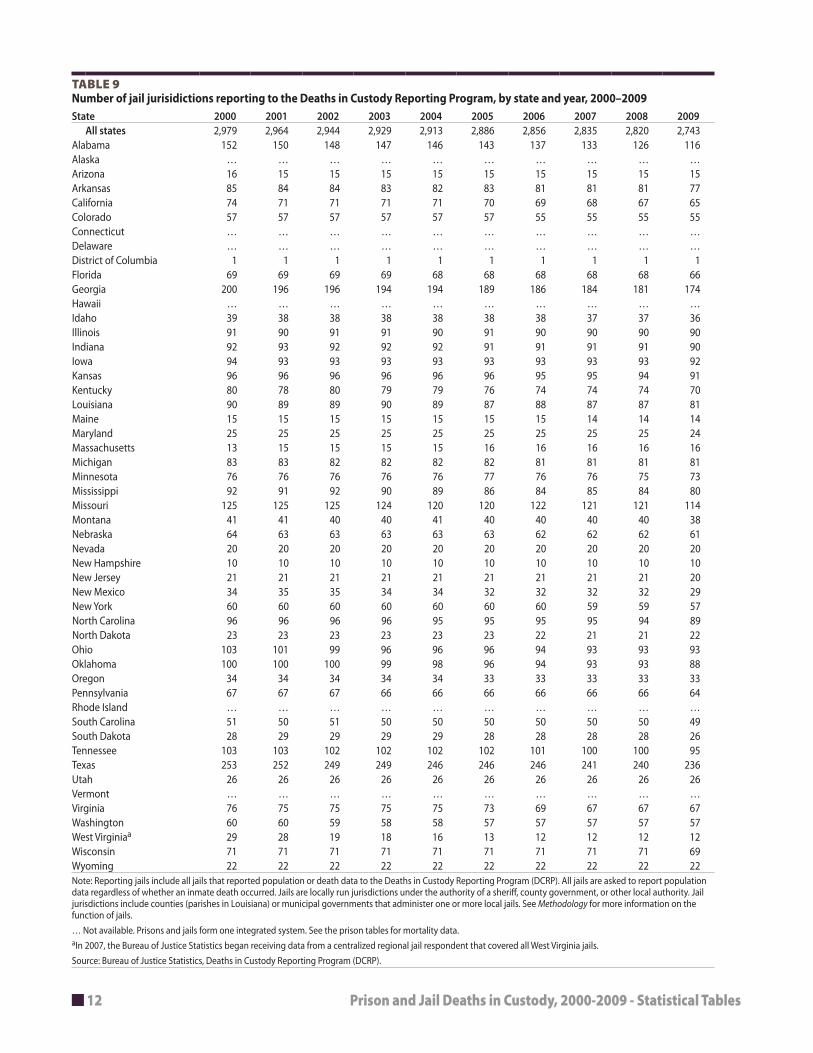
�� Between 2000 and 2009, nearly all (from 97% to 99%) of the approximately 2,800 jail jurisdictions in the U.S. submitted population and mortality data to the DCRP. These jurisdictions reported a total of 10,005 deaths over the ten-year period (table 9).
Cause of death by decedent characteristics�� Males accounted for 98% of homicides in jails between
2000 and 2009 (table 11).
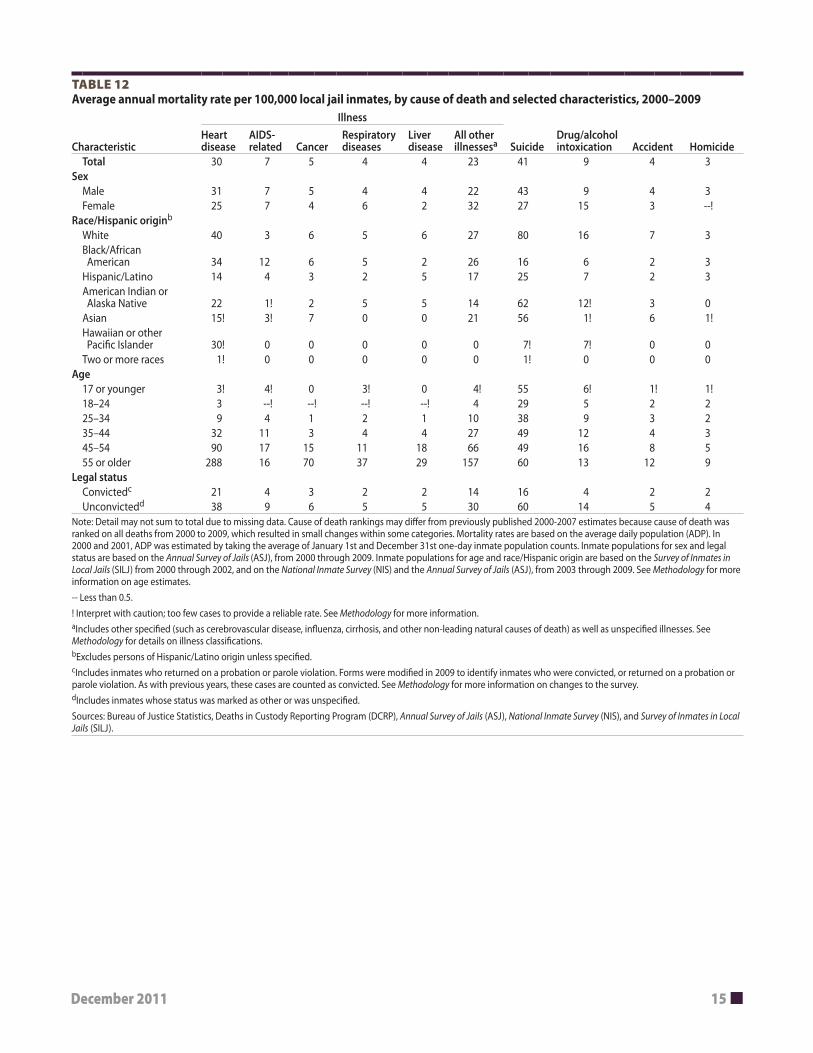
�� Between 2000 and 2009, males committed suicide (43 deaths per 100,000) at a higher rate than females (27 deaths per 100,000) in jails. Over this period, males were 1.6 times more likely to die by suicide than females, and females were 1.7 times more likely to die by intoxication than males (table 12).
�� Between 2000 and 2009, whites had the highest suicide rate in jail (80 deaths per 100,000). Hispanics/Latinos (25 deaths per 100,000) were 3 times less likely to commit suicide than whites in jails and 1.6 times more likely to commit suicide in jails than blacks/African Americans (16 deaths per 100,000).
�� White, black/African American, and Hispanic/Latino inmates had equal homicide rates in jails (3 deaths per 100,000).
�� In jails, the oldest inmates (age 55 or older) and the youngest inmates (age 17 or younger) had the highest suicide mortality rates (60 and 55 deaths per 100,000, respectively). Jail inmates age 55 or older were 3 times more likely than younger inmates to die of an accident.

December 2011 3
SuMMArY FiNDiNgS: PriSoNSCause of Death�� In general, the number of deaths in prisons increased
each year between 2001 and 2008, increasing 20% during this period. Between 2008 and 2009, both the number of deaths and mortality rates remained relatively stable, declining 1% each (table 13).
�� Among the causes of inmate deaths in prisons, AIDS-related deaths had the largest decline (down 65%) between 2001 and 2009.
�� Between 2001 and 2009, illness-related deaths accounted for 9 out of 10 prison deaths (table 14).
�� Heart disease (26%) and cancer (23%) were the leading single causes of illness-related deaths in prisons, together accounting for nearly half (49%) of all prison deaths between 2001 and 2009.
�� Liver disease was the third leading single cause of death in prisons, accounting for 7% of all deaths.
�� Deaths due to intoxication, homicide, or accident were the least common causes of deaths, with none accounting for more than 2% of deaths in prisons.
Decedent characteristics�� On average, males constituted 96% of the prison
population over the 9-year period and 93% of all prison deaths (table 17).
�� Prison inmates age 55 or older accounted for 41% of prison deaths but comprised 5% of the total prison population for the 9-year period.
�� Whites made up 37% of the prison population and 50% of deaths in prisons between 2001 and 2009. White mortality rates were between 1.4 and 1.8 times higher than other race or ethnic groups during the 9-year period.
�� Between 2001 and 2009, males in prisons died at rate of 260 deaths per 100,000, while females died at a rate of 153 deaths per 100,000 (table 19).
�� During the 9-year period of prison data collection, the annual mortality rates for inmates age 55 or older ranged between 2,007 and 2,500 deaths per 100,000.
State-level prison populations�� All 50 (100%) state departments of corrections
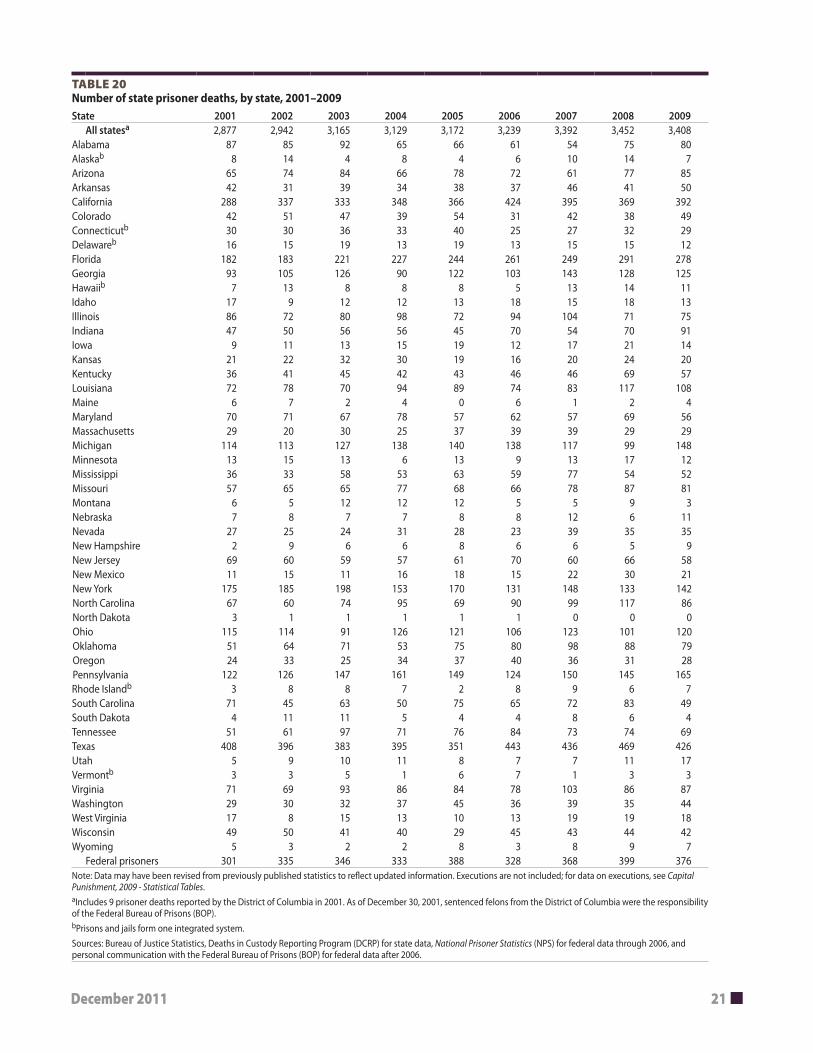
participated in the DCRP between 2001 and 2009 (table 20).
�� California, Texas, Florida, and New York had the four largest correctional populations in the United States. They averaged 37% of the total prison population and reported 37% of deaths to the DCRP between 2001 and 2009.
Cause of death by decedent characteristics�� Males accounted for more than 99% of prison homicides
between 2001 and 2009 (table 23).
�� With the exception of deaths due to drug or alcohol intoxication, American Indians, Alaska Natives, Asians, Hawaiians, or other Pacific Islanders each accounted for less than 1% of all deaths in prisons between 2001 and 2009.
�� American Indians and Alaska Natives accounted for 3.1% of all drug or alcohol intoxication deaths in state prisons between 2001 and 2009.
�� Males were twice as likely (19 deaths per 100,000) as females (8 deaths per 100,000) to die from liver disease. Males were 1.5 times more likely to commit suicide than females in prison between 2001 and 2009 (table 24).
�� Blacks/African Americans accounted for 68% of AIDS-related deaths and died from AIDS at a rate (21 per 100,000) that was three times that of whites (7 per 100,000) and twice that of Hispanics/Latinos (10 per 100,000) between 2001 and 2009.
�� Inmates age 55 or older had the highest mortality rates due to heart disease (664 deaths per 100,000), cancer (639 deaths per 100,000), and liver disease (113 deaths per 100,000) over the entire 9-year DCRP collection.
�� Prison inmates age 55 or older had the highest homicide rate (8 deaths per 100,000), which was between 1.6 and 2.7 times higher than any other age group from 2001 to 2009.

4 Prison and Jail Deaths in Custody, 2000-2009 - Statistical Tables
list of TablesTAble 1. Number of local jail inmate deaths, by cause of death, 2000-2009
TAble 2. Percent of local jail inmate deaths, by cause of death, 2000-2009
TAble 3. Mortality rate per 100,000 local jail inmates, by cause of death, 2000-2009
TAble 4. Number of local jail inmate deaths, by selected characteristics, 2000-2009
TAble 5. Percent of local jail inmate deaths, by selected characteristics, 2000-2009
TAble 6. Mortality rate per 100,000 local jail inmates, by selected characteristics, 2000-2009
TAble 7. Number of jail deaths, by state and year, 2000-2009
TAble 8. Mortality rate per 100,000 local jail inmates, by state, 2000-2009
TAble 9. Number of jail jurisdictions reporting to the Deaths in Custody Reporting Program, by state and year, 2000-2009
TAble 10. Number of local jail inmate deaths, by cause of death and selected characteristics, 2000-2009
TAble 11. Percent of local jail inmate deaths, by cause of death and selected characteristics, 2000-2009
TAble 12. Average annual mortality rate per 100,000 local jail inmates, by cause of death and selected characteristics, 2000-2009
TAble 13. Number of state prisoner deaths, by cause of death, 2001-2009
TAble 14. Percent of state prisoner deaths, by cause of death, 2001-2009
TAble 15. Mortality rate per 100,000 state prisoners, by cause of death, 2001-2009
TAble 16. Number of state prisoner deaths, by selected characteristics, 2001-2009
TAble 17. Percent of state prisoner deaths, by selected characteristics, 2001-2009
TAble 18. Estimated number of state prisoners in custody at midyear, by selected characteristics, 2001-2009
TAble 19. Mortality rate per 100,000 state prisoners, by selected characteristics, 2001-2009
TAble 20. Number of state prisoner deaths, by state, 2001-2009
TAble 21. Mortality rate per 100,000 state prisoners, by state, 2001-2009
TAble 22. Number of state prisoner deaths, by cause of death and selected characteristics, 2001-2009
TAble 23. Percent of state prisoner deaths, by cause of death and selected characteristics, 2001-2009
TAble 24. Mortality rate per 100,000 state prisoners, by cause of death and selected characteristics, 2001-2009
TAble 25. Number of state prisoner deaths, by cause of death and state, 2001-2009
TAble 26. Mortality rate per 100,000 state prisoners, by cause of death and state, 2001-2009

December 2011 5
TAble 1 Number of local jail inmate deaths, by cause of death, 2000–2009Cause of death 2000 2001 2002 2003 2004 2005 2006 2007 2008a 2009
All causes 904 944 972 1,004 1,024 1,049 1,098 1,102 960 948Illness 516 488 508 514 533 504 609 609 446 488
Heart disease 198 216 221 241 227 203 250 232 177 200AIDS-related 57 59 51 54 52 40 54 43 31 26Cancer 31 25 39 35 29 37 39 42 25 47Respiratory diseases 32 19 23 22 35 22 27 49 35 31Liver disease 22 26 24 29 31 31 24 39 33 30All other illnessesb 176 143 150 133 159 171 215 204 145 154
Suicide 289 314 314 296 299 286 278 285 230 303Drug/alcohol intoxication 37 58 55 89 77 84 87 79 43 64Accident 25 35 35 28 32 24 32 18 15 26Homicide 17 19 18 15 24 22 36 20 17 23Other/unknown 20 30 42 62 59 129 56 91 209 44Note: Cause of death rankings may differ from previously published 2000–2007 estimates because cause of death was ranked on all deaths from 2000 to 2009, which resulted in small changes within some categories. aIn 2008, a high number of cases were missing cause of death information. These cases were classified as other/unknown. See Methodology for more information.bIncludes other specified (such as cerebrovascular disease, influenza, cirrhosis, and other non-leading natural causes of death) as well as unspecified illnesses. See Methodology for details on illness classifications.Source: Bureau of Justice Statistics, Deaths in Custody Reporting Program (DCRP).
TAble 2 Percent of local jail inmate deaths, by cause of death, 2000–2009Cause of death 2000 2001 2002 2003 2004 2005 2006 2007 2008a 2009
All causes 100% 100% 100% 100% 100% 100% 100% 100% 100% 100%Illness 57.1% 51.7% 52.3% 51.2% 52.1% 48.0% 55.5% 55.3% 46.5% 51.5%
Heart disease 21.9 22.9 22.7 24.0 22.2 19.4 22.8 21.1 18.4 21.1AIDS-related 6.3 6.3 5.2 5.4 5.1 3.8 4.9 3.9 3.2 2.7Cancer 3.4 2.6 4.0 3.5 2.8 3.5 3.6 3.8 2.6 5.0Respiratory diseases 3.5 2.0 2.4 2.2 3.4 2.1 2.5 4.4 3.6 3.3Liver disease 2.4 2.8 2.5 2.9 3.0 3.0 2.2 3.5 3.4 3.2All other illnessesb 19.5 15.1 15.5 13.3 15.6 16.3 19.5 18.6 15.1 16.2
Suicide 32.0% 33.3% 32.3% 29.5% 29.2% 27.3% 25.3% 25.9% 24.0% 32.0%Drug/alcohol intoxication 4.1% 6.1% 5.7% 8.9% 7.5% 8.0% 7.9% 7.5% 4.5% 6.8%Accident 2.8% 3.7% 3.6% 2.8% 3.1% 2.3% 2.9% 1.6% 1.6% 2.7%Homicide 1.9% 2.0% 1.9% 1.5% 2.3% 2.1% 3.3% 1.8% 1.8% 2.4%Other/unknown 2.2% 3.2% 4.3% 6.2% 5.8% 12.3% 5.1% 8.3% 21.8% 4.6%Note: Cause of death rankings may differ from previously published 2000-2007 estimates because cause of death was ranked on all deaths from 2000 to 2009, which resulted in small changes within some categories. aIn 2008, a high number of cases were missing cause of death information. These cases were classified as other/unknown. See Methodology for more information.bIncludes other specified (such as cerebrovascular disease, influenza, cirrhosis, and other non-leading natural causes of death) as well as unspecified illnesses. See Methodology for details on illness classifications.Source: Bureau of Justice Statistics, Deaths in Custody Reporting Program (DCRP).

6 Prison and Jail Deaths in Custody, 2000-2009 - Statistical Tables
TAble 3Mortality rate per 100,000 local jail inmates, by cause of death, 2000–2009Cause of death 2000 2001 2002 2003 2004 2005 2006 2007 2008a 2009
All causes 151 148 145 146 143 141 142 141 123 127Illness 86 76 76 75 74 68 79 78 57 66
Heart disease 33 34 33 35 32 27 32 30 23 27AIDS-related 10 9 8 8 7 5 7 5 4 3Cancer 5 4 6 5 4 5 5 5 3 6Respiratory diseases 5 3 3 3 5 3 3 6 4 4Liver disease 4 4 4 4 4 4 3 5 4 4All other illnessesb 29 22 22 19 22 23 28 26 19 21
Suicide 48 49 47 43 42 39 36 36 30 41Drug/alcohol intoxication 6 9 8 13 11 11 11 10 6 9Accident 4 5 5 4 4 3 4 2 2 3Homicide 3 3 3 2 3 3 5 3 2 3Other/unknown 3 5 6 9 8 17 7 12 27 6Note: Cause of death rankings may differ from previously published 2000-2007 estimates because cause of death was ranked on all deaths from 2000 to 2009, which resulted in small changes within some categories. Mortality rates are based on the average daily population (ADP). In 2000 and 2001, ADP was estimated by taking the average of January 1st and December 31st one-day inmate population counts. aIn 2008, a high number of cases were missing cause of death information. These cases were classified as other/unknown. See Methodology for more information.bIncludes other specified (such as cerebrovascular disease, influenza, cirrhosis, and other non-leading natural causes of death) as well as unspecified illnesses. See Methodology for details on illness classifications.Source: Bureau of Justice Statistics, Deaths in Custody Reporting Program (DCRP).

December 2011 7
TAble 4 Number of local jail inmate deaths, by selected characteristics, 2000–2009Characteristic 2000 2001 2002 2003 2004 2005 2006 2007 2008a 2009
Total 904 944 972 1,004 1,024 1,049 1,098 1,102 960 948Sex
Male 813 849 865 869 895 930 969 972 841 838Female 91 91 107 133 129 119 129 130 119 110
Race/Hispanic originb
White 453 515 536 538 502 561 531 549 513 535Black/African American 305 284 305 324 360 333 409 399 311 271Hispanic/Latino 118 116 113 119 135 118 127 125 107 108American Indian or Alaska Native 9 13 5 10 13 14 17 12 11 21Asian 5 6 4 6 10 6 9 12 13 8Hawaiian or other Pacific Islander 1 1 1 0 0 1 1 1 0 0Two or more races 2 0 0 0 0 1 0 2 2 0
Age17 or younger 8 8 7 5 7 5 6 4 6 318–24 89 107 101 103 105 108 103 101 84 8625–34 184 193 186 212 211 193 196 199 168 17335–44 265 282 337 284 300 285 313 293 247 23645–54 239 240 237 266 264 276 306 323 276 25755 or older 115 111 102 128 134 171 169 182 178 193
Legal statusConvictedc 258 254 245 256 227 231 238 247 200 246Unconvictedd 628 683 719 740 788 802 850 851 755 690
Time served7 or fewer days 329 348 362 398 399 385 387 392 347 3648–30 169 176 163 177 181 193 202 185 163 16431–60 108 105 104 93 112 109 125 137 109 10061–120 116 125 120 121 112 129 149 146 122 114121–180 56 63 74 72 75 70 80 82 66 52180 or more 119 113 135 126 128 128 126 154 130 146
Note: Detail may not sum to total due to missing data.aIn 2008, a high number of cases were missing cause of death information. These cases were classified as other/unknown. See Methodology for more information.bExcludes persons of Hispanic/Latino origin unless specified.cIncludes inmates who returned on a probation or parole violation. Forms were modified in 2009 to identify inmates who were convicted, or returned on a probation or parole violation. As with previous years, these cases are counted as convicted. See Methodology for more information on changes to the survey.dIncludes inmates whose status was marked as other or was unspecified.Source: Bureau of Justice Statistics, Deaths in Custody Reporting Program (DCRP).

8 Prison and Jail Deaths in Custody, 2000-2009 - Statistical Tables
TAble 5Percent of local jail inmate deaths, by selected characteristics, 2000–2009Characteristic 2000 2001 2002 2003 2004 2005 2006 2007 2008a 2009
Total 100% 100% 100% 100% 100% 100% 100% 100% 100% 100%Sex
Male 89.9% 90.3% 89.0% 86.7% 87.4% 88.7% 88.3% 88.2% 87.6% 88.4%Female 10.1 9.7 11.0 13.3 12.6 11.3 11.7 11.8 12.4 11.6
Race/Hispanic originb
White 50.7% 55.1% 55.6% 54.0% 49.2% 54.3% 48.5% 49.9% 53.6% 56.7%Black/African American 34.2 30.4 31.6 32.5 35.3 32.2 37.4 36.3 32.5 28.7Hispanic/Latino 13.2 12.4 11.7 11.9 13.2 11.4 11.6 11.4 11.2 11.5American Indian or Alaska Native 1.0 1.4 0.5 1.0 1.3 1.4 1.6 1.1 1.1 2.2Asian 0.6 0.6 0.4 0.6 1.0 0.6 0.8 1.1 1.4 0.8Hawaiian or other Pacific Islander 0.1 0.1 0.1 0.0 0.0 0.1 0.1 0.1 0.0 0.0Two or more races 0.2 0.0 0.0 0.0 0.0 0.1 0.0 0.2 0.2 0.0
Age17 or younger 0.9% 0.9% 0.7% 0.5% 0.7% 0.5% 0.5% 0.4% 0.6% 0.3%18–24 9.9 11.4 10.4 10.3 10.3 10.4 9.4 9.2 8.8 9.125–34 20.4 20.5 19.2 21.2 20.7 18.6 17.9 18.1 17.5 18.235–44 29.4 30.0 34.7 28.5 29.4 27.5 28.6 26.6 25.8 24.945–54 26.6 25.5 24.4 26.7 25.9 26.6 28.0 29.3 28.8 27.155 or older 12.8 11.8 10.5 12.8 13.1 16.5 15.5 16.5 18.6 20.4
Legal statusConvictedc 29.1% 27.1% 25.4% 25.7% 22.4% 22.4% 21.9% 22.5% 20.9% 26.3%Unconvictedd 70.9 72.9 74.6 74.3 77.6 77.6 78.1 77.5 79.1 73.7
Time served7 or fewer days 36.7% 37.4% 37.8% 40.3% 39.3% 38.0% 36.2% 35.8% 37.0% 38.7%8–30 18.8 18.9 17.0 17.9 18.0 19.0 18.9 16.9 17.4 17.431–60 12.0 11.3 10.9 9.4 11.1 10.7 11.7 12.5 11.6 10.661–120 12.9 13.4 12.5 12.3 11.1 12.7 13.9 13.3 13.0 12.1121–180 6.2 6.8 7.7 7.3 7.4 6.9 7.5 7.5 7.0 5.5180 or more 13.3 12.2 14.1 12.8 12.7 12.6 11.8 14.1 13.9 15.5
Note: Detail may not sum to total due to missing data.aIn 2008, a high number of cases were missing cause of death information. These cases were classified as other/unknown. See Methodology for more information.bExcludes persons of Hispanic/Latino origin unless specified.cIncludes inmates who returned on a probation or parole violation. Forms were modified in 2009 to identify inmates who were convicted, or returned on a probation or parole violation. As with previous years, these cases are counted as convicted. See Methodology for more information on changes to the survey.dIncludes inmates whose status was marked as other or was unspecified.Source: Bureau of Justice Statistics, Deaths in Custody Reporting Program (DCRP).
December 2011 9
TAble 6 Mortality rate per 100,000 local jail inmates, by selected characteristics, 2000–2009Characteristic 2000 2001 2002 2003 2004 2005 2006 2007 2008a 2009
Total 151 148 145 146 143 141 142 141 123 127Sex
Male 153 150 146 143 143 144 144 143 124 128Female 133 123 138 162 147 126 129 129 120 121
Race/Hispanic originb
White 211 225 224 218 196 213 194 198 188 205Black/African American 128 111 114 118 126 123 145 140 111 101Hispanic/Latino 107 98 92 94 102 87 90 87 67 71American Indian or Alaska Native 112 152 56 108 136 141 164 114 105 210Asian 88 99 63 92 147 85 123 161 176 113Hawaiian or other Pacific Islander 88 ! 82 ! 79 ! 0 0 71 ! 68 ! 67 ! 0 0Two or more races 11 ! 0 0 0 0 2 ! 0 5! 4! 0
Age17 or younger 122 ! 114 ! 95 ! 69 ! 96 ! 68 ! 82 ! 58 ! 86! 44 !18–24 52 59 53 53 53 53 49 48 40 4225–34 96 94 87 96 92 82 80 81 67 7135–44 169 168 193 160 165 153 153 157 138 14345–54 396 372 352 362 326 312 316 300 260 25655 or older 870 785 691 785 737 853 762 729 666 708
Legal statusConvictedc 98 96 92 94 80 82 81 83 41 53Unconvictedd 187 182 180 178 183 174 177 175 261 250
Note: Detail may not sum to total due to missing data. Mortality rates are based on the average daily population (ADP). In 2000 and 2001, ADP was estimated by taking the average of January 1st and December 31 one-day inmate population counts. Inmate populations for sex and legal status are based on the Annual Survey of Jails (ASJ), from 2000 through 2009. Inmate populations for age and race/Hispanic origin are based on the Survey of Inmates in Local Jails (SILJ) from 2000 through 2002, and on the National Inmate Survey (NIS) and the Annual Survey of Jails (ASJ), from 2003 through 2009. See the Methodology for these tables for more information on estimates of age.! Interpret with caution; too few cases to provide a reliable rate. See Methodology for more information.aIn 2008, a high number of cases were missing cause of death information. These cases were classified as other/unknown. See Methodology for more information.bExcludes persons of Hispanic/Latino origin unless specified.cIncludes inmates who returned on a probation or parole violation. Forms were modified in 2009 to identify inmates who were convicted, or returned on a probation or parole violation. As with previous years, these cases are counted as convicted. See Methodology for more information on changes to the survey.dIncludes inmates whose status was marked as other or was unspecified.Sources: Bureau of Justice Statistics, Deaths in Custody Reporting Program (DCRP), Annual Survey of Jails (ASJ), National Inmate Survey (NIS), and Survey of Inmates in Local Jails (SILJ).

10 Prison and Jail Deaths in Custody, 2000-2009 - Statistical Tables
TAble 7 Number of jail deaths, by state and year, 2000–2009State 2000 2001 2002 2003 2004 2005 2006 2007 2008 2009
All states 904 944 972 1,004 1,024 1,049 1,098 1,102 960 948Alabama 24 27 22 15 23 23 35 22 19 20Alaska … … … … … … … … … …Arizona 15 18 24 16 12 27 19 21 12 11Arkansas 9 13 14 22 13 7 11 10 15 5California 109 124 131 126 120 156 127 129 107 132Colorado 13 16 14 13 11 18 13 21 21 14Connecticut … … … … … … … … … …Delaware … … … … … … … … … …District of Columbia 4 0 10 12 13 11 12 10 7 8Florida 82 100 79 85 86 79 99 103 77 87Georgia 38 39 50 45 54 42 47 44 55 45Hawaii … … … … … … … … … …Idaho 3 3 1 2 1 7 5 7 1 6Illinois 31 21 22 30 41 25 37 31 28 29Indiana 21 21 14 23 18 16 27 18 11 16Iowa 2 4 3 1 4 4 3 5 2 6Kansas 9 9 12 10 15 11 10 7 12 11Kentucky 16 13 12 14 16 22 21 25 22 17Louisiana 10 22 22 32 41 31 26 31 34 22Maine 2 2 7 3 2 1 5 1 1 2Maryland 22 20 20 25 15 23 27 32 25 20Massachusetts 5 10 16 9 8 21 14 14 17 17Michigan 23 17 18 26 20 29 21 18 12 20Minnesota 6 8 6 9 9 8 11 8 4 3Mississippi 9 12 17 18 17 16 18 18 14 13Missouri 16 14 8 17 6 10 13 25 18 20Montana 3 1 5 5 3 6 1 2 2 6Nebraska 5 5 6 2 4 2 6 2 5 7Nevada 15 18 6 6 8 14 9 10 8 14New Hampshire 3 2 5 3 3 1 4 4 2 5New Jersey 31 17 17 38 34 32 36 34 27 25New Mexico 15 9 9 7 17 11 21 15 11 11New York 57 52 51 47 43 51 52 52 32 35North Carolina 15 17 32 22 21 18 21 28 19 21North Dakota 1 1 2 2 1 0 2 1 1 2Ohio 23 20 30 30 19 24 26 26 23 27Oklahoma 15 18 9 13 14 18 21 24 17 17Oregon 10 10 7 7 15 8 11 4 15 7Pennsylvania 38 50 51 53 66 57 56 55 44 36Rhode Island … … … … … … … … … …South Carolina 17 23 17 11 16 19 21 14 19 15South Dakota 4 2 1 0 1 3 1 1 2 2Tennessee 29 28 29 23 39 36 30 35 37 34Texas 97 84 97 96 99 91 98 90 86 76Utah 6 6 13 7 11 10 7 11 6 12Vermont … … … … … … … … … …Virginia 34 41 36 42 34 30 36 59 50 38Washington 8 10 11 17 11 11 19 15 16 14West Virginia 2 6 2 6 6 6 6 4 6 7Wisconsin 7 11 12 11 10 11 11 15 17 11Wyoming 0 0 2 3 4 3 2 1 1 2Note: Jails are locally run jurisdictions under the authority of a sheriff, county government, or other local authority. Jail jurisdictions include counties (parishes in Louisiana) or municipal governments that administer one or more local jails. See Methodology for more information on the function of jails.… Not available. Prisons and jails form one integrated system. See the prison tables for mortality data.Source: Bureau of Justice Statistics, Deaths in Custody Reporting Program (DCRP).

December 2011 11
TAble 8Mortality rate per 100,000 local jail inmates, by state, 2000–2009State 2000 2001 2002 2003 2004 2005 2006 2007 2008 2009
All states 151 148 145 146 143 141 142 141 123 127Alabama 185 228 164 119 171 157 235 139 118 145Alaska ... ... ... ... ... ... ... ... ... ...Arizona 138 132 189 116 82 176 126 127 67 73!Arkansas 171! 233 229 352 211 116! 172! 143! 203 67!California 150 171 173 165 154 190 155 155 128 166Colorado 142 154 126 111 95! 136 94 155 160 106Connecticut ... ... ... ... ... ... ... ... ... ...Delaware ... ... ... ... ... ... ... ... ... ...District of Columbia 242! 0 316! 529 374 475! 346 318! 234! 259!Florida 166 200 145 159 143 125 153 154 115 141Georgia 113 110 132 114 128 94 103 98 115 97Hawaii ... ... ... ... ... ... ... ... ... ...Idaho 112! 101! 30! 59! 34! 178! 127! 172! 25! 160!Illinois 178 107 106 140 201 84 181 150 134 148Indiana 165 124 95 149 109 92 144 104 62 87Iowa 66! 129! 83! 26! 110! 96! 75! 120! 49! 154!Kansas 177! 159! 195 134! 219 148! 130! 95! 156 157!Kentucky 139 68 86 97 98 134 124 138 122 95Louisiana 44! 82 81 115 143 104 100 104 117 77Maine 154! 142! 464! 191! 135! 64! 283! 61! 63! 127!Maryland 210 182 166 199 116 181 207 228 184 164Massachusetts 53! 91! 136 73! 61! 168 101 103 128 129Michigan 145 103 108 156 111 159 112 98 68 118Minnesota 121! 141! 101! 140! 128! 110! 151! 106! 56! 45!Mississippi 91! 129 167 166 162 146 164 152 127 134Missouri 211 171 89! 181 60! 97! 116 235 154 173Montana 232! 53! 277! 260! 149! 288! 50! 116! 112! 344!Nebraska 234! 211! 241! 80! 140! 68! 219! 68! 159! 204!Nevada 288 333 106! 80! 116! 228 139! 131! 106! 181New Hampshire 338! 145! 323! 192! 181! 54! 195! 196! 99! 237!New Jersey 205 108 104 225 196 177 189 185 151 152New Mexico 253 140! 136! 95! 210 128! 233 171 121! 133!New York 208 181 166 154 141 166 161 166 106 124North Carolina 122 132 212 144 128 100 115 147 98 128North Dakota 162! 154! 268! 242! 114! 0 208! 113! 104! 223!Ohio 143 118 161 153 96 122 126 127 119 135Oklahoma 208 249 119! 158 154 179 191 222 169 162Oregon 150! 132! 110! 106! 230 117! 165! 48! 238 117!Pennsylvania 135 165 153 164 200 166 155 144 118 95Rhode Island ... ... ... ... ... ... ... ... ... ...South Carolina 194 218 140 100! 138 157 165 103 139 119South Dakota 344! 176! 77! 0 66! 192! 61! 65! 141! 123!Tennessee 143 138 138 100 168 149 92 139 139 129Texas 167 154 173 159 157 169 144 130 124 113Utah 112! 107! 223 112! 169! 156! 107! 160! 87! 173Vermont ... ... ... ... ... ... ... ... ... ...Virginia 170 185 152 168 133 113 127 200 173 134Washington 93! 81! 91! 144 93! 85! 142 109 119 107West Virginia 71! 185! 65! 182! 166! 147! 139! 92! 138! 171!Wisconsin 54! 86! 89! 78! 69! 74! 73! 96 110 90!Wyoming 0 0 163! 224! 267! 196! 131! 64! 59! 123!Note: Jails are locally run jurisdictions under the authority of a sheriff, county government, or other local authority. Jail jurisdictions include counties (parishes in Louisiana) or municipal governments that administer one or more local jails. See Methodology for more information on the function of jails. Mortality rates are based on the average daily population (ADP). In 2000 and 2001, ADP was estimated by taking the average of January 1st and December 31 one-day inmate population counts. Mortality rates between states are not directly comparable because rates are not adjusted for age, sex, race, geographic location, or any other characteristic.… Not available. Prisons and jails form one integrated system. See the prison tables for mortality data.! Interpret with caution; estimate based on too few cases to provide a reliable rate. See Methodology for more information.Source: Bureau of Justice Statistics, Deaths in Custody Reporting Program (DCRP).
12 Prison and Jail Deaths in Custody, 2000-2009 - Statistical Tables
TAble 9Number of jail jurisidictions reporting to the Deaths in Custody Reporting Program, by state and year, 2000–2009State 2000 2001 2002 2003 2004 2005 2006 2007 2008 2009
All states 2,979 2,964 2,944 2,929 2,913 2,886 2,856 2,835 2,820 2,743Alabama 152 150 148 147 146 143 137 133 126 116Alaska … … … … … … … … … …Arizona 16 15 15 15 15 15 15 15 15 15Arkansas 85 84 84 83 82 83 81 81 81 77California 74 71 71 71 71 70 69 68 67 65Colorado 57 57 57 57 57 57 55 55 55 55Connecticut … … … … … … … … … …Delaware … … … … … … … … … …District of Columbia 1 1 1 1 1 1 1 1 1 1Florida 69 69 69 69 68 68 68 68 68 66Georgia 200 196 196 194 194 189 186 184 181 174Hawaii … … … … … … … … … …Idaho 39 38 38 38 38 38 38 37 37 36Illinois 91 90 91 91 90 91 90 90 90 90Indiana 92 93 92 92 92 91 91 91 91 90Iowa 94 93 93 93 93 93 93 93 93 92Kansas 96 96 96 96 96 96 95 95 94 91Kentucky 80 78 80 79 79 76 74 74 74 70Louisiana 90 89 89 90 89 87 88 87 87 81Maine 15 15 15 15 15 15 15 14 14 14Maryland 25 25 25 25 25 25 25 25 25 24Massachusetts 13 15 15 15 15 16 16 16 16 16Michigan 83 83 82 82 82 82 81 81 81 81Minnesota 76 76 76 76 76 77 76 76 75 73Mississippi 92 91 92 90 89 86 84 85 84 80Missouri 125 125 125 124 120 120 122 121 121 114Montana 41 41 40 40 41 40 40 40 40 38Nebraska 64 63 63 63 63 63 62 62 62 61Nevada 20 20 20 20 20 20 20 20 20 20New Hampshire 10 10 10 10 10 10 10 10 10 10New Jersey 21 21 21 21 21 21 21 21 21 20New Mexico 34 35 35 34 34 32 32 32 32 29New York 60 60 60 60 60 60 60 59 59 57North Carolina 96 96 96 96 95 95 95 95 94 89North Dakota 23 23 23 23 23 23 22 21 21 22Ohio 103 101 99 96 96 96 94 93 93 93Oklahoma 100 100 100 99 98 96 94 93 93 88Oregon 34 34 34 34 34 33 33 33 33 33Pennsylvania 67 67 67 66 66 66 66 66 66 64Rhode Island … … … … … … … … … …South Carolina 51 50 51 50 50 50 50 50 50 49South Dakota 28 29 29 29 29 28 28 28 28 26Tennessee 103 103 102 102 102 102 101 100 100 95Texas 253 252 249 249 246 246 246 241 240 236Utah 26 26 26 26 26 26 26 26 26 26Vermont … … … … … … … … … …Virginia 76 75 75 75 75 73 69 67 67 67Washington 60 60 59 58 58 57 57 57 57 57West Virginiaa 29 28 19 18 16 13 12 12 12 12Wisconsin 71 71 71 71 71 71 71 71 71 69Wyoming 22 22 22 22 22 22 22 22 22 22Note: Reporting jails include all jails that reported population or death data to the Deaths in Custody Reporting Program (DCRP). All jails are asked to report population data regardless of whether an inmate death occurred. Jails are locally run jurisdictions under the authority of a sheriff, county government, or other local authority. Jail jurisdictions include counties (parishes in Louisiana) or municipal governments that administer one or more local jails. See Methodology for more information on the function of jails.… Not available. Prisons and jails form one integrated system. See the prison tables for mortality data.aIn 2007, the Bureau of Justice Statistics began receiving data from a centralized regional jail respondent that covered all West Virginia jails.Source: Bureau of Justice Statistics, Deaths in Custody Reporting Program (DCRP).

December 2011 13
TAble 10Number of local jail inmate deaths, by cause of death and selected characteristics, 2000–2009
IllnessHeart disease
AIDS-related Cancer
Respiratory diseases
Liver disease
All other illnessesa Suicide
Drug/alcohol intoxication Accident Homicide
Other/unknownbCharacteristic
Total 2,165 467 349 295 289 1,650 2,894 673 270 211 742Sex
Male 1,948 407 314 240 271 1,368 2,661 543 244 207 638Female 217 60 35 55 18 281 232 130 26 4 100
Race/Hispanic originc
White 1,002 77 147 130 159 677 2,022 407 171 77 364Black/African American 920 330 159 126 62 707 421 159 65 94 258Hispanic/Latino 193 57 35 32 61 227 337 90 26 37 91American Indian or Alaska Native 21 1 2 5 5 13 59 11 3 0 5Asian 10 2 5 0 0 14 38 1 4 1 4Hawaiian or other Pacific Islander 4 0 0 0 0 0 1 1 0 0 0Two or more races 2 0 0 0 0 0 4 0 0 0 1
Age17 or younger 2 3 0 2 0 3 39 4 1 1 418–24 56 9 6 8 3 86 576 89 34 47 7325–34 210 84 24 38 13 219 867 210 67 51 13235–44 561 193 55 78 66 472 873 207 79 53 20545–54 763 146 125 95 150 558 414 135 65 40 19355 or older 569 31 139 74 57 310 118 26 24 18 117
Legal statusConvictedd 655 126 99 76 77 439 508 115 79 52 176Unconvictede 1,492 336 248 214 212 1,199 2,370 554 190 153 538
Time served7 or fewer days 695 35 14 60 67 501 1,376 476 136 57 2948–30 435 91 44 85 51 346 456 45 37 48 13531–60 275 63 45 33 46 211 300 20 17 23 6961–120 287 104 65 45 46 218 303 42 25 32 87121–180 151 73 49 24 27 133 146 19 13 15 40180 or more 281 98 126 42 51 214 282 55 38 33 85
Note: Detail may not sum to total due to missing data. Cause of death rankings may differ from previously published 2000-2007 estimates because cause of death was ranked on all deaths from 2000 to 2009, which resulted in small changes within some categories.aIncludes other specified (such as cerebrovascular disease, influenza, cirrhosis, and other non-leading natural causes of death) as well as unspecified illnesses. See Methodology for details on illness classifications.bIn 2008, a high number of cases were missing cause of death information. These cases were classified as other/unknown. cExcludes persons of Hispanic/Latino origin unless specified.dIncludes inmates who returned on a probation or parole violation. Forms were modified in 2009 to identify inmates who were convicted, or returned on a probation or parole violation. As with previous years, these cases are counted as convicted. See Methodology for more information on changes to the survey.eIncludes inmates whose status was marked as other or was unspecified.Source: Bureau of Justice Statistics, Deaths in Custody Reporting Program (DCRP).

14 Prison and Jail Deaths in Custody, 2000-2009 - Statistical Tables
TAble 11Percent of local jail inmate deaths, by cause of death and selected characteristics, 2000–2009
Illness
CharacteristicHeart disease
AIDS-related Cancer
Respiratory diseases
Liver disease
All other illnessesa Suicide
Drug/alcohol intoxication Accident Homicide
Total 100% 100% 100% 100% 100% 100% 100% 100% 100% 100%Sex
Male 90.0% 87.2% 90.0% 81.4% 93.8% 82.9% 91.9% 80.7% 90.4% 98.1%Female 10.0 12.8 10.0 18.6 6.2 17.0 8.0 19.3 9.6 1.9
Race/Hispanic originb
White 46.3% 16.5% 42.1% 44.1% 55.0% 41.0% 69.9% 60.5% 63.3% 36.5%Black/African American 42.5 70.7 45.6 42.7 21.5 42.8 14.5 23.6 24.1 44.5Hispanic/Latino 8.9 12.2 10.0 10.8 21.1 13.8 11.6 13.4 9.6 17.5American Indian or Alaska Native 1.0 0.2 0.6 1.7 1.7 0.8 2.0 1.6 1.1 0.0Asian 0.5 0.4 1.4 0.0 0.0 0.8 1.3 0.1 1.5 0.5Hawaiian or other Pacific Islander 0.2 0.0 0.0 0.0 0.0 0.0 0.0 0.1 0.0 0.0Two or more races 0.1 0.0 0.0 0.0 0.0 0.0 0.1 0.0 0.0 0.0
Age17 or younger 0.1% 0.6% 0.0% 0.7% 0.0% 0.2% 1.3% 0.6% 0.4% 0.5%18–24 2.6 1.9 1.7 2.7 1.0 5.2 19.9 13.2 12.6 22.325–34 9.7 18.0 6.9 12.9 4.5 13.3 30.0 31.2 24.8 24.235–44 25.9 41.3 15.8 26.4 22.8 28.6 30.2 30.8 29.3 25.145–54 35.2 31.3 35.8 32.2 51.9 33.8 14.3 20.1 24.1 19.055 or older 26.3 6.6 39.8 25.1 19.7 18.8 4.1 3.9 8.9 8.5
Legal statusConvictedc 30.3% 27.0% 28.4% 25.8% 26.6% 26.6% 17.6% 17.1% 29.3% 24.6%Unconvictedd 68.9 71.9 71.1 72.5 73.4 72.7 81.9 82.3 70.4 72.5
Time served7 or fewer days 32.1% 7.5% 4.0% 20.3% 23.2% 30.4% 47.5% 70.7% 50.4% 27.0%8–30 20.1 19.5 12.6 28.8 17.6 21.0 15.8 6.7 13.7 22.731–60 12.7 13.5 12.9 11.2 15.9 12.8 10.4 3.0 6.3 10.961–120 13.3 22.3 18.6 15.3 15.9 13.2 10.5 6.2 9.3 15.2121–180 7.0 15.6 14.0 8.1 9.3 8.1 5.0 2.8 4.8 7.1180 or more 13.0 21.0 36.1 14.2 17.6 13.0 9.7 8.2 14.1 15.6
Note: Detail may not sum to total due to missing data. Cause of death rankings may differ from previously published 2000-2007 estimates because cause of death was ranked on all deaths from 2000 to 2009, which resulted in small changes within some categories.aIncludes other specified (such as cerebrovascular disease, influenza, cirrhosis, and other non-leading natural causes of death) as well as unspecified illnesses. See Methodology for details on illness.bExcludes persons of Hispanic/Latino origin unless specified.cIncludes inmates who returned on a probation or parole violation. Forms were modified in 2009 to identify inmates who were convicted, or returned on a probation or parole violation. As with previous years, these cases are counted as convicted. See Methodology for more information on changes to the survey.dIncludes inmates whose status was marked as other or was unspecified.Source: Bureau of Justice Statistics, Deaths in Custody Reporting Program (DCRP).
December 2011 15
TAble 12Average annual mortality rate per 100,000 local jail inmates, by cause of death and selected characteristics, 2000–2009
IllnessHeart disease
AIDS-related Cancer
Respiratory diseases
Liver disease
All other illnessesa Suicide
Drug/alcohol intoxication Accident HomicideCharacteristic
Total 30 7 5 4 4 23 41 9 4 3Sex
Male 31 7 5 4 4 22 43 9 4 3Female 25 7 4 6 2 32 27 15 3 --!
Race/Hispanic originb
White 40 3 6 5 6 27 80 16 7 3Black/African American 34 12 6 5 2 26 16 6 2 3Hispanic/Latino 14 4 3 2 5 17 25 7 2 3American Indian or Alaska Native 22 1! 2 5 5 14 62 12! 3 0Asian 15! 3! 7 0 0 21 56 1! 6 1!Hawaiian or other Pacific Islander 30! 0 0 0 0 0 7! 7! 0 0Two or more races 1! 0 0 0 0 0 1! 0 0 0
Age17 or younger 3! 4! 0 3! 0 4! 55 6! 1! 1!18–24 3 --! --! --! --! 4 29 5 2 225–34 9 4 1 2 1 10 38 9 3 235–44 32 11 3 4 4 27 49 12 4 345–54 90 17 15 11 18 66 49 16 8 555 or older 288 16 70 37 29 157 60 13 12 9
Legal statusConvictedc 21 4 3 2 2 14 16 4 2 2Unconvictedd 38 9 6 5 5 30 60 14 5 4
Note: Detail may not sum to total due to missing data. Cause of death rankings may differ from previously published 2000-2007 estimates because cause of death was ranked on all deaths from 2000 to 2009, which resulted in small changes within some categories. Mortality rates are based on the average daily population (ADP). In 2000 and 2001, ADP was estimated by taking the average of January 1st and December 31st one-day inmate population counts. Inmate populations for sex and legal status are based on the Annual Survey of Jails (ASJ), from 2000 through 2009. Inmate populations for age and race/Hispanic origin are based on the Survey of Inmates in Local Jails (SILJ) from 2000 through 2002, and on the National Inmate Survey (NIS) and the Annual Survey of Jails (ASJ), from 2003 through 2009. See Methodology for more information on age estimates.-- Less than 0.5.! Interpret with caution; too few cases to provide a reliable rate. See Methodology for more information.aIncludes other specified (such as cerebrovascular disease, influenza, cirrhosis, and other non-leading natural causes of death) as well as unspecified illnesses. See Methodology for details on illness classifications.bExcludes persons of Hispanic/Latino origin unless specified.cIncludes inmates who returned on a probation or parole violation. Forms were modified in 2009 to identify inmates who were convicted, or returned on a probation or parole violation. As with previous years, these cases are counted as convicted. See Methodology for more information on changes to the survey.dIncludes inmates whose status was marked as other or was unspecified.Sources: Bureau of Justice Statistics, Deaths in Custody Reporting Program (DCRP), Annual Survey of Jails (ASJ), National Inmate Survey (NIS), and Survey of Inmates in Local Jails (SILJ).

16 Prison and Jail Deaths in Custody, 2000-2009 - Statistical Tables
TAble 13 Number of state prisoner deaths, by cause of death, 2001–2009Cause of death 2001 2002 2003 2004 2005 2006 2007a 2008 2009
All causes 2,877 2,942 3,165 3,129 3,172 3,239 3,392 3,452 3,408 Illness 2,573 2,621 2,843 2,787 2,819 2,833 2,981 3,030 3,014
Heart disease 749 804 821 838 851 866 710 859 870 Cancer 628 650 776 710 763 765 600 858 911 Liver disease 225 201 248 219 237 244 190 234 258 AIDS-related 272 242 210 146 154 132 120 98 94 All other illnessesb 699 724 788 874 814 826 1,361 981 881
Suicide 169 168 199 200 213 220 216 197 201 Homicide 39 48 49 49 56 55 57 40 55 Drug/alcohol intoxication 35 37 23 22 37 57 41 58 50 Accident 23 31 26 34 30 33 29 26 31 Other/unknown 38 37 25 37 17 41 68 101 57 Note: Data may have been revised from previously published statistics to reflect updated information. Executions are not included; for data on executions, see Capital Punishment, 2009 - Statistical Tables. aIn 2007, a high number of cases were missing cause of death information. These cases were classified as all other illnesses.bIncludes other specified (such as cerebrovascular disease, influenza, cirrhosis, and other non-leading natural causes of death) as well as unspecified illnesses. See Methodology for details on illness classifications.Source: Bureau of Justice Statistics, Deaths in Custody Reporting Program (DCRP).
TAble 14Percent of state prisoner deaths, by cause of death, 2001–2009Cause of death 2001 2002 2003 2004 2005 2006 2007a 2008 2009
All causes 100% 100% 100% 100% 100% 100% 100% 100% 100%Illness 89.4% 89.1% 89.8% 89.1% 88.9% 87.5% 87.9% 87.8% 88.4%
Heart disease 26.0 27.3 25.9 26.8 26.8 26.7 20.9 24.9 25.5Cancer 21.8 22.1 24.5 22.7 24.1 23.6 17.7 24.9 26.7Liver disease 7.8 6.8 7.8 7.0 7.5 7.5 5.6 6.8 7.6AIDS-related 9.5 8.2 6.6 4.7 4.9 4.1 3.5 2.8 2.8All other illnessesb 24.3 24.6 24.9 27.9 25.7 25.5 40.1 28.4 25.9
Suicide 5.9% 5.7% 6.3% 6.4% 6.7% 6.8% 6.4% 5.7% 5.9%Homicide 1.4 1.6 1.5 1.6 1.8 1.7 1.7 1.2 1.6Drug/alcohol intoxication 1.2 1.3 0.7 0.7 1.2 1.8 1.2 1.7 1.5Accident 0.8 1.1 0.8 1.1 0.9 1.0 0.9 0.8 0.9Other/unknown 1.3 1.3 0.8 1.2 0.5 1.3 2.0 2.9 1.7Note: Data may have been revised from previously published statistics to reflect updated information. Executions are not included; for data on executions, see Capital Punishment, 2009 - Statistical Tables.aIn 2007, a high number of cases were missing cause of death information. These cases were classified as all other illnesses.bIncludes other specified (such as cerebrovascular disease, influenza, cirrhosis, and other non-leading natural causes of death) as well as unspecified illnesses. See Methodology for details on illness classifications.Source: Bureau of Justice Statistics, Deaths in Custody Reporting Program (DCRP).

December 2011 17
TAble 15 Mortality rate per 100,000 state prisoners, by cause of death, 2001–2009Cause of death 2001 2002 2003 2004 2005 2006 2007a 2008 2009
All causes 242 245 258 252 253 250 257 260 257Illness 217 218 232 225 225 218 226 228 227
Heart disease 63 67 67 68 68 67 54 65 66Cancer 53 54 63 57 61 59 46 65 69Liver disease 19 17 20 18 19 19 14 18 19AIDS-related 23 20 17 12 12 10 9 7 7All other illnessesb 59 60 64 71 65 64 103 74 66
Suicide 14 14 16 16 17 17 16 15 15Homicide 3 4 4 4 4 4 4 3 4Drug/alcohol intoxication 3 3 2 2 3 4 3 4 4Accident 2 3 2 3 2 3 2 2 2Other/unknown 3 3 2 3 1 3 5 8 4Note: Data are from the Prisoners at Midyear series. Data may have been revised from previously published statistics to reflect updated information. State prison mortality rates are per 100,000 inmates held in state custody (including private facilities) on June 30th of each year. The mortality rates presented are not adjusted for age, sex, race, geographic location, or any other characteristic. Executions are not included; for data on executions, see Capital Punishment, 2009 - Statistical Tables.aIn 2007, a high number of cases were missing cause of death information. These cases were classified as all other illnesses.bIncludes other specified (such as cerebrovascular disease, influenza, cirrhosis, and other non-leading natural causes of death) as well as unspecified illnesses. See Methodology for details on illness classifications.Sources: Bureau of Justice Statistics, Deaths in Custody Reporting Program (DCRP), National Prisoner Statistics (NPS).
TAble 16 Number of state prisoner deaths, by selected characteristics, 2001–2009Characteristic 2001 2002 2003 2004 2005 2006 2007 2008 2009
Total 2,877 2,942 3,165 3,129 3,172 3,239 3,392 3,452 3,408 Sex
Male 2,777 2,823 3,037 2,993 3,029 3,109 3,255 3,289 3,258 Female 100 119 126 136 143 130 137 163 150
Race/Hispanic origina
White 1,343 1,404 1,596 1,549 1,625 1,630 1,719 1,823 1,768 Black/African American 1,164 1,156 1,204 1,182 1,164 1,151 1,226 1,157 1,196 Hispanic/Latino 324 332 311 332 324 404 384 399 372 American Indian or Alaska Native 25 20 24 29 32 25 34 36 31 Asian 4 12 8 15 12 8 11 18 20 Hawaiian or other Pacific Islander 7 7 7 5 6 2 7 4 4Otherb 5 5 6 16 4 15 2 15 3
Age17 or younger 2 1 3 1 1 1 1 3 0 18–24 86 63 57 82 78 60 69 67 69 25–34 258 249 277 256 245 251 226 222 210 35–44 657 663 669 620 601 562 515 469 468 45–54 897 909 983 964 1,009 1,062 1,031 1,063 1,036 55 or older 972 1,055 1,171 1,204 1,237 1,302 1,550 1,628 1,624
Note: Detail may not sum to total due to missing data. Data may have been revised from previously published statistics to reflect updated information. Executions are not included; for data on executions, see Capital Punishment, 2009 - Statistical Tables. aExcludes persons of Hispanic/Latino origin unless specified.bIncludes persons of two or more races or unknown race.Source: Bureau of Justice Statistics, Deaths in Custody Reporting Program (DCRP).

18 Prison and Jail Deaths in Custody, 2000-2009 - Statistical Tables
TAble 17 Percent of state prisoner deaths, by selected characteristics, 2001–2009Characteristic 2001 2002 2003 2004 2005 2006 2007 2008 2009
Total 100% 100% 100% 100% 100% 100% 100% 100% 100%Sex
Male 96.5% 96.0% 96.0% 95.7% 95.5% 96.0% 96.0% 95.3% 95.6%Female 3.5 4.0 4.0 4.3 4.5 4.0 4.0 4.7 4.4
Race/Hispanic origina
White 46.7% 47.7% 50.5% 49.5% 51.2% 50.3% 50.7% 52.8% 51.9%Black/African American 40.5 39.3 38.0 37.8 36.7 35.5 36.1 33.5 35.1Hispanic/Latino 11.3 11.3 9.8 10.6 10.2 12.5 11.3 11.6 10.9American Indian or Alaska Native 0.9 0.7 0.8 0.9 1.0 0.8 1.0 1.0 0.9Asian 0.1 0.4 0.2 0.5 0.4 0.3 0.3 0.5 0.6Hawaiian or other Pacific Islander 0.2 0.2 0.2 0.2 0.2 0.1 0.2 0.1 0.1Otherb 0.2 0.2 0.2 0.5 0.1 0.5 0.1 0.4 0.1
Age17 or younger 0.1% 0.0% 0.1% 0.0% 0.0% 0.0% 0.0% 0.1% 0.0%18–24 3.0 2.1 1.8 2.6 2.5 1.9 2.0 1.9 2.025–34 9.0 8.5 8.8 8.2 7.7 7.7 6.7 6.4 6.235–44 22.8 22.5 21.1 19.8 18.9 17.4 15.2 13.6 13.745–54 31.2 30.9 31.1 30.8 31.8 32.8 30.4 30.8 30.455 or older 33.8 35.9 37.0 38.5 39.0 40.2 45.7 47.2 47.7
Note: Detail may not sum to total due to missing data. Data may have been revised from previously published statistics to reflect updated information. Executions are not included; for data on executions, see Capital Punishment, 2009 - Statistical Tables.aExcludes persons of Hispanic/Latino origin unless specified.bIncludes persons of two or more races or unknown race.Source: Bureau of Justice Statistics, Deaths in Custody Reporting Program (DCRP).

December 2011 19
TAble 18 Estimated number of state prisoners in custody at midyear, by selected characteristics, 2001–2009Characteristic 2001 2002 2003 2004 2005 2006 2007 2008 2009
Total 1,187,800 1,200,000 1,225,700 1,239,700 1,252,500 1,297,300 1,321,800 1,327,100 1,326,600Sex
Male 1,110,400 1,121,300 1,143,100 1,155,500 1,165,400 1,205,100 1,227,300 1,232,200 1,232,600Female 77,500 78,700 82,600 84,200 87,200 92,200 94,500 95,000 94,100
Race/Hispanic origina
White 425,100 433,800 458,900 453,500 462,800 475,100 479,800 485,800 483,000Black/African American 531,000 524,500 523,500 519,000 517,500 523,300 531,200 536,900 532,700Hispanic/Latino 160,600 165,900 170,000 180,100 183,300 190,000 196,100 187,000 191,200American Indian or Alaska Native 11,500 12,200 12,600 13,000 13,300 14,300 14,000 14,400 14,700Asian 5,100 5,400 5,600 5,700 5,900 6,000 6,000 5,500 6,000Hawaiian or other Pacific Islander 2,100 2,100 2,200 2,200 2,100 2,200 2,200 2,400 2,500Otherb 8,800 9,500 9,900 10,200 10,400 11,400 12,600 12,400 13,200
Age17 or younger 2,900 3,000 2,500 2,500 2,600 2,800 2,700 2,500 2,50018–24 217,900 216,900 215,800 218,200 220,500 227,600 232,200 189,200 189,10025–34 403,300 401,000 408,200 412,900 418,400 429,600 440,600 434,000 433,90035–44 362,900 362,900 364,100 368,200 372,000 384,500 391,800 391,500 391,40045–54 153,200 163,800 176,500 178,600 180,400 185,600 190,000 232,200 232,10055 or older 47,900 52,600 57,700 58,300 58,900 60,400 62,000 77,900 77,800
Note: Detail may not sum to total due to missing data. The estimated number of state prisoners presented is rounded. Mortality rates based on this population (tables 19 and 24) are calculated on exact numbers. Data are from the Prisoners at Midyear series. Data may have been revised from previously published statistics to reflect updated information. Executions are not included; for data on executions, see Capital Punishment, 2009 - Statistical Tables. aExcludes persons of Hispanic/Latino origin unless specified.bIncludes persons of two or more races or unknown race.Sources: Bureau of Justice Statistics, Deaths in Custody Reporting Program (DCRP), National Prisoner Statistics (NPS).

20 Prison and Jail Deaths in Custody, 2000-2009 - Statistical Tables
TAble 19 Mortality rate per 100,000 state prisoners, by selected characteristics, 2001–2009Characteristic 2001 2002 2003 2004 2005 2006 2007 2008 2009
Total 242 245 258 252 253 250 257 260 257Sex
Male 250 252 266 259 260 258 265 267 264Female 129 151 153 162 164 141 145 172 160
Race/Hispanic origina
White 316 324 348 342 351 343 358 375 366Black/African American 219 220 230 228 225 220 231 216 225Hispanic/Latino 202 200 183 184 177 213 196 213 195American Indian or Alaska Native 219 164 193 224 240 175 244 251 212Asian 78! 225 144! 265 204 135! 185! 327 338Hawaiian or other Pacific Islander 335! 335! 325! 237! 288! 92! 328! 167! 165!Otherb 57! 53! 61! 158 39! 132 16! 122 23!
Age17 or younger 70! 33! 122! 40! 40! 36! 38! 122! 018–24 39 29 26 38 35 26 30 35 3725–34 64 62 68 62 59 58 51 51 4835–44 181 183 184 168 162 146 131 120 12045–54 586 555 557 540 560 572 543 458 44755 or older 2,031 2,007 2,033 2,067 2,102 2,157 2,500 2,092 2,088
Note: Detail may not sum to total due to missing data. Data are from the Prisoners at Midyear series. Data may have been revised from previously published statistics to reflect updated information. State prison mortality rates are per 100,000 inmates held in state custody (including private facilities) on June 30th of each year. Prisoner demographic subgroup frequencies are estimated based on the June 30th National Prisoner Statistics (NPS) custody counts, demographic data from the National Corrections Reporting Program (NCRP), and the 2004 Survey of Inmates in State Correctional Facilities (SISCF). The mortality rates presented are calculated on exact population numbers. The mortality rates presented are not adjusted for age, sex, race, geographic location, or any other characteristic. Executions are not included; for data on executions, see Capital Punishment, 2009 - Statistical Tables. ! Interpret with caution; too few cases to provide a reliable rate. See Methodology for more information.aExcludes persons of Hispanic/Latino origin unless specified.bIncludes persons of two or more races or unknown race.Sources: Bureau of Justice Statistics, Deaths in Custody Reporting Program (DCRP), National Prisoner Statistics (NPS) and 2004 Survey of Inmates in State Correctional Facilities (SISCF).
December 2011 21
TAble 20 Number of state prisoner deaths, by state, 2001–2009State 2001 2002 2003 2004 2005 2006 2007 2008 2009
All statesa 2,877 2,942 3,165 3,129 3,172 3,239 3,392 3,452 3,408Alabama 87 85 92 65 66 61 54 75 80Alaskab 8 14 4 8 4 6 10 14 7Arizona 65 74 84 66 78 72 61 77 85Arkansas 42 31 39 34 38 37 46 41 50California 288 337 333 348 366 424 395 369 392Colorado 42 51 47 39 54 31 42 38 49Connecticutb 30 30 36 33 40 25 27 32 29Delawareb 16 15 19 13 19 13 15 15 12Florida 182 183 221 227 244 261 249 291 278Georgia 93 105 126 90 122 103 143 128 125Hawaiib 7 13 8 8 8 5 13 14 11Idaho 17 9 12 12 13 18 15 18 13Illinois 86 72 80 98 72 94 104 71 75Indiana 47 50 56 56 45 70 54 70 91Iowa 9 11 13 15 19 12 17 21 14Kansas 21 22 32 30 19 16 20 24 20Kentucky 36 41 45 42 43 46 46 69 57Louisiana 72 78 70 94 89 74 83 117 108Maine 6 7 2 4 0 6 1 2 4Maryland 70 71 67 78 57 62 57 69 56Massachusetts 29 20 30 25 37 39 39 29 29Michigan 114 113 127 138 140 138 117 99 148Minnesota 13 15 13 6 13 9 13 17 12Mississippi 36 33 58 53 63 59 77 54 52Missouri 57 65 65 77 68 66 78 87 81Montana 6 5 12 12 12 5 5 9 3Nebraska 7 8 7 7 8 8 12 6 11Nevada 27 25 24 31 28 23 39 35 35New Hampshire 2 9 6 6 8 6 6 5 9New Jersey 69 60 59 57 61 70 60 66 58New Mexico 11 15 11 16 18 15 22 30 21New York 175 185 198 153 170 131 148 133 142North Carolina 67 60 74 95 69 90 99 117 86North Dakota 3 1 1 1 1 1 0 0 0Ohio 115 114 91 126 121 106 123 101 120Oklahoma 51 64 71 53 75 80 98 88 79Oregon 24 33 25 34 37 40 36 31 28Pennsylvania 122 126 147 161 149 124 150 145 165Rhode Islandb 3 8 8 7 2 8 9 6 7South Carolina 71 45 63 50 75 65 72 83 49South Dakota 4 11 11 5 4 4 8 6 4Tennessee 51 61 97 71 76 84 73 74 69Texas 408 396 383 395 351 443 436 469 426Utah 5 9 10 11 8 7 7 11 17Vermontb 3 3 5 1 6 7 1 3 3Virginia 71 69 93 86 84 78 103 86 87Washington 29 30 32 37 45 36 39 35 44West Virginia 17 8 15 13 10 13 19 19 18Wisconsin 49 50 41 40 29 45 43 44 42Wyoming 5 3 2 2 8 3 8 9 7
Federal prisoners 301 335 346 333 388 328 368 399 376Note: Data may have been revised from previously published statistics to reflect updated information. Executions are not included; for data on executions, see Capital Punishment, 2009 - Statistical Tables. aIncludes 9 prisoner deaths reported by the District of Columbia in 2001. As of December 30, 2001, sentenced felons from the District of Columbia were the responsibility of the Federal Bureau of Prisons (BOP). bPrisons and jails form one integrated system.Sources: Bureau of Justice Statistics, Deaths in Custody Reporting Program (DCRP) for state data, National Prisoner Statistics (NPS) for federal data through 2006, and personal communication with the Federal Bureau of Prisons (BOP) for federal data after 2006.

22 Prison and Jail Deaths in Custody, 2000-2009 - Statistical Tables
TAble 21 Mortality rate per 100,000 state prisoners, by state, 2001–2009
State 2001 2002 2003 2004 2005 2006 2007 2008 2009All statesa 243 245 258 252 253 250 257 260 257
Alabama 365 318 333 261 257 251 222 302 316Alaskab 192! 333 90 ! 179 ! 87 ! 123 ! 195 ! 369 183 !Arizona 240 254 275 212 240 202 165 246 274Arkansas 378 266 343 269 302 293 349 310 377California 178 213 207 213 223 242 224 218 230Colorado 247 284 252 198 266 144 187 214 275Connecticutb 167 157 187 175 210 128 135 155 146Delawareb 225 220 280 192 275 183 205 208 174Florida 253 249 286 277 287 295 268 327 304Georgia 205 226 268 185 256 200 269 237 253Hawaiib 137 ! 252 151 ! 146 ! 140 ! 86 ! 230 412 324 !Idaho 323 163 ! 214 204 212 278 207 334 248Illinois 188 167 185 221 161 207 228 155 165Indiana 242 250 265 256 197 293 215 295 370Iowa 111 ! 135 ! 155 174 221 139 193 240 166Kansas 246 251 354 327 210 179 225 277 232Kentucky 313 337 354 336 324 298 301 537 435Louisiana 369 394 354 480 454 364 398 559 527Maine 355 ! 385 ! 102! 201 ! 0 296 ! 47 ! 92 ! 197 !Maryland 293 293 278 328 246 270 249 301 246Massachusetts 278 199 298 249 364 365 352 256 255Michigan 236 226 256 284 286 272 231 196 314Minnesota 208 223 178 77 ! 155 100 ! 144 217 136Mississippi 242 214 365 334 382 360 454 419 433Missouri 202 218 215 256 219 219 261 290 266Montana 227 ! 171 ! 420 490 451 172 ! 172 ! 552 ! 175 !Nebraska 181 ! 200 ! 169 ! 173 ! 186 ! 176 ! 269 134 ! 242 !Nevada 271 248 236 280 251 185 299 269 275New Hampshire 86 ! 363 ! 242 ! 247 ! 326 ! 216 ! 205 ! 173 ! 316 !New Jersey 241 208 224 217 231 239 229 261 268New Mexico 191 ! 252 179 ! 252 274 220 337 871 602New York 252 275 300 236 269 206 232 214 238North Carolina 211 181 220 270 188 239 256 298 211North Dakota 296 ! 87 ! 88 ! 82 ! 74 ! 72 ! 0 0 0Ohio 254 254 200 285 273 226 248 209 245Oklahoma 232 288 326 235 326 347 415 488 433Oregon 226 291 210 268 290 306 269 230 203Pennsylvania 333 321 363 401 363 291 333 323 335Rhode Islandb 90 ! 221 ! 226 ! 200 ! 59 ! 219 ! 236! 154 ! 189 !South Carolina 331 203 270 214 325 284 308 339 201South Dakota 150 ! 373 ! 363 ! 158 ! 118 ! 111 ! 237 ! 181 ! 118 !Tennessee 290 343 501 365 391 433 377 515 481Texas 278 268 247 253 224 280 274 335 308Utah 121 ! 219 ! 227 ! 242 ! 168 ! 141 ! 138 ! 213 ! 329Vermontb 216 ! 146 ! 349 ! 49 ! 304 ! 327 ! 46 ! 190 ! 195 !Virginia 231 223 299 277 271 251 324 265 280Washington 189 187 198 218 272 209 214 205 262West Virginia 489 225! 392 326 252! 304 409 383 360Wisconsin 246 244 188 181 133 202 188 196 189Wyoming 329 ! 191 ! 126 ! 115 ! 407 ! 148 ! 399 ! 735 ! 454 !
Federal prisoners 220 232 227 208 233 192 211 229 181Note: Data are from the Prisoners at Midyear series. Data may have been revised from previously published statistics to reflect updated information. State prison mortality rates are per 100,000 inmates held in state custody (including private facilities) on June 30th of each year. Federal prison mortality rates are per 100,000 inmates held in federal custody on December 31st of each year. Deaths in federal prisons are not included in the calculation of rates across all states. The state-specific population frequencies used in these calculations are the latest available, and may not reflect updates that have been made to the total number of state prison inmates. Mortality rates between states are not directly comparable because rates are not adjusted for age, sex, race, geographic location, or any other characteristic. Executions are not included; for data on executions, see Capital Punishment, 2009 - Statistical Tables. ! Interpret with caution; too few cases to provide a reliable rate. See Methodology for more information.aIncludes 9 prisoner deaths reported by the District of Columbia in 2001. As of December 31, 2001, sentenced felons from the District of Columbia were the responsibility of the Federal Bureau of Prisons (BOP). bPrisons and jails form one integrated system.Sources: Bureau of Justice Statistics, Deaths in Custody Reporting Program (DCRP) for state data, National Prisoner Statistics (NPS) for federal data through 2006, and personal communication with the Federal Bureau of Prisons (BOP) for federal data after 2006.

December 2011 23
TAble 22 Number of state prisoner deaths, by cause of death and selected characteristics, 2001–2009
IllnessHeart disease Cancer
Liver disease
AIDS-related
All other illnessesa Suicide Homicide
Drug/alcohol intoxication Accident
Other/unknownCharacteristic
Total 7,368 6,661 2,056 1,468 7,948 1,783 448 360 263 421Sex
Male 7,110 6,425 1,992 1,391 7,514 1,697 444 346 253 398Female 258 236 64 77 434 85 4 14 10 22
Race/Hispanic originb
White 3,881 3,564 1,081 294 3,845 1,042 208 205 143 194Black/African American 2,804 2,440 513 998 2,993 375 149 67 79 182Hispanic/Latino 593 538 404 164 974 295 77 72 32 33American Indian or Alaska Native 48 54 41 5 64 20 4 11 5 4Asian 14 23 4 3 27 26 4 2 2 3Hawaiian or other Pacific Islander 11 10 8 0 7 10 1 0 1 1Otherc 13 15 3 3 20 8 4 3 0 2
Age17 or younger 0 1 0 0 2 8 1 0 1 018–24 69 26 5 14 141 259 58 22 22 1525–34 365 169 39 194 497 594 123 103 57 5335–44 1,162 783 332 639 1,362 527 132 132 70 8545–54 2,099 2,141 1,058 487 2,528 293 92 78 63 11555 or older 3,671 3,536 622 134 3,411 102 42 25 50 150
Note: Detail may not sum to total due to missing data. Data may have been revised from previously published statistics to reflect updated information. Executions are not included; for data on executions, see Capital Punishment, 2009 - Statistical Tables. aIn 2007, a high number of cases were missing cause of death information. These cases were classified as all other illnesses.bExcludes persons of Hispanic/Latino origin unless specified.cIncludes persons of two or more races or unknown race.Source: Bureau of Justice Statistics, Deaths in Custody Reporting Program (DCRP).

24 Prison and Jail Deaths in Custody, 2000-2009 - Statistical Tables
TAble 23Percent of state prisoner deaths, by cause of death and selected characteristics, 2001-2009
IllnessHeart disease Cancer
Liver disease
AIDS-related
All other illnessesa Suicide Homicide
Drug/alcohol intoxication Accident
Other/unknownCharacteristic
Total 100% 100% 100% 100% 100% 100% 100% 100% 100% 100%Sex
Male 96.5% 96.5% 96.9% 94.8% 94.5% 95.2% 99.1% 96.1% 96.2% 94.5%Female 3.5 3.5 3.1 5.2 5.5 4.8 0.9 3.9 3.8 5.2
Race/Hispanic originb
White 52.7% 53.5% 52.6% 20.0% 48.4% 58.4% 46.4% 56.9% 54.4% 46.1%Black/ African American 38.1 36.6 25.0 68.0 37.7 21.0 33.3 18.6 30.0 43.2Hispanic/Latino 8.0 8.1 19.6 11.2 12.3 16.5 17.2 20.0 12.2 7.8American Indian or Alaska Native 0.7 0.8 2.0 0.3 0.8 1.1 0.9 3.1 1.9 1.0Asian 0.2 0.3 0.2 0.2 0.3 1.5 0.9 0.6 0.8 0.7Hawaiian or other Pacific Islander 0.1 0.2 0.4 0.0 0.1 0.6 0.2 0.0 0.4 0.2Otherc 0.2 0.2 0.2 0.2 0.4 0.4 0.9 0.8 0.0 0.5
Age17 or younger 0.0% 0.0% 0.0% 0.0% 0.0% 0.4% 0.2% 0.0% 0.4% 0.0%18–24 0.9 0.4 0.2 1.0 1.8 14.5 12.9 6.1 8.4 3.625–34 5.0 2.5 1.9 13.2 6.3 33.3 27.5 28.6 21.7 12.635–44 15.8 11.8 16.1 43.5 17.1 29.6 29.5 36.7 26.6 20.245–54 28.5 32.1 51.5 33.2 31.8 16.4 20.5 21.7 24.0 27.355 or older 49.8 53.1 30.3 9.1 42.9 5.7 9.4 6.9 19.0 35.6
Note: Detail may not sum to total due to missing data. Data may have been revised from previously published statistics to reflect updated information. Executions are not included; for data on executions, see Capital Punishment, 2009 - Statistical Tables. aIn 2007, a high number of cases were missing cause of death information. These cases were classified as all other illnesses.bExcludes persons of Hispanic/Latino origin unless specified.cIncludes persons of two or more races or unknown race.Source: Bureau of Justice Statistics, Deaths in Custody Reporting Program (DCRP).

December 2011 25
TAble 24 Mortality rate per 100,000 state prisoners, by cause of death and selected characteristics, 2001–2009
IllnessHeart disease Cancer
Liver disease
AIDS-related
All other illnessesa Suicide Homicide
Drug/alcohol intoxication Accident
Other/unknownCharacteristic
Total 65 59 18 13 70 16 4 3 2 4Sex
Male 67 61 19 13 71 16 4 3 2 4Female 33 30 8 10 55 11 1! 2 1! 3
Race/Hispanic originb
White 93 86 26 7 93 25 5 5 3 5Black/African American 59 52 11 21 63 8 3 1 2 4Hispanic/Latino 37 33 25 10 60 18 5 4 2 2American Indian or Alaska Native 40 45 34 4! 54 17 3! 9! 4! 3!Asian 28 45 8! 6! 53 51 8! 4! 4! 6!Hawaiian or other Pacific Islander 56! 51! 41! 0 36! 51! 5! 0 5! 5!Otherc 13 15 3! 3! 20 8! 4! 3! 0 2!
Age17 or younger 0 4! 0 0 9! 34! 4! 0 4! 018–24 4 1 -- 1 7 13 3 1 1 125–34 10 5 1 5 13 16 3 3 2 135–44 34 23 10 19 40 16 4 4 2 345–54 124 127 63 29 149 17 5 5 4 755 or older 664 639 113 24 617 18 8 5 9 27
Note: Detail may not sum to total due to missing data. Data are from the Prisoners at Midyear series. Data may have been revised from previously published statistics to reflect updated information. State prison mortality rates are per 100,000 inmates held in state custody (including private facilities) on June 30th of each year. Prisoner demographic subgroup frequencies are estimated based on the June 30th National Prisoner Statistics (NPS) custody counts, demographic data from the National Corrections Reporting Program (NCRP), and the 2004 Survey of Inmates in State Correctional Facilities (SISCF). The mortality rates presented are calculated on exact population numbers. The mortality rates presented are not adjusted for age, sex, race, geographic location, or any other characteristic. Executions are not included; for data on executions, see Capital Punishment, 2009 - Statistical Tables. -- Less than 0.5.! Interpret with caution; too few cases to provide a reliable rate. See Methodology for more information.aIn 2007, a high number of cases were missing cause of death information. These cases were classified as all other illnesses.bExcludes persons of Hispanic/Latino origin unless specified.cIncludes persons of two or more races or unknown race.Sources: Bureau of Justice Statistics, Deaths in Custody Reporting Program (DCRP), National Prisoner Statistics (NPS) and 2004 Survey of Inmates in State Correctional Facilities (SISCF).
26 Prison and Jail Deaths in Custody, 2000-2009 - Statistical Tables
TAble 25 Number of state prisoner deaths, by cause of death and state, 2001–2009
Illness
All causes
Heart disease Cancer
Liver disease
AIDS-related
All other illnessesa Suicide Homicide
Drug/alcohol intoxication Accident
Other/unknownState
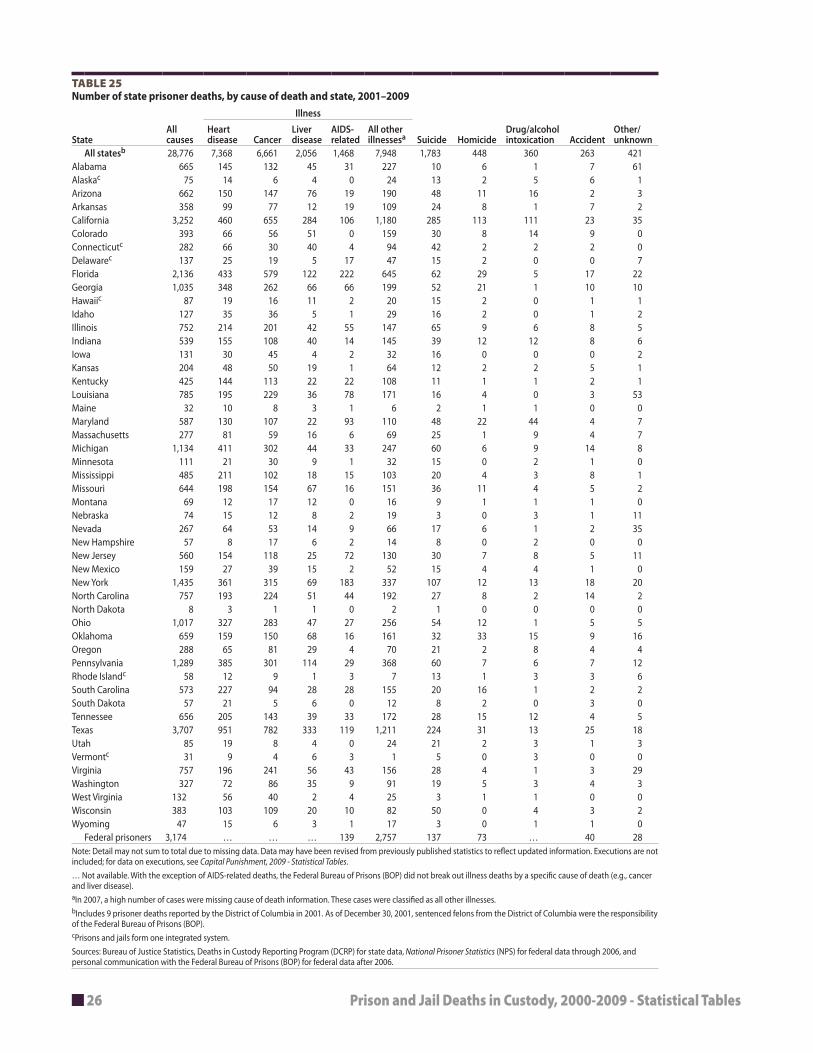
All statesb 28,776 7,368 6,661 2,056 1,468 7,948 1,783 448 360 263 421Alabama 665 145 132 45 31 227 10 6 1 7 61 Alaskac 75 14 6 4 0 24 13 2 5 6 1Arizona 662 150 147 76 19 190 48 11 16 2 3Arkansas 358 99 77 12 19 109 24 8 1 7 2California 3,252 460 655 284 106 1,180 285 113 111 23 35 Colorado 393 66 56 51 0 159 30 8 14 9 0 Connecticutc 282 66 30 40 4 94 42 2 2 2 0 Delawarec 137 25 19 5 17 47 15 2 0 0 7 Florida 2,136 433 579 122 222 645 62 29 5 17 22 Georgia 1,035 348 262 66 66 199 52 21 1 10 10 Hawaiic 87 19 16 11 2 20 15 2 0 1 1Idaho 127 35 36 5 1 29 16 2 0 1 2Illinois 752 214 201 42 55 147 65 9 6 8 5 Indiana 539 155 108 40 14 145 39 12 12 8 6 Iowa 131 30 45 4 2 32 16 0 0 0 2Kansas 204 48 50 19 1 64 12 2 2 5 1Kentucky 425 144 113 22 22 108 11 1 1 2 1Louisiana 785 195 229 36 78 171 16 4 0 3 53 Maine 32 10 8 3 1 6 2 1 1 0 0 Maryland 587 130 107 22 93 110 48 22 44 4 7 Massachusetts 277 81 59 16 6 69 25 1 9 4 7 Michigan 1,134 411 302 44 33 247 60 6 9 14 8 Minnesota 111 21 30 9 1 32 15 0 2 1 0 Mississippi 485 211 102 18 15 103 20 4 3 8 1Missouri 644 198 154 67 16 151 36 11 4 5 2Montana 69 12 17 12 0 16 9 1 1 1 0 Nebraska 74 15 12 8 2 19 3 0 3 1 11 Nevada 267 64 53 14 9 66 17 6 1 2 35 New Hampshire 57 8 17 6 2 14 8 0 2 0 0 New Jersey 560 154 118 25 72 130 30 7 8 5 11 New Mexico 159 27 39 15 2 52 15 4 4 1 0 New York 1,435 361 315 69 183 337 107 12 13 18 20 North Carolina 757 193 224 51 44 192 27 8 2 14 2North Dakota 8 3 1 1 0 2 1 0 0 0 0 Ohio 1,017 327 283 47 27 256 54 12 1 5 5 Oklahoma 659 159 150 68 16 161 32 33 15 9 16 Oregon 288 65 81 29 4 70 21 2 8 4 4 Pennsylvania 1,289 385 301 114 29 368 60 7 6 7 12 Rhode Islandc 58 12 9 1 3 7 13 1 3 3 6 South Carolina 573 227 94 28 28 155 20 16 1 2 2South Dakota 57 21 5 6 0 12 8 2 0 3 0 Tennessee 656 205 143 39 33 172 28 15 12 4 5 Texas 3,707 951 782 333 119 1,211 224 31 13 25 18 Utah 85 19 8 4 0 24 21 2 3 1 3Vermontc 31 9 4 6 3 1 5 0 3 0 0 Virginia 757 196 241 56 43 156 28 4 1 3 29 Washington 327 72 86 35 9 91 19 5 3 4 3West Virginia 132 56 40 2 4 25 3 1 1 0 0 Wisconsin 383 103 109 20 10 82 50 0 4 3 2Wyoming 47 15 6 3 1 17 3 0 1 1 0
Federal prisoners 3,174 … … … 139 2,757 137 73 … 40 28Note: Detail may not sum to total due to missing data. Data may have been revised from previously published statistics to reflect updated information. Executions are not included; for data on executions, see Capital Punishment, 2009 - Statistical Tables. … Not available. With the exception of AIDS-related deaths, the Federal Bureau of Prisons (BOP) did not break out illness deaths by a specific cause of death (e.g., cancer and liver disease).aIn 2007, a high number of cases were missing cause of death information. These cases were classified as all other illnesses.bIncludes 9 prisoner deaths reported by the District of Columbia in 2001. As of December 30, 2001, sentenced felons from the District of Columbia were the responsibility of the Federal Bureau of Prisons (BOP).cPrisons and jails form one integrated system.Sources: Bureau of Justice Statistics, Deaths in Custody Reporting Program (DCRP) for state data, National Prisoner Statistics (NPS) for federal data through 2006, and personal communication with the Federal Bureau of Prisons (BOP) for federal data after 2006.

December 2011 27
TAble 26 Mortality rate per 100,000 state prisoners, by cause of death and state, 2001–2009
IllnessAllcauses
Heart disease Cancer
Liver disease
AIDS-related
All other illnessesa Suicide Homicide
Drug/alcohol intoxication Accident
Other/unknownState
All statesb 253 65 59 18 13 70 16 4 3 2 4Alabama 292 64 58 20 14 100 4! 3! 0! 3! 27Alaskac 190 35 15! 10! 0 61 33 5! 13! 15! 3!Arizona 232 53 51 27 7 67 17 4! 6 1! 1!Arkansas 321 89 69 11 17 98 21 7! 1! 6! 2!California 217 31 44 19 7 79 19 8 7 2 2Colorado 227 38 32 29 0 92 17 5! 8 5! 0Connecticutc 162 38 17 23 2! 54 24 1! 1! 1! 0Delawarec 218 40 30 8! 27 75 24 3! 0 0 11!Florida 284 58 77 16 30 86 8 4 1! 2 3Georgia 233 79 59 15 15 45 12 5 0! 2! 2!Hawaiic 193 42 36 24! 4! 44 33 4! 0 2! 2!Idaho 241 66 68 9! 2! 55 30 4! 0 2! 4!Illinois 186 53 50 10 14 36 16 2! 1! 2! 1!Indiana 266 76 53 20 7 72 19 6 6 4! 3!Iowa 171 39 59 5! 3! 42 21 0 0 0 3!Kansas 256 60 63 24 1! 80 15 3! 3! 6! 1!Kentucky 358 121 95 19 19 91 9! 1! 1! 2! 1!Louisiana 434 108 127 20 43 95 9 2! 0 2! 29Maine 179 56! 45! 17! 6! 34! 11! 6! 6! 0 0Maryland 279 62 51 10 44 52 23 10 21 2! 3!Massachusetts 291 85 62 17 6! 72 26 1! 9! 4! 7!Michigan 255 92 68 10 7 56 13 1! 2! 3 2!Minnesota 156 30 42 13! 1! 45 21 0 3! 1! 0Mississippi 355 154 75 13 11 75 15 3! 2! 6! 1!Missouri 239 73 57 25 6 56 13 4! 1! 2! 1!Montana 304 53 75 53 0 71 40! 4! 4! 4! 0Nebraska 193 39 31 21! 5! 49 8! 0 8! 3! 29!Nevada 258 62 51 14 9! 64 16 6! 1! 2! 34New Hampshire 241 34! 72 25! 8! 59 34! 0 8! 0 0New Jersey 234 64 49 10 30 54 13 3! 3! 2! 5!New Mexico 311 53 76 29 4 102 29 8! 8! 2! 0New York 248 62 54 12 32 58 18 2 2 3 3North Carolina 232 59 69 16 13 59 8 2! 1! 4 1!North Dakota 70! 26! 9! 9! 0 18! 9! 0 0 0 0Ohio 244 78 68 11 6 61 13 3 0! 1! 1!Oklahoma 339 82 77 35 8 83 16 17 8 5! 8Oregon 255 57 72 26 4! 62 19 2! 7! 4! 4!Pennsylvania 340 101 79 30 8 97 16 2! 2! 2! 3Rhode Islandc 179 37 28! 3! 9! 22! 40 3! 9! 9! 19!South Carolina 275 109 45 13 13 74 10 8 0! 1! 1!South Dakota 197 73 17! 21! 0 42 28! 7! 0 10! 0Tennessee 407 127 89 24 20 107 17 9 7 2! 3!Texas 273 70 58 25 9 89 16 2 1 2 1Utah 201 45 19! 9! 0 57 50 5! 7! 2! 7!Vermontc 198 58! 26! 38! 19! 6! 32! 0 19! 0 0Virginia 269 70 86 20 15 55 10 1! 0! 1! 10Washington 218 48 57 23 6! 61 13 3! 2! 3! 2!West Virginia 350 149 106 5! 11! 66 8! 3! 3! 0 0Wisconsin 196 53 56 10 5! 42 26 0 2! 2! 1!Wyoming 310 99 40! 20! 7! 112 20! 0 7! 7! 0
Federal prisoners 213 … … … 9 185 9 5 … 3 2Note: Detail may not sum to total due to missing data. Data are from the Prisoners at Midyear series. Data may have been revised from previously published statistics to reflect updated information. State prison mortality rates are per 100,000 inmates held in state custody (including private facilities) on June 30th of each year. Federal prison mortality rates are per 100,000 inmates held in federal custody on December 31st of each year. Deaths in federal prisons are not included in the calculation of rates across all states. The state-specific population frequencies used in these calculations are the latest available, and may not reflect updates that have been made to the total number of state prison inmates. The mortality rates presented are not adjusted for age, sex, race, geographic location, or any other characteristic. Executions are not included; for data on executions, see Capital Punishment, 2009 - Statistical Tables. … Not available. With the exception of AIDS-related deaths, the Federal Bureau of Prisons (BOP) did not break out illness deaths by a specific cause of death (e.g., cancer and liver disease).! Interpret with caution; too few cases to provide a reliable rate. See Methodology for more information.aIn 2007, a high number of cases were missing cause of death information. These cases were classified as all other illnesses.bIncludes 9 prisoner deaths reported by the District of Columbia in 2001. As of December 30, 2001, sentenced felons from the District of Columbia were the responsibility of the Federal Bureau of Prisons (BOP).cPrisons and jails form one integrated system.Sources: Bureau of Justice Statistics, Deaths in Custody Reporting Program (DCRP) for state data, National Prisoner Statistics (NPS) for federal data through 2006, and personal communication with the Federal Bureau of Prisons (BOP) for federal data after 2006.

28 Prison and Jail Deaths in Custody, 2000-2009 - Statistical Tables
MethodologyThe Deaths in Custody Reporting Program (DCRP) is an annual data collection conducted by the Bureau of Justice Statistics (BJS). The DCRP collects data on persons who have died while in the custody of the 50 state departments of correction and in the roughly 3,000 local adult jail jurisdictions nationwide.
The DCRP began in 2000 under the Death in Custody Reporting Act of 2000 (P.L. 106-297). It is the only national statistical collection that obtains detailed information about deaths in adult correctional facilities. BJS uses DCRP data to report national trends in the number and causes (or manners) of deaths occurring in state prison or local jail custody.
Information about decedents collected for the DCRP include selected demographic characteristics, such as sex, age, race, and Hispanic ethnicity; facility type of death (prison or jail); date of admission; conviction status; admission offense; circumstances surrounding the death, including cause of death, time and location of death; and information on whether an autopsy was conducted and the availability of results to the respondent. In cases of illness deaths, the DCRP collects data on whether the decedent had a pre-existing condition and whether he or she received medical treatment for this condition prior to death.
Executions are collected under the separate BJS Capital Punishment series. Data on executions are accessible through the BJS website at www.bjs.gov.
Statistics presented in this report are current as of September 1, 2011. DCRP mortality data are accessible on the BJS website.
For more information on mortality in correctional settings, see Mortality in Local Jails, 2000-2007 (NCJ 222988, BJS Web, July 2010); Medical Causes of Death in State Prisons, 2001-2004 (NCJ 216340, BJS Web, January 2007); and Suicide and Homicide in State Prisons and Local Jails (NCJ 210036, BJS Web, August 2005).
Scope of the DCRPThe prison component of the DCRP collects data on inmate deaths occurring in the 50 state departments of corrections while inmates are in the physical custody of prison officials. Starting in 2001 and annually thereafter, BJS has collected DCRP data directly from state prison systems. Since beginning the collection, BJS has maintained a 100% response rate from the state prison system respondents to the DCRP.
The DCRP’s jail component includes inmate deaths occurring in all local adult jail jurisdictions nationwide. A jail jurisdiction is a legal entity that has responsibility for managing jail facilities. Jail jurisdictions typically operate at the county level, in which a sheriff or executive manages the local facilities. The DCRP data identify the facilities in which a jail death occurs, but the DCRP data are arrayed at the jail jurisdiction level. BJS defines a jail as locally-operated correctional facility that confines persons before or after adjudication for more than 72 hours. BJS does not include temporary lockups in its definition of jail facilities. Typically, there is one facility per jail jurisdiction, but the 2006 Census of Jail Facilities found that 15% of jail jurisdictions had multiple facilities under its authority. See the BJS website for more information.
The jail universe file includes all currently operating jails as well as jails that have closed, consolidated, or otherwise eliminated operations. The most recent jail universe, constructed in 2009, identified 2,825 jurisdictions, representing 3,223 jail facilities. Of these, 2,755 (97.5%) participated in the 2009 DCRP.
Administration of the DCRP The DCRP collection forms are provided annually to state prison and local jail respondents. Respondents provide an aggregate count of the number of deaths occurring during the referenced calendar year, in addition to individual-level decedent data. For state prison system respondents, aggregate counts are obtained through the NPS-4 (available at http://bjs.gov/content/pub/pdf/nps410.pdf). For local jails, aggregate counts of deaths are obtained through the CJ-9A (available at http://bjs.gov/content/pub/pdf/cj9a10.pdf).
BJS requests jail administrators to provide statistics about their population and bookings through the summary form in addition to a death count. All jails, even those with no deaths to report, a scenario that applies to about 80% of jails in any given year, are asked to complete the annual summary form.
BJS obtains a separate report describing the decedent’s characteristics and the circumstances surrounding the death for each death occurring in a state prison or local jail. The survey forms used to obtain data on each prison and jail death are available on the BJS website:
�� Prison deaths (NPS-4A form): http://bjs.gov/content/pub/pdf/nps4a10.pdf
�� Jail deaths (CJ-9): http://bjs.gov/content/pub/pdf/cj910.pdf
State prison and local jail respondents may submit individual records on decedents at any time during a collection cycle through a BJS web-based collection system, accessible on the BJS website at https://bjsdcrp.rti.org/.

December 2011 29
BJS has modified the survey forms slightly over time. Most of the changes have been minor and intended to clarify existing questions and ease respondent burden.
In 2001, additional items on medical treatment in prisons and jails were added to collect data on medical treatment received by the inmate prior to death. Text boxes added to the forms in 2008 allowed respondents to elaborate on deaths due to intoxication, suicide, and inmate-involved homicide. Such fields had previously only been available for deaths due to illness, accident, homicide not caused by other inmates, and other unspecified reasons. BJS removed a question measuring the conviction status of an inmate (since more than 99% of prison inmates were convicted at the time of their deaths). BJS also changed the survey layout in 2009 to simplify the progression through questions related to autopsies. The revised item instructed respondents to complete the entire form after autopsy results were available (rather than submitting an initially-incomplete form where autopsy results were pending).
Determining eligibility for reporting to the DCRPIn the DCRP, custody refers to the holding of an inmate in a facility or while a correctional authority maintains a chain of custody over an inmate. For instance, if a jail transports an ill inmate to a hospital for medical services and that inmate dies while in the chain of custody of the jail, that death is counted as a death in the DCRP. A death that occurs when an inmate is not in the custody of correctional authority is considered to be beyond the scope of the DCRP. This includes deaths of inmates on escape status and those serving time on community corrections (probation, parole, or home-electronic monitoring). Legal executions are also beyond the scope of the DCRP. For more information on executions, see the Capital Punishment series on the BJS website.
BJS instructs both state prison and local jail officials to determine first whether the inmate was in the physical custody of the jurisdiction at the time of death, regardless of the reason an inmate was being held. For state prisons, this includes the deaths of inmates held in any private prison facility under contract to the department of corrections as well as deaths in any of their state-operated facilities, including halfway houses, prison camps or farms, training or treatment centers, and prison hospitals.
BJS instructs state prison officials to exclude deaths of inmates who were transferred to local jails due to overcrowding or other reasons but who were still serving a prison term. The DCRP obtains information about these deaths through the jail reports. For jails, deaths in custody includes deaths of inmates who were temporarily out of the physical custody of a facility but within the chain of custody of the jail. Typically, these include deaths of jail inmates
who have been transferred to offsite facilities that care for critically-ill persons. Over half (51%) of jail inmate deaths occurred in medical facilities outside of the jail facility between 2000 and 2009.
Custody is further complicated by the dual law enforcement and jail administration functions of some sheriffs’ departments. As a result, some deaths reported as jail deaths actually occurred before the jail had custody of the decedent. BJS excludes these deaths in the process of arrest by using information about the circumstances surrounding the death.
Identifying and excluding duplicates Duplicate death records may exist in DCRP due to overlapping correctional populations as well as overlapping duties within correctional facilities. For example, a jail jurisdiction may have more than one reporting unit responsible for reporting data to BJS, or a jail may be holding a state prison inmate. Multiple reporting entities may report the same death, or state prison systems may report on the death of an inmate who was transferred to a local jail but was serving a prison sentence at the time.
BJS’ process for identifying duplicate death records is as follows: First, BJS reconciles the aggregate summary counts of deaths occurring during a calendar year with the number of individual death records obtained from a reporting jurisdiction. When BJS identifies discrepancies, it contacts reporting jurisdictions for clarification. Second, BJS performs record-matching to identify duplicate records within jurisdictions. The matching is based on inmate name and date of birth, date of death, and date of admission to the facility. BJS’ review of death records between 2000 and 2009 found 83 jail and 294 prison deaths to be duplicates or beyond the scope of DCRP. These records were excluded from all DCRP analyses.
Cause of death information
BJS aims to collect accurate information about the cause of death. The instructions for completing the DCRP tell respondents to report death information as determined by an autopsy or other official medical death investigation. Death by intoxication, accident, suicide, and homicide are considered discrete causes of death. While there is a distinction between manner and cause of death from a medico-legal standpoint, no such distinction is made in the DCRP. When reporting deaths due to accident or homicide, BJS requests respondents to describe the events surrounding these deaths. BJS added a text field to the survey forms so that respondents could provide more detailed information on suicide and intoxication deaths. See Administration of the DCRP.

30 Prison and Jail Deaths in Custody, 2000-2009 - Statistical Tables
Due to the variation in deaths caused by illness, respondents report the cause of death as determined by an autopsy. These causes are later converted by clinical data specialists into standard medical codes according to the World Health Organization’s International Statistical Classification of Diseases and Related Health Problems, Tenth Revision (ICD-10).
Other BJS Sources of Correctional Mortality DataBJS maintains other data collections on correctional mortality and deaths in the process of arrest. These other collections include—
�� Capital Punishment, which provides data on legal executions. (See the BJS website for further discussion of executions.)
�� The National Prisoner Statistics (NPS), which prior to the establishment of the DCRP, annually collected aggregate counts of deaths in state and federal prisons. Prior to 2007, the NPS collected aggregate counts of deaths occurring in state and federal prisons, and counts of deaths by broad categories of death, specifically deaths due to execution, illness, AIDS, suicide, accident, homicide, and other causes. After 2007, the Federal Bureau of Prisons (BOP) continued to submit the counts of deaths for these broad categories while state prison officials no longer provided counts of deaths via the NPS. (See the BJS website for further discussion of the NPS.)
�� The Census of Jail Inmates, which is conducted every five to six years and provides counts of inmate deaths in local jails. (See the BJS website for further discussion of the Census of Jail Inmates).
�� The Survey of Jails in Indian Country (SJIC), which provides aggregate counts of the number of deaths occurring in Indian country correctional facilities operated by tribal authorities or the U.S. Department of Interior’s Bureau of Indian Affairs. (See the BJS website for further discussion of the SJIC.)
�� Arrest-Related Deaths (ARD), which obtains data on deaths occurring during the process of arrest. BJS relies on state-level respondents to provide details of deaths occurring during arrest. (See the BJS website for further discussion of ARD.)
Reported statistics Mortality rates are calculated per 100,000 inmates where the denominators provide estimates of the number of person-years of exposure in custody in institutional corrections. The mortality rate for state prisons is calculated as the number of deaths per year divided by the midyear
state prison population in custody multiplied by 100,000. Midyear custody counts for state prisons provide estimates for person-years for prison populations. BJS uses data from its National Prisoner Statistics (NPS) collection to provide midyear custody counts of prisoners. For more information on the NPS, see the BJS website.
The mortality rate in local jails is calculated as the number of deaths per year divided by the average daily jail inmate population (ADP) multiplied by 100,000. The ADP for local jails is defined as the average daily number of jail inmates held in a jail jurisdiction during a calendar year. The use of the ADP as the denominator for jail mortality rates is based on the high turnover and daily fluctuation in local jail populations. The ADP better reflects the number of inmate days per year than does any one day count.
The jail ADP also reflects the annual number of admissions and mean length of stay, and can be expressed as the product of these two values. When mean length of stay is expressed in years, the ADP is equivalent to the number of person-years spent by jail inmates during a given year. Starting in 2002, BJS collected the ADP directly from respondents using the summary form, CJ-9. Prior to 2002, BJS calculated the jail ADP by taking the average of the January 1st count and the December 31st count from the reference year, which is a proxy measure for ADP.
Both denominators provide data for annualizing mortality rates, which are calculated separately for each key statistic, by group or by characteristic. The annualized mortality rates by cause of death in state prisons and local jails are comparable to annual crude mortality rates reported by the National Center for Health Statistics (NCHS). NCHS calculates crude mortality rates as the number of events for a period (e.g., year) divided by the population estimate at the midpoint of the period. For general population mortality statistics, NCHS employs the midyear population as an approximation to the average population exposed to risk of death during any given year. (For more information, see Siegal, J. & Swanson, D. (2004), The Methods and Materials of Demography, Second Edition, San Diego, CA: Elsevier Academic Press, p. 269.)
The crude mortality rates reported in the DCRP annual statistical tables for particular segments of the incarcerated population are not directly comparable to the crude mortality rates within the (non-incarcerated) general population. In addition, the crude mortality rates in state prisons are not directly comparable to those of local jails. Since the age, race, and sex composition of the general population differs from that in state prisons and local jails, and since mortality is correlated with age, race, and sex, the crude mortality rates in state prisons and local jails should not be compared directly to one another, or to the general population.

December 2011 31
Estimating inmate population characteristics for use in calculating mortality rates by demographic subgroupsBJS does not obtain annual data for all demographic characteristics of prison and jail inmates in all jurisdictions. BJS uses data from sources other than the DCRP to estimate the nationwide age, race, and sex composition of state prison and local jail inmate populations. These data sources consist primarily of periodic surveys of inmates in custody in prisons and jails. The inmate characteristic distributions obtained from these surveys are applied to denominators (counts of inmates or ADP) to estimate the number of inmates in each demographic subgroup.
BJS estimated the demographic distribution of the state prison population data from the National Prisoner Statistics (NPS) and National Corrections Reporting Program (NCRP) collections. For a discussion on the methodology for obtaining estimates of the age, race, and sex distributions of state prisoners, see Prisoners in 2009 (NCJ 231675, BJS web, December 2010).
Prior BJS reports of mortality rates for state prison inmates used demographic distributions derived from BJS’ 2004 Survey of Inmates in State and Federal Correctional Facilities (SISCF). Consequently, the state prison mortality rates shown in these tables may differ from previously published rates. A rate comparison between the two sources showed very little difference in the resultant mortality rates. In most instances, the rates either matched or nearly matched.
To estimate the distributions of demographic attributes of the ADP for local jail inmates, BJS used data from several surveys to generate distributions of age, race, and sex, and applied these distributions to the ADP. BJS’ Annual Survey of Jails (ASJ) provided estimates of the race, ethnic, and sex distribution of local jail inmates for each year of the DCRP collection and applied these to each year’s ADP from the DCRP to estimate the average daily population of persons in these demographic categories. For more information on the ASJ, see Jail Inmates at Midyear 2010 - Statistical Tables (NCJ 233431, BJS Web, April 2011).
Unlike sex and race/ethnicity data, BJS does not annually collect data on age in jail populations. BJS obtained estimates of the age distribution of jail inmates from the 2002 Survey of Inmates in Local Jails (SILJ) and the 2007 and 2008-09 National Inmate Survey (NIS) available on the BJS website. For more information about jail inmates, see Profile of Jail Inmates, 2002 (NCJ 201932, BJS Web, July 2004).
To estimate the age distribution of the jail inmate population, we first obtained an estimate of the number of
jail inmates under age 18 from the Annual Survey of Jails (ASJ). Between 2000 and 2010, the number of jail inmates under age 18 has ranged between 6,100 and 7,615, according to Jail Inmates at Midyear 2010 (table 6). By applying the annual percentage of jail inmates under age 18 to the annual average daily jail inmate population, we estimated the average daily population of jail inmates under age 18.
To estimate the age distribution of adult jail inmates, BJS used data from the Survey of Inmates in Local Jails (SILJ) and the National Inmate Survey (NIS). We used the SILJ estimates to cover the period from 2000 to 2006 and the NIS estimates to cover the period from 2007 to 2009. In each case, we applied the percentages associated with each age category to the adults in jail average daily population.
Random error and suppression The DCRP data on deaths in state prisons and local jails are not subject to sampling error. However, mortality data from a complete or near complete enumeration may be subject to random error. Following Brillinger and NCHS, “the number of deaths that actually occurred may be considered as one of a large series of possible results that could have arisen under the same set of circumstances” (NCHS, 2007). The random variation can be large when the number of deaths is small; hence, considerable caution is warranted when interpreting statistics based on small numbers of deaths. According to NCHS standards, mortality rates based on fewer than 100 deaths per year should be interpreted with caution. For more information on vital rates, see Brillinger, D. R. (1986), “The natural variability of vital rates and associated statistics,” Biometrics 42:693-734. See also the National Vital Statistics Reports. Deaths: Final Data for 2007, Centers for Disease Control and Prevention, National Center for Health Statistics, retrieved from http://www.cdc.gov/nchs/data/nvsr/nvsr58/nvsr58_19.pdf.
Further following NCHS and Brillinger, we quantify random variation by assuming that the appropriate underlying distribution is a Poisson probability distribution. This provides for a computationally simple as well as reasonable approach to estimate variances for mortality statistics when the probability of dying is low. We calculated variances based on the assumption of a Poisson process and from these variances calculated relative random error estimates, which are comparable to relative standard error, in that the relative random error is the ratio of random error derived from the Poisson variance to the number of deaths. Following NCHS, when the relative random error exceeded 30%, we flagged estimated mortality rates due to the instability of the rate.

32 Prison and Jail Deaths in Custody, 2000-2009 - Statistical Tables
Survey performance issuesSurvey administration and modifications to the survey form generated data for years 2007 through 2009 that may not be wholly compatible with prior DCRP data. In 2007, state prison officials categorized a large number of illness deaths as all other illnesses, which led to a high degree of missing data on illness causes of death. In 2008, local jail officials were unable to provide causes of death for 22% of jail inmate deaths. During 2009, BJS made modifications to the collection instruments to improve reporting and reduce burden.
�� Item nonresponse in 2007: The number of illness deaths categorized as all other illnesses was overstated in the 2007 prison death reports. This arose from a high degree of item nonresponse in the text box requesting specific illness designation on the prisoner death form (NPS-4A). Since the “all other illnesses” category included unknown or unspecified illnesses, we were able to classify deaths within this broad category into specific causes when respondents reported an illness death and the additional cause of death information. Throughout the DCRP prison collection, state departments of corrections respondents were unable to provide more detailed information on an average of 17 illness deaths per year between 2001 and 2006. During 2007, this frequency increased to 173 deaths. Since many of these deaths would likely have been classified in the most common illness categories (e.g., heart disease, cancer, or liver disease), the number of known illness deaths was low in 2007 relative to prior years. The distribution of illness deaths in state prisons during 2007 reflect only the deaths for which specific illness determinations could be made.
�� Item nonresponse in 2008 jail data and unknown cause of death: An abnormally large number of cases were missing a response for cause of death in the 2008 jail file (n=209; 21.8% of all jail deaths in 2008). This coincided with the final year the U.S. Census Bureau acted as the data collection agent for DCRP. In prior years of the DCRP jail data collection, an average of 6% of all deaths were classified as having other or unknown causes of death. For the purposes of this report, BJS categorized the cause of death for these 209 jail deaths from 2008 as other/unknown.
�� 2009 data collection: Prior to the 2009 DCRP collection, BJS reviewed the data collection instrument, data submission procedures, and assessed the communications with DCRP respondents with the goal to reduce burden on respondents. This resulted in modifications to the survey instrument to facilitate the online data collection tool to encourage online response. These modifications led to delays in implementing the collection. As a result, individual death reports were collected retrospectively for the first time, rather than in the year the death occurred.


U.S. Department of Justice Office of Justice Programs Bureau of Justice Statistics Washington, DC 20531
Official Business Penalty for Private Use $300
PRESORTED STANDARDPOSTAGE & FEES PAID
DOJ/BJSPermit No. G-91
NCJ236219
Office of Justice Programs • Innovation • Partnerships • Safer Neighborhoods • www.ojp.gov
The Bureau of Justice Statistics is the statistical agency of the U.S. Department of Justice. James P. Lynch is director.
These Statistical Tables were prepared and verified by Margaret E. Noonan and E. Ann Carson.
Morgan Young edited the report, Morgan Young and Barbara Quinn produced the report, and Jayne Robinson prepared the report for final printing under the supervision of Doris J. James.
December 2011, NCJ 236219
The full text of each report is available in PDF and ASCII formats on the BJS website at www.bjs.gov. Tables are also available in PDF and CSV formats. Related datasets are made available on the National Archive of Criminal Justice Data website at http://www.icpsr.umich.edu/icpsrweb/NACJD/index.jsp.