
PRISA LP - Bay County Prudential... · Effective January 1, 2013, PRISA LP was formed to allow...
77
PRISA LP BAY COUNTY EMPLOYEES’ RETIREMENT SYSTEM | JANUARY 14, 2014 PREI ® Joanna Mulford MANAGING DIRECTOR Jerry Aversano DIRECTOR PRUDENTIAL REAL ESTATE INVESTORS CONFIDENTIAL INFORMATION. NOT FOR FURTHER DISTRIBUTION. REF: DCOI-9CYTDY
Transcript of PRISA LP - Bay County Prudential... · Effective January 1, 2013, PRISA LP was formed to allow...
PRISA LP
BAY COUNTY EMPLOYEES’ RETIREMENT SYSTEM | JANUARY 14, 2014
PREI®
Joanna Mulford
MANAGING DIRECTOR
Jerry Aversano
DIRECTOR
PRUDENTIAL REAL ESTATE INVESTORS
CONFIDENTIAL INFORMATION. NOT FOR FURTHER DISTRIBUTION.
REF: DCOI-9CYTDY

Section I: Prudential Real Estate Investors Overview
Section II: PRISA LP
Appendix U.S. Market Outlook
Supplemental PRISA LP Information
TABLE OF CONTENTS
1
Please see Appendix for important disclosures about PRISA’s structure. Note: Unless otherwise stated, all return information provided in this presentation is before the deduction of Manager Compensation/Fees and is not a guarantee or a reliable indicator of future results. All performance
targets throughout this presentation are made as of September 30, 2013 and are not guaranteed. Effective January 1, 2013, PREI changed its method for calculating income and appreciation returns to one which uses
separate geometric linking for each component, which is consistent with recent changes in Global Investment Performance Standards. As a result, when linking multiple periods' returns, the cumulative effect of cross
compounding may cause the sum of income and appreciation returns to not equal the total return. Please refer to the Appendix for returns after the deduction of Manager Compensation/Fees and for other important
disclosures regarding the information contained herein.
PRUDENTIAL REAL ESTATE INVESTORS
CONFIDENTIAL INFORMATION. NOT FOR FURTHER DISTRIBUTION.
REF: DCOI-9CYTDY

I. PRUDENTIAL REAL ESTATE INVESTORS OVERVIEW
CONFIDENTIAL INFORMATION. NOT FOR FURTHER DISTRIBUTION.
REF: DCOI-9CYTDY

Among the Leaders in Financial Services with a Focus on
Asset Management & Retirement Services
o Managing assets for more than 135 years.
o Among the world's premier financial services institutions.
o Top 10 worldwide institutional money manger1
o Listed on the NYSE. (NYSE: PRU)
o Over $1 trillion of assets under management.2
A Leader in Global Real Estate Investment Management
o PREI offers a broad range of investment vehicles that invest in
private and public market opportunities globally.
o Managing $51.7 billion in gross real estate assets ($38.7 billion net)
on behalf of more than 490 institutional clients worldwide.3
3
PRUDENTIAL FINANCIAL prudential.com
PRUDENTIAL REAL ESTATE INVESTORS prei.com
1 Pensions and Investments, May 27, 2013.
2 As of June 30, 2013.
3As of June 30, 2013.
PRUDENTIAL REAL ESTATE INVESTORS
CONFIDENTIAL INFORMATION. NOT FOR FURTHER DISTRIBUTION.
REF: DCOI-9CYTDY
4
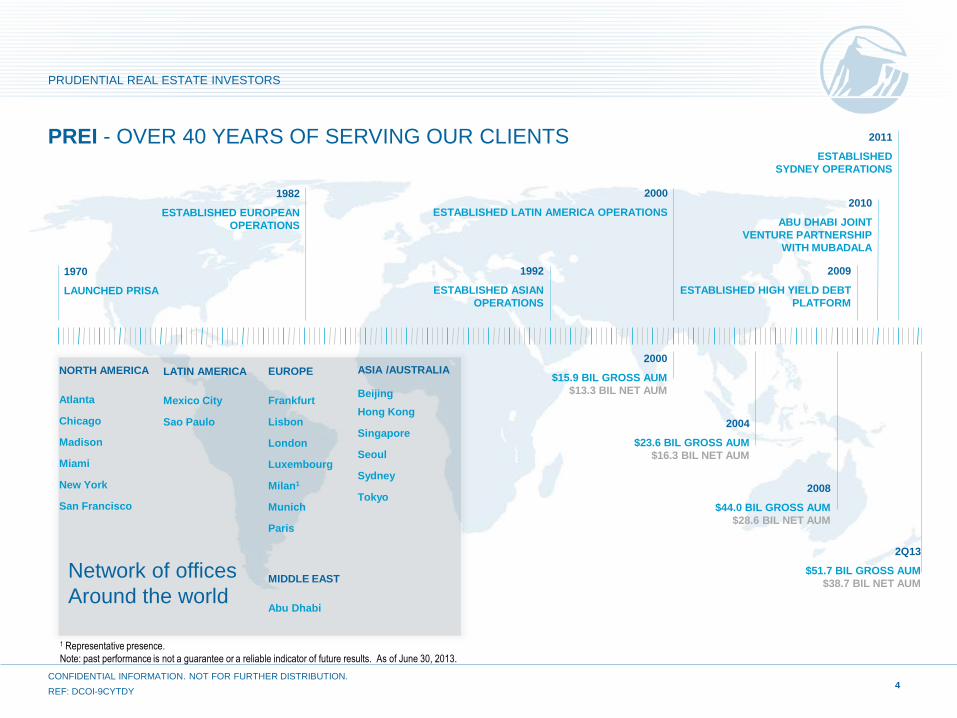
Network of offices
Around the world
PREI - OVER 40 YEARS OF SERVING OUR CLIENTS
1970
LAUNCHED PRISA
1982
ESTABLISHED EUROPEAN
OPERATIONS
1992
ESTABLISHED ASIAN
OPERATIONS
2009
ESTABLISHED HIGH YIELD DEBT
PLATFORM
2000
$15.9 BIL GROSS AUM
$13.3 BIL NET AUM
2004
$23.6 BIL GROSS AUM
$16.3 BIL NET AUM
2008
$44.0 BIL GROSS AUM
$28.6 BIL NET AUM
2000
ESTABLISHED LATIN AMERICA OPERATIONS 2010
ABU DHABI JOINT
VENTURE PARTNERSHIP
WITH MUBADALA
2011
ESTABLISHED
SYDNEY OPERATIONS
NORTH AMERICA
Atlanta
Chicago
Madison
Miami
New York
San Francisco
EUROPE
Frankfurt
Lisbon
London
Luxembourg
Milan1
Munich
Paris
MIDDLE EAST
Abu Dhabi
ASIA /AUSTRALIA
Beijing
Hong Kong
Singapore
Seoul
Sydney
Tokyo
LATIN AMERICA
Mexico City
Sao Paulo
1 Representative presence.
Note: past performance is not a guarantee or a reliable indicator of future results. As of June 30, 2013.
2Q13
$51.7 BIL GROSS AUM
$38.7 BIL NET AUM
PRUDENTIAL REAL ESTATE INVESTORS
CONFIDENTIAL INFORMATION. NOT FOR FURTHER DISTRIBUTION.
REF: DCOI-9CYTDY

EXPERIENCED GLOBAL MANAGEMENT TEAM
Eric Adler
GLOBAL CHIEF EXECUTIVE
OFFICER
Years with Prudential: 3
Real Estate Experience: 18
Mark Chamieh
GLOBAL BUSINESS
DEVELOPMENT
Years with Prudential: 3
Real Estate Experience: 12
Pamela Sinclair
HEAD OF GLOBAL
HUMAN RESOURCES
Years with Prudential: <1
Real Estate Experience: <1
Ken Warman
GLOBAL CHIEF
OPERATING OFFICER
Years with Prudential: 15
Real Estate Experience: 6
Alfonso J. Munk
HEAD OF LATIN AMERICA
Years with Prudential: 2
Real Estate Experience: 15
Andrew Radkiewicz
HEAD OF EMEA &
EUROPEAN DEBT
Years with Prudential: 4
Real Estate Experience: 23
Raimondo Amabile
HEAD OF EMEA
Years with Prudential: 1
Real Estate Experience: 16
Morgan Laughlin
HEAD OF ASIA PACIFIC
Years with Prudential: <1
Real Estate Experience: 14
Jack Taylor
HEAD OF REAL ESTATE
FINANCE
Years with Prudential: 4
Real Estate Experience: 26
Les Lockwood
HEAD OF KEY
ACCOUNTS
Years with Prudential: 43
Real Estate Experience: 25
David Bradford
HEAD OF CLIENT
SERVICES
Years with Prudential: 18
Real Estate Experience: 30
Kevin R. Smith
HEAD OF US BUSINESS
Years with Prudential: 32
Real Estate Experience: 32
Ellen Kendall
GLOBAL PRODUCT
DEVELOPMENT
Years with Prudential: 20
Real Estate Experience: 30
Catherine Marcus
SENIOR PORTFOLIO
MANAGER OF PRISA
Years with Prudential: 15
Real Estate Experience: 26
Note: Effective September 2013.
PRUDENTIAL REAL ESTATE INVESTORS
CONFIDENTIAL INFORMATION. NOT FOR FURTHER DISTRIBUTION.
REF: DCOI-9CYTDY 5
6
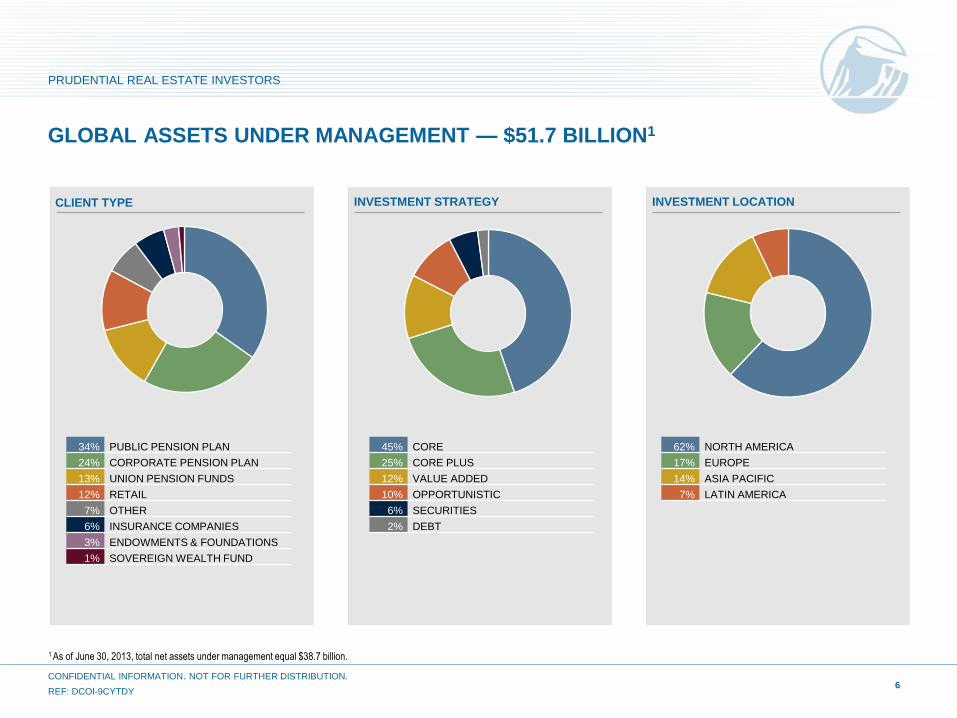
GLOBAL ASSETS UNDER MANAGEMENT — $51.7 BILLION1
1 As of June 30, 2013, total net assets under management equal $38.7 billion.
CLIENT TYPE
INVESTMENT STRATEGY
INVESTMENT LOCATION
PRUDENTIAL REAL ESTATE INVESTORS
CONFIDENTIAL INFORMATION. NOT FOR FURTHER DISTRIBUTION.
REF: DCOI-9CYTDY
34% PUBLIC PENSION PLAN
24% CORPORATE PENSION PLAN
13% UNION PENSION FUNDS
12% RETAIL
7% OTHER
6% INSURANCE COMPANIES
3% ENDOWMENTS & FOUNDATIONS
1% SOVEREIGN WEALTH FUND
45% CORE
25% CORE PLUS
12% VALUE ADDED
10% OPPORTUNISTIC
6% SECURITIES
2% DEBT
62% NORTH AMERICA
17% EUROPE
14% ASIA PACIFIC
7% LATIN AMERICA
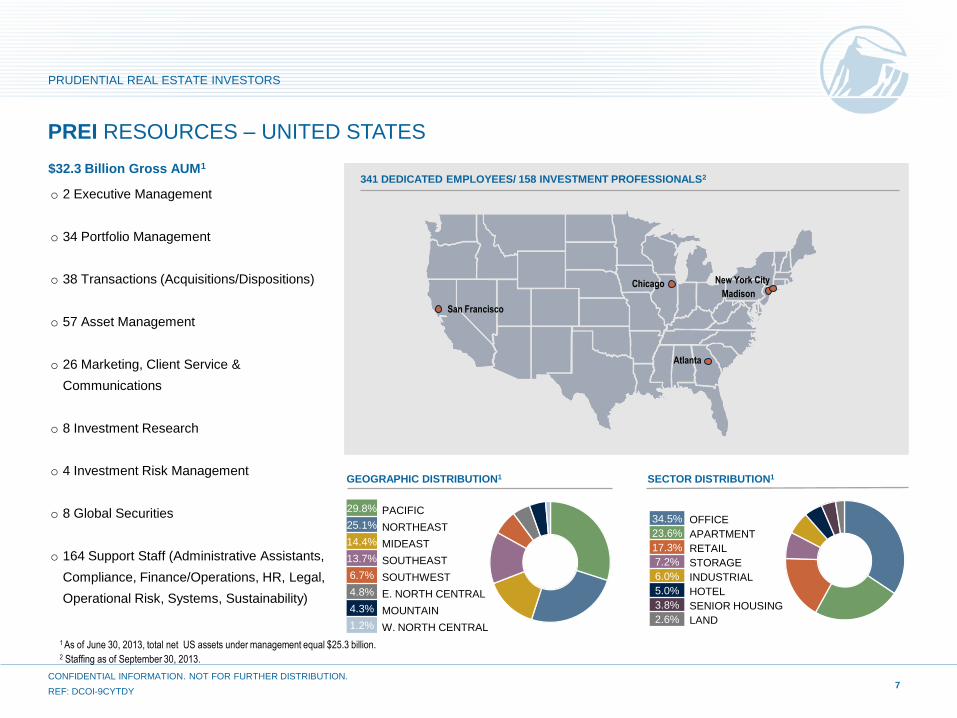
1 As of June 30, 2013, total net US assets under management equal $25.3 billion. 2 Staffing as of September 30, 2013.
PREI RESOURCES – UNITED STATES
$32.3 Billion Gross AUM1
GEOGRAPHIC DISTRIBUTION1
SECTOR DISTRIBUTION1
New York City
Madison Chicago
Atlanta
San Francisco
o 2 Executive Management
o 34 Portfolio Management
o 38 Transactions (Acquisitions/Dispositions)
o 57 Asset Management
o 26 Marketing, Client Service &
Communications
o 8 Investment Research
o 4 Investment Risk Management
o 8 Global Securities
o 164 Support Staff (Administrative Assistants,
Compliance, Finance/Operations, HR, Legal,
Operational Risk, Systems, Sustainability)
341 DEDICATED EMPLOYEES/ 158 INVESTMENT PROFESSIONALS2
29.8% PACIFIC
25.1% NORTHEAST
14.4% MIDEAST
13.7% SOUTHEAST
6.7% SOUTHWEST
4.8% E. NORTH CENTRAL
4.3% MOUNTAIN
1.2% W. NORTH CENTRAL
34.5% OFFICE
23.6% APARTMENT
17.3% RETAIL
7.2% STORAGE
6.0% INDUSTRIAL
5.0% HOTEL
3.8% SENIOR HOUSING
2.6% LAND
7
PRUDENTIAL REAL ESTATE INVESTORS
CONFIDENTIAL INFORMATION. NOT FOR FURTHER DISTRIBUTION.
REF: DCOI-9CYTDY
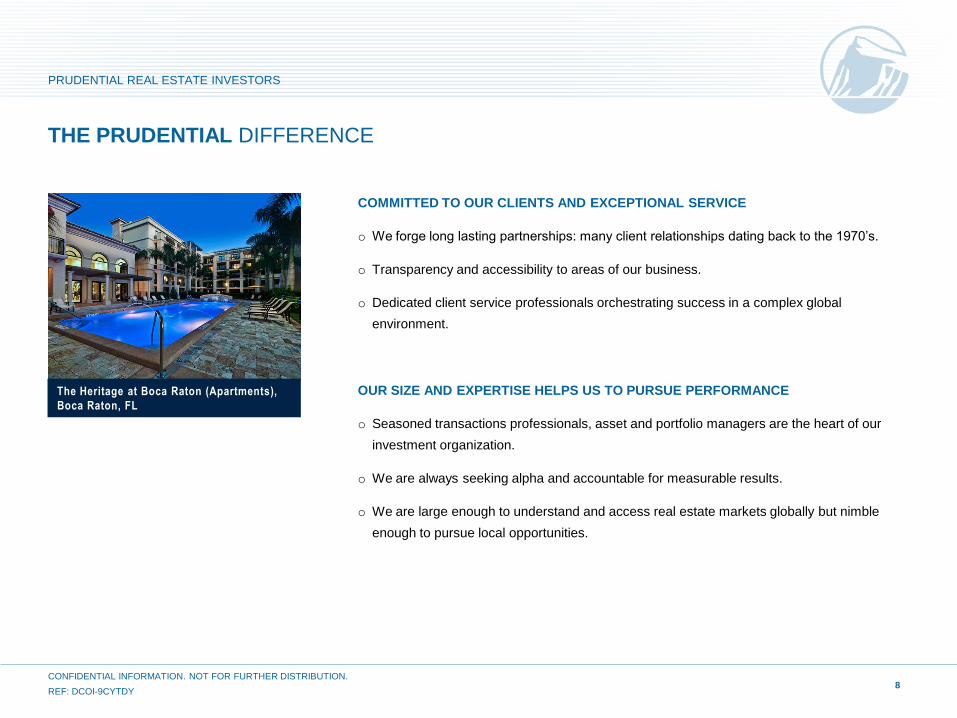
COMMITTED TO OUR CLIENTS AND EXCEPTIONAL SERVICE
o We forge long lasting partnerships: many client relationships dating back to the 1970’s.
o Transparency and accessibility to areas of our business.
o Dedicated client service professionals orchestrating success in a complex global
environment.
OUR SIZE AND EXPERTISE HELPS US TO PURSUE PERFORMANCE
o Seasoned transactions professionals, asset and portfolio managers are the heart of our
investment organization.
o We are always seeking alpha and accountable for measurable results.
o We are large enough to understand and access real estate markets globally but nimble
enough to pursue local opportunities.
8
THE PRUDENTIAL DIFFERENCE
The Heritage at Boca Raton (Apartments),
Boca Raton, FL
PRUDENTIAL REAL ESTATE INVESTORS
CONFIDENTIAL INFORMATION. NOT FOR FURTHER DISTRIBUTION.
REF: DCOI-9CYTDY
9
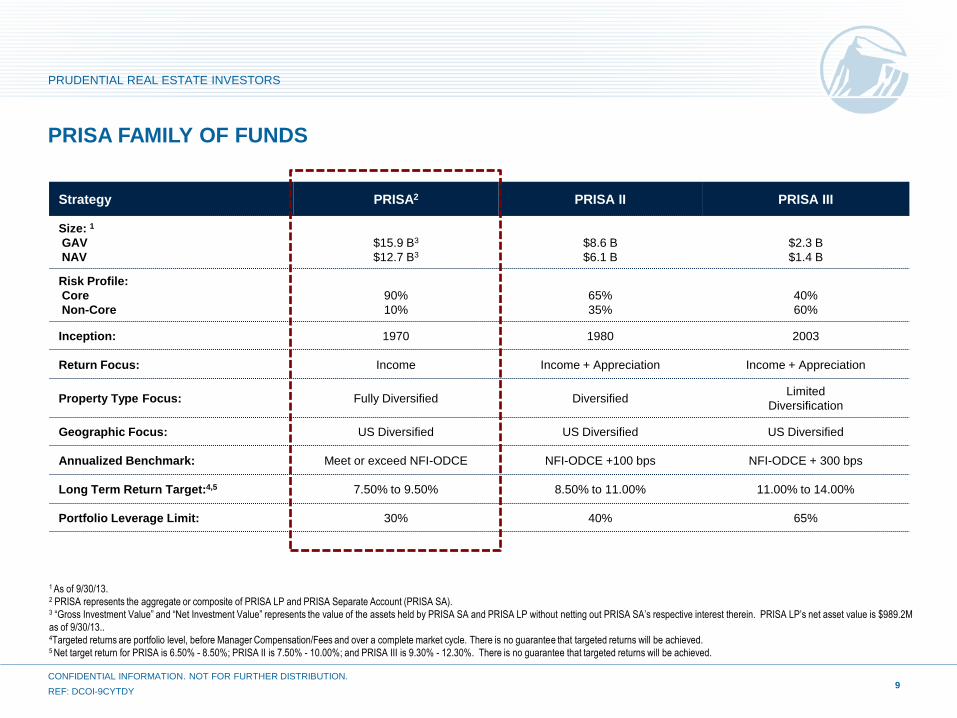
PRISA FAMILY OF FUNDS
Strategy PRISA2 PRISA II PRISA III
Size: 1
GAV
NAV
$15.9 B3
$12.7 B3
$8.6 B
$6.1 B
$2.3 B
$1.4 B
Risk Profile:
Core
Non-Core
90%
10%
65%
35%
40%
60%
Inception: 1970 1980 2003
Return Focus: Income Income + Appreciation Income + Appreciation
Property Type Focus: Fully Diversified Diversified Limited
Diversification
Geographic Focus: US Diversified US Diversified US Diversified
Annualized Benchmark: Meet or exceed NFI-ODCE NFI-ODCE +100 bps NFI-ODCE + 300 bps
Long Term Return Target:4,5 7.50% to 9.50% 8.50% to 11.00% 11.00% to 14.00%
Portfolio Leverage Limit: 30% 40% 65%
1 As of 9/30/13.
2 PRISA represents the aggregate or composite of PRISA LP and PRISA Separate Account (PRISA SA). 3 “Gross Investment Value” and “Net Investment Value” represents the value of the assets held by PRISA SA and PRISA LP without netting out PRISA SA’s respective interest therein. PRISA LP’s net asset value is $989.2M
as of 9/30/13..
4Targeted returns are portfolio level, before Manager Compensation/Fees and over a complete market cycle. There is no guarantee that targeted returns will be achieved. 5 Net target return for PRISA is 6.50% - 8.50%; PRISA II is 7.50% - 10.00%; and PRISA III is 9.30% - 12.30%. There is no guarantee that targeted returns will be achieved.
PRUDENTIAL REAL ESTATE INVESTORS
CONFIDENTIAL INFORMATION. NOT FOR FURTHER DISTRIBUTION.
REF: DCOI-9CYTDY

II. PRISA LP
CONFIDENTIAL INFORMATION. NOT FOR FURTHER DISTRIBUTION.
REF: DCOI-9CYTDY
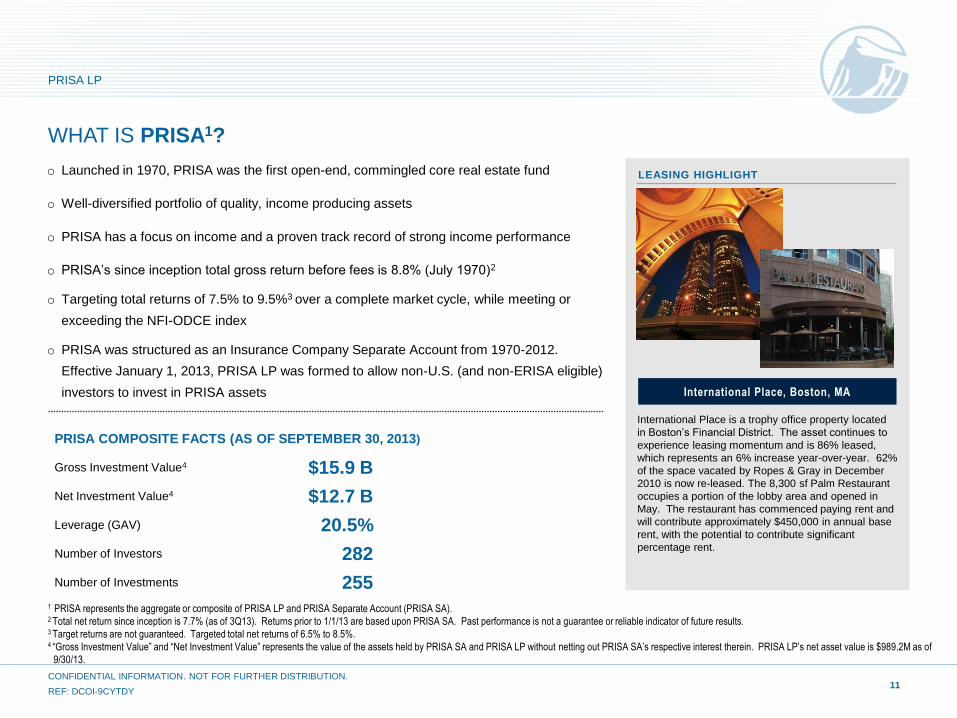
WHAT IS PRISA1?
PRISA COMPOSITE FACTS (AS OF SEPTEMBER 30, 2013)
Gross Investment Value4 $15.9 B
Net Investment Value4 $12.7 B
Leverage (GAV) 20.5%
Number of Investors 282
Number of Investments 255
11
1 PRISA represents the aggregate or composite of PRISA LP and PRISA Separate Account (PRISA SA).
2 Total net return since inception is 7.7% (as of 3Q13). Returns prior to 1/1/13 are based upon PRISA SA. Past performance is not a guarantee or reliable indicator of future results. 3 Target returns are not guaranteed. Targeted total net returns of 6.5% to 8.5%. 4 “Gross Investment Value” and “Net Investment Value” represents the value of the assets held by PRISA SA and PRISA LP without netting out PRISA SA’s respective interest therein. PRISA LP’s net asset value is $989.2M as of
9/30/13.
o Launched in 1970, PRISA was the first open-end, commingled core real estate fund
o Well-diversified portfolio of quality, income producing assets
o PRISA has a focus on income and a proven track record of strong income performance
o PRISA’s since inception total gross return before fees is 8.8% (July 1970)2
o Targeting total returns of 7.5% to 9.5%3 over a complete market cycle, while meeting or
exceeding the NFI-ODCE index
o PRISA was structured as an Insurance Company Separate Account from 1970-2012.
Effective January 1, 2013, PRISA LP was formed to allow non-U.S. (and non-ERISA eligible)
investors to invest in PRISA assets
LEASING HIGHLIGHT
International Place is a trophy office property located
in Boston’s Financial District. The asset continues to
experience leasing momentum and is 86% leased,
which represents an 6% increase year-over-year. 62%
of the space vacated by Ropes & Gray in December
2010 is now re-leased. The 8,300 sf Palm Restaurant
occupies a portion of the lobby area and opened in
May. The restaurant has commenced paying rent and
will contribute approximately $450,000 in annual base
rent, with the potential to contribute significant
percentage rent.
International Place, Boston, MA
PRISA LP
CONFIDENTIAL INFORMATION. NOT FOR FURTHER DISTRIBUTION.
REF: DCOI-9CYTDY

12
PRISA DEDICATED PORTFOLIO MANAGEMENT TEAM
CATHY MARCUS Managing Director
Senior Portfolio Manager
Real Estate Experience:26
Years with Prudential:15
JOANNA MULFORD Managing Director
Portfolio Manager
Real Estate Experience:16
Years with Prudential:23
FRANK GARCIA
Managing Director
Portfolio Manager
Real Estate Experience:20
Years with Prudential:<1
ATLANTA
CHICAGO
SAN FRANCISCO
Kristin Paul
Jennifer Freedman
Carlos Jimenez
Daniel Kane
Lawrence Frank
Mark S. Vande Hey
Michael Mcmains
Christopher Apostal
Ryan Bloom
Dan Sherrard
DEDICATED ASSET MANAGERS
PORTFOLIO MANAGERS
William Anderson
Carly Miller
Sarah Downey
Ana Maria Olmedo
Shaun Trimblett
Bonnie Poeta
Douglas Roberts
Kevin Sullivan
MADISON
Thomas G. Smith
Martha Burrows
Alex Griffin
William Yowell
Note: As of November 2013. A total of 35 dedicated professionals, including 9 from the Operations team.
NICOLE STAGNARO Vice President
Assistant Portfolio Manager
Real Estate Experience:9
Years with Prudential:9
PRISA LP
CONFIDENTIAL INFORMATION. NOT FOR FURTHER DISTRIBUTION.
REF: DCOI-9CYTDY
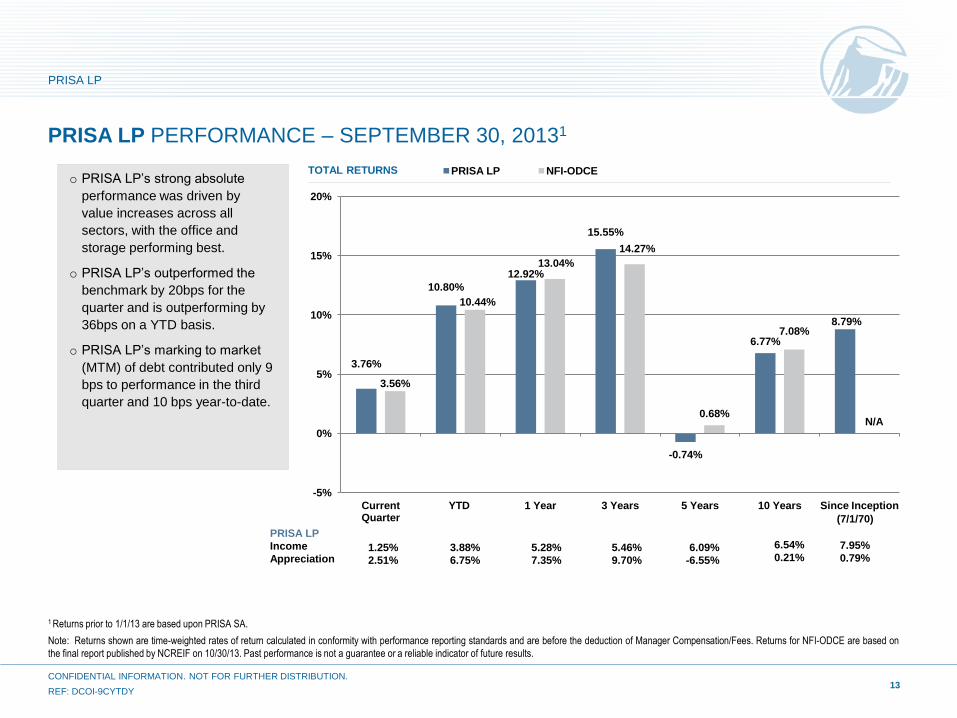
1 Returns prior to 1/1/13 are based upon PRISA SA.
Note: Returns shown are time-weighted rates of return calculated in conformity with performance reporting standards and are before the deduction of Manager Compensation/Fees. Returns for NFI-ODCE are based on
the final report published by NCREIF on 10/30/13. Past performance is not a guarantee or a reliable indicator of future results.
13
TOTAL RETURNS
PRISA LP
Income
Appreciation
(7/1/70)
PRISA LP
CONFIDENTIAL INFORMATION. NOT FOR FURTHER DISTRIBUTION.
REF: DCOI-9CYTDY
3.76%
10.80%
12.92%
15.55%
-0.74%
6.77%
8.79%
3.56%
10.44%
13.04%
14.27%
0.68%
7.08%
N/A
-5%
0%
5%
10%
15%
20%
Current Quarter
YTD 1 Year 3 Years 5 Years 10 Years Since Inception
PRISA LP NFI-ODCE o PRISA LP’s strong absolute
performance was driven by
value increases across all
sectors, with the office and
storage performing best.
o PRISA LP’s outperformed the
benchmark by 20bps for the
quarter and is outperforming by
36bps on a YTD basis.
o PRISA LP’s marking to market
(MTM) of debt contributed only 9
bps to performance in the third
quarter and 10 bps year-to-date.
5.28%
7.35%
5.46%
9.70%
6.54%
0.21% 6.09%
-6.55%
7.95%
0.79% 1.25%
2.51%
3.88%
6.75%
PRISA LP PERFORMANCE – SEPTEMBER 30, 20131
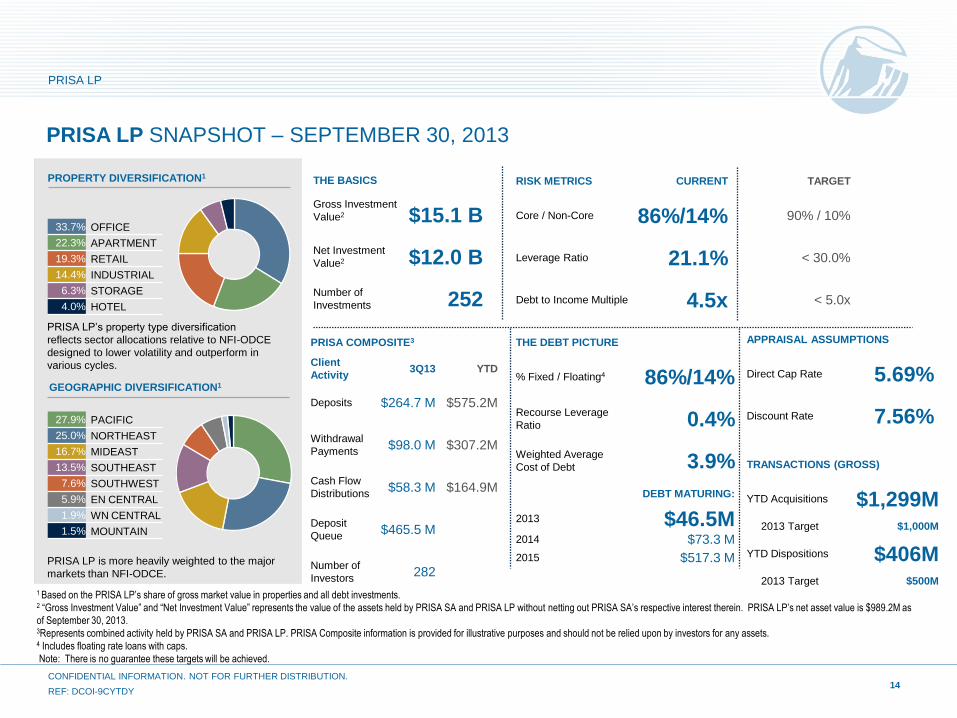
PROPERTY DIVERSIFICATION1
GEOGRAPHIC DIVERSIFICATION1
PRISA LP’s property type diversification
reflects sector allocations relative to NFI-ODCE
designed to lower volatility and outperform in
various cycles.
1 Based on the PRISA LP’s share of gross market value in properties and all debt investments. 2 “Gross Investment Value” and “Net Investment Value” represents the value of the assets held by PRISA SA and PRISA LP without netting out PRISA SA’s respective interest therein. PRISA LP’s net asset value is $989.2M as
of September 30, 2013. 3Represents combined activity held by PRISA SA and PRISA LP. PRISA Composite information is provided for illustrative purposes and should not be relied upon by investors for any assets.
4 Includes floating rate loans with caps.
Note: There is no guarantee these targets will be achieved.
PRISA LP is more heavily weighted to the major
markets than NFI-ODCE.
14
PRISA LP
CONFIDENTIAL INFORMATION. NOT FOR FURTHER DISTRIBUTION.
REF: DCOI-9CYTDY
PRISA LP SNAPSHOT – SEPTEMBER 30, 2013
33.7% OFFICE
22.3% APARTMENT
19.3% RETAIL
14.4% INDUSTRIAL
6.3% STORAGE
4.0% HOTEL
27.9% PACIFIC
25.0% NORTHEAST
16.7% MIDEAST
13.5% SOUTHEAST
7.6% SOUTHWEST
5.9% EN CENTRAL
1.9% WN CENTRAL
1.5% MOUNTAIN
THE BASICS
Gross Investment
Value2
$15.1 B
Net Investment
Value2 $12.0 B
Number of
Investments 252
PRISA COMPOSITE3
Client
Activity 3Q13 YTD
Deposits $264.7 M $575.2M
Withdrawal
Payments $98.0 M $307.2M
Cash Flow
Distributions $58.3 M $164.9M
Deposit
Queue $465.5 M
Number of
Investors 282
THE DEBT PICTURE
% Fixed / Floating4 86%/14%
Recourse Leverage
Ratio 0.4%
Weighted Average
Cost of Debt 3.9%
DEBT MATURING:
2013 $46.5M 2014 $73.3 M
2015 $517.3 M
APPRAISAL ASSUMPTIONS
Direct Cap Rate 5.69%
Discount Rate 7.56%
RISK METRICS CURRENT TARGET
Core / Non-Core 86%/14% 90% / 10%
Leverage Ratio 21.1% < 30.0%
Debt to Income Multiple 4.5x < 5.0x
TRANSACTIONS (GROSS)
YTD Acquisitions $1,299M 2013 Target $1,000M
YTD Dispositions $406M 2013 Target $500M
15
Note: As of September 30, 2013. Past performance is not a guarantee or a reliable indicator of future results.
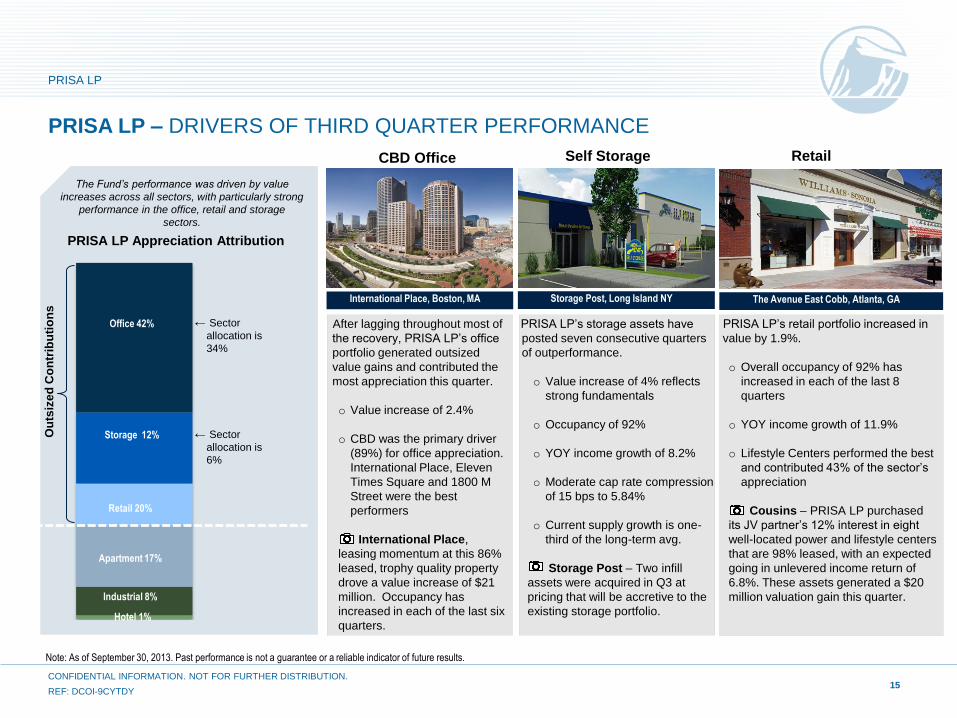
After lagging throughout most of
the recovery, PRISA LP’s office
portfolio generated outsized
value gains and contributed the
most appreciation this quarter.
o Value increase of 2.4%
o CBD was the primary driver
(89%) for office appreciation.
International Place, Eleven
Times Square and 1800 M
Street were the best
performers
International Place,
leasing momentum at this 86%
leased, trophy quality property
drove a value increase of $21
million. Occupancy has
increased in each of the last six
quarters.
International Place, Boston, MA Storage Post, Long Island NY
PRISA LP’s storage assets have
posted seven consecutive quarters
of outperformance.
o Value increase of 4% reflects
strong fundamentals
o Occupancy of 92%
o YOY income growth of 8.2%
o Moderate cap rate compression
of 15 bps to 5.84%
o Current supply growth is one-
third of the long-term avg.
Storage Post – Two infill
assets were acquired in Q3 at
pricing that will be accretive to the
existing storage portfolio.
PRISA LP’s retail portfolio increased in
value by 1.9%.
o Overall occupancy of 92% has
increased in each of the last 8
quarters
o YOY income growth of 11.9%
o Lifestyle Centers performed the best
and contributed 43% of the sector’s
appreciation
Cousins – PRISA LP purchased
its JV partner’s 12% interest in eight
well-located power and lifestyle centers
that are 98% leased, with an expected
going in unlevered income return of
6.8%. These assets generated a $20
million valuation gain this quarter.
The Fund’s performance was driven by value
increases across all sectors, with particularly strong
performance in the office, retail and storage
sectors.
PRISA LP Appreciation Attribution
Office 42%
Storage 12%
← Sector
allocation is
34%
← Sector
allocation is
6%
Ou
tsiz
ed
Co
ntr
ibu
tio
ns
CONFIDENTIAL INFORMATION. NOT FOR FURTHER DISTRIBUTION.
REF: DCOI-9CYTDY
PRISA LP – DRIVERS OF THIRD QUARTER PERFORMANCE
Retail 20%
Apartment 17%
Industrial 8%
Hotel 1%
The Avenue East Cobb, Atlanta, GA
PRISA LP
CBD Office Self Storage Retail
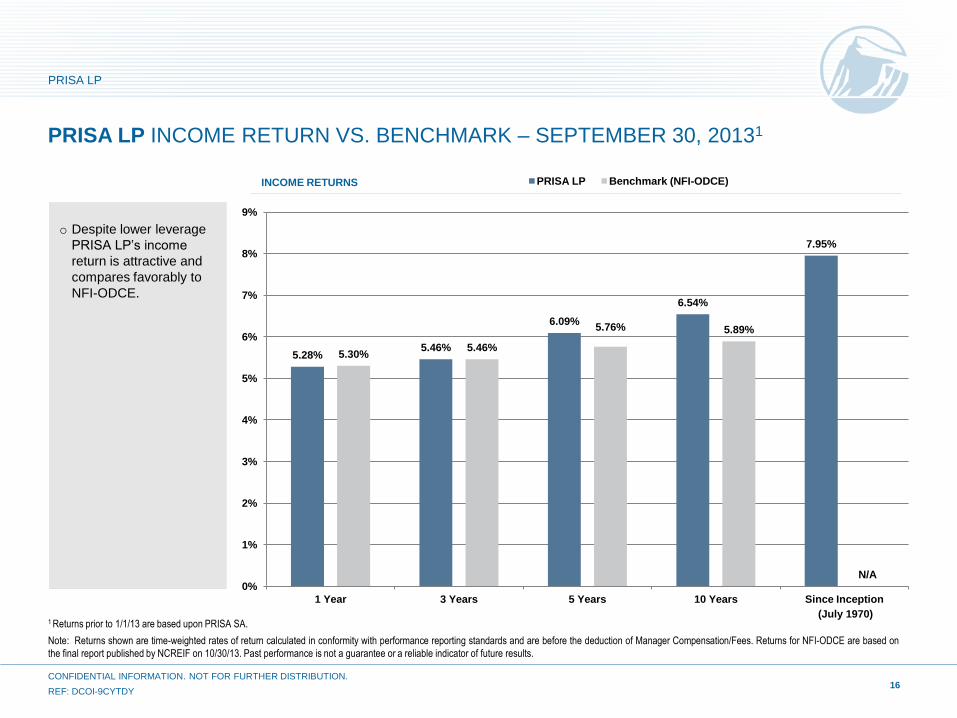
5.28% 5.46%
6.09%
6.54%
7.95%
5.30% 5.46%
5.76% 5.89%
N/A 0%
1%
2%
3%
4%
5%
6%
7%
8%
9%
1 Year 3 Years 5 Years 10 Years Since Inception
PRISA LP Benchmark (NFI-ODCE)
PRISA LP INCOME RETURN VS. BENCHMARK – SEPTEMBER 30, 20131
1 Returns prior to 1/1/13 are based upon PRISA SA.
Note: Returns shown are time-weighted rates of return calculated in conformity with performance reporting standards and are before the deduction of Manager Compensation/Fees. Returns for NFI-ODCE are based on
the final report published by NCREIF on 10/30/13. Past performance is not a guarantee or a reliable indicator of future results.
16
INCOME RETURNS
(July 1970)
o Despite lower leverage
PRISA LP’s income
return is attractive and
compares favorably to
NFI-ODCE.
PRISA LP
CONFIDENTIAL INFORMATION. NOT FOR FURTHER DISTRIBUTION.
REF: DCOI-9CYTDY
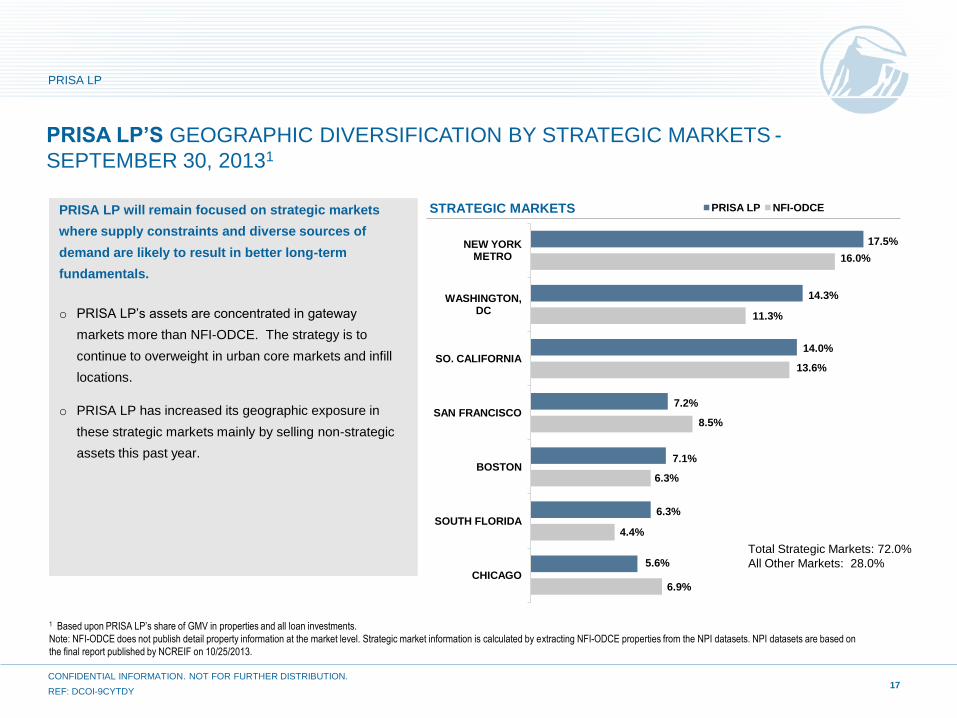
6.9%
4.4%
6.3%
8.5%
13.6%
11.3%
16.0%
5.6%
6.3%
7.1%
7.2%
14.0%
14.3%
17.5%
CHICAGO
SOUTH FLORIDA
BOSTON
SAN FRANCISCO
SO. CALIFORNIA
WASHINGTON, DC
NEW YORK METRO
PRISA LP NFI-ODCE
17
PRISA LP’S GEOGRAPHIC DIVERSIFICATION BY STRATEGIC MARKETS -
SEPTEMBER 30, 20131
1 Based upon PRISA LP’s share of GMV in properties and all loan investments.
Note: NFI-ODCE does not publish detail property information at the market level. Strategic market information is calculated by extracting NFI-ODCE properties from the NPI datasets. NPI datasets are based on
the final report published by NCREIF on 10/25/2013.
Total Strategic Markets: 72.0%
All Other Markets: 28.0%
STRATEGIC MARKETS
PRISA LP will remain focused on strategic markets
where supply constraints and diverse sources of
demand are likely to result in better long-term
fundamentals.
o PRISA LP’s assets are concentrated in gateway
markets more than NFI-ODCE. The strategy is to
continue to overweight in urban core markets and infill
locations.
o PRISA LP has increased its geographic exposure in
these strategic markets mainly by selling non-strategic
assets this past year.
PRISA LP
CONFIDENTIAL INFORMATION. NOT FOR FURTHER DISTRIBUTION.
REF: DCOI-9CYTDY
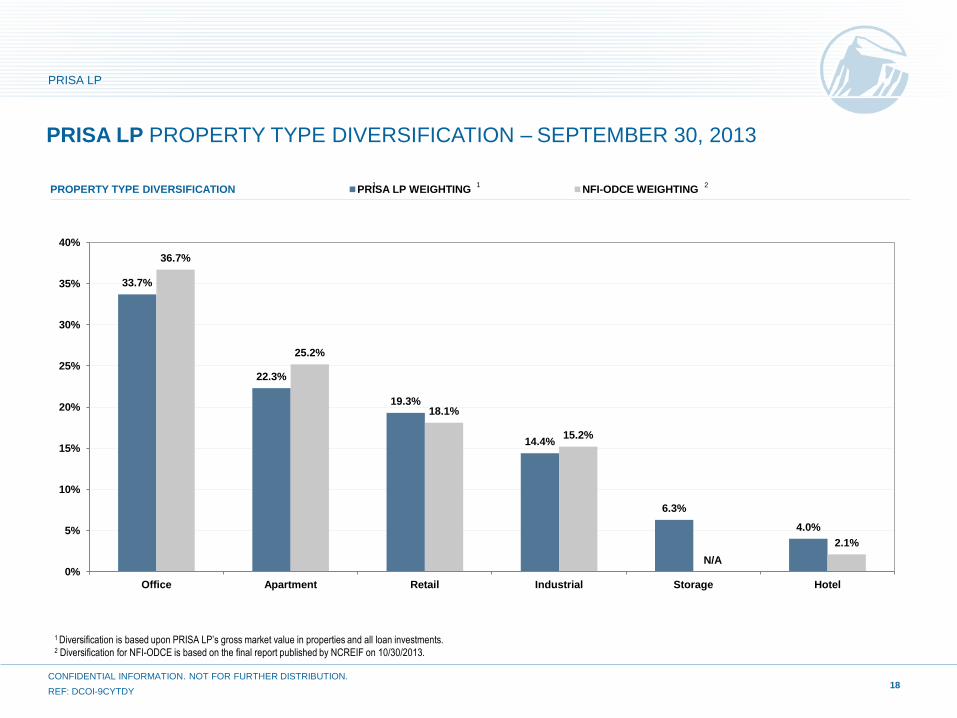
33.7%
22.3%
19.3%
14.4%
6.3%
4.0%
36.7%
25.2%
18.1%
15.2%
N/A
2.1%
0%
5%
10%
15%
20%
25%
30%
35%
40%
Office Apartment Retail Industrial Storage Hotel
PRISA LP WEIGHTING NFI-ODCE WEIGHTING
PRISA LP PROPERTY TYPE DIVERSIFICATION – SEPTEMBER 30, 2013
1 Diversification is based upon PRISA LP’s gross market value in properties and all loan investments. 2 Diversification for NFI-ODCE is based on the final report published by NCREIF on 10/30/2013.
1 PROPERTY TYPE DIVERSIFICATION
18
2
PRISA LP
CONFIDENTIAL INFORMATION. NOT FOR FURTHER DISTRIBUTION.
REF: DCOI-9CYTDY
1
19
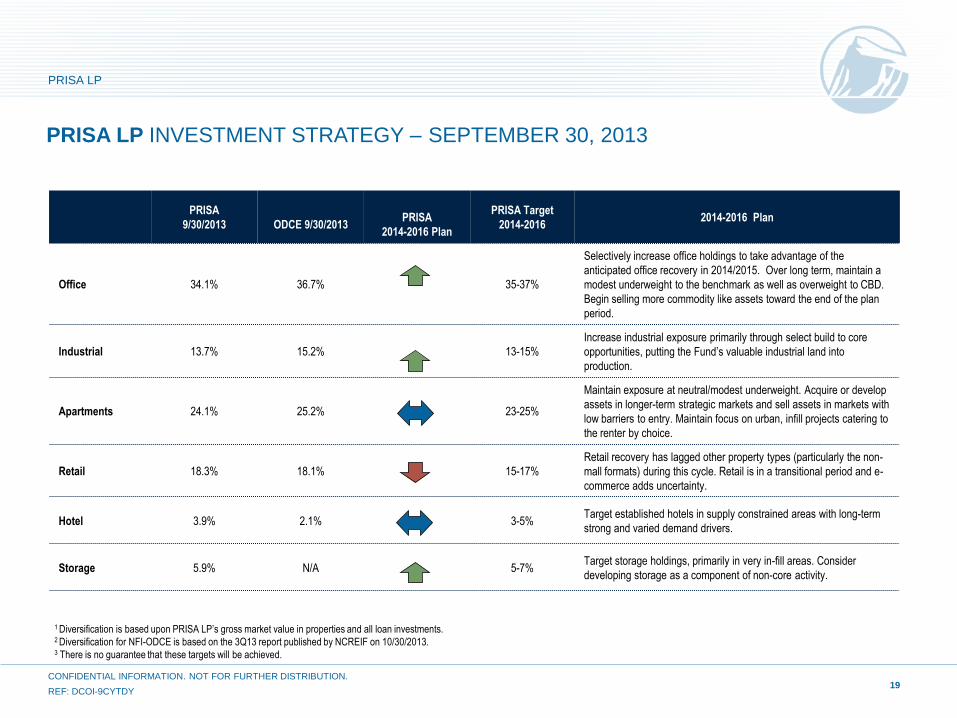
PRISA LP INVESTMENT STRATEGY – SEPTEMBER 30, 2013
PRISA LP
CONFIDENTIAL INFORMATION. NOT FOR FURTHER DISTRIBUTION.
REF: DCOI-9CYTDY
1 Diversification is based upon PRISA LP’s gross market value in properties and all loan investments.
2 Diversification for NFI-ODCE is based on the 3Q13 report published by NCREIF on 10/30/2013. 3 There is no guarantee that these targets will be achieved.
PRISA
9/30/2013
ODCE 9/30/2013
PRISA
2014-2016 Plan
PRISA Target
2014-2016 2014-2016 Plan
Office 34.1% 36.7% 35-37%
Selectively increase office holdings to take advantage of the
anticipated office recovery in 2014/2015. Over long term, maintain a
modest underweight to the benchmark as well as overweight to CBD.
Begin selling more commodity like assets toward the end of the plan
period.
Industrial 13.7% 15.2% 13-15%
Increase industrial exposure primarily through select build to core
opportunities, putting the Fund’s valuable industrial land into
production.
Apartments 24.1% 25.2% 23-25%
Maintain exposure at neutral/modest underweight. Acquire or develop
assets in longer-term strategic markets and sell assets in markets with
low barriers to entry. Maintain focus on urban, infill projects catering to
the renter by choice.
Retail 18.3% 18.1% 15-17%
Retail recovery has lagged other property types (particularly the non-
mall formats) during this cycle. Retail is in a transitional period and e-
commerce adds uncertainty.
Hotel 3.9% 2.1% 3-5% Target established hotels in supply constrained areas with long-term
strong and varied demand drivers.
Storage 5.9% N/A 5-7% Target storage holdings, primarily in very in-fill areas. Consider
developing storage as a component of non-core activity.

20
100 Park Avenue, New York, NY
CORE PROPERTY TYPE DIVERSIFICATION2
1 Lease status for total portfolio based on gross market value and excludes hotels. 2 Based on PRISA LP’s share of gross market value in properties and all debt investments.
CORE COMPOSITION LEASED STATUS AND LEASE ROLLOVER
PRISA LP
CONFIDENTIAL INFORMATION. NOT FOR FURTHER DISTRIBUTION.
REF: DCOI-9CYTDY
86% CORE 14% NON-CORE
PRISA LP HIGH QUALITY PORTFOLIO - CORE COMPONENT – SEPTEMBER 30, 2013
o We define “core” essentially as
assets that are 80%+ leased.
o Approximately 60% of the core
portfolio is invested in the prime
gateway markets like New York, San
Francisco, Washington D.C., Boston
and Los Angeles.
o The weighted average cap rate for the
core portfolio is 5.74%.
Total Portfolio Core Portfolio
9/30/2012 9/30/2013 9/30/2012 9/30/2013
Average Lease
Expiration
2013-2017
Industrial 87.2% 90.4% 92.2% 94.5% 9.6%
Office 82.9% 86.4% 86.8% 88.8% 7.8%
Retail 90.5% 91.9% 91.9% 93.5% 8.4%
Apartment 95.9% 94.3% 95.9% 94.3% N/A
Hotel 72.0% 82.3% 72.0% 82.3% N/A
Storage 92.4% 92.5% 92.4% 92.5% N/A
Total1 88.6% 90.2% 91.2% 92.1%
31.0% OFFICE
24.3% APARTMENT
20.8% RETAIL
14.1% INDUSTRIAL
7.1% STORAGE
2.7% HOTEL
21
BACKGROUND & MARKET UPDATE
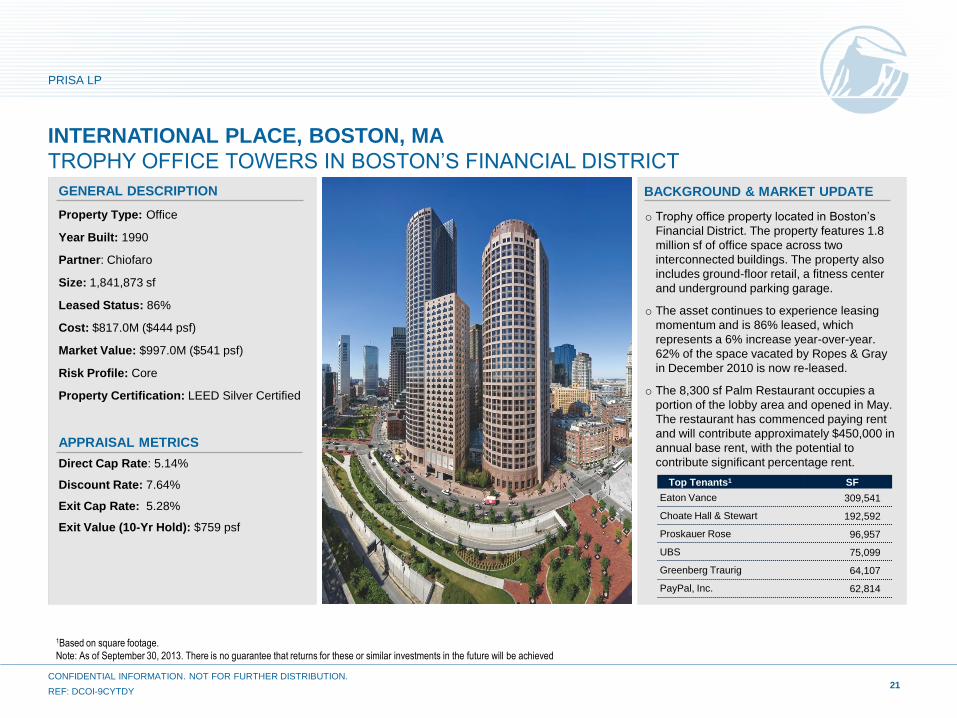
INTERNATIONAL PLACE, BOSTON, MA
TROPHY OFFICE TOWERS IN BOSTON’S FINANCIAL DISTRICT
PRISA LP
CONFIDENTIAL INFORMATION. NOT FOR FURTHER DISTRIBUTION.
REF: DCOI-9CYTDY
1Based on square footage.
Note: As of September 30, 2013. There is no guarantee that returns for these or similar investments in the future will be achieved
GENERAL DESCRIPTION
Property Type: Office
Year Built: 1990
Partner: Chiofaro
Size: 1,841,873 sf
Leased Status: 86%
Cost: $817.0M ($444 psf)
Market Value: $997.0M ($541 psf)
Risk Profile: Core
Property Certification: LEED Silver Certified
APPRAISAL METRICS
Direct Cap Rate: 5.14%
Discount Rate: 7.64%
Exit Cap Rate: 5.28%
Exit Value (10-Yr Hold): $759 psf
o Trophy office property located in Boston’s
Financial District. The property features 1.8
million sf of office space across two
interconnected buildings. The property also
includes ground-floor retail, a fitness center
and underground parking garage.
o The asset continues to experience leasing
momentum and is 86% leased, which
represents a 6% increase year-over-year.
62% of the space vacated by Ropes & Gray
in December 2010 is now re-leased.
o The 8,300 sf Palm Restaurant occupies a
portion of the lobby area and opened in May.
The restaurant has commenced paying rent
and will contribute approximately $450,000 in
annual base rent, with the potential to
contribute significant percentage rent.
Top Tenants1 SF
Eaton Vance 309,541
Choate Hall & Stewart 192,592
Proskauer Rose 96,957
UBS 75,099
Greenberg Traurig 64,107
PayPal, Inc. 62,814
NON-CORE PROPERTY TYPE DIVERSIFICATION3
NON-CORE COMPOSITION SUMMARY OF NON-CORE ASSETS
22
PRISA LP
CONFIDENTIAL INFORMATION. NOT FOR FURTHER DISTRIBUTION.
REF: DCOI-9CYTDY
86% CORE
14% NON-
CORE
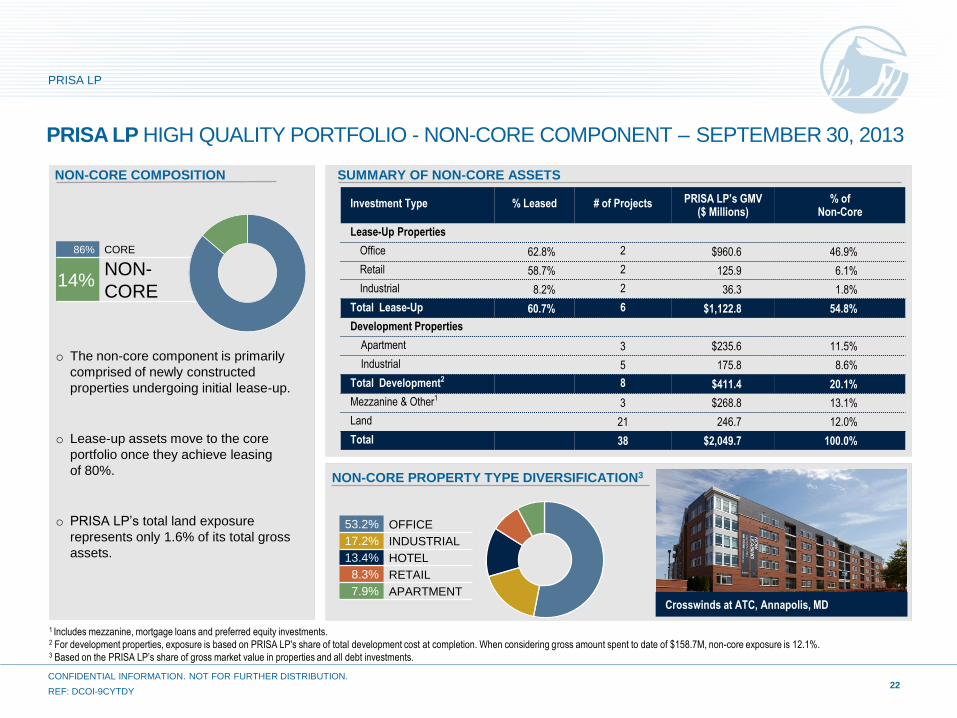
PRISA LP HIGH QUALITY PORTFOLIO - NON-CORE COMPONENT – SEPTEMBER 30, 2013
o The non-core component is primarily
comprised of newly constructed
properties undergoing initial lease-up.
o Lease-up assets move to the core
portfolio once they achieve leasing
of 80%.
o PRISA LP’s total land exposure
represents only 1.6% of its total gross
assets.
1 Includes mezzanine, mortgage loans and preferred equity investments.
2 For development properties, exposure is based on PRISA LP's share of total development cost at completion. When considering gross amount spent to date of $158.7M, non-core exposure is 12.1%. 3 Based on the PRISA LP’s share of gross market value in properties and all debt investments.
53.2% OFFICE
17.2% INDUSTRIAL
13.4% HOTEL
8.3% RETAIL
7.9% APARTMENT Crosswinds at ATC, Annapolis, MD
Investment Type % Leased # of Projects PRISA LP’s GMV ($ Millions)
% of Non-Core
Lease-Up Properties
Office 62.8% 2 $960.6 46.9%
Retail 58.7% 2 125.9 6.1%
Industrial 8.2% 2 36.3 1.8%
Total Lease-Up 60.7% 6 $1,122.8 54.8%
Development Properties
Apartment 3 $235.6 11.5%
Industrial 5 175.8 8.6%
Total Development2 8 $411.4 20.1%
Mezzanine & Other1 3 $268.8 13.1%
Land 21 246.7 12.0%
Total 38 $2,049.7 100.0%
23
PRISA LP
CONFIDENTIAL INFORMATION. NOT FOR FURTHER DISTRIBUTION.
REF: DCOI-9CYTDY
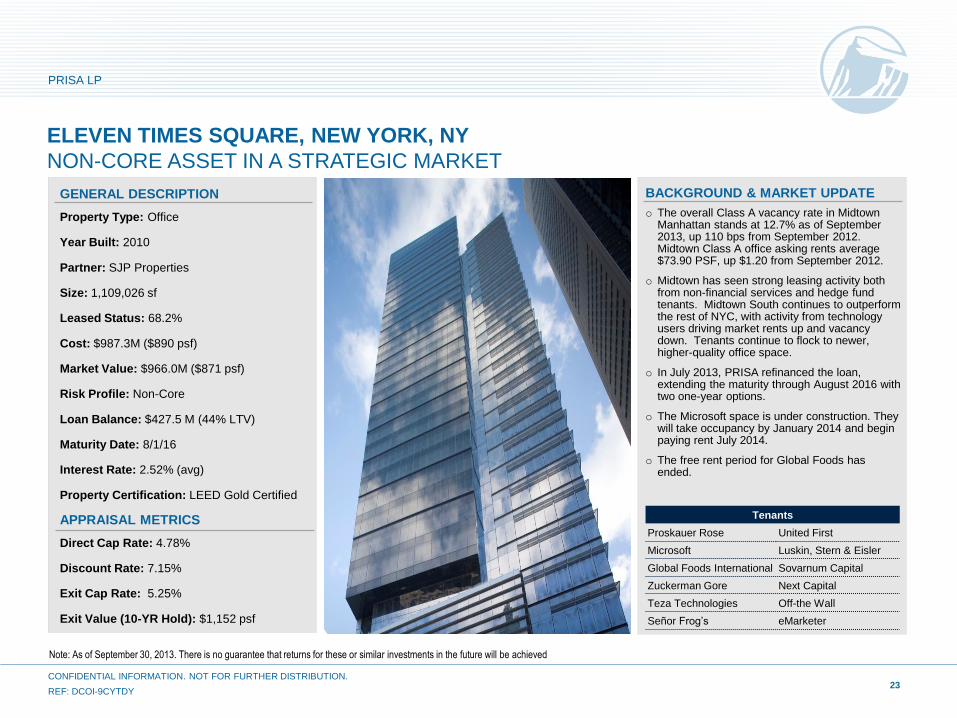
BACKGROUND & MARKET UPDATE
o The overall Class A vacancy rate in Midtown Manhattan stands at 12.7% as of September 2013, up 110 bps from September 2012. Midtown Class A office asking rents average $73.90 PSF, up $1.20 from September 2012.
o Midtown has seen strong leasing activity both from non-financial services and hedge fund tenants. Midtown South continues to outperform the rest of NYC, with activity from technology users driving market rents up and vacancy down. Tenants continue to flock to newer, higher-quality office space.
o In July 2013, PRISA refinanced the loan, extending the maturity through August 2016 with two one-year options.
o The Microsoft space is under construction. They will take occupancy by January 2014 and begin paying rent July 2014.
o The free rent period for Global Foods has ended.
GENERAL DESCRIPTION
Property Type: Office
Year Built: 2010
Partner: SJP Properties
Size: 1,109,026 sf
Leased Status: 68.2%
Cost: $987.3M ($890 psf)
Market Value: $966.0M ($871 psf)
Risk Profile: Non-Core
Loan Balance: $427.5 M (44% LTV)
Maturity Date: 8/1/16
Interest Rate: 2.52% (avg)
Property Certification: LEED Gold Certified
APPRAISAL METRICS
Direct Cap Rate: 4.78%
Discount Rate: 7.15%
Exit Cap Rate: 5.25%
Exit Value (10-YR Hold): $1,152 psf
ELEVEN TIMES SQUARE, NEW YORK, NY
NON-CORE ASSET IN A STRATEGIC MARKET
Tenants
Proskauer Rose United First
Microsoft Luskin, Stern & Eisler
Global Foods International Sovarnum Capital
Zuckerman Gore Next Capital
Teza Technologies Off-the Wall
Señor Frog’s eMarketer
Note: As of September 30, 2013. There is no guarantee that returns for these or similar investments in the future will be achieved
24
PRISA LP
CONFIDENTIAL INFORMATION. NOT FOR FURTHER DISTRIBUTION.
REF: DCOI-9CYTDY
$0
$100
$200
$300
$400
$500
$600
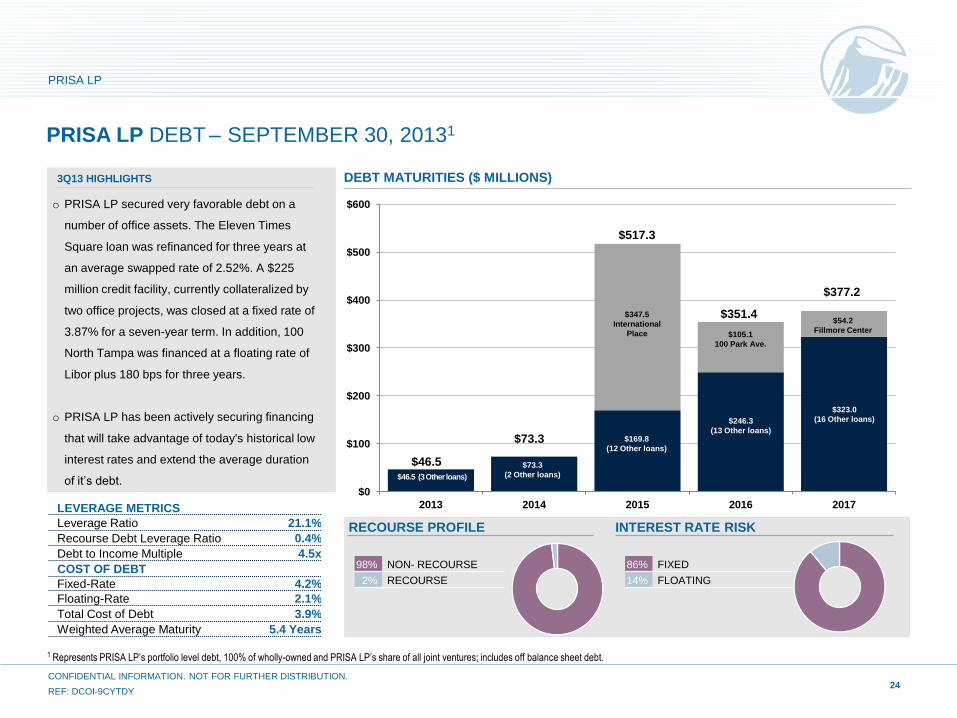
2013 2014 2015 2016 2017
$517.3
PRISA LP DEBT – SEPTEMBER 30, 20131
1 Represents PRISA LP’s portfolio level debt, 100% of wholly-owned and PRISA LP’s share of all joint ventures; includes off balance sheet debt.
DEBT MATURITIES ($ MILLIONS)
RECOURSE PROFILE INTEREST RATE RISK
98% NON- RECOURSE
2% RECOURSE
86% FIXED
14% FLOATING
$46.5 (3 Other loans)
$169.8
(12 Other loans)
$347.5
International
Place
$246.3
(13 Other loans)
$105.1
100 Park Ave.
$323.0
(16 Other loans)
$54.2
Fillmore Center
$46.5
$73.3
$351.4
$377.2
$73.3
(2 Other loans)
3Q13 HIGHLIGHTS
LEVERAGE METRICS
Leverage Ratio 21.1%
Recourse Debt Leverage Ratio 0.4%
Debt to Income Multiple 4.5x
COST OF DEBT
Fixed-Rate 4.2%
Floating-Rate 2.1%
Total Cost of Debt 3.9%
Weighted Average Maturity 5.4 Years
o PRISA LP secured very favorable debt on a
number of office assets. The Eleven Times
Square loan was refinanced for three years at
an average swapped rate of 2.52%. A $225
million credit facility, currently collateralized by
two office projects, was closed at a fixed rate of
3.87% for a seven-year term. In addition, 100
North Tampa was financed at a floating rate of
Libor plus 180 bps for three years.
o PRISA LP has been actively securing financing
that will take advantage of today's historical low
interest rates and extend the average duration
of it’s debt.
25
1 Based on total gross cost.
Note: Past performance is not a guarantee or reliable indicator of future results.
PRISA LP
CONFIDENTIAL INFORMATION. NOT FOR FURTHER DISTRIBUTION.
REF: DCOI-9CYTDY
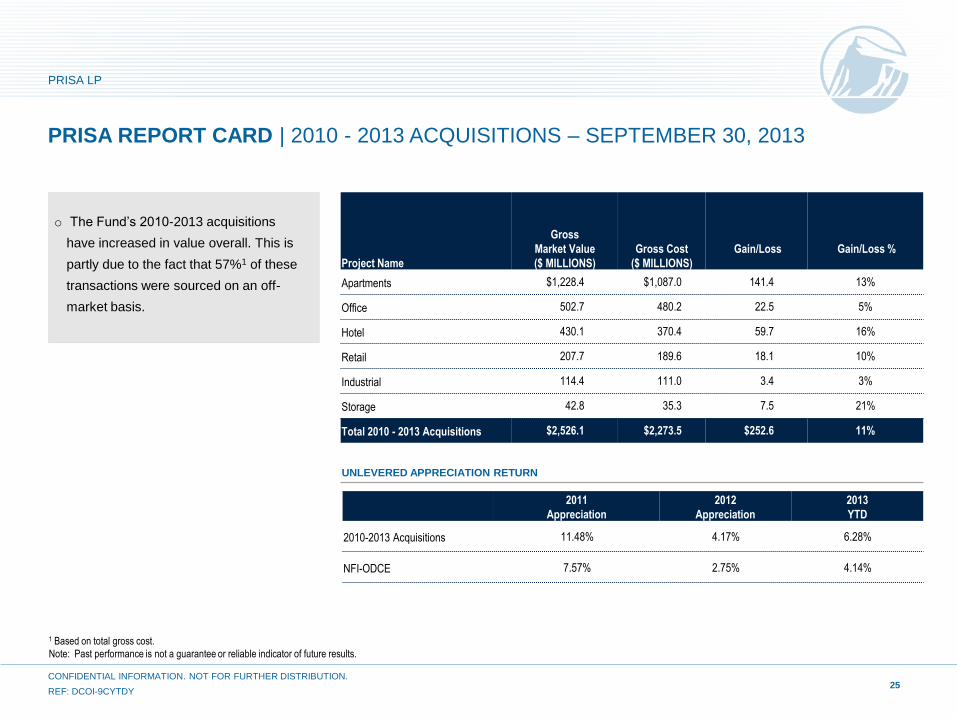
PRISA REPORT CARD | 2010 - 2013 ACQUISITIONS – SEPTEMBER 30, 2013
Project Name
Gross
Market Value
($ MILLIONS)
Gross Cost
($ MILLIONS)
Gain/Loss
Gain/Loss %
Apartments $1,228.4 $1,087.0 141.4 13%
Office 502.7 480.2 22.5 5%
Hotel 430.1 370.4 59.7 16%
Retail 207.7 189.6 18.1 10%
Industrial 114.4 111.0 3.4 3%
Storage 42.8 35.3 7.5 21%
Total 2010 - 2013 Acquisitions $2,526.1 $2,273.5 $252.6 11%
2011
Appreciation
2012
Appreciation
2013
YTD
2010-2013 Acquisitions 11.48% 4.17% 6.28%
NFI-ODCE 7.57% 2.75% 4.14%
UNLEVERED APPRECIATION RETURN
o The Fund’s 2010-2013 acquisitions
have increased in value overall. This is
partly due to the fact that 57%1 of these
transactions were sourced on an off-
market basis.
26
PRISA LP
CONFIDENTIAL INFORMATION. NOT FOR FURTHER DISTRIBUTION.
REF: DCOI-9CYTDY
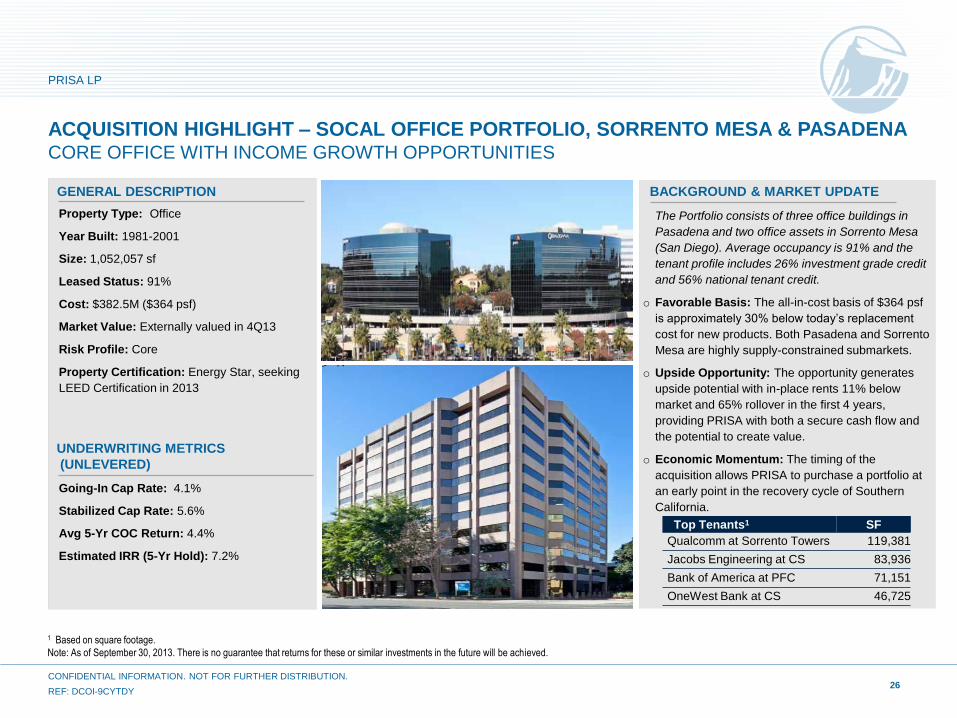
The Portfolio consists of three office buildings in
Pasadena and two office assets in Sorrento Mesa
(San Diego). Average occupancy is 91% and the
tenant profile includes 26% investment grade credit
and 56% national tenant credit.
o Favorable Basis: The all-in-cost basis of $364 psf
is approximately 30% below today’s replacement
cost for new products. Both Pasadena and Sorrento
Mesa are highly supply-constrained submarkets.
o Upside Opportunity: The opportunity generates
upside potential with in-place rents 11% below
market and 65% rollover in the first 4 years,
providing PRISA with both a secure cash flow and
the potential to create value.
o Economic Momentum: The timing of the
acquisition allows PRISA to purchase a portfolio at
an early point in the recovery cycle of Southern
California.
Property Type: Office
Year Built: 1981-2001
Size: 1,052,057 sf
Leased Status: 91%
Cost: $382.5M ($364 psf)
Market Value: Externally valued in 4Q13
Risk Profile: Core
Property Certification: Energy Star, seeking
LEED Certification in 2013
GENERAL DESCRIPTION
Going-In Cap Rate: 4.1%
Stabilized Cap Rate: 5.6%
Avg 5-Yr COC Return: 4.4%
Estimated IRR (5-Yr Hold): 7.2%
ACQUISITION HIGHLIGHT – SOCAL OFFICE PORTFOLIO, SORRENTO MESA & PASADENA CORE OFFICE WITH INCOME GROWTH OPPORTUNITIES
UNDERWRITING METRICS
(UNLEVERED)
BACKGROUND & MARKET UPDATE
1 Based on square footage.
Note: As of September 30, 2013. There is no guarantee that returns for these or similar investments in the future will be achieved.
Top Tenants1 SF
Qualcomm at Sorrento Towers 119,381
Jacobs Engineering at CS 83,936
Bank of America at PFC 71,151
OneWest Bank at CS 46,725
27
PRISA LP
CONFIDENTIAL INFORMATION. NOT FOR FURTHER DISTRIBUTION.
REF: DCOI-9CYTDY
BACKGROUND & MARKET UPDATE
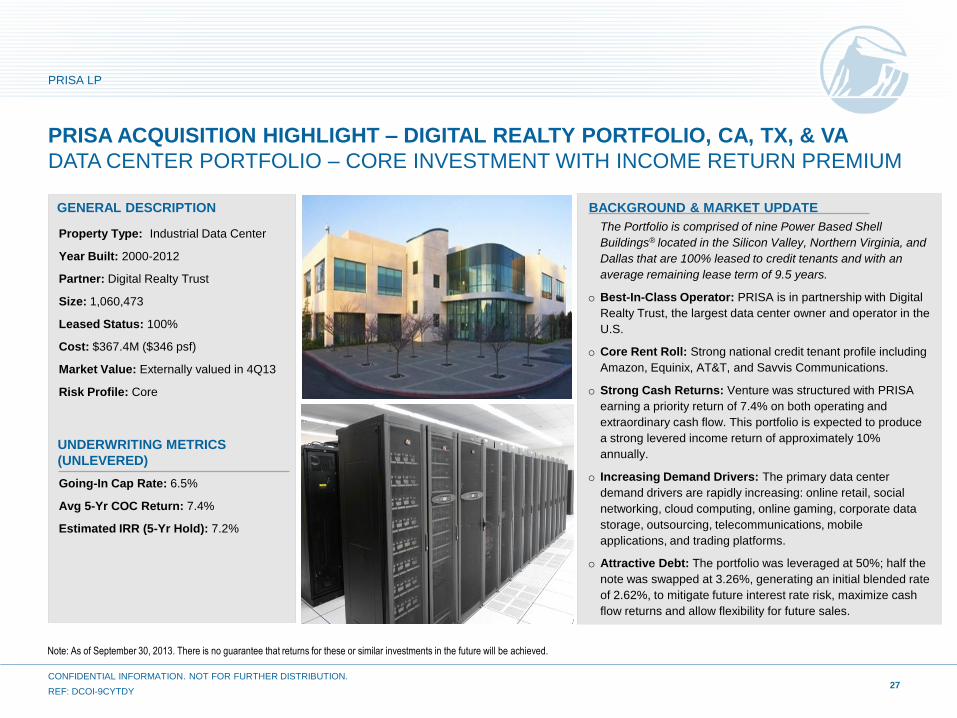
The Portfolio is comprised of nine Power Based Shell
Buildings® located in the Silicon Valley, Northern Virginia, and
Dallas that are 100% leased to credit tenants and with an
average remaining lease term of 9.5 years.
o Best-In-Class Operator: PRISA is in partnership with Digital
Realty Trust, the largest data center owner and operator in the
U.S.
o Core Rent Roll: Strong national credit tenant profile including
Amazon, Equinix, AT&T, and Savvis Communications.
o Strong Cash Returns: Venture was structured with PRISA
earning a priority return of 7.4% on both operating and
extraordinary cash flow. This portfolio is expected to produce
a strong levered income return of approximately 10%
annually.
o Increasing Demand Drivers: The primary data center
demand drivers are rapidly increasing: online retail, social
networking, cloud computing, online gaming, corporate data
storage, outsourcing, telecommunications, mobile
applications, and trading platforms.
o Attractive Debt: The portfolio was leveraged at 50%; half the
note was swapped at 3.26%, generating an initial blended rate
of 2.62%, to mitigate future interest rate risk, maximize cash
flow returns and allow flexibility for future sales.
GENERAL DESCRIPTION
Going-In Cap Rate: 6.5%
Avg 5-Yr COC Return: 7.4%
Estimated IRR (5-Yr Hold): 7.2%
Property Type: Industrial Data Center
Year Built: 2000-2012
Partner: Digital Realty Trust
Size: 1,060,473
Leased Status: 100%
Cost: $367.4M ($346 psf)
Market Value: Externally valued in 4Q13
Risk Profile: Core
PRISA ACQUISITION HIGHLIGHT – DIGITAL REALTY PORTFOLIO, CA, TX, & VA
DATA CENTER PORTFOLIO – CORE INVESTMENT WITH INCOME RETURN PREMIUM
UNDERWRITING METRICS
(UNLEVERED)
Note: As of September 30, 2013. There is no guarantee that returns for these or similar investments in the future will be achieved.
1 Rates are weighted on gross market value. 2 The direct cap rate generally reflects the external appraiser’s calculation of stabilized NOI divided by current appraised value.
28
PRISA LP
CONFIDENTIAL INFORMATION. NOT FOR FURTHER DISTRIBUTION.
REF: DCOI-9CYTDY
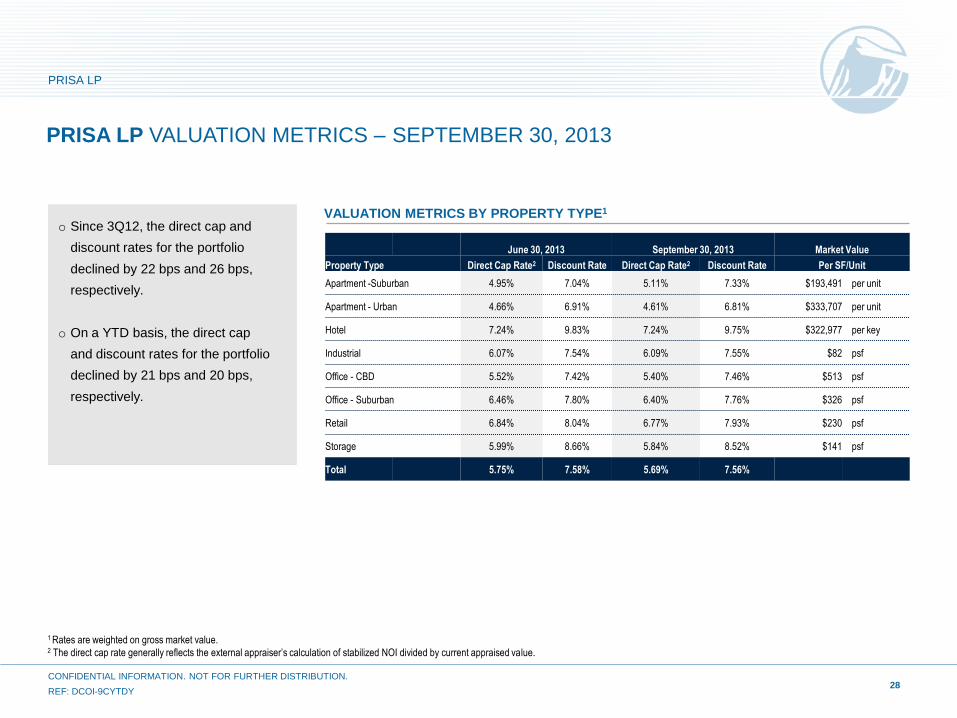
PRISA LP VALUATION METRICS – SEPTEMBER 30, 2013
VALUATION METRICS BY PROPERTY TYPE1
o Since 3Q12, the direct cap and
discount rates for the portfolio
declined by 22 bps and 26 bps,
respectively.
o On a YTD basis, the direct cap
and discount rates for the portfolio
declined by 21 bps and 20 bps,
respectively.
June 30, 2013 September 30, 2013 Market Value
Property Type Direct Cap Rate2 Discount Rate Direct Cap Rate2 Discount Rate Per SF/Unit
Apartment -Suburban 4.95% 7.04% 5.11% 7.33% $193,491 per unit
Apartment - Urban 4.66% 6.91% 4.61% 6.81% $333,707 per unit
Hotel 7.24% 9.83% 7.24% 9.75% $322,977 per key
Industrial 6.07% 7.54% 6.09% 7.55% $82 psf
Office - CBD 5.52% 7.42% 5.40% 7.46% $513 psf
Office - Suburban 6.46% 7.80% 6.40% 7.76% $326 psf
Retail 6.84% 8.04% 6.77% 7.93% $230 psf
Storage 5.99% 8.66% 5.84% 8.52% $141 psf
Total 5.75% 7.58% 5.69% 7.56%

1 100% Property level unlevered. To provide a more meaningful basis for comparison between periods, net property income excludes income from properties that were purchased or sold during the comparative time periods, land
and debt investments. Results are not guaranteed. Past performance is not a guarantee or reliable indicator of future results.
29
YTD SAME PROPERTY INCOME GROWTH
PRISA LP
CONFIDENTIAL INFORMATION. NOT FOR FURTHER DISTRIBUTION.
REF: DCOI-9CYTDY
PRISA LP 2013 SAME PROPERTY INCOME GROWTH – SEPTEMBER 30, 2013
o The Fund targeted to achieve same
property income growth of 6.3% for
2013.
o As of the third quarter we have
exceeded our projection and anticipate
some property income growth of 7.0%
for the full year.
Property Type1
Nine Months Ended Nine Months Ended
% Change
9/30/13 Actual 9/30/12 Actual
($ in MM) ($ in MM)
Apartments $114.5 $106.6 7.4%
Hotel 11.7 8.6 36.1%
Industrial 65.2 58.6 11.3%
Office 171.4 167.0 2.6%
Retail 129.2 115.4 11.9%
Storage 43.4 40.2 8.2%
Total Comparable Property NOI $535.4 $496.4 7.9%
30
PRISA LP – WRAP-UP
The Fundamentals
Financing
Transactions Strategy
o Continue to take advantage of the attractive lending environment and increase the average duration of the Fund’s debt.
o We expect to manage the Fund’s LTV to a range of 23% to 25% over the next six months.
o Focus on income - New acquisitions targeting assets and sectors that will benefit from improving rent growth, with an emphasis on
increasing allocation to office and industrial in supply constrained markets
o Office assets with some vacancy or near term roll
o Selective industrial development on land we own
o Less obvious core opportunities
o We expect portfolio occupancy to continue to improve in the near-term, mostly due to continued leasing momentum in the office and
industrial sectors.
o Overall same store income grew by 7.9% YTD, with all sectors posting gains.
o Rent growth in most markets and sectors should continue to drive portfolio income growth in the near term; PRISA will see the most from its
office and industrial properties.
Performance
o Total YTD return of 10.8%1 has already exceeded full year target of 8% to 10% as a result of outsized appreciation.
o Based on current 3Q13 projections, we expect that as much as $420 million of embedded value will be realized over the next four
quarters, with the majority coming from the office portfolio.
1 Total year-to-date net return of 10.11%. Past performance is not a guarantee or a reliable indicator of future results.
PRISA LP
CONFIDENTIAL INFORMATION. NOT FOR FURTHER DISTRIBUTION.
REF: DCOI-9CYTDY
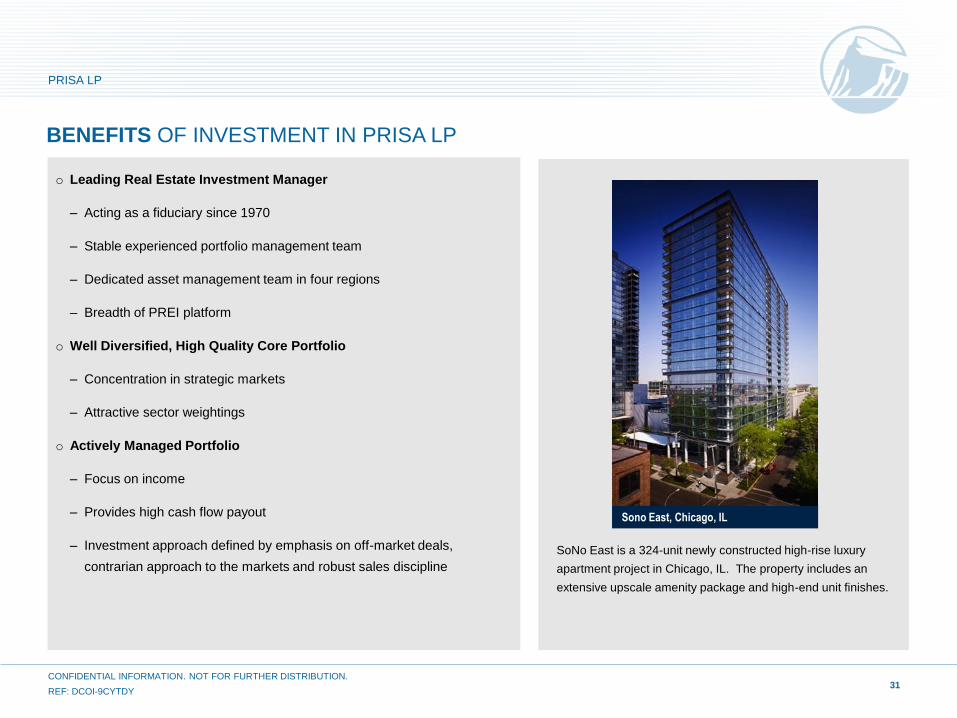
o Leading Real Estate Investment Manager
– Acting as a fiduciary since 1970
– Stable experienced portfolio management team
– Dedicated asset management team in four regions
– Breadth of PREI platform
o Well Diversified, High Quality Core Portfolio
– Concentration in strategic markets
– Attractive sector weightings
o Actively Managed Portfolio
– Focus on income
– Provides high cash flow payout
– Investment approach defined by emphasis on off-market deals,
contrarian approach to the markets and robust sales discipline
31
BENEFITS OF INVESTMENT IN PRISA LP
Sono East, Chicago, IL
SoNo East is a 324-unit newly constructed high-rise luxury
apartment project in Chicago, IL. The property includes an
extensive upscale amenity package and high-end unit finishes.
PRISA LP
CONFIDENTIAL INFORMATION. NOT FOR FURTHER DISTRIBUTION.
REF: DCOI-9CYTDY

APPENDIX
CONFIDENTIAL INFORMATION. NOT FOR FURTHER DISTRIBUTION.
REF: DCOI-9CYTDY

U.S. MARKET OUTLOOK
CONFIDENTIAL INFORMATION. NOT FOR FURTHER DISTRIBUTION.
REF: DCOI-9CYTDY
Demand Drivers: Sustainable
Economic Recovery o Economic news has been disappointing recently, reflecting the delayed impact from the government
shutdown and increased uncertainty from debt crisis.
o Despite Consensus forecasts for GDP growth in the second half of this year being revised down, we
anticipate stronger growth in 2014, as suggested by several forward-looking indicators including manager
hiring intentions.
o The recovery could surprise on the upside if Europe and emerging markets outperform expectations and
policy issues are resolved without roiling the financial markets.
Development Constrained o Low in all sectors but apartments, which is now at its long-term average and holding steady.
Property Fundamentals
Improving
o Real estate market fundamentals improving across the board.
o Apartment: Supply/demand in balance for majority of markets. Move-outs to ownership still low.
o Office: Energy/technology job gains driving absorption, housing recovery will likely spur demand.
o Warehouse: Global trade flows should improve, changing face of retail pushing demand.
o Retail: Store closings down, openings up; vacancies improving with very limited development.
o Hotel: Business travel, tourism expanding. Room demand up 3.1% y-y (August), ADRs up 4.5%.
o Storage: Strong NOI growth outlook, robust cash flows.
Strong Investment Demand o Demand for core gateway assets remains robust.
o Investors are moving along the risk spectrum to focus on value-add opportunities and secondary markets,
which may present better risk-return parameters.
34
U.S. REAL ESTATE MARKET OUTLOOK
Source: PREI Research, as of November 2013.
PRISA LP
CONFIDENTIAL INFORMATION. NOT FOR FURTHER DISTRIBUTION.
REF: DCOI-9CYTDY
35
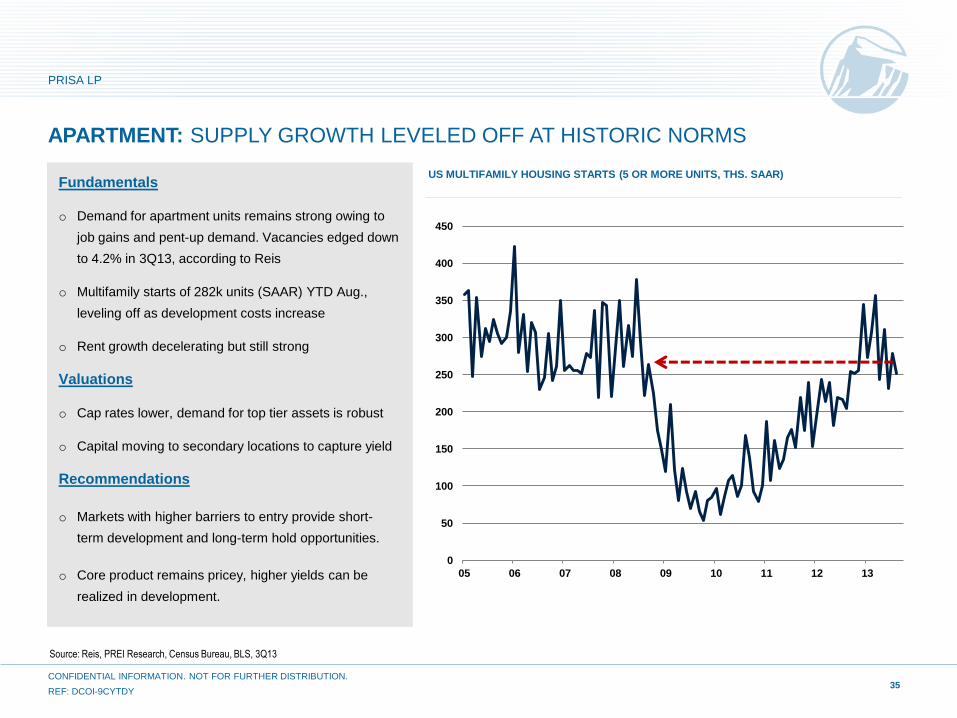
APARTMENT: SUPPLY GROWTH LEVELED OFF AT HISTORIC NORMS
Fundamentals
o Demand for apartment units remains strong owing to
job gains and pent-up demand. Vacancies edged down
to 4.2% in 3Q13, according to Reis
o Multifamily starts of 282k units (SAAR) YTD Aug.,
leveling off as development costs increase
o Rent growth decelerating but still strong
Valuations
o Cap rates lower, demand for top tier assets is robust
o Capital moving to secondary locations to capture yield
Recommendations
o Markets with higher barriers to entry provide short-
term development and long-term hold opportunities.
o Core product remains pricey, higher yields can be
realized in development.
Source: Reis, PREI Research, Census Bureau, BLS, 3Q13
US MULTIFAMILY HOUSING STARTS (5 OR MORE UNITS, THS. SAAR)
0
50
100
150
200
250
300
350
400
450
05 06 07 08 09 10 11 12 13
PRISA LP
CONFIDENTIAL INFORMATION. NOT FOR FURTHER DISTRIBUTION.
REF: DCOI-9CYTDY
36
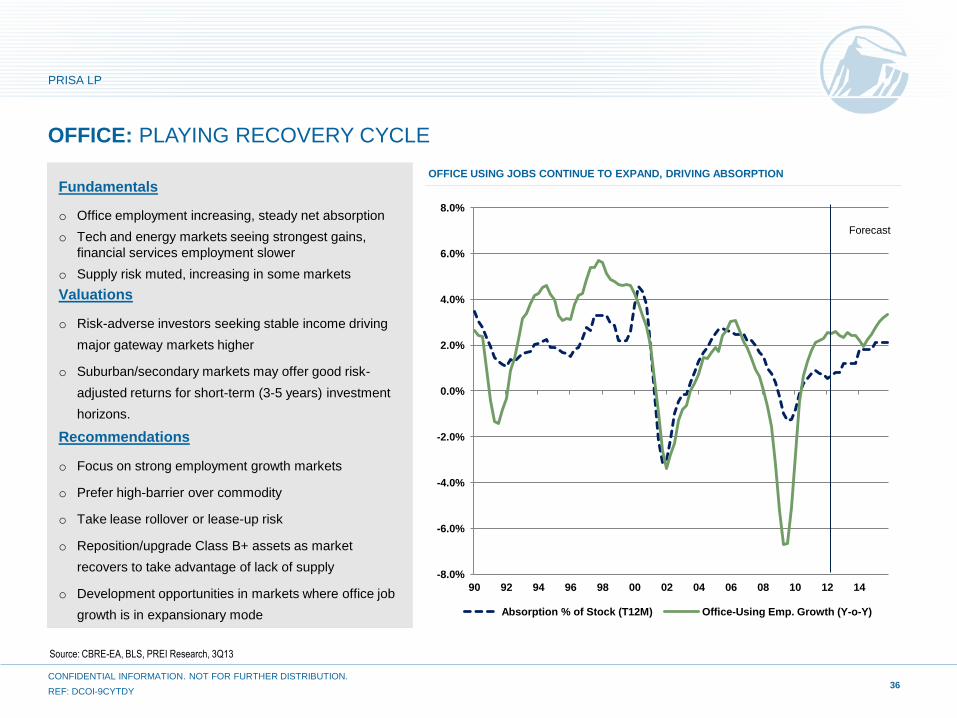
OFFICE: PLAYING RECOVERY CYCLE
Fundamentals
o Office employment increasing, steady net absorption
o Tech and energy markets seeing strongest gains,
financial services employment slower
o Supply risk muted, increasing in some markets
Valuations
o Risk-adverse investors seeking stable income driving
major gateway markets higher
o Suburban/secondary markets may offer good risk-
adjusted returns for short-term (3-5 years) investment
horizons.
Recommendations
o Focus on strong employment growth markets
o Prefer high-barrier over commodity
o Take lease rollover or lease-up risk
o Reposition/upgrade Class B+ assets as market
recovers to take advantage of lack of supply
o Development opportunities in markets where office job
growth is in expansionary mode
Source: CBRE-EA, BLS, PREI Research, 3Q13
OFFICE USING JOBS CONTINUE TO EXPAND, DRIVING ABSORPTION
-8.0%
-6.0%
-4.0%
-2.0%
0.0%
2.0%
4.0%
6.0%
8.0%
90 92 94 96 98 00 02 04 06 08 10 12 14
Absorption % of Stock (T12M) Office-Using Emp. Growth (Y-o-Y)
Forecast
PRISA LP
CONFIDENTIAL INFORMATION. NOT FOR FURTHER DISTRIBUTION.
REF: DCOI-9CYTDY
37
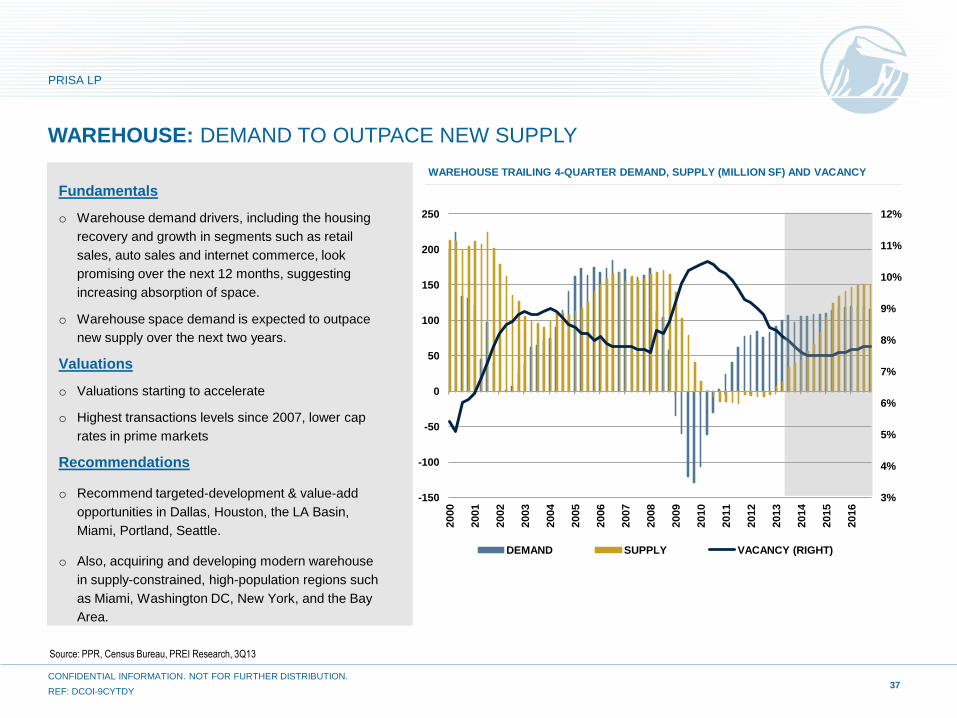
WAREHOUSE: DEMAND TO OUTPACE NEW SUPPLY
Fundamentals
o Warehouse demand drivers, including the housing
recovery and growth in segments such as retail
sales, auto sales and internet commerce, look
promising over the next 12 months, suggesting
increasing absorption of space.
o Warehouse space demand is expected to outpace
new supply over the next two years.
Valuations
o Valuations starting to accelerate
o Highest transactions levels since 2007, lower cap
rates in prime markets
Recommendations
o Recommend targeted-development & value-add
opportunities in Dallas, Houston, the LA Basin,
Miami, Portland, Seattle.
o Also, acquiring and developing modern warehouse
in supply-constrained, high-population regions such
as Miami, Washington DC, New York, and the Bay
Area.
Source: PPR, Census Bureau, PREI Research, 3Q13
WAREHOUSE TRAILING 4-QUARTER DEMAND, SUPPLY (MILLION SF) AND VACANCY
3%
4%
5%
6%
7%
8%
9%
10%
11%
12%
-150
-100
-50
0
50
100
150
200
250
2000
2001
2002
2003
2004
2005
2006
2007
2008
2009
2010
2011
2012
2013
2014
2015
2016
DEMAND SUPPLY VACANCY (RIGHT)
PRISA LP
CONFIDENTIAL INFORMATION. NOT FOR FURTHER DISTRIBUTION.
REF: DCOI-9CYTDY
38
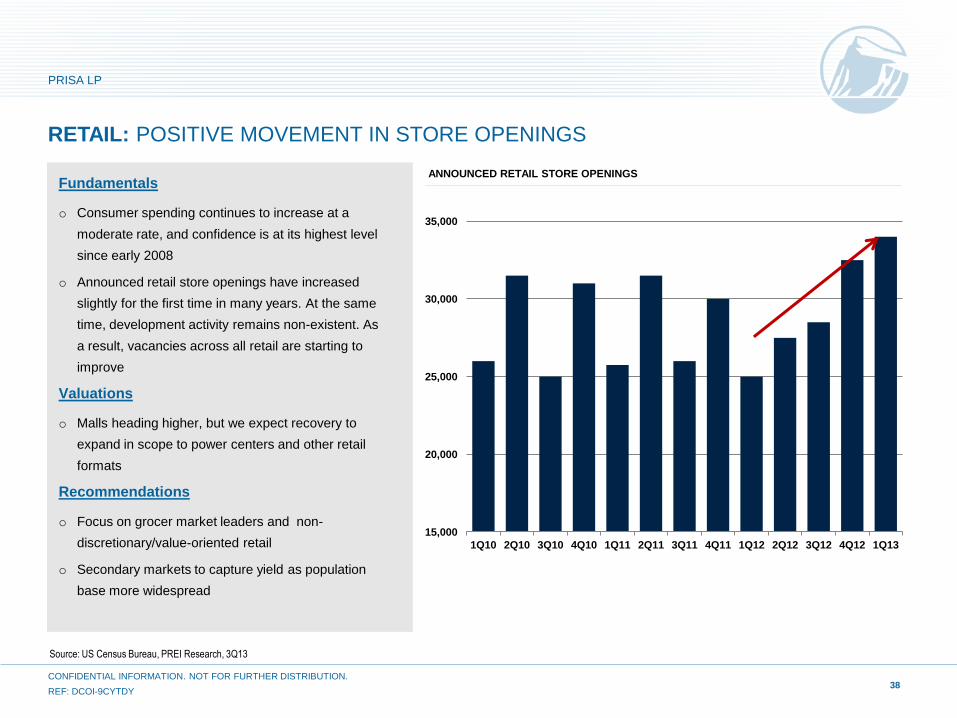
RETAIL: POSITIVE MOVEMENT IN STORE OPENINGS
Fundamentals
o Consumer spending continues to increase at a
moderate rate, and confidence is at its highest level
since early 2008
o Announced retail store openings have increased
slightly for the first time in many years. At the same
time, development activity remains non-existent. As
a result, vacancies across all retail are starting to
improve
Valuations
o Malls heading higher, but we expect recovery to
expand in scope to power centers and other retail
formats
Recommendations
o Focus on grocer market leaders and non-
discretionary/value-oriented retail
o Secondary markets to capture yield as population
base more widespread
Source: US Census Bureau, PREI Research, 3Q13
ANNOUNCED RETAIL STORE OPENINGS
15,000
20,000
25,000
30,000
35,000
1Q10 2Q10 3Q10 4Q10 1Q11 2Q11 3Q11 4Q11 1Q12 2Q12 3Q12 4Q12 1Q13
PRISA LP
CONFIDENTIAL INFORMATION. NOT FOR FURTHER DISTRIBUTION.
REF: DCOI-9CYTDY
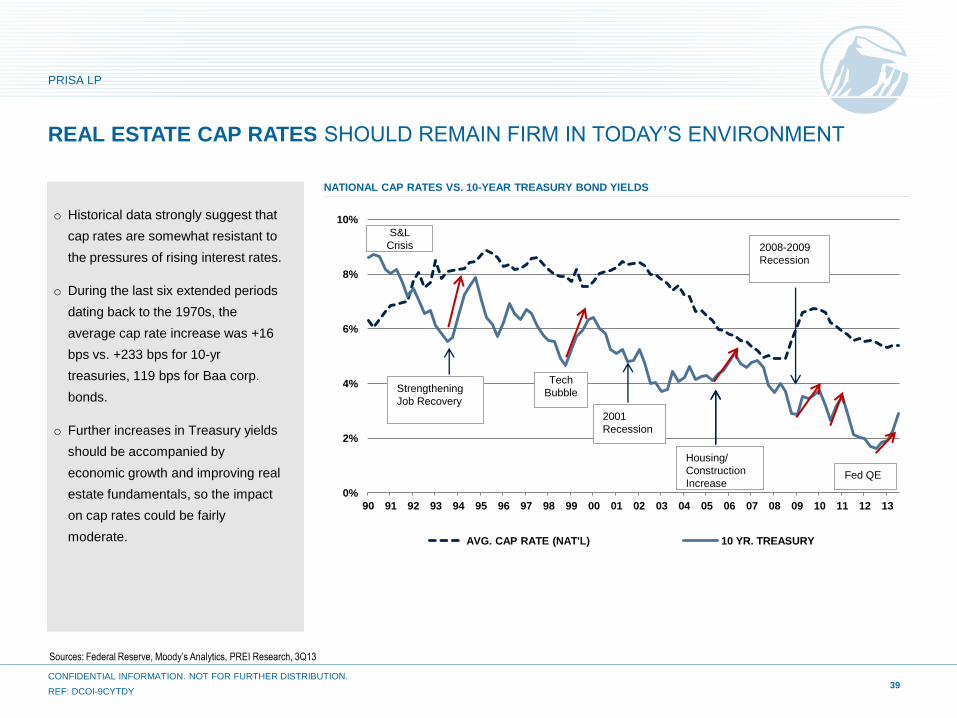
Sources: Federal Reserve, Moody’s Analytics, PREI Research, 3Q13
o Historical data strongly suggest that
cap rates are somewhat resistant to
the pressures of rising interest rates.
o During the last six extended periods
dating back to the 1970s, the
average cap rate increase was +16
bps vs. +233 bps for 10-yr
treasuries, 119 bps for Baa corp.
bonds.
o Further increases in Treasury yields
should be accompanied by
economic growth and improving real
estate fundamentals, so the impact
on cap rates could be fairly
moderate.
REAL ESTATE CAP RATES SHOULD REMAIN FIRM IN TODAY’S ENVIRONMENT
NATIONAL CAP RATES VS. 10-YEAR TREASURY BOND YIELDS
0%
2%
4%
6%
8%
10%
90 91 92 93 94 95 96 97 98 99 00 01 02 03 04 05 06 07 08 09 10 11 12 13
AVG. CAP RATE (NAT'L) 10 YR. TREASURY
S&L
Crisis
Strengthening
Job Recovery
2008-2009
Recession
2001
Recession
Tech
Bubble
Fed QE
Housing/
Construction
Increase
PRISA LP
CONFIDENTIAL INFORMATION. NOT FOR FURTHER DISTRIBUTION.
REF: DCOI-9CYTDY 39
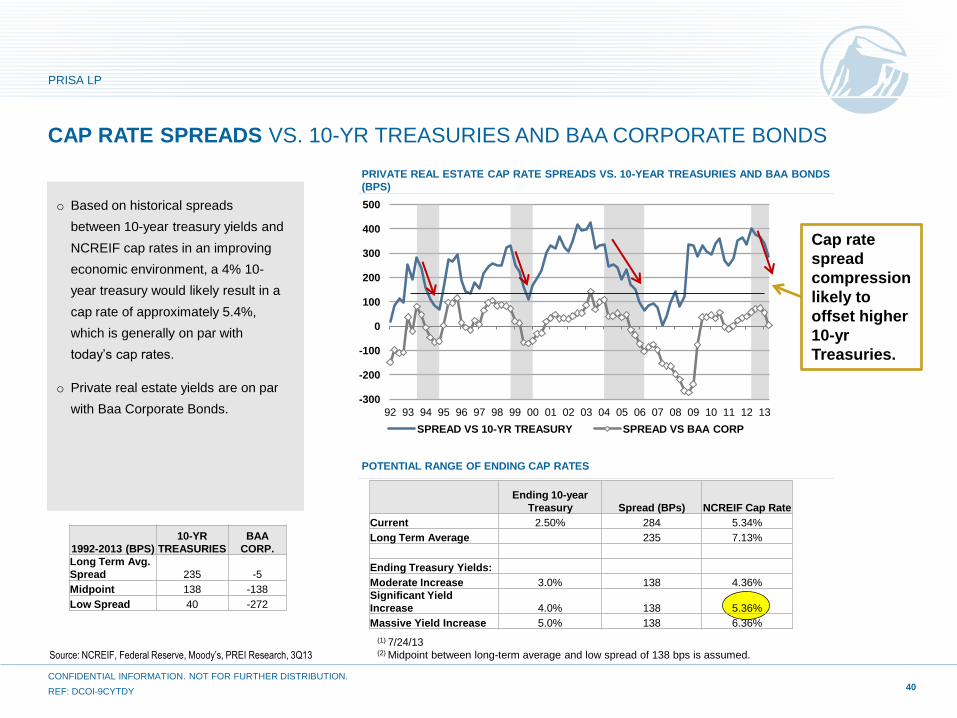
Ending 10-year
Treasury Spread (BPs) NCREIF Cap Rate
Current 2.50% 284 5.34%
Long Term Average 235 7.13%
Ending Treasury Yields:
Moderate Increase 3.0% 138 4.36%
Significant Yield
Increase 4.0% 138 5.36%
Massive Yield Increase 5.0% 138 6.36%
-300
-200
-100
0
100
200
300
400
500
92 93 94 95 96 97 98 99 00 01 02 03 04 05 06 07 08 09 10 11 12 13
SPREAD VS 10-YR TREASURY SPREAD VS BAA CORP
CAP RATE SPREADS VS. 10-YR TREASURIES AND BAA CORPORATE BONDS
(1) 7/24/13
(2) Midpoint between long-term average and low spread of 138 bps is assumed.
o Based on historical spreads
between 10-year treasury yields and
NCREIF cap rates in an improving
economic environment, a 4% 10-
year treasury would likely result in a
cap rate of approximately 5.4%,
which is generally on par with
today’s cap rates.
o Private real estate yields are on par
with Baa Corporate Bonds.
40
PRIVATE REAL ESTATE CAP RATE SPREADS VS. 10-YEAR TREASURIES AND BAA BONDS
(BPS)
POTENTIAL RANGE OF ENDING CAP RATES
1992-2013 (BPS)
10-YR
TREASURIES
BAA
CORP.
Long Term Avg.
Spread 235 -5
Midpoint 138 -138
Low Spread 40 -272
Cap rate
spread
compression
likely to
offset higher
10-yr
Treasuries.
Source: NCREIF, Federal Reserve, Moody’s, PREI Research, 3Q13
PRISA LP
CONFIDENTIAL INFORMATION. NOT FOR FURTHER DISTRIBUTION.
REF: DCOI-9CYTDY
-10
-5
0
5
10
15
80
82
84
86
88
90
92
94
96
88 90 92 94 96 98 00 02 04 06 08 10 12
OCCUPANCY NOI GROWTH
OCCUPANCY NOI GROWTH
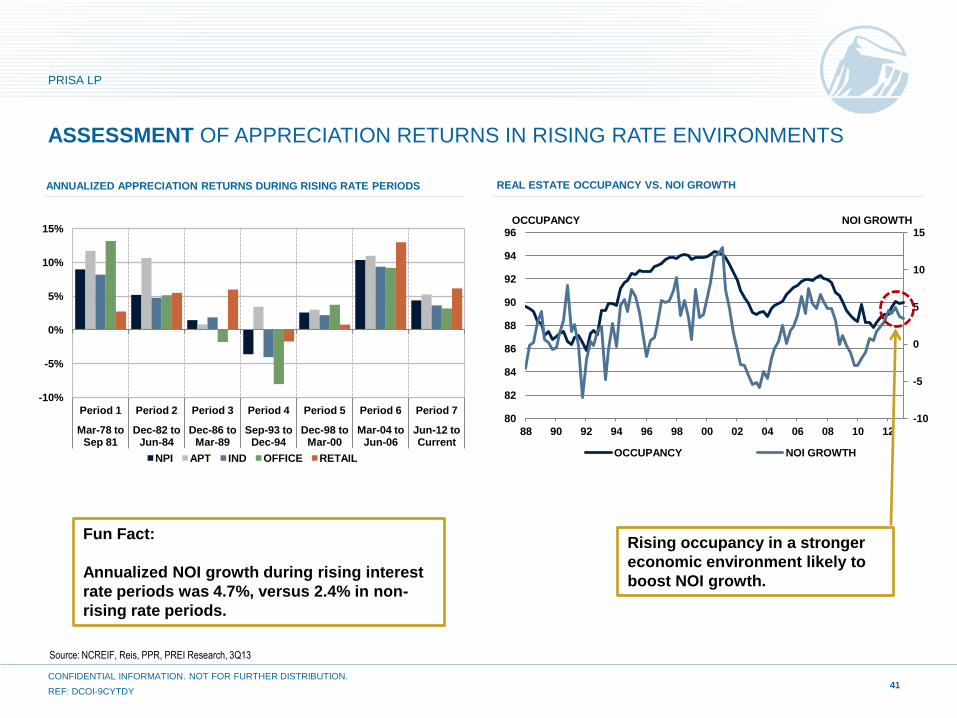
ASSESSMENT OF APPRECIATION RETURNS IN RISING RATE ENVIRONMENTS
41
Rising occupancy in a stronger
economic environment likely to
boost NOI growth.
-10%
-5%
0%
5%
10%
15%
Period 1 Period 2 Period 3 Period 4 Period 5 Period 6 Period 7
Mar-78 to Sep 81
Dec-82 to Jun-84
Dec-86 to Mar-89
Sep-93 to Dec-94
Dec-98 to Mar-00
Mar-04 to Jun-06
Jun-12 to Current
NPI APT IND OFFICE RETAIL
Fun Fact:
Annualized NOI growth during rising interest
rate periods was 4.7%, versus 2.4% in non-
rising rate periods.
Source: NCREIF, Reis, PPR, PREI Research, 3Q13
ANNUALIZED APPRECIATION RETURNS DURING RISING RATE PERIODS REAL ESTATE OCCUPANCY VS. NOI GROWTH
PRISA LP
CONFIDENTIAL INFORMATION. NOT FOR FURTHER DISTRIBUTION.
REF: DCOI-9CYTDY
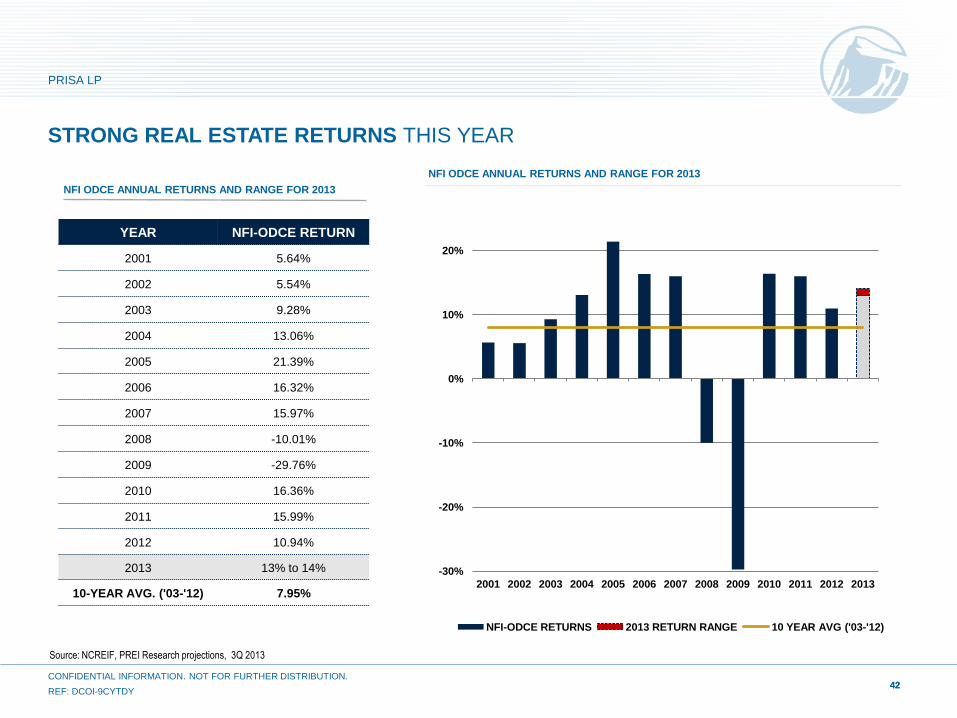
STRONG REAL ESTATE RETURNS THIS YEAR
42
Source: NCREIF, PREI Research projections, 3Q 2013
42
NFI ODCE ANNUAL RETURNS AND RANGE FOR 2013
-30%
-20%
-10%
0%
10%
20%
2001 2002 2003 2004 2005 2006 2007 2008 2009 2010 2011 2012 2013
NFI-ODCE RETURNS 2013 RETURN RANGE 10 YEAR AVG ('03-'12)
YEAR NFI-ODCE RETURN
2001 5.64%
2002 5.54%
2003 9.28%
2004 13.06%
2005 21.39%
2006 16.32%
2007 15.97%
2008 -10.01%
2009 -29.76%
2010 16.36%
2011 15.99%
2012 10.94%
2013 13% to 14%
10-YEAR AVG. ('03-'12) 7.95%
NFI ODCE ANNUAL RETURNS AND RANGE FOR 2013
PRISA LP
CONFIDENTIAL INFORMATION. NOT FOR FURTHER DISTRIBUTION.
REF: DCOI-9CYTDY
SUPPLEMENTAL PRISA LP INFORMATION
CONFIDENTIAL INFORMATION. NOT FOR FURTHER DISTRIBUTION.
REF: DCOI-9CYTDY
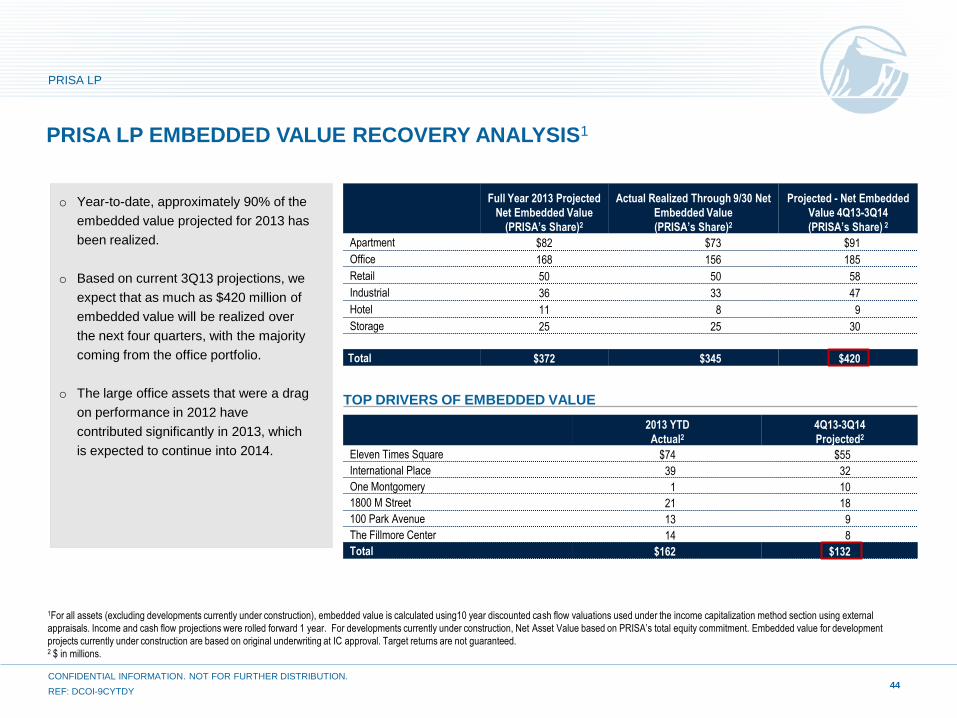
PRISA LP EMBEDDED VALUE RECOVERY ANALYSIS1
44
1For all assets (excluding developments currently under construction), embedded value is calculated using10 year discounted cash flow valuations used under the income capitalization method section using external
appraisals. Income and cash flow projections were rolled forward 1 year. For developments currently under construction, Net Asset Value based on PRISA’s total equity commitment. Embedded value for development
projects currently under construction are based on original underwriting at IC approval. Target returns are not guaranteed. 2 $ in millions.
PRISA LP
CONFIDENTIAL INFORMATION. NOT FOR FURTHER DISTRIBUTION.
REF: DCOI-9CYTDY
o Year-to-date, approximately 90% of the
embedded value projected for 2013 has
been realized.
o Based on current 3Q13 projections, we
expect that as much as $420 million of
embedded value will be realized over
the next four quarters, with the majority
coming from the office portfolio.
o The large office assets that were a drag
on performance in 2012 have
contributed significantly in 2013, which
is expected to continue into 2014.
2013 YTD
Actual2
4Q13-3Q14
Projected2
Eleven Times Square $74 $55
International Place 39 32
One Montgomery 1 10
1800 M Street 21 18
100 Park Avenue 13 9
The Fillmore Center 14 8
Total $162 $132
Full Year 2013 Projected
Net Embedded Value
(PRISA’s Share)2
Actual Realized Through 9/30 Net
Embedded Value
(PRISA’s Share)2
Projected - Net Embedded
Value 4Q13-3Q14
(PRISA’s Share) 2
Apartment $82 $73 $91
Office 168 156 185
Retail 50 50 58
Industrial 36 33 47
Hotel 11 8 9
Storage 25 25 30
Total $372 $345 $420
TOP DRIVERS OF EMBEDDED VALUE
45
PRISA LP
CONFIDENTIAL INFORMATION. NOT FOR FURTHER DISTRIBUTION.
REF: DCOI-9CYTDY
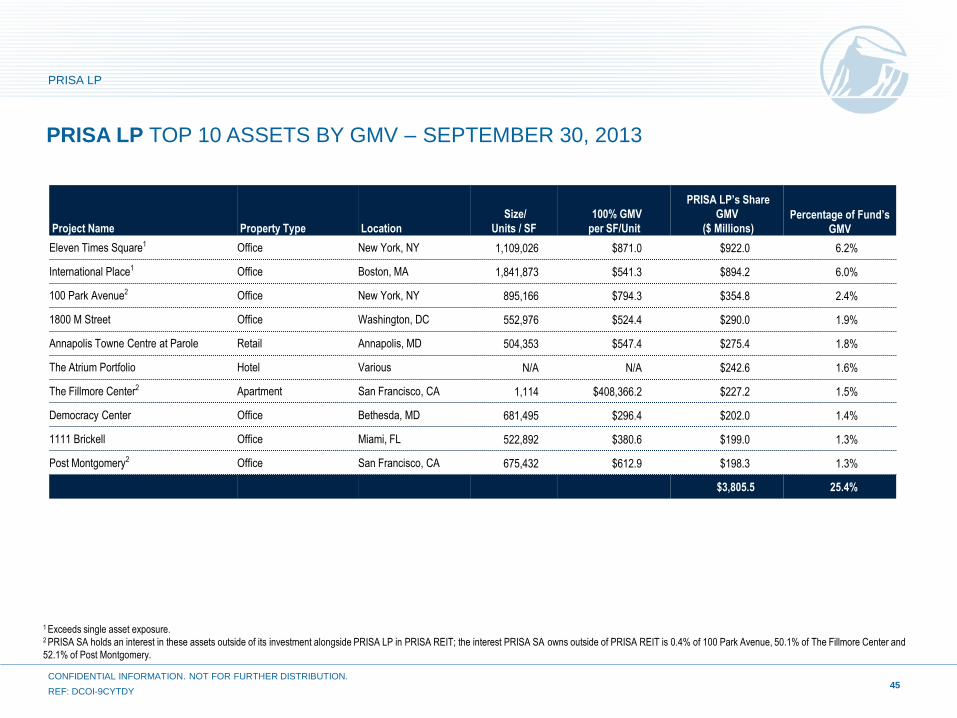
PRISA LP TOP 10 ASSETS BY GMV – SEPTEMBER 30, 2013
1 Exceeds single asset exposure. 2 PRISA SA holds an interest in these assets outside of its investment alongside PRISA LP in PRISA REIT; the interest PRISA SA owns outside of PRISA REIT is 0.4% of 100 Park Avenue, 50.1% of The Fillmore Center and
52.1% of Post Montgomery.
Project Name Property Type Location
Size/
Units / SF
100% GMV
per SF/Unit
PRISA LP’s Share
GMV
($ Millions) Percentage of Fund’s
GMV
Eleven Times Square1 Office New York, NY 1,109,026 $871.0 $922.0 6.2%
International Place1 Office Boston, MA 1,841,873 $541.3 $894.2 6.0%
100 Park Avenue2 Office New York, NY 895,166 $794.3 $354.8 2.4%
1800 M Street Office Washington, DC 552,976 $524.4 $290.0 1.9%
Annapolis Towne Centre at Parole Retail Annapolis, MD 504,353 $547.4 $275.4 1.8%
The Atrium Portfolio Hotel Various N/A N/A $242.6 1.6%
The Fillmore Center2 Apartment San Francisco, CA 1,114 $408,366.2 $227.2 1.5%
Democracy Center Office Bethesda, MD 681,495 $296.4 $202.0 1.4%
1111 Brickell Office Miami, FL 522,892 $380.6 $199.0 1.3%
Post Montgomery2 Office San Francisco, CA 675,432 $612.9 $198.3 1.3%
$3,805.5 25.4%
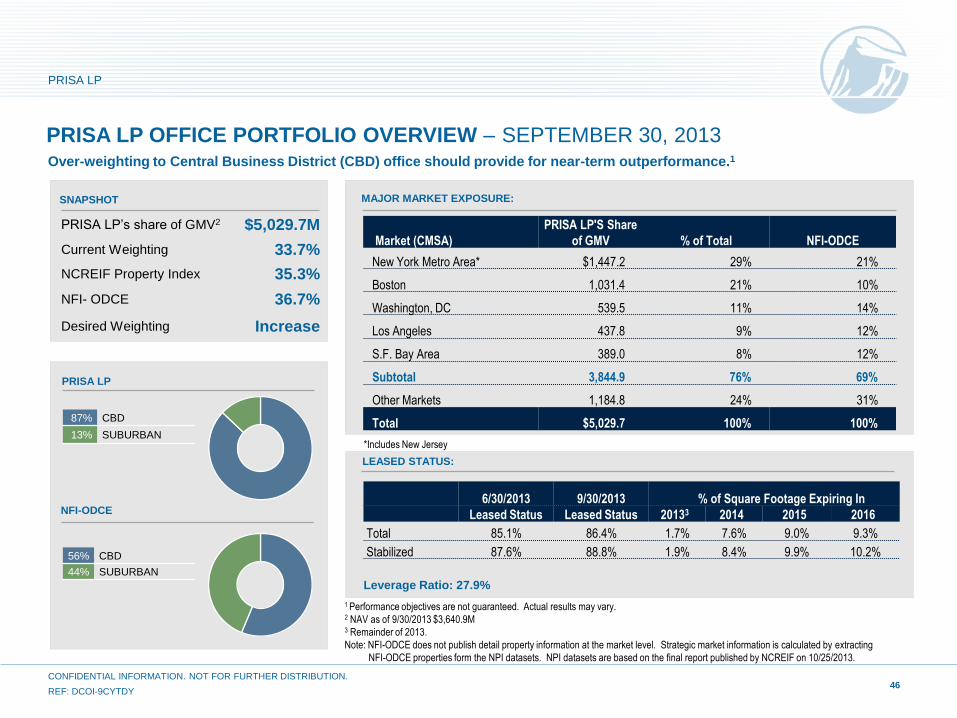
PRISA LP’s share of GMV2 $5,029.7M
Current Weighting 33.7%
NCREIF Property Index 35.3%
NFI- ODCE 36.7%
Desired Weighting Increase
56% CBD
44% SUBURBAN
87% CBD
13% SUBURBAN
PRISA LP
PRISA LP OFFICE PORTFOLIO OVERVIEW – SEPTEMBER 30, 2013
46
Over-weighting to Central Business District (CBD) office should provide for near-term outperformance.1
MAJOR MARKET EXPOSURE:
1 Performance objectives are not guaranteed. Actual results may vary.
2 NAV as of 9/30/2013 $3,640.9M 3 Remainder of 2013.
Note: NFI-ODCE does not publish detail property information at the market level. Strategic market information is calculated by extracting
NFI-ODCE properties form the NPI datasets. NPI datasets are based on the final report published by NCREIF on 10/25/2013.
LEASED STATUS:
Leverage Ratio: 27.9%
NFI-ODCE
Market (CMSA)
PRISA LP'S Share
of GMV % of Total NFI-ODCE
New York Metro Area* $1,447.2 29% 21%
Boston 1,031.4 21% 10%
Washington, DC 539.5 11% 14%
Los Angeles 437.8 9% 12%
S.F. Bay Area 389.0 8% 12%
Subtotal 3,844.9 76% 69%
Other Markets 1,184.8 24% 31%
Total $5,029.7 100% 100%
6/30/2013 9/30/2013 % of Square Footage Expiring In
Leased Status Leased Status 20133 2014 2015 2016
Total 85.1% 86.4% 1.7% 7.6% 9.0% 9.3%
Stabilized 87.6% 88.8% 1.9% 8.4% 9.9% 10.2%
SNAPSHOT
*Includes New Jersey
PRISA LP
CONFIDENTIAL INFORMATION. NOT FOR FURTHER DISTRIBUTION.
REF: DCOI-9CYTDY
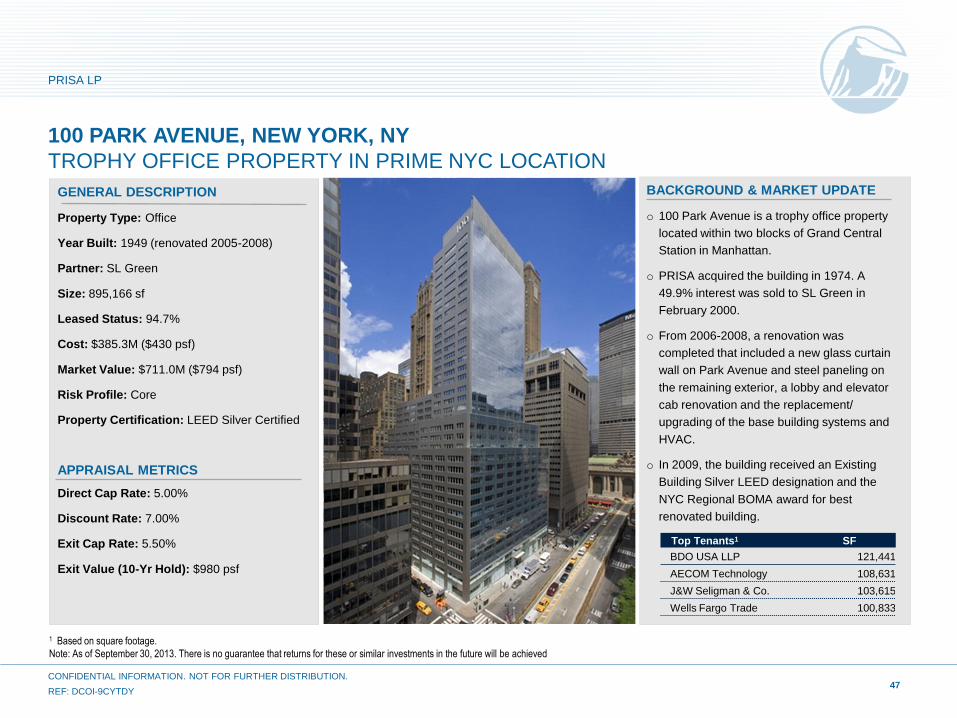
100 PARK AVENUE, NEW YORK, NY
TROPHY OFFICE PROPERTY IN PRIME NYC LOCATION
47
PRISA LP
CONFIDENTIAL INFORMATION. NOT FOR FURTHER DISTRIBUTION.
REF: DCOI-9CYTDY
1 Based on square footage.
Note: As of September 30, 2013. There is no guarantee that returns for these or similar investments in the future will be achieved
GENERAL DESCRIPTION
Property Type: Office
Year Built: 1949 (renovated 2005-2008)
Partner: SL Green
Size: 895,166 sf
Leased Status: 94.7%
Cost: $385.3M ($430 psf)
Market Value: $711.0M ($794 psf)
Risk Profile: Core
Property Certification: LEED Silver Certified
APPRAISAL METRICS
Direct Cap Rate: 5.00%
Discount Rate: 7.00%
Exit Cap Rate: 5.50%
Exit Value (10-Yr Hold): $980 psf
BACKGROUND & MARKET UPDATE
o 100 Park Avenue is a trophy office property
located within two blocks of Grand Central
Station in Manhattan.
o PRISA acquired the building in 1974. A
49.9% interest was sold to SL Green in
February 2000.
o From 2006-2008, a renovation was
completed that included a new glass curtain
wall on Park Avenue and steel paneling on
the remaining exterior, a lobby and elevator
cab renovation and the replacement/
upgrading of the base building systems and
HVAC.
o In 2009, the building received an Existing
Building Silver LEED designation and the
NYC Regional BOMA award for best
renovated building.
Top Tenants1 SF
BDO USA LLP 121,441
AECOM Technology 108,631
J&W Seligman & Co. 103,615
Wells Fargo Trade 100,833
SNAPSHOT
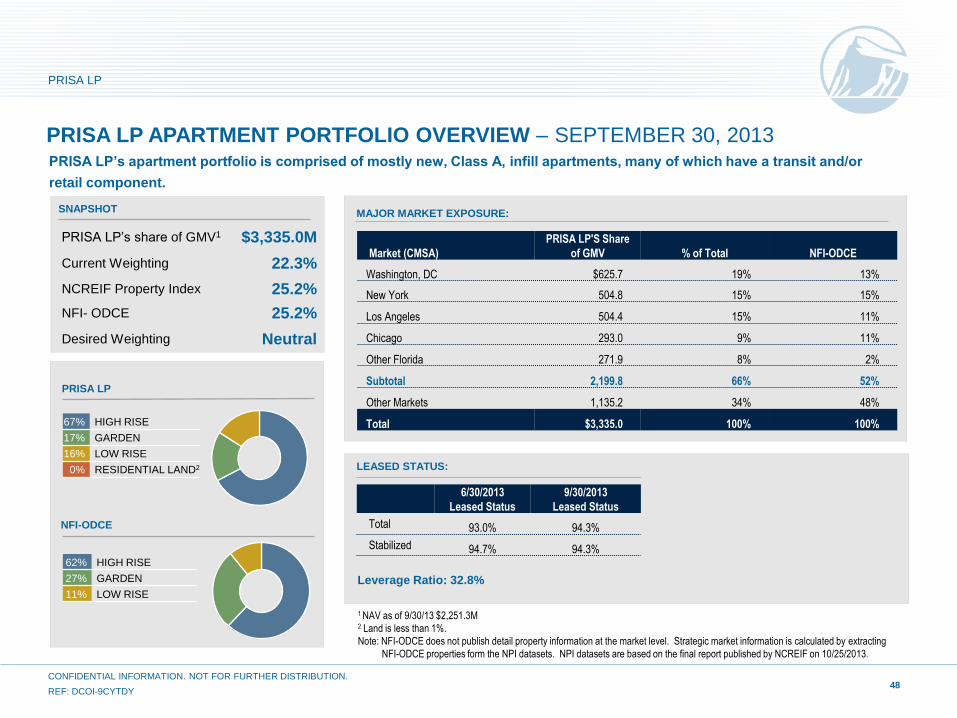
67% HIGH RISE
17% GARDEN
16% LOW RISE
0% RESIDENTIAL LAND2
PRISA LP APARTMENT PORTFOLIO OVERVIEW – SEPTEMBER 30, 2013
48
PRISA LP’s apartment portfolio is comprised of mostly new, Class A, infill apartments, many of which have a transit and/or
retail component.
1 NAV as of 9/30/13 $2,251.3M 2 Land is less than 1%.
Note: NFI-ODCE does not publish detail property information at the market level. Strategic market information is calculated by extracting
NFI-ODCE properties form the NPI datasets. NPI datasets are based on the final report published by NCREIF on 10/25/2013.
LEASED STATUS:
MAJOR MARKET EXPOSURE:
Market (CMSA)
PRISA LP'S Share
of GMV % of Total NFI-ODCE
Washington, DC $625.7 19% 13%
New York 504.8 15% 15%
Los Angeles 504.4 15% 11%
Chicago 293.0 9% 11%
Other Florida 271.9 8% 2%
Subtotal 2,199.8 66% 52%
Other Markets 1,135.2 34% 48%
Total $3,335.0 100% 100%
Leverage Ratio: 32.8%
NFI-ODCE
PRISA LP
62% HIGH RISE
27% GARDEN
11% LOW RISE
PRISA LP’s share of GMV1 $3,335.0M
Current Weighting 22.3%
NCREIF Property Index 25.2%
NFI- ODCE 25.2%
Desired Weighting Neutral
6/30/2013
Leased Status
9/30/2013
Leased Status
Total 93.0% 94.3%
Stabilized 94.7% 94.3%
PRISA LP
CONFIDENTIAL INFORMATION. NOT FOR FURTHER DISTRIBUTION.
REF: DCOI-9CYTDY

THE FILLMORE CENTER, SAN FRANCISCO, CA
HIGH-RISE LUXURY APARTMENT COMMUNITY
49
PRISA LP
CONFIDENTIAL INFORMATION. NOT FOR FURTHER DISTRIBUTION.
REF: DCOI-9CYTDY
Note: As of September 30, 2013. There is no guarantee that returns for these or similar investments in the future will be achieved.
GENERAL DESCRIPTION
Property Type: Residential
Year Built: 1987-1991
Size: 1,114 units
Leased Status: 97.8%
Cost: $254.8M ($228,715 per unit)
Market Value: $454.9M ($408,366 per unit)
Risk Profile: Core
Property Certification: LEED Silver Certified
APPRAISAL METRICS
Direct Cap Rate: 4.25%
Discount Rate: 6.75%
Exit Cap Rate: 5.25%
Exit Value (10-Yr Hold): $487,915 per unit
BACKGROUND & MARKET UPDATE
o The Fillmore Center is a 1,114-unit luxury
apartment community with 68,000 square
feet of retail located in the Fillmore District
of San Francisco. Amenities include a
swimming pool with hot tub and sauna,
interior courtyards, parking garage, fitness
room, racquetball court, laundry facility, and
a free shuttle service to and from the CBD.
Select unit amenities include patios,
fireplaces, and full size appliances.
o The property is located amidst a variety of
retail and commercial properties, including
boutiques, restaurants, and live-
entertainment venues.
Unit Type # of Units
Studio 310
1-Bedroom 430
2-Bedroom 342
3-Bedroom 32
Total 1,114
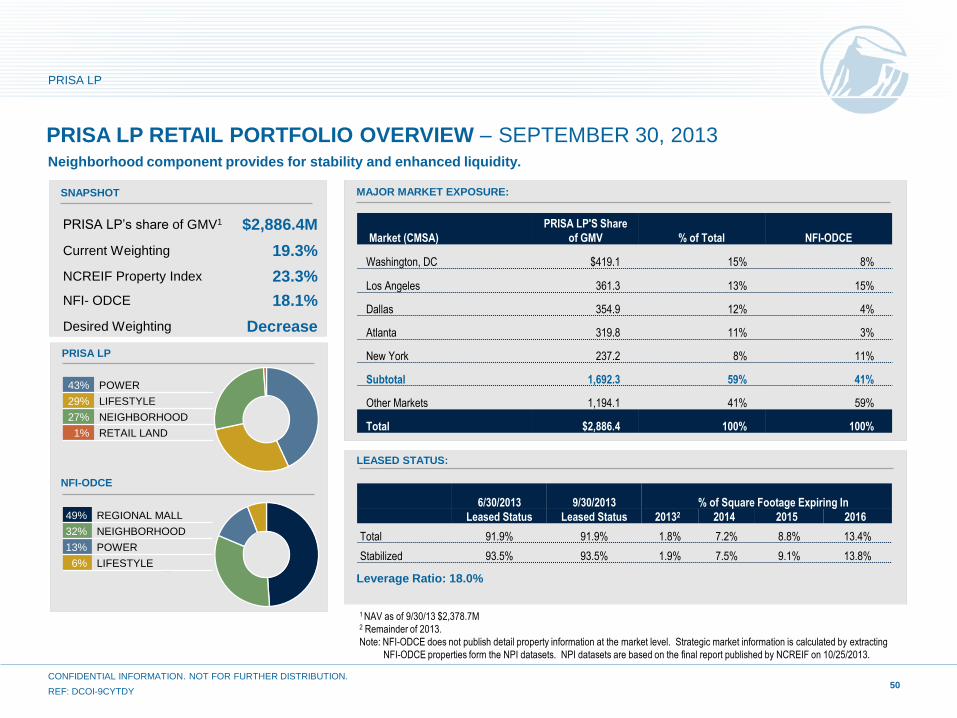
43% POWER
29% LIFESTYLE
27% NEIGHBORHOOD
1% RETAIL LAND
PRISA LP RETAIL PORTFOLIO OVERVIEW – SEPTEMBER 30, 2013
50
Neighborhood component provides for stability and enhanced liquidity.
1 NAV as of 9/30/13 $2,378.7M 2 Remainder of 2013.
Note: NFI-ODCE does not publish detail property information at the market level. Strategic market information is calculated by extracting
NFI-ODCE properties form the NPI datasets. NPI datasets are based on the final report published by NCREIF on 10/25/2013.
Market (CMSA)
PRISA LP'S Share
of GMV % of Total NFI-ODCE
Washington, DC $419.1 15% 8%
Los Angeles 361.3 13% 15%
Dallas 354.9 12% 4%
Atlanta 319.8 11% 3%
New York 237.2 8% 11%
Subtotal 1,692.3 59% 41%
Other Markets 1,194.1 41% 59%
Total $2,886.4 100% 100%
6/30/2013 9/30/2013 % of Square Footage Expiring In
Leased Status Leased Status 20132 2014 2015 2016
Total 91.9% 91.9% 1.8% 7.2% 8.8% 13.4%
Stabilized 93.5% 93.5% 1.9% 7.5% 9.1% 13.8%
LEASED STATUS:
Leverage Ratio: 18.0%
MAJOR MARKET EXPOSURE:
NFI-ODCE
PRISA LP
49% REGIONAL MALL
32% NEIGHBORHOOD
13% POWER
6% LIFESTYLE
SNAPSHOT
PRISA LP’s share of GMV1 $2,886.4M
Current Weighting 19.3%
NCREIF Property Index 23.3%
NFI- ODCE 18.1%
Desired Weighting Decrease
PRISA LP
CONFIDENTIAL INFORMATION. NOT FOR FURTHER DISTRIBUTION.
REF: DCOI-9CYTDY
51
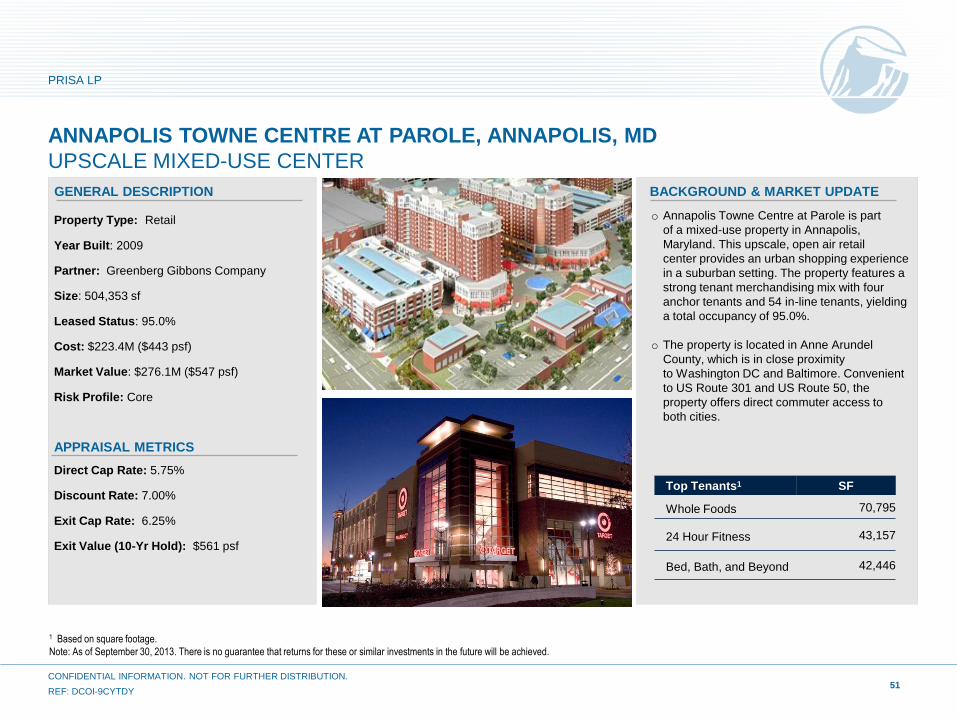
Property Type: Retail
Year Built: 2009
Partner: Greenberg Gibbons Company
Size: 504,353 sf
Leased Status: 95.0%
Cost: $223.4M ($443 psf)
Market Value: $276.1M ($547 psf)
Risk Profile: Core
APPRAISAL METRICS
Direct Cap Rate: 5.75%
Discount Rate: 7.00%
Exit Cap Rate: 6.25%
Exit Value (10-Yr Hold): $561 psf
ANNAPOLIS TOWNE CENTRE AT PAROLE, ANNAPOLIS, MD
UPSCALE MIXED-USE CENTER
GENERAL DESCRIPTION BACKGROUND & MARKET UPDATE
PRISA LP
CONFIDENTIAL INFORMATION. NOT FOR FURTHER DISTRIBUTION.
REF: DCOI-9CYTDY
1 Based on square footage.
Note: As of September 30, 2013. There is no guarantee that returns for these or similar investments in the future will be achieved.
o Annapolis Towne Centre at Parole is part
of a mixed-use property in Annapolis,
Maryland. This upscale, open air retail
center provides an urban shopping experience
in a suburban setting. The property features a
strong tenant merchandising mix with four
anchor tenants and 54 in-line tenants, yielding
a total occupancy of 95.0%.
o The property is located in Anne Arundel
County, which is in close proximity
to Washington DC and Baltimore. Convenient
to US Route 301 and US Route 50, the
property offers direct commuter access to
both cities.
Top Tenants1 SF
Whole Foods 70,795
24 Hour Fitness 43,157
Bed, Bath, and Beyond 42,446
LEASED STATUS:
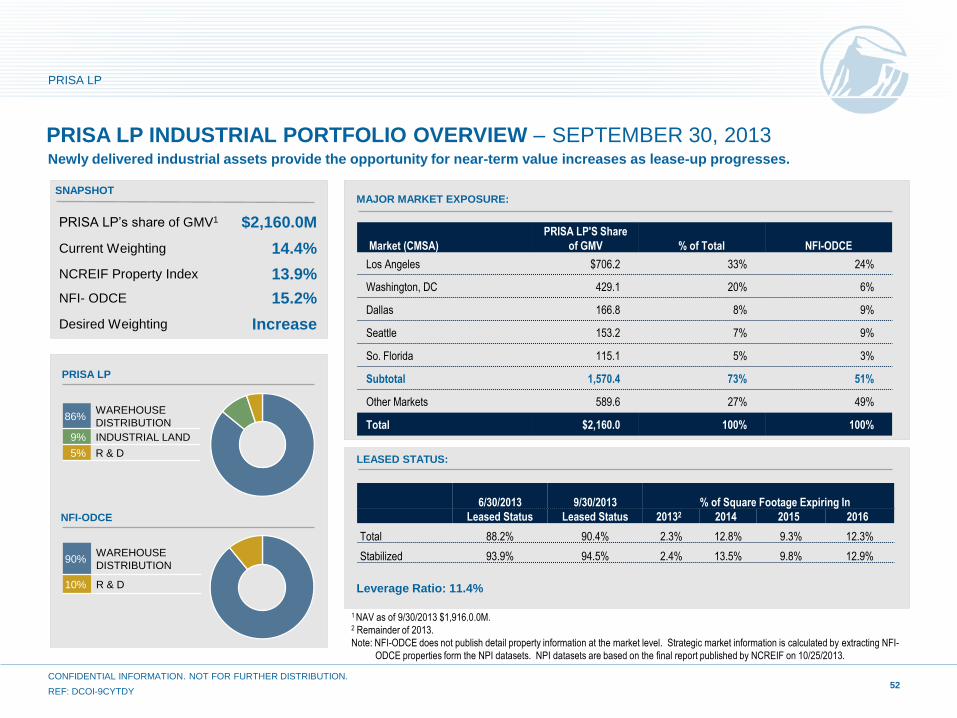
90% WAREHOUSE
DISTRIBUTION
10% R & D
86% WAREHOUSE
DISTRIBUTION
9% INDUSTRIAL LAND
5% R & D
NFI-ODCE
PRISA LP INDUSTRIAL PORTFOLIO OVERVIEW – SEPTEMBER 30, 2013
52
1 NAV as of 9/30/2013 $1,916.0.0M. 2 Remainder of 2013.
Note: NFI-ODCE does not publish detail property information at the market level. Strategic market information is calculated by extracting NFI-
ODCE properties form the NPI datasets. NPI datasets are based on the final report published by NCREIF on 10/25/2013.
PRISA LP
Leverage Ratio: 11.4%
6/30/2013 9/30/2013 % of Square Footage Expiring In
Leased Status Leased Status 20132 2014 2015 2016
Total 88.2% 90.4% 2.3% 12.8% 9.3% 12.3%
Stabilized 93.9% 94.5% 2.4% 13.5% 9.8% 12.9%
MAJOR MARKET EXPOSURE: SNAPSHOT
Newly delivered industrial assets provide the opportunity for near-term value increases as lease-up progresses.
PRISA LP
CONFIDENTIAL INFORMATION. NOT FOR FURTHER DISTRIBUTION.
REF: DCOI-9CYTDY
Market (CMSA)
PRISA LP'S Share
of GMV % of Total NFI-ODCE
Los Angeles $706.2 33% 24%
Washington, DC 429.1 20% 6%
Dallas 166.8 8% 9%
Seattle 153.2 7% 9%
So. Florida 115.1 5% 3%
Subtotal 1,570.4 73% 51%
Other Markets 589.6 27% 49%
Total $2,160.0 100% 100%
PRISA LP’s share of GMV1 $2,160.0M
Current Weighting 14.4%
NCREIF Property Index 13.9%
NFI- ODCE 15.2%
Desired Weighting Increase
53
PACIFIC GATEWAY INDUSTRIAL, TORRANCE, CALIFORNIA
PORT ORIENTED INDUSTRIAL PARK
GENERAL DESCRIPTION BACKGROUND & MARKET UPDATE
PRISA LP
CONFIDENTIAL INFORMATION. NOT FOR FURTHER DISTRIBUTION.
REF: DCOI-9CYTDY
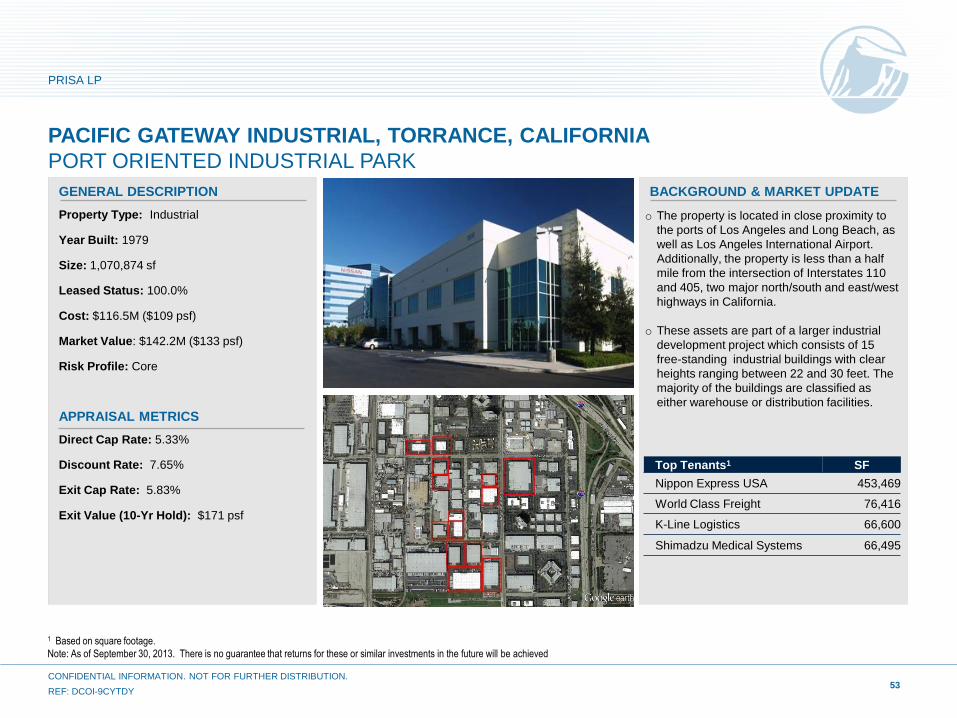
Property Type: Industrial
Year Built: 1979
Size: 1,070,874 sf
Leased Status: 100.0%
Cost: $116.5M ($109 psf)
Market Value: $142.2M ($133 psf)
Risk Profile: Core
APPRAISAL METRICS
Direct Cap Rate: 5.33%
Discount Rate: 7.65%
Exit Cap Rate: 5.83%
Exit Value (10-Yr Hold): $171 psf
1 Based on square footage.
Note: As of September 30, 2013. There is no guarantee that returns for these or similar investments in the future will be achieved
o The property is located in close proximity to
the ports of Los Angeles and Long Beach, as
well as Los Angeles International Airport.
Additionally, the property is less than a half
mile from the intersection of Interstates 110
and 405, two major north/south and east/west
highways in California.
o These assets are part of a larger industrial
development project which consists of 15
free-standing industrial buildings with clear
heights ranging between 22 and 30 feet. The
majority of the buildings are classified as
either warehouse or distribution facilities.
Top Tenants1 SF
Nippon Express USA 453,469
World Class Freight 76,416
K-Line Logistics 66,600
Shimadzu Medical Systems 66,495
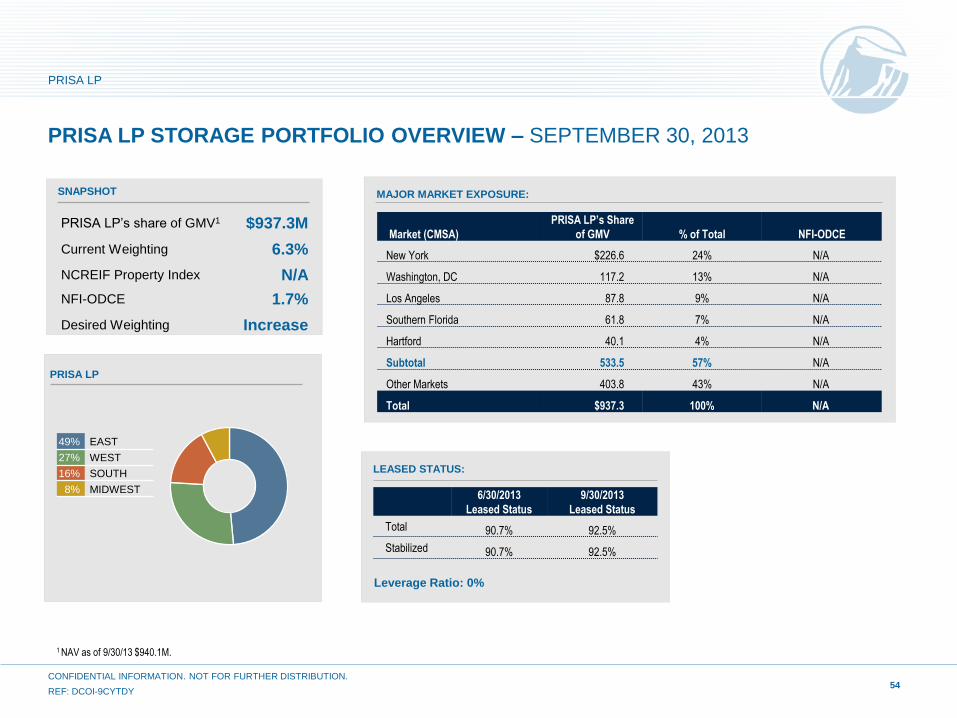
PRISA LP STORAGE PORTFOLIO OVERVIEW – SEPTEMBER 30, 2013
1 NAV as of 9/30/13 $940.1M.
LEASED STATUS:
MAJOR MARKET EXPOSURE:
Market (CMSA)
PRISA LP’s Share
of GMV % of Total NFI-ODCE
New York $226.6 24% N/A
Washington, DC 117.2 13% N/A
Los Angeles 87.8 9% N/A
Southern Florida 61.8 7% N/A
Hartford 40.1 4% N/A
Subtotal 533.5 57% N/A
Other Markets 403.8 43% N/A
Total $937.3 100% N/A
Leverage Ratio: 0%
6/30/2013
Leased Status
9/30/2013
Leased Status
Total 90.7% 92.5%
Stabilized 90.7% 92.5%
SNAPSHOT
PRISA LP’s share of GMV1 $937.3M
Current Weighting 6.3%
NCREIF Property Index N/A
NFI-ODCE 1.7%
Desired Weighting Increase
PRISA LP
49% EAST
27% WEST
16% SOUTH
8% MIDWEST
54
PRISA LP
CONFIDENTIAL INFORMATION. NOT FOR FURTHER DISTRIBUTION.
REF: DCOI-9CYTDY
55
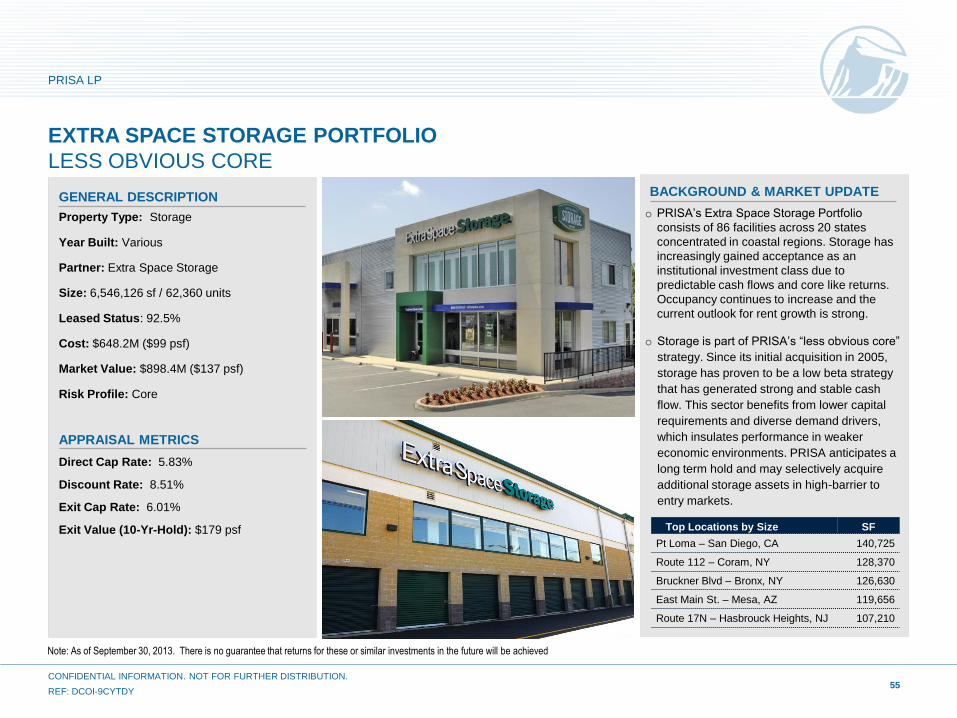
EXTRA SPACE STORAGE PORTFOLIO
LESS OBVIOUS CORE
GENERAL DESCRIPTION BACKGROUND & MARKET UPDATE
PRISA LP
CONFIDENTIAL INFORMATION. NOT FOR FURTHER DISTRIBUTION.
REF: DCOI-9CYTDY
Property Type: Storage
Year Built: Various
Partner: Extra Space Storage
Size: 6,546,126 sf / 62,360 units
Leased Status: 92.5%
Cost: $648.2M ($99 psf)
Market Value: $898.4M ($137 psf)
Risk Profile: Core
APPRAISAL METRICS
Direct Cap Rate: 5.83%
Discount Rate: 8.51%
Exit Cap Rate: 6.01%
Exit Value (10-Yr-Hold): $179 psf
o PRISA’s Extra Space Storage Portfolio
consists of 86 facilities across 20 states
concentrated in coastal regions. Storage has
increasingly gained acceptance as an
institutional investment class due to
predictable cash flows and core like returns.
Occupancy continues to increase and the
current outlook for rent growth is strong.
o Storage is part of PRISA’s “less obvious core”
strategy. Since its initial acquisition in 2005,
storage has proven to be a low beta strategy
that has generated strong and stable cash
flow. This sector benefits from lower capital
requirements and diverse demand drivers,
which insulates performance in weaker
economic environments. PRISA anticipates a
long term hold and may selectively acquire
additional storage assets in high-barrier to
entry markets.
Note: As of September 30, 2013. There is no guarantee that returns for these or similar investments in the future will be achieved
Top Locations by Size SF
Pt Loma – San Diego, CA 140,725
Route 112 – Coram, NY 128,370
Bruckner Blvd – Bronx, NY 126,630
East Main St. – Mesa, AZ 119,656
Route 17N – Hasbrouck Heights, NJ 107,210

SNAPSHOT
PRISA LP HOTEL PORTFOLIO OVERVIEW – SEPTEMBER 30, 2013
1 NAV as of 9/30/13 $604.6M
Note: NFI-ODCE does not publish detail property information at the market level. Strategic market information is calculated by extracting
NFI-ODCE properties form the NPI datasets. NPI datasets are based on the final report published by NCREIF on 10/25/2013.
LEASED STATUS:
MAJOR MARKET EXPOSURE:
Market (CMSA)
PRISA LP’s Share
of GMV % of Total NFI-ODCE
Atrium Portfolio (Various) $242.6 41% N/A
Four Seasons (Austin, TX) 141.0 24% N/A
Hotel Sofitel (Redwood City, CA) 101.0 17% N/A
James Hotel (New York, NY) 84.8 14% N/A
Lake Buena Vista (Orlando, FL) 26.3 4% N/A
Total $595.7 100% N/A
Leverage Ratio: 0%
PRISA LP’s share of GMV1 $595.7M
Current Weighting 4.0%
NCREIF Property Index 2.3%
NFI-ODCE 2.1%
Desired Weighting Neutral
6/30/2013
Leased Status
9/30/2013
Leased Status
Total 79.7% 82.3%
Stabilized 79.7% 82.3%
NFI-ODCE
PRISA LP
39% SOUTH
26% WEST
23% EAST
12% MIDWEST
40% EAST
33% SOUTH
20% WEST
7% MIDWEST
56
PRISA LP
CONFIDENTIAL INFORMATION. NOT FOR FURTHER DISTRIBUTION.
REF: DCOI-9CYTDY

57
GENERAL DESCRIPTION
THE FOUR SEASONS AUSTIN, TX
LUXURY HOTEL IN A TECH MARKET
APPRAISAL METRICS
BACKGROUND & MARKET UPDATE
PRISA LP
CONFIDENTIAL INFORMATION. NOT FOR FURTHER DISTRIBUTION.
REF: DCOI-9CYTDY
Note: As of September 30, 2013. There is no guarantee that returns for these or similar investments in the future will be achieved
Direct Cap Rate: 6.75%
Discount Rate: 9.50%
Exit Cap Rate: 7.25%
Exit Value (10-Yr Hold): $690,856 per key
Property Type: Hotel
Year Built: 2007
Partner: Lodging Capital Partners
Size: 291 keys
Leased Status: 78.7%
Cost: $127.5M ($438,115 per key)
Market Value: $154.0M ($529,210 per key)
Risk Profile: Core
o The asset is a well located, full-service
luxury hotel in the growing Austin, TX
market.
o The Austin metro area has experienced
consistent population and income growth
over the past decade.
o The hotel is located in close proximity to
major demand generators, including the
University of Texas at Austin, and the Austin
Convention Center. The property is one of
three hotels on Lady Bird Lake and offers
desirable lake view rooms.
o There are no luxury hotel competitors in the
Austin Market.
o Lodging Capital Partners is PRISA’s joint
venture partner on this asset, as well as the
Sofitel in Redwood City, CA.
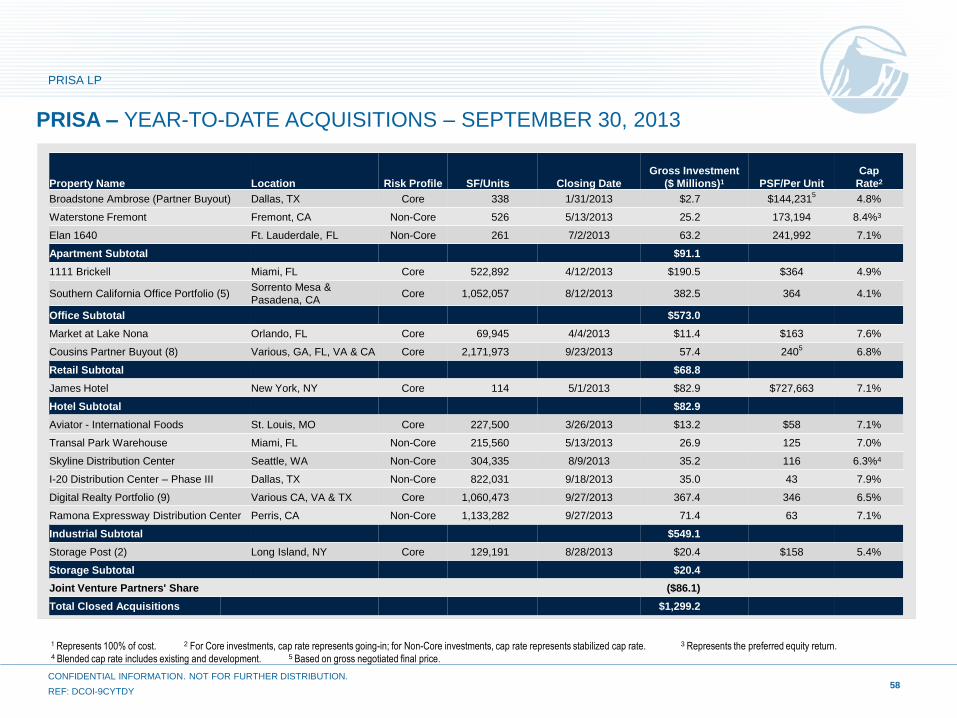
58
PRISA LP
CONFIDENTIAL INFORMATION. NOT FOR FURTHER DISTRIBUTION.
REF: DCOI-9CYTDY
PRISA – YEAR-TO-DATE ACQUISITIONS – SEPTEMBER 30, 2013
1 Represents 100% of cost. 2 For Core investments, cap rate represents going-in; for Non-Core investments, cap rate represents stabilized cap rate. 3 Represents the preferred equity return. 4 Blended cap rate includes existing and development. 5 Based on gross negotiated final price.
Property Name Location Risk Profile SF/Units Closing Date
Gross Investment
($ Millions)1 PSF/Per Unit
Cap
Rate2
Broadstone Ambrose (Partner Buyout) Dallas, TX Core 338 1/31/2013 $2.7 $144,2315
4.8%
Waterstone Fremont Fremont, CA Non-Core 526 5/13/2013 25.2 173,194 8.4%3
Elan 1640 Ft. Lauderdale, FL Non-Core 261 7/2/2013 63.2 241,992 7.1%
Apartment Subtotal $91.1
1111 Brickell Miami, FL Core 522,892 4/12/2013 $190.5 $364 4.9%
Southern California Office Portfolio (5) Sorrento Mesa &
Pasadena, CA Core 1,052,057 8/12/2013 382.5 364 4.1%
Office Subtotal $573.0
Market at Lake Nona Orlando, FL Core 69,945 4/4/2013 $11.4 $163 7.6%
Cousins Partner Buyout (8) Various, GA, FL, VA & CA Core 2,171,973 9/23/2013 57.4 2405
6.8%
Retail Subtotal $68.8
James Hotel New York, NY Core 114 5/1/2013 $82.9 $727,663 7.1%
Hotel Subtotal $82.9
Aviator - International Foods St. Louis, MO Core 227,500 3/26/2013 $13.2 $58 7.1%
Transal Park Warehouse Miami, FL Non-Core 215,560 5/13/2013 26.9 125 7.0%
Skyline Distribution Center Seattle, WA Non-Core 304,335 8/9/2013 35.2 116 6.3%4
I-20 Distribution Center – Phase III Dallas, TX Non-Core 822,031 9/18/2013 35.0 43 7.9%
Digital Realty Portfolio (9) Various CA, VA & TX Core 1,060,473 9/27/2013 367.4 346 6.5%
Ramona Expressway Distribution Center Perris, CA Non-Core 1,133,282 9/27/2013 71.4 63 7.1%
Industrial Subtotal $549.1
Storage Post (2) Long Island, NY Core 129,191 8/28/2013 $20.4 $158 5.4%
Storage Subtotal $20.4
Joint Venture Partners' Share ($86.1)
Total Closed Acquisitions $1,299.2
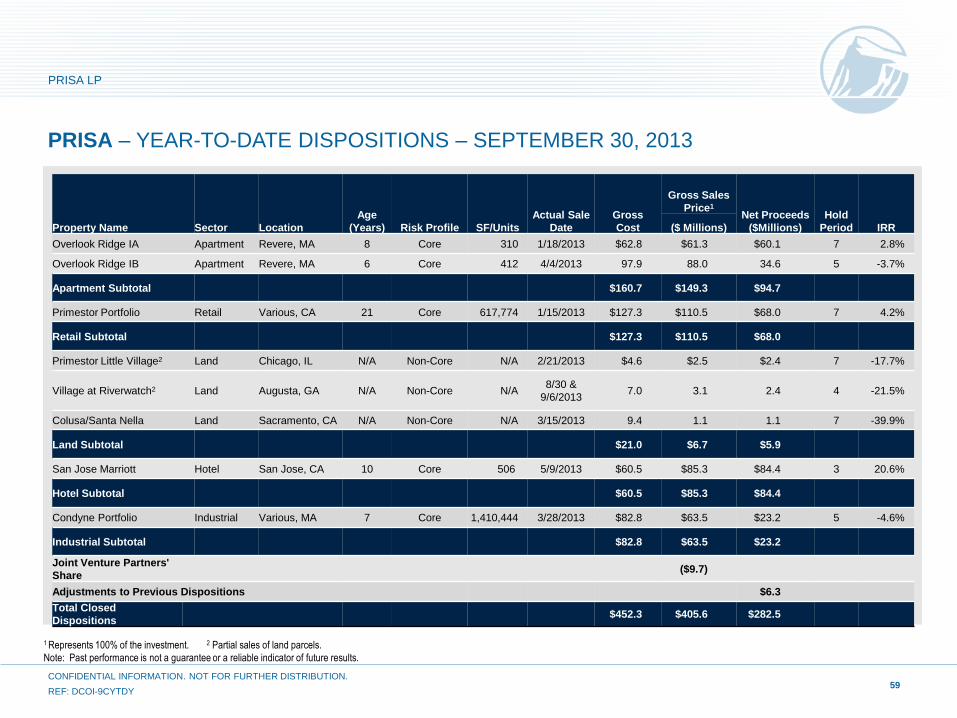
59
PRISA LP
CONFIDENTIAL INFORMATION. NOT FOR FURTHER DISTRIBUTION.
REF: DCOI-9CYTDY
ROUND TRIP HIGHLIGHT
o In 2010, PRISA acquired the mortgage note and took ownership of
the San Jose Marriott, a 506 room hotel, through a friendly deed in
lieu transaction.
o In May 2013, PRISA sold this asset and generated an unlevered IRR
of 20.6% over a three year hold period.
o This disposition was timed to take advantage of an extremely strong
capital market for Bay Area hotel properties; PRISA also avoided
undertaking a $7M lobby and rooms renovation that would have
been required over the next 2-3 years.
PRISA – YEAR-TO-DATE DISPOSITIONS – SEPTEMBER 30, 2013
Property Name Sector Location
Age
(Years) Risk Profile SF/Units
Actual Sale
Date
Gross
Cost
Gross Sales
Price1 Net Proceeds
($Millions)
Hold
Period IRR ($ Millions)
Overlook Ridge IA Apartment Revere, MA 8 Core 310 1/18/2013 $62.8 $61.3 $60.1 7 2.8%
Overlook Ridge IB Apartment Revere, MA 6 Core 412 4/4/2013 97.9 88.0 34.6 5 -3.7%
Apartment Subtotal $160.7 $149.3 $94.7
Primestor Portfolio Retail Various, CA 21 Core 617,774 1/15/2013 $127.3 $110.5 $68.0 7 4.2%
Retail Subtotal $127.3 $110.5 $68.0
Primestor Little Village2 Land Chicago, IL N/A Non-Core N/A 2/21/2013 $4.6 $2.5 $2.4 7 -17.7%
Village at Riverwatch2 Land Augusta, GA N/A Non-Core N/A 8/30 &
9/6/2013 7.0 3.1 2.4 4 -21.5%
Colusa/Santa Nella Land Sacramento, CA N/A Non-Core N/A 3/15/2013 9.4 1.1 1.1 7 -39.9%
Land Subtotal $21.0 $6.7 $5.9
San Jose Marriott Hotel San Jose, CA 10 Core 506 5/9/2013 $60.5 $85.3 $84.4 3 20.6%
Hotel Subtotal $60.5 $85.3 $84.4
Condyne Portfolio Industrial Various, MA 7 Core 1,410,444 3/28/2013 $82.8 $63.5 $23.2 5 -4.6%
Industrial Subtotal $82.8 $63.5 $23.2
Joint Venture Partners'
Share ($9.7)
Adjustments to Previous Dispositions $6.3
Total Closed
Dispositions $452.3 $405.6 $282.5
1 Represents 100% of the investment. 2 Partial sales of land parcels.
Note: Past performance is not a guarantee or a reliable indicator of future results.
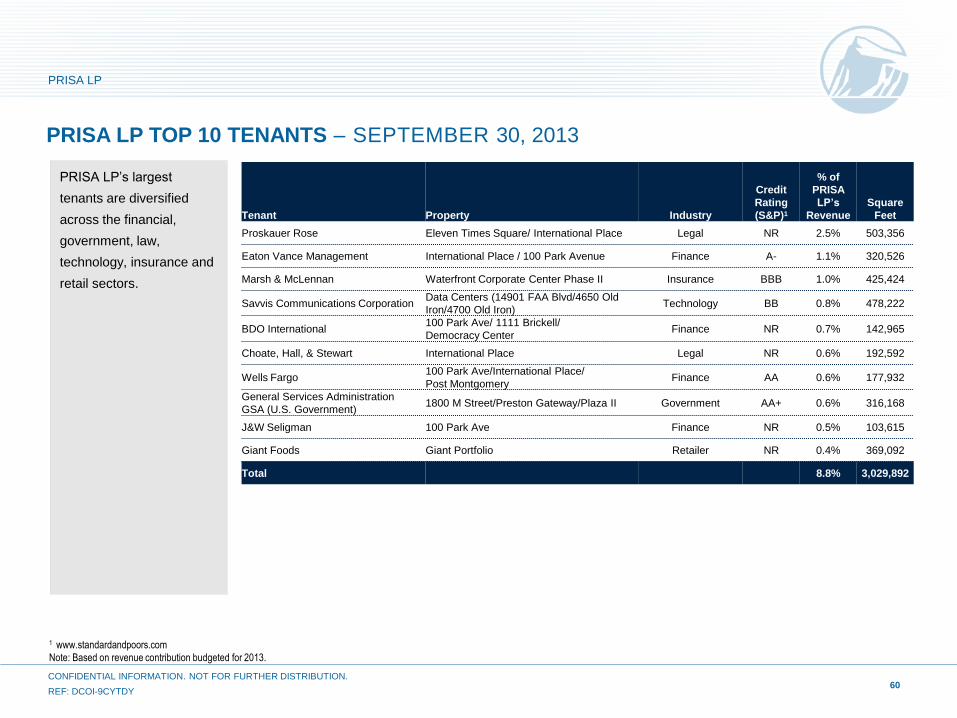
60
PRISA LP
CONFIDENTIAL INFORMATION. NOT FOR FURTHER DISTRIBUTION.
REF: DCOI-9CYTDY
PRISA LP TOP 10 TENANTS – SEPTEMBER 30, 2013
1 www.standardandpoors.com
Note: Based on revenue contribution budgeted for 2013.
PRISA LP’s largest
tenants are diversified
across the financial,
government, law,
technology, insurance and
retail sectors.
Tenant Property Industry
Credit
Rating
(S&P)1
% of
PRISA
LP’s
Revenue
Square
Feet
Proskauer Rose Eleven Times Square/ International Place Legal NR 2.5% 503,356
Eaton Vance Management International Place / 100 Park Avenue Finance A- 1.1% 320,526
Marsh & McLennan Waterfront Corporate Center Phase II Insurance BBB 1.0% 425,424
Savvis Communications Corporation Data Centers (14901 FAA Blvd/4650 Old
Iron/4700 Old Iron) Technology BB 0.8% 478,222
BDO International 100 Park Ave/ 1111 Brickell/
Democracy Center Finance NR 0.7% 142,965
Choate, Hall, & Stewart International Place Legal NR 0.6% 192,592
Wells Fargo 100 Park Ave/International Place/
Post Montgomery Finance AA 0.6% 177,932
General Services Administration
GSA (U.S. Government) 1800 M Street/Preston Gateway/Plaza II Government AA+ 0.6% 316,168
J&W Seligman 100 Park Ave Finance NR 0.5% 103,615
Giant Foods Giant Portfolio Retailer NR 0.4% 369,092
Total 8.8% 3,029,892
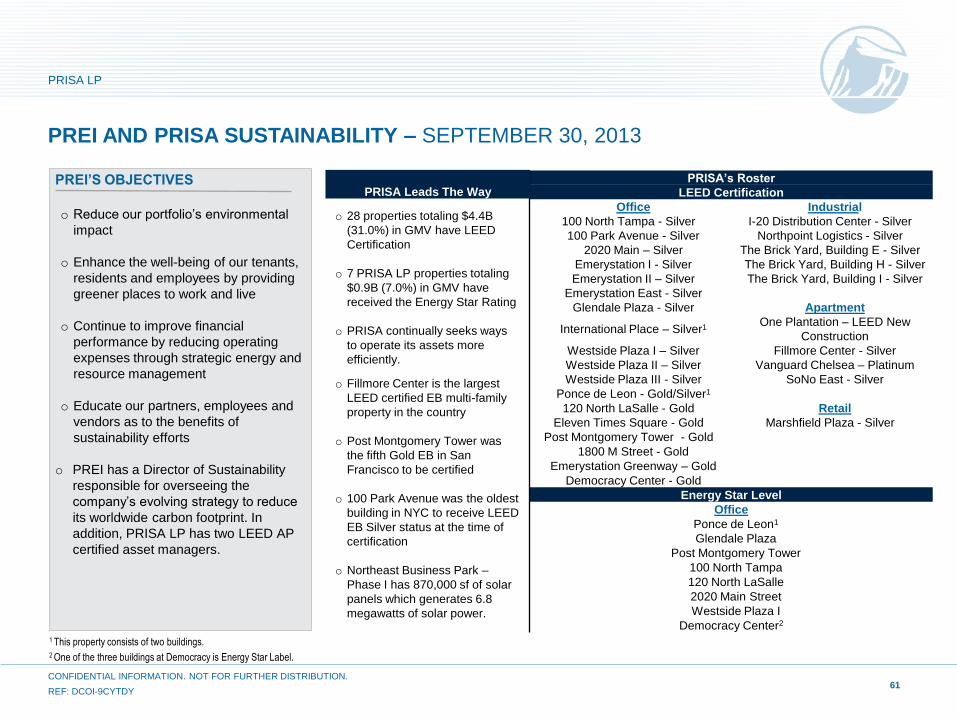
61
PRISA LP
CONFIDENTIAL INFORMATION. NOT FOR FURTHER DISTRIBUTION.
REF: DCOI-9CYTDY
PREI AND PRISA SUSTAINABILITY – SEPTEMBER 30, 2013
PREI’S OBJECTIVES
o Reduce our portfolio’s environmental
impact
o Enhance the well-being of our tenants,
residents and employees by providing
greener places to work and live
o Continue to improve financial
performance by reducing operating
expenses through strategic energy and
resource management
o Educate our partners, employees and
vendors as to the benefits of
sustainability efforts
o PREI has a Director of Sustainability
responsible for overseeing the
company’s evolving strategy to reduce
its worldwide carbon footprint. In
addition, PRISA LP has two LEED AP
certified asset managers.
PRISA’s Roster
LEED Certification
Office Industrial
100 North Tampa - Silver I-20 Distribution Center - Silver
100 Park Avenue - Silver Northpoint Logistics - Silver
2020 Main – Silver The Brick Yard, Building E - Silver
Emerystation I - Silver The Brick Yard, Building H - Silver
Emerystation II – Silver The Brick Yard, Building I - Silver
Emerystation East - Silver
Glendale Plaza - Silver Apartment
International Place – Silver1 One Plantation – LEED New
Construction
Westside Plaza I – Silver Fillmore Center - Silver
Westside Plaza II – Silver Vanguard Chelsea – Platinum
Westside Plaza III - Silver SoNo East - Silver
Ponce de Leon - Gold/Silver1
120 North LaSalle - Gold Retail
Eleven Times Square - Gold Marshfield Plaza - Silver
Post Montgomery Tower - Gold
1800 M Street - Gold
Emerystation Greenway – Gold
Democracy Center - Gold
Energy Star Level
Office
Ponce de Leon1
Glendale Plaza
Post Montgomery Tower
100 North Tampa
120 North LaSalle
2020 Main Street
Westside Plaza I
Democracy Center2
1 This property consists of two buildings. 2 One of the three buildings at Democracy is Energy Star Label.
PRISA Leads The Way
o 28 properties totaling $4.4B
(31.0%) in GMV have LEED
Certification
o 7 PRISA LP properties totaling
$0.9B (7.0%) in GMV have
received the Energy Star Rating
o PRISA continually seeks ways
to operate its assets more
efficiently.
o Fillmore Center is the largest
LEED certified EB multi-family
property in the country
o Post Montgomery Tower was
the fifth Gold EB in San
Francisco to be certified
o 100 Park Avenue was the oldest
building in NYC to receive LEED
EB Silver status at the time of
certification
o Northeast Business Park –
Phase I has 870,000 sf of solar
panels which generates 6.8
megawatts of solar power.
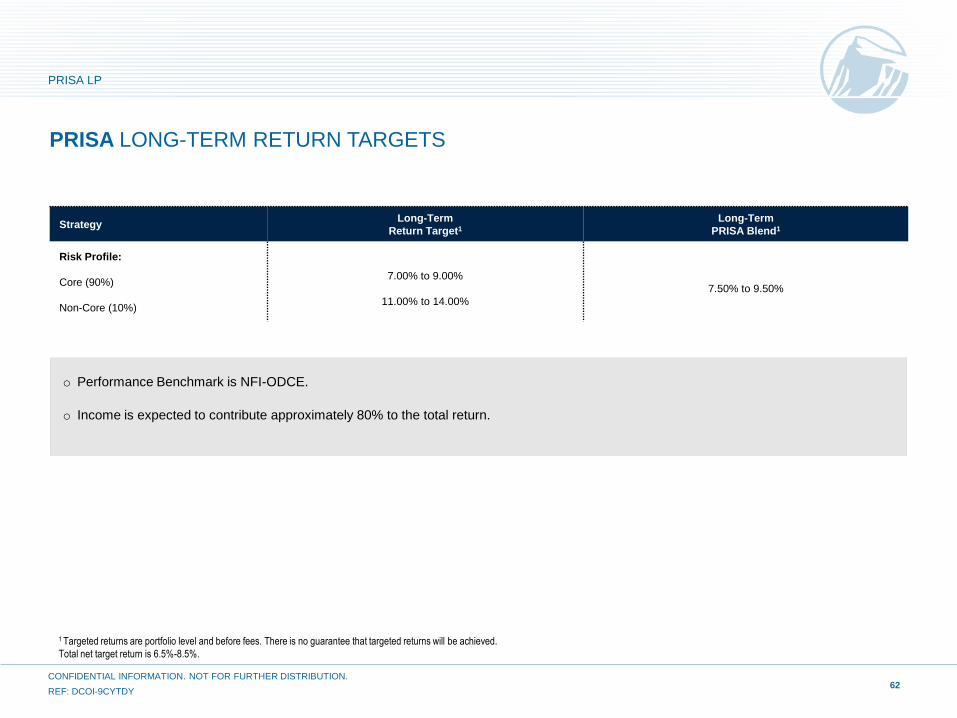
PRISA LONG-TERM RETURN TARGETS
o Performance Benchmark is NFI-ODCE.
o Income is expected to contribute approximately 80% to the total return.
1 Targeted returns are portfolio level and before fees. There is no guarantee that targeted returns will be achieved.
Total net target return is 6.5%-8.5%.
62
Strategy Long-Term
Return Target1
Long-Term
PRISA Blend1
Risk Profile:
Core (90%)
Non-Core (10%)
7.00% to 9.00%
11.00% to 14.00%
7.50% to 9.50%
PRISA LP
CONFIDENTIAL INFORMATION. NOT FOR FURTHER DISTRIBUTION.
REF: DCOI-9CYTDY

4.40% 4.55% 5.15% 5.64%
6.84% 7.35%
9.70%
-6.55%
0.21% 0.79%
11.99%
14.57%
-1.63%
5.87%
7.67%
-10%
-5%
0%
5%
10%
15%
20%
INCOME APPRECIATION TOTAL
PRISA LP RETURNS AFTER MANAGER COMPENSATION/FEES –
SEPTEMBER 30, 20131
63
1 Returns prior to 1/1/13 are based upon PRISA SA.
Note: Returns shown are time-weighted rates of return after deduction of Manager Compensation/Fees using the highest rate applicable. Actual Manager Compensation/Fees schedules and other expenses are
described in the individual investor contracts. Please see Part II of the Prudential Investment Management, Inc. Form ADV, for more information concerning fees. Past performance is not a guarantee or reliable indicator
of future results.
FOR PERIODS ENDING 9/30/13
Net Performance
3Q13 YTD
Income 1.03% 3.21%
Appreciation 2.51% 6.75%
Total 3.54% 10.11%
INCEPTION
July 1970
PRISA LP
CONFIDENTIAL INFORMATION. NOT FOR FURTHER DISTRIBUTION.
REF: DCOI-9CYTDY
1-YEAR 3-YEARS 5-YEARS 10-YEARS
ENDNOTES
PRISA Separate Account ("PRISA SA") is the original PRISA fund structured as an insurance company separate account with an inception date of July
1970.
PRISA LP is the new investment vehicle formed on January 1, 2013 to invest in substantially all of the assets of the existing portfolio of PRISA SA (as of
12/31/2012) as well as all assets PRISA elects to invest in going forward.
PRISA or PRISA Composite reflects the combined performance of all assets held by PRISA SA and PRISA LP. Although this is not an actual fund in which
any client is invested, it is indicative of the overall performance of the PRISA investment strategy and, therefore, the PRISA Composite returns and portfolio
metrics will be provided to NCREIF for inclusion in the NFI-ODCE and other NCREIF Indices. PRISA may also refer to the PRISA dedicated portfolio and
asset management teams.
PRISA REIT is the entity through which PRISA LP will make all of its investments. As of September 30, 2013, PRISA LP and PRISA SA own approximately
6.3% and 93.7% of PRISA REIT, respectively. Any reference to PRISA LP’s dollar exposure throughout this document refers to that of PRISA REIT, unless
otherwise noted.
Important Note on Historical Information: Economic terms and other portfolio metrics reported for PRISA, PRISA SA or PRISA LP that include periods to
the formation of PRISA LP reflect information for PRISA SA for those periods prior to January 1, 2013 . Prior to the formation of PRISA LP, PRISA and PRISA
SA were one in the same.
64
PRISA LP
CONFIDENTIAL INFORMATION. NOT FOR FURTHER DISTRIBUTION.
REF: DCOI-9CYTDY
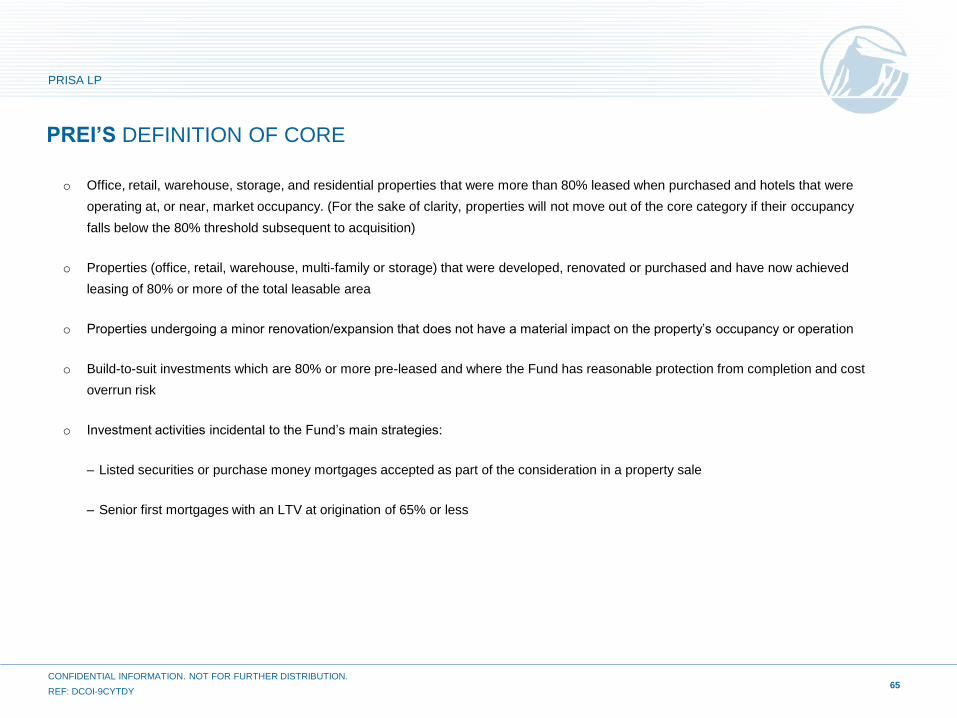
PREI’S DEFINITION OF CORE
o Office, retail, warehouse, storage, and residential properties that were more than 80% leased when purchased and hotels that were
operating at, or near, market occupancy. (For the sake of clarity, properties will not move out of the core category if their occupancy
falls below the 80% threshold subsequent to acquisition)
o Properties (office, retail, warehouse, multi-family or storage) that were developed, renovated or purchased and have now achieved
leasing of 80% or more of the total leasable area
o Properties undergoing a minor renovation/expansion that does not have a material impact on the property’s occupancy or operation
o Build-to-suit investments which are 80% or more pre-leased and where the Fund has reasonable protection from completion and cost
overrun risk
o Investment activities incidental to the Fund’s main strategies:
– Listed securities or purchase money mortgages accepted as part of the consideration in a property sale
– Senior first mortgages with an LTV at origination of 65% or less
65
PRISA LP
CONFIDENTIAL INFORMATION. NOT FOR FURTHER DISTRIBUTION.
REF: DCOI-9CYTDY
All properties held by the Fund are accounted for at fair value in
accordance with applicable contractual requirements and in compliance
with authoritative accounting guidance (US GAAP). Property level debt
is also accounted for at fair value based on the amount at which the
impact of the liability could be measured in a current transaction
exclusive of direct transactions costs. The Fund’s current valuation
procedure is as follows:
The Chief Real Estate Appraiser of PIM (the “Chief Appraiser”) is
responsible for the valuation process of the Fund’s investments and
approves all final values. The Chief Appraiser position is independent
from PREI and reports directly to a senior member of PIM. The Chief
Appraiser retains an independent Appraisal Management Firm to run
the day-to-day operation of the appraisal process. The Appraisal
Management Firm is responsible to assist with the selection, hiring,
oversight, rotation and/or termination of third party appraisal firms. In
addition, the Appraisal Management Firm provides independent
reviews of the appraisal reports.
Although the Fund governing documents requires that every property
that is held by the Fund for a full calendar year is valued at least once
during the calendar year by an independent appraiser with professional
qualifications, the Fund’s current valuation practice is that every
property and other investment is appraised every quarter with the
exception of properties recently acquired or under LOI for sale. The fair
value of land held for development is considered to be acquisition cost,
including soft costs incurred prior to development assuming it is the
assumption a market participant would use. Cost is considered fair
value for properties under development until substantial completion has
occurred assuming the same premise. If cost is not considered to be
representative of market, the properties are independently appraised
based on the general policy. All appraisals are performed in
accordance with the Uniform Standards of Professional Appraisal
Practice (“USPAP”) and consider the conventional method of valuation
(income, cost and market).
As described above, the estimated market value of real estate and real
estate related assets is determined through an appraisal process.
These estimated market values may vary significantly from the prices
at which the real estate investments would sell, since market prices of
real estate investments can only be determined by negotiation between
a willing buyer and seller. Valuations should be considered only
estimates of value and not a measure of realizable value. In addition,
such valuations should be viewed as subject to change with the
passage of time.
PREI VALUATION POLICY
66
PRISA LP
CONFIDENTIAL INFORMATION. NOT FOR FURTHER DISTRIBUTION.
REF: DCOI-9CYTDY
CATHERINE MARCUS
Cathy Marcus is PRISA’s Senior Portfolio
Manager, and is involved in all aspects of
managing the fund including portfolio strategy,
investment decisions and management of the
PRISA team.
From 2002 to early 2004, Cathy was the head of
investment underwriting and operations for the
Transactions Group of PREI. This included the
underwriting review of each investment
presented for approval to PREI’s Investment
Committee, as well as the coordination of the
acquisition activity of the PREI acquisition
professionals located in four regional offices.
From 1998 to 2001, Cathy was Vice President
for Prudential Corporate Real Estate Advisors.
In this capacity, she directed the strategic
planning, development activities and
transactional activities for over $800 million of
corporate real estate on behalf of clients.
Prior to joining Prudential, Cathy was a Second
Vice President with MBL Life Assurance
Corporation. In this position, she was involved in
real estate portfolio management, commercial
loan securitization, commercial mortgage loan
restructuring, portfolio dispositions and special
projects, including the sale of the Agricultural
Lending Division and a luxury resort
development.
Cathy holds a BSE degree in Real Estate
Finance and Entrepreneurial Management from
the Wharton School at the University of
Pennsylvania and a Master of Science degree in
Real Estate Investment and Development from
New York University.
NUMBER OF YEARS REAL ESTATE EXPERIENCE: 26
NUMBER OF YEARS WITH PRUDENTIAL: 15
MANAGING DIRECTOR
67
(973) 683 1601
PRISA LP
CONFIDENTIAL INFORMATION. NOT FOR FURTHER DISTRIBUTION.
REF: DCOI-9CYTDY

JOANNA MULFORD
Joanna is the Portfolio Manager for PRISA, and is
involved in all aspects of managing the fund
including portfolio strategy, investment decisions
and management of the PRISA team.
From 2005 through 2007, Joanna was responsible
for U.S. real estate sales on behalf of PREI’s clients.
In 2007, PREI executed 79 commercial property
sales totaling $5.7 billion.
Joanna had previously been the Portfolio Manager
for three accounts: A mezzanine fund with $250
million of client commitments; a $400 million private
REIT; and a $400 million co-investment program
with an off-shore investor. Prior to this, she was
responsible for the asset management of a portfolio
of commercial real estate investments including
office, residential, retail, storage and industrial
property types and mezzanine loans.
Before joining PREI in 1997, Joanna was a member
of the Private Equity Group, working on behalf of
Prudential’s domestic and international subsidiaries
investing in private equity transactions. Prior to this,
she had been a member of the Comptrollers unit of
the Prudential Asset Management Company since
joining the firm in January of 1990. She provided
support to several of Prudential’s money
management subsidiaries investing in both public
and private equities.
Joanna is a graduate of Rutgers University where
she studied Finance and Management and earned
both an MBA and Bachelor’s Degree.
(973) 683 1743
NUMBER OF YEARS REAL ESTATE EXPERIENCE: 16
NUMBER OF YEARS WITH PRUDENTIAL: 23
MANAGING DIRECTOR
68
PRISA LP
CONFIDENTIAL INFORMATION. NOT FOR FURTHER DISTRIBUTION.
REF: DCOI-9CYTDY
69
FRANK GARCIA
Frank Garcia is a managing director and portfolio
manager for PRISA based in PREI’s San Francisco
office. He is involved in managing all aspects of the
fund including portfolio strategy, investment
decisions and management of the PRISA team.
Before joining PREI, Mr. Garcia was a managing
director at RREEF, where he was a senior portfolio
manager for the firms flagship core fund responsible
for a nearly $5 billion portfolio of assets and the lead
portfolio manager for the firms flagship value-added
fund that reached a peak gross value of $4 billion.
He was also a voting member of the firms
investment committee. Earlier, he worked at Spieker
Properties as a Vice President in Northern California
responsible for the development, management and
leasing of approximately 3 million square feet of
office and industrial space with a total portfolio value
of over $250 million. He was also previously an
industrial real estate broker with CB Commercial
(now CBRE).
A native of Northern California, Frank Garcia holds
a bachelor’s degree from the University of the
Pacific with a concentration in business
administration. [email protected]
(415) 486 3802
NUMBER OF YEARS REAL ESTATE EXPERIENCE: 20
NUMBER OF YEARS WITH PRUDENTIAL: <1
MANAGING DIRECTOR
PRISA LP
CONFIDENTIAL INFORMATION. NOT FOR FURTHER DISTRIBUTION.
REF: DCOI-9CYTDY
70
NICOLE STAGNARO
Nicole Stagnaro is the assistant portfolio
manager for PRISA. As such, she is involved in
many aspects of the Fund’s portfolio strategy,
including investment selection, sales, asset
management and portfolio reporting. She has
been elected to serve on several PREI initiatives
including the global portfolio management round
table.
From 2008 to early 2011, Nicole managed a
portfolio of assets and relationships that were
being closely monitored due to unfavorable
market conditions and executed on resolution
strategies. Additionally, Nicole was responsible
for the asset management of approximately $700
million of properties including hotel, multi-family,
industrial, land and mezzanine loans.
Nicole joined PREI in 2004 as a member of the
acquisition team in San Francisco and
conducted underwriting for approximately $4
billion across all real estate asset classes with a
broad scope of structures and strategies.
Nicole earned a Bachelors Degree in Business
Administration and minor in Psychology from
California Polytechnic State University in San
Luis Obispo and earned a Masters Degree in
Real Estate Finance and Development from New
York University.
NUMBER OF YEARS REAL ESTATE EXPERIENCE: 9
NUMBER OF YEARS WITH PRUDENTIAL: 9
VICE PRESIDENT
(973) 683 1640
PRISA LP
CONFIDENTIAL INFORMATION. NOT FOR FURTHER DISTRIBUTION.
REF: DCOI-9CYTDY

71
PRISA LP
CONFIDENTIAL INFORMATION. NOT FOR FURTHER DISTRIBUTION.
REF: DCOI-9CYTDY
JERRY AVERSANO
Jerry Aversano is a member of Prudential’s real
estate marketing and client service team and has
day-to-day client service and marketing
responsibility for a select group of institutional
investors.
Prior to joining PREI in 2011, Jerry spent three
years at J.P. Morgan in Institutional Asset
Management as a Client Advisor. Jerry’s role
spanned all asset classes, serving defined benefit
pension plans, defined contribution plans,
endowments, foundations, insurance companies,
and hospital systems. Before joining J.P. Morgan,
Jerry was in Institutional Equity Sales at Kaufman
Bros., L.P.
Jerry holds a BS in management and marketing
from Fairfield University. He holds an MBA with
concentrations in finance and strategic management
from Rutgers Business School.
(973) 734-1532
NUMBER OF YEARS REAL ESTATE EXPERIENCE: 6
NUMBER OF YEARS WITH PRUDENTIAL: 3
DIRECTOR
Prudential Investment Management is the primary asset management business of Prudential Financial, Inc. Prudential Real Estate Investors is Prudential Investment Management’s real estate investment advisory business and operates through Prudential Investment Management, Inc. (PIM), a registered investment advisor. Prudential, the Prudential logo and the Rock symbol are service marks of Prudential Financial, Inc. and its related entities, registered in many jurisdictions worldwide. The information contained herein is provided by Prudential Real Estate Investors. This document may contain confidential information and the recipient hereof agrees to maintain the confidentiality of such information. Distribution of this information to any person other than the person to whom it was originally delivered and to such person’s advisers is unauthorized, and any reproduction of these materials, in whole or in part, or the divulgence of any of its contents, without the prior consent of PREI, is prohibited. Certain information in this document has been obtained from sources that PREI believes to be reliable as of the date presented; however, PREI cannot guarantee the accuracy of such information, assure its completeness, or warrant such information will not be changed. The information contained herein is current as of the date of issuance (or such earlier date as referenced herein) and is subject to change without notice. PREI has no obligation to update any or all such information; nor do we make any express or implied warranties or representations as to the completeness or accuracy. Any information presented regarding the affiliates of PREI is presented purely to facilitate an organizational overview and is not a solicitation on behalf of any affiliate. These materials are not intended as an offer or solicitation with respect to the purchase or sale of any security or other financial instrument or any investment management services. These materials do not constitute investment advice and should not be used as the basis for any investment decision. These materials do not take into account individual client circumstances, objectives or needs. No determination has been made
regarding the suitability of any securities, financial instruments or strategies for particular clients or prospects. The information contained herein is provided on the basis and subject to the explanations, caveats and warnings set out in this notice and elsewhere herein. Any discussion of risk management is intended to describe PREI’s efforts to monitor and manage risk but does not imply low risk. All performance and targets contained herein are subject to revision by PREI and are provided solely as a guide to current expectations. There can be no assurance that any product or strategy described herein will achieve any targets or that there will be any return of capital. Past performance is not a guarantee or reliable indicator of future results. No representations are made by PREI as to the actual composition or performance of any account. PRISA LP: The performance target set forth within this presentation is based on a fund that is a broadly diversified, core portfolio that invests primarily in existing, income-producing properties with strong cash flow that is expected to increase over time and thereby provide the potential for capital appreciation. Target returns are expected to be achieved over a complete market cycle which can be defined as a period of time whereby valuations have bottomed (hit a trough), rose to a peak and then declined to the trough point again. PREI has based this investment objective on certain assumptions that it believes are reasonable. There is no guarantee, however, that any or all of such assumptions will prove to be accurate in the face of actual changes in the market or other material changes in regional or local markets specific to this strategy. Factors necessary to achieve this performance target include a property type and geographic diversification strategy, which is intended to reduce risk and maintain a broadly diversified target include a property type and geographic diversification strategy, which is intended to reduce risk and maintain a broadly diversified
DISCLOSURE
72
PRISA LP
CONFIDENTIAL INFORMATION. NOT FOR FURTHER DISTRIBUTION.
REF: DCOI-9CYTDY
portfolio. Property selection and performance impact the ability to achieve the target returns, including asset location, asset class, and property type assets, investment strategy and the capitalization of investment. Property and overall portfolio performance are subject to healthy economic conditions in the US market and sub-markets where investments are located. Factors that would mitigate against achieving this performance target would include, but are not limited to, unforeseen sudden and drastic changes in economic and capital markets and/or demographic trends affecting the US or a particular market or sub market that could impact property performance and/or investors' demand for commercial real estate. There can be no guarantee that this target will be achieved. PRISA II: The basis for the performance target set forth within this presentation is based on a fund that is a broadly diversified equity real estate portfolio that seeks to structure investments to enhance risk-adjusted returns. Target returns are expected to be achieved over a complete market cycle which can be defined as a period of time whereby valuations have bottomed (hit a trough), rose to a peak and then declined to the trough point again. PREI has based this investment objective on certain assumptions that it believes are reasonable. There is no guarantee, however, that any or all of such assumptions will prove to be accurate in the face of actual changes in the market or other material changes in regional or local markets specific to this strategy. Factors necessary to achieve this performance target include a diversification strategy, which is intended to reduce risk and maintain a broadly diversified portfolio. Property selection and performance impact the ability to achieve the target returns, including asset location, asset class, property type of asset, investment strategy and the capitalization of investment. Property and Fund performance are subject to healthy economic conditions in the US market and sub-markets where investments are located. Factors that would mitigate against achieving this performance target would include, but are not limited to, unforeseen sudden and drastic changes in economic and capital markets and/or demographic trends affecting the US or a
particular market or sub market that could impact property performance and/or investors' demand for commercial real estate. PRISA III: The basis for the performance target set forth within this presentation is based on a fund that seeks to execute a value-added strategy by acquiring real estate investments located in diverse markets and to structure investments to enhance risk-adjusted returns. Target returns are expected to be achieved over a complete market cycle which can be defined as a period f of time whereby valuations have bottomed (hit a trough), rose to a peak and then decline to the trough point again. PREI has based this investment objective on certain assumptions that it believes are reasonable. There is no guarantee, however, that any or all of such assumptions will prove to be accurate in the face of actual changes in the market or other material changes in regional or local markets specific to this strategy. Factors necessary to achieve this performance target include a diversification strategy, which is intended to reduce risk and maintain a broadly diversified portfolio. Property selection and performance impact the ability to achieve the target returns, including asset location, asset class, property type of asset, investment strategy and the capitalization of investment. Property and Fund performance are subject to healthy economic conditions in the US market and sub-markets where investments are located. Factors that would mitigate against achieving this performance target would include, but are not limited to, unforeseen sudden and drastic changes in economic and capital markets and/or demographic trends affecting the US or a particular market or sub market, lack of opportunities in the market and/or investors' demand for commercial real estate. There can be no guarantee that this target will be achieved. The financial indices referenced herein as benchmarks are provided for informational purposes only. The holdings and portfolio characteristics may differ from those of the benchmark(s), and such differences may be material. Factors affecting portfolio performance that do not affect
DISCLOSURE
73
PRISA LP
CONFIDENTIAL INFORMATION. NOT FOR FURTHER DISTRIBUTION.
REF: DCOI-9CYTDY
benchmark performance may include portfolio rebalancing, the timing of cash flows, credit quality, diversification and differences in volatility. In addition, financial indices do not reflect the impact of fees, applicable taxes or trading costs which reduce returns. Unless otherwise noted, financial indices assume reinvestment of dividends. You cannot make a direct investment in an index. The statistical data regarding such indices has not been independently verified by PREI. References to specific securities and their issuers are for illustrative purposes only and are not intended and should not be interpreted as recommendations to purchase or sell such securities. The securities referenced may or may not be held in portfolios managed by PREI and, if such securities are held, no representation is being made that such securities will continue to be held. These materials do not purport to provide any legal, tax or accounting advice. These materials are not intended for distribution to or use by any person in any jurisdiction where such distribution would be contrary to local law or regulation. The information contained herein is provided by Prudential Real Estate Investors. Prudential Real Estate Investors is the investment manager of PRISA LP. In addition to this document, PRISA LP or its agent may distribute to you an offering memorandum (the “Memorandum”) and the constitutional documents of PRISA LP (including a limited partnership agreement and/or other governing fund document and a subscription agreement). You should review and carefully consider these documents, especially the risk factors explained within them, and should seek advice from your legal, tax, and other relevant advisers before making any decision to subscribe for interests in PRISA LP. If there is any conflict between this document and the Memorandum and constitutional documents of PRISA LP, the Memorandum and constitutional documents shall prevail. You
must rely solely on the information contained in PRISA LP’s Memorandum and constitutional documents in making any decision to invest. This presentation is being provided to you in connection with your potential investment in PRISA LP and not with respect to a potential investment in PRISA SA. PRISA LP’s portfolio will differ somewhat from the portfolio of PRISA SA. Accordingly, the return information and portfolio composition information included herein with respect to PRISA SA does not necessarily describe or represent the returns and portfolio composition of PRISA LP. Furthermore, PIM/PREI and its affiliates have the right to change the proposed terms of PRISA LP, including the right to decide not to proceed with forming PRISA LP. There can be no assurance that PRISA SA or PRISA LP will meet any performance targets referenced herein. An investor could lose some or all of its investment in PRISA LP. Investments are not guaranteed by PRISA LP, PREI, their respective affiliates, or any governmental agency. Certain securities products and services are distributed by Prudential Investment Management Services LLC, a Prudential Financial company and member of SIPC. Risk Factors: Investments in commercial real estate and real estate-related entities are subject to various risks, including adverse changes in domestic or international economic conditions, local market conditions and the financial conditions of tenants; changes in the number of buyers and sellers of properties; increases in the availability of supply of property relative to demand; changes in availability of debt financing; increases in interest rates, exchange rate fluctuations, the incidence of taxation on real estate, energy prices and other operating expenses; changes in environmental laws and regulations, planning laws and other governmental rules and fiscal policies; changes in the relative popularity of properties risks due to the dependence on cash
DISCLOSURE
74
PRISA LP
CONFIDENTIAL INFORMATION. NOT FOR FURTHER DISTRIBUTION.
REF: DCOI-9CYTDY
flow; risks and operating problems arising out of the presence of certain construction materials; and acts of God, uninsurable losses and other factors which are beyond the control of PREI. As compared with other asset classes, real estate is a relatively illiquid investment. Therefore, investors' withdrawal requests may not be satisfied for significant periods of time. Other than its general fiduciary duties with respect to investors, PREI has no specific obligation to take any particular action (such as liquidation of investments) to satisfy withdrawal requests. In addition, as recent experience has demonstrated, real estate is subject to long-term cyclical trends that give rise to significant volatility in real estate values. The interests in PRISA LP have not been and will not be registered under the U.S. Securities Act and are being offered and sold in compliance with Regulation D under the U.S. Securities Act. The interests are subject to restrictions on transferability and resale and may not be transferred or resold except as permitted under Regulation D under the U.S. Securities Act and the applicable state, foreign and other securities laws, pursuant to registration or exemption there from. Unless issued with respect to one or more investors interests in PRISA LP will only be offered to “qualified purchasers” under the Investment Company Act of 1940, as amended. The transferability of interests will be further restricted by the terms of the Partnership Agreement of PRISA LP. Prospective Investors should be aware that they may be required to bear the financial risks of this investment for an indefinite period of time. These materials represent the views, opinions and recommendations of the author(s) regarding the economic conditions, asset classes, securities, issuers or financial instruments referenced herein. Distribution of this information to any person other than the person to whom it was originally delivered and to such person’s advisers is unauthorized, and any reproduction of these materials, in whole or in part, or the divulgence of any of the contents hereof, without prior consent of Prudential Real Estate Investors is prohibited. Certain information contained herein has been obtained from sources that PREI believes to be reliable as of the date presented; however, PREI cannot guarantee the accuracy of such information, assure its completeness, or warrant such information will not be changed. The information contained herein is current as of the date of issuance (or such earlier date as
referenced herein) and is subject to change without notice. PREI has no obligation to update any or all of such information; nor do we make any express or implied warranties or representations as to the completeness or accuracy or accept responsibility for errors. These materials are not intended as an offer or solicitation with respect to the purchase or sale of any security or other financial instrument or any investment management services and should not be used as the basis for any investment decision. Past performance is no guarantee or reliable indicator of future results. No liability whatsoever is accepted for any loss (whether direct, indirect, or consequential) that may arise from any use of the information contained in or derived from this report. PREI and its affiliates may make investment decisions that are inconsistent with the recommendations or views expressed herein, including for proprietary accounts of PREI or its affiliates. Conflicts of Interest: Key research team staff may be participating voting members of certain PREI fund and/or product investment committees with respect to decisions made on underlying investments or transactions. In addition, research personnel may receive incentive compensation based upon the overall performance of the organization itself and certain investment funds or products. At the date of issue, PREI and/or affiliates may be buying, selling, or holding significant positions in real estate, including publicly traded real estate securities. PREI affiliates may develop and publish research that is independent of, and different than, the recommendations contained herein. PREI personnel other than the author(s), such as sales, marketing and trading personnel, may provide oral or written market commentary or ideas to PREI’s clients or prospects or proprietary investment ideas that differ from the views expressed herein. Additional information regarding actual and potential conflicts of interest is available in Part II of PIM’s Form ADV.
DISCLOSURE
75
PRISA LP
CONFIDENTIAL INFORMATION. NOT FOR FURTHER DISTRIBUTION.
REF: DCOI-9CYTDY
NCREIF Fund Index-Open End Diversified Core Equity (NFI-ODCE): The NFI-ODCE, short for NCREIF Fund Index - Open End Diversified Core Equity, is the first of the NCREIF Fund Database products and is an index of investment returns reporting on both a historical and current basis the results of 21 private open-end commingled funds pursuing a core investment strategy, some of which have performance histories dating back to the 1970s. Fund membership requires the following criteria: (1) Private open-end funds; (2) Not more than 40% leverage; (3) At least 80% of assets in the five major property types; (4) At least 95% of assets located in the U.S.; and (5) Not more then 70% of assets in one region or one property type. Reinvestment of dividends is not applicable to this asset class. A benchmark Index is not professionally managed, does not have a defined investment objective, and does not incur fees or expenses. Investors cannot invest directly in an index. The NCREIF Property Index (NPI): The NCREIF Property Index (“NPI”) is comprised of the NCREIF Classic Property Index (unleveraged) and the NCREIF Leveraged Property Database. The universe of investments includes: (1) Wholly owned and joint-venture investments; (2) Existing properties only -- no development projects; and (3) Only investment-grade, non-agricultural, income-producing properties: apartments, hotels, office, retail, office showroom/R&D, and warehouses. The database fluctuates quarterly as participants acquire properties, as new members join NCREIF, and as properties are sold. Sold properties are removed from the Index in the quarter the sales take place (historical data remains). Each property’s market value is determined by real estate appraisal methodology, consistently applied. Please note that when returns are computed for the NPI, the returns for the levered properties are computed on a de-levered basis, i.e., the impact of financing is excluded. Reinvestment of dividends is not applicable to this asset class. Note: A benchmark Index is not professionally managed, does not have a defined investment objective, and does not incur fees or expenses. Investors cannot invest directly in an index.
DISCLOSURE
76
PRISA LP
CONFIDENTIAL INFORMATION. NOT FOR FURTHER DISTRIBUTION.
REF: DCOI-9CYTDY