Prior Information and Consumer Search: Evidence from Eye ...
45
Marketing Science Institute Working Paper Series 2020 Report No. 20-141 Prior Information and Consumer Search: Evidence from Eye-tracking Qianyun Poppy Zhang, Raluca M. Ursu, and Tulin Erdem Prior Information and Consumer Search: Evidence from Eye-tracking” © 2020 Qianyun Poppy Zhang, Raluca M. Ursu, and Tulin Erdem MSI working papers are dist ributed for the bene fit of MSI corporate and academic members and the general public. Reports are not to be reproduced or published in any form or by any means, elect ronic or mechanical, without written permission. Marketing Science Institute Working Paper Series
Transcript of Prior Information and Consumer Search: Evidence from Eye ...

Marketing Science Institute Working Paper Series 2020 Report No. 20-141
Prior Information and Consumer Search: Evidence from Eye-tracking Qianyun Poppy Zhang, Raluca M. Ursu, and Tulin Erdem
Prior Information and Consumer Search: Evidence from Eye-tracking” © 2020 Qianyun Poppy Zhang, Raluca M. Ursu, and Tulin Erdem
MSI working papers are distributed for the benefit of MSI corporate and academic members and the general public. Reports are not to be reproduced or published in any form or by any means, electronic or mechanical, without written permission.
Marketing Science Institute Working Paper Series

Prior Information and Consumer Search:Evidence from Eye-tracking ∗
Qianyun Poppy Zhang† Raluca M. Ursu‡ Tulin Erdem§
Current version: September 2020
Abstract
Our objective in this paper is to quantify the impact of prior information (e.g. that obtained
from past purchases or uses of a product) on consumer search and purchase decisions. To this
end, we develop a model of sequential search where consumers with heterogeneous prior beliefs
about brand match values choose whether to search for additional information on the available
brands and their features. This additional information, though costly, allows consumers to
update their beliefs in a Bayesian fashion and to make more informed choices. We estimate
the model on a data set of consumers making smartphone search and purchase decisions. Our
data set has two novel features: (i) it contains information on consumers’ prior ownership of,
familiarity, and experience with brands; and (ii) it captures search behavior at the very granular
level of eye-movements. Preliminary evidence from our data demonstrates the importance of
prior information: consumers are more likely to search and buy brands they own and are familiar
with. Using these data and our model, we then quantify the impact of prior information, in
addition to consumer preferences and search costs, on consumer choices, as well as document
the estimation bias arising from omitting prior information from the model. Finally, through a
series of counterfactuals, we explore the managerial value of using consumers’ prior information
to construct personalized ranking-based recommendation systems.
Keywords: consumer search, search with learning, prior uncertainty, eye-tracking, recommendation
systems.∗The authors thank Paulo Albuquerque, Anocha Aribarg, Bryan Bollinger, Masakazu Ishihara, Anindya Ghose,
Pranav Jindal, Xiao Liu, Ana Martinovici, Tom Meyvis, Eitan Muller, Shervin Tehrani, Olivier Toubia, Russ Winer,as well as participants at the UT-Dallas Bass FORMS Conference 2020, Marketing Science Conference at Duke 2020,Rutgers Mentor-Mentee Symposium 2019, and NYU Marketing Department brown bag series for their comments.The authors would also like to thank Norman White, Robin Wurl, Shenglong Wang, Eugene Dzedzits and staff at bothNYU Stern Research Computing and High Performance Computing centers for their help with the computationalchallenges encountered during estimation. The usual disclaimer applies.†Stern School of Business, New York University, E-mail: [email protected].‡Stern School of Business, New York University, E-mail: [email protected].§Stern School of Business, New York University, E-mail: [email protected].
1Marketing Science Institute Working Paper Series

1 Introduction
In many markets, consumers lack perfect information about all available options or their features
before making a purchase decision. For example, when searching for a car insurance policy, con-
sumers are reported to only check 3 out of more than 20 companies available (Honka (2014)). Also,
when shopping for books, 75% of consumers only search one retailer (De los Santos et al. (2012)),
while in the digital camera category, 72% of a consumers’ search volume is concentrated at their
most visited company (Bronnenberg et al. (2016)).
To rationalize behavior in such markets, previous work has relied on consumer search models.
These models describe consumer choices as resulting from a search process whereby consumers
trade off the expected benefit of continued search against the cost to decide which products to
become informed about and which to ignore (e.g Stigler (1961); Weitzman (1979)). To quantify the
expected benefit from searching, previous work assumes either that consumers know the distribution
of the individual product rewards (e.g. price, match values) they are searching for (Hong and Shum
(2006), Moraga-Gonzalez and Wildenbeest (2008), Kim et al. (2010), De los Santos et al. (2012),
Seiler (2013), Honka (2014), Koulayev (2014), Moraga-Gonzalez et al. (2017), Chen and Yao (2017),
Honka and Chintagunta (2016), Ursu (2018), Ghose et al. (2019), Gardete and Antill (2020)) or
that consumers have common prior beliefs about these rewards that they update while searching
(Ma (2019), Ursu et al. (2020)).1 However, consumers may both lack perfect knowledge of entire
reward distributions for all products and may have different past experiences with brands (acquired
through past purchases or uses of a given product), affecting their prior beliefs. Without data on
how consumers differ in their prior knowledge of products, the study of how they search for product
information is limited.
In this paper, we develop a model of sequential search with learning that makes use of data
on consumers’ heterogeneous prior information about products. We build on Ursu et al. (2020)
and model consumer search as a learning process: consumers are uncertain about a brand’s match
value, but hold beliefs in the form of priors; by searching, they receive signals of the brand’s match
value and update their beliefs in a Bayesian manner. We extend this framework in three directions:
1Although we focus on learning about individual brands’ rewards, previous work also studies cases where consumerssearch to learn about the market distribution of rewards (Koulayev (2013),De los Santos and Koulayev (2017), De losSantos and Koulayev (2017), Hu et al. (2019)).
2Marketing Science Institute Working Paper Series

(i) we allow consumers to start searching with heterogeneous brand prior beliefs, (ii) we extend the
model to allow search not only at the brand level, but also at the brand-attribute level, and (iii)
we adapt the model to an empirical setting where consumers make very frequent search decisions
relying on partially myopic search rules.
We estimate our model on a novel data set of consumers making smartphone search and purchase
decisions among the top brands available in 2013: Apple, Samsung, Nokia, Motorola, and HTC.
These data have two features that stand out. First, they contain information on consumers’ prior
brand ownership, familiarity with each brand, and experience using different smartphone functions
(e.g. camera, wifi, texting). This feature of the data allows us model consumer prior beliefs as fully
heterogeneous. More precisely, based on preliminary evidence from our data, we model consumer
prior mean beliefs as a function of their previous ownership, their prior uncertainty as a function
of familiarity, and allow experience with product features to affect the precision of the signals
consumers obtain through search.
Second, in these data we observe consumer search decisions at the very granular level of eye-
movements using eye-tracking methods. This feature of the data has three consequences for our
analysis. First, it allows us to observe which brands and which attributes consumers choose to
become informed about, as well as the amount of information they obtained about each (i.e. the
number of eye-fixations). With these data, we can then model search at the brand-attribute level.
Second, it reveals when consumers choose to obtain brand and attribute information, and when they
look at the space around products (“white space”) that does not contain any valuable information.
We use this feature as a source of exogenous variation indicating consumers’ value of time and thus
shifting search costs. Finally, unlike in the case where consumers physically visit a store (Yavorsky
et al. (2020)) or where they need to click on product links online to obtain information (Chen and
Yao (2017); De los Santos et al. (2012); De los Santos and Koulayev (2017); Koulayev (2014); De los
Santos (2018); Ursu (2018)), searching by simply moving one’s eyes and making another fixation
involves different considerations. In particular, given the high frequency with which consumers make
search decisions in our setting, we expect the computational burden of determining the optimal
eye fixation sequence to outweigh the benefit, leading consumers to prefer partially myopic decision
rules or heuristics. Motivated by this observation, in this paper we use insights from the literature
on rational inattention and model consumers as forward-looking agents that use heuristics to make
3Marketing Science Institute Working Paper Series

decisions (Gabaix and Laibson (2000), Gabaix et al. (2006), and Hauser (2014)). Such models have
been shown to fit data patterns well (Camerer and Johnson (2004); Gabaix et al. (2006); Tehrani
and Ching (2020)), including in contexts very similar to our own (Yang et al. (2015)).
Using these data, we document that consumers vary greatly in their prior information on brands.
For example, only 79% of consumers own a smartphone. In terms of prior brand ownership, 29%
owned Apple and 24% owned Samsung previously, while 7% owned brands outside of our study.
Also, familiarity with each brand differs substantially across consumers, with the average ranging
from 2.41 (for Nokia) to 4.76 (for Apple) on a 7 point scale. In terms of experience, we find that
consumers in 2013 were most experienced with the essential communication functions of the phone
(e.g. voice-calling, texting), and least knowledgeable of the functions relating to the camera. In
addition, we find that prior information helps explain observed search and brand choices: consumers
are more likely to search the brand they own and are familiar with, and subsequently more likely
to purchase this brand.
In estimating the model, we find that prior information plays an important role in explaining
consumer search behavior. More precisely, we show that prior ownership increases consumers’
evaluation of the product before beginning search. We also show that familiarity with a brand
decreases the prior variance and that product attributes the consumer has more experience with
provide more precise signals of her match value. In addition, we document the estimation bias
arising from omitting heterogeneity in prior information from the model. We find that consumer
preferences for brands with high previous ownership or familiarity are overestimated, but find no
sizable bias for estimated search costs. More precisely, when we assume away belief heterogeneity,
the model interprets searches, that may actually be influenced by preference for a previously owned
brand or by lower uncertainty due to familiarity, as motivated by valuable brand information
obtained through search. Thus, preferences for such brands are generally inflated. Since search
costs are identified primarily from the number of options searched, they are less affected by the
omission of belief heterogeneity.
Finally, we perform a series of counterfactuals to explore the managerial value of using con-
sumers’ prior information when constructing personalized recommendation systems. In particular,
we focus on the decision to rank products for consumers and seek to measure the importance of ac-
counting for consumer prior information when personalizing such rankings. We find that, compared
4Marketing Science Institute Working Paper Series

to the default ranking observed in our data (randomized), ranking products based on our model
that accounts for heterogeneous prior beliefs benefits consumers the most, allowing them to save
on search costs (by minimizing the distance their eyes need to travel between relevant options) and
to find better matching brands. This increase in the consumer welfare in turn may increase long
term company revenues. In contrast, we find that ranking products based on a model that wrongly
assumes consumer prior beliefs are homogeneous leads to the smallest increase in welfare. Finally,
accounting for prior information by directly ordering products based on consumers’ reported prior
ownership and familiarity results in an intermediate welfare increase, almost as large as the one
based on our model. Our results emphasize the managerial importance of accounting for consumer
prior information.
The rest of the paper is organized as follows. Section 3 introduces our data and presents
preliminary reduced-form evidence for the importance of prior information. In section 5, we present
our model, followed by estimation results and counterfactual analysis. The last section concludes
and discusses limitations and future extensions of our work.
2 Literature review
This paper is related primarily to four streams of the literature: (i) prior work modeling consumer
search with learning, (ii) the literature on disentangling state dependence and heterogeneity from
consumer choices, (iii) models of rational inattention and consumer information acquisition, and
(iv) previous work using eye-tracking data to analyze consumer decisions. In what follows, we
describe our contributions to each of these streams.
Most closely related to our paper is prior work modeling consumer search with learning. Most
models of consumer search, building on the framework of Stigler (1961) or Weitzman (1979), assume
that consumers are able to resolve all the relevant uncertainty about a product with just one search.
However, these models cannot explain why consumer choose to revisit some products, a pattern
that has been established by prior work (e.g. Bronnenberg et al. (2016); Dang et al. (2020); Ursu
et al. (2020)). To rationalize this as well as other patterns, previous work relaxes the assumption of
fully revealed uncertainty through search and allows consumers to gradually learn through search,
typically by Bayesian updating (Branco et al. (2015); Branco et al. (2012); Chick and Frazier
5Marketing Science Institute Working Paper Series

(2012); Dukes and Liu (2015); Ma (2019);Ke et al. (2016), Ke and Villas-Boas (2019); Gardete and
Antill (2020); Ursu et al. (2020); Lu and Hutchinson (2020)). In parallel, when studying consumers’
repeated purchase decisions, researchers also allow consumers to learn from prior purchases and
update their beliefs in a Bayesian manner (e.g., Erdem and Keane (1996); Ackerberg (2001); Ching
et al. (2013) and Iyengar et al. (2007)). However, work estimating such search models either
assumes homogeneity in prior beliefs (e.g. Ma (2019); Lu and Hutchinson (2020); Ursu et al.
(2020)) or assumes that consumers have rational expectations and know the true utility distribution
(e.g. Gardete and Antill (2020)). We also estimate a model of search with Bayesian learning,
but we augment data on consumer search and purchase decisions with information on consumers’
prior ownership, familiarity, and experience with brands. These additional data allow us to model
consumers’ heterogeneous prior beliefs. Our results also add to previous survey and experimental
work that shows the importance of accounting for prior beliefs when considering consumer search
decisions (Johnson and Russo (1984); Moorthy et al. (1997); Jindal and Aribarg (2020)), as well as
recent theoretical work on prior ownership and search (Ning and Villas-Boas (2020)).
With data on consumers’ prior information, we can identify the effect of prior beliefs on search
and purchase decisions separately from that of preferences and search costs. As such, our work
relates to the literature on disentangling state dependence and heterogeneity from consumer choices
(e.g. Dube et al. (2010), Shin et al. (2012)). Most closely related is the work of Shin et al. (2012),
which demonstrates the value of using data on stated preferences observed before consumers make
choices (i.e. measures of liking and familiarity with products) to separate the impact of state
dependence from preferences. Our paper uses similar information on consumers’ prior choices and
familiarity with brands before engaging in the choice task in our study to capture the effect of state
dependence. We contribute to this stream of work by additionally studying the importance of state
dependence in the context of consumer search decisions.
Our paper also relates to prior work on rational inattention. This work proposes that consumers
use heuristics and rely on partially myopic rules when making choices (e.g., Gabaix and Laibson
(2000); Gabaix et al. (2006) and Hauser (2014)). Such models have been shown to fit data patterns
well (Camerer and Johnson (2004); Gabaix et al. (2006); Tehrani and Ching (2020)), including
in contexts very similar to our own (Yang et al. (2015)). Given the high frequency with which
consumers make decisions in our data, we rely on this work and model consumers as forward-
6Marketing Science Institute Working Paper Series

looking agents that use heuristics to make decisions. We provide a new application of heuristics to
models of search with learning and heterogeneous prior beliefs.
Lastly, our paper is related to prior work measuring eye-movements to inform choice mod-
els. Eye-tracking methods have gained a lot of attention from researchers studying the compu-
tational processes of decision making (e.g., Wedel and Pieters (2008); Chandon et al. (2002)).
Eye-fixations have been shown to be indicators of consumer attention (Wedel and Pieters (2000)),
utilities (Meißner et al. (2016)), and choices (Pieters et al. (2019)). Recent studies have modeled
eye-fixations as deliberate choices to search for additional information (e.g. Yang et al. (2015);
Lu and Hutchinson (2020)), approach which we will use as well. Also, previous work has found
that heuristics in decision-making can lead to distinct eye-movement patterns (Orquin and Loose
(2013)) and it has been proposed to use Bayesian methods to build models that closely examine
such eye-movements (e.g. Wedel and Pieters (2008)). Our paper develops such a model.
In the following section, we introduce our data and present summary statistics and descriptive
analysis.
3 Data
3.1 Data Description
Our data were collected in 2013 by Tobii Insight2 as part of a litigation case. Data collection re-
sulted from an experiment designed by Tulin Erdem and Rik Pieters in collaboration with Analysis
Group. The experiment mimicked a common online shopping experience for smartphones. Specif-
ically, consumers were asked to perform a product comparison task in which they evaluated five
smartphones intending to choose one to purchase. The consumers in this study were recruited from
three US cities (San Diego, Cincinnati, and Washington DC) using Tobii’s partner organizations’
database, which ensures the representativeness of the participant pool. The consumers were at
least 18 years old and were required to not have any eye problems, such as nystagmus. Also, the re-
cruited consumers could not have worked for a research company, advertising agency or technology
company. Consumers were required to own a cell phone at the time of their participation in the
study and to intend to purchase a smartphone within 9 months. There were four major segments
2https://www.tobiipro.com/insight/.
7Marketing Science Institute Working Paper Series

of consumers in the population: 1) Apple owners; 2) Samsung owners; 3) other brand owners; 4)
non-smartphone consumers. To ensure the representation of consumers in our study, we applied a
stratified sampling method to draw equal numbers of consumers from each of these four segments.
The recruited consumers were scheduled to visit the research facilities solely to complete our study
and they were offered $50 to cover the transportation costs and their time.
There were in total five smartphones under comparison: Apple iPhone 5, HTC One, Samsung
Galaxy Note II, Nokia Lumia 920, and Motorola Droid RAZR MAXX HD. For the rest of this paper,
we will refer to these smartphones solely by their brand names. Prices were as follows: $249.99 for
Apple and Samsung, $199.99 for HTC and Motorola, and $99.99 for Nokia. The determination of
the smartphones used in the experiment was guided by the top 20 Google search results for various
keywords such as ‘best top smartphone 2013’, and by mentions in consumer reports. We note that
consumers did not own any of the five products used in the study, i.e. an Apple product owner did
not own the iPhone 5, but might have owned an iPhone 3 for example.
The brand attributes displayed to consumers were chosen to be consistent with the attributes
shown on (i) the four major carrier websites (AT&T, Verizon, Sprint and T-Mobile); (ii) the
top four electronic retailers (Amazon, Bestbuy, Target mobile and Walmart); and (iii) the top
independent review websites (Verge, CNET, PCWorld and gdgt.com). Previous work suggests that
varying the number of product attributes available to consumers may increase choice complexity
(Malhotra (1982)), which in turn can affect how consumers acquire and process information (Swait
and Adamowicz (2001); Payne (1976). In our study, we used the number of attributes that were
shown to consumers to create different choice complexity levels: low (18 attributes), medium (29
attributes), and high (39 attributes). Figure 1 displays the options that consumers saw in the low
complexity condition.3 From top to bottom, attributes that consumers saw can be categorized into
seven groups as ‘Brand’ (including a photo of the product and color option), ‘Price’, ‘Technical’
(including ‘Wireless Capabilities’ and ‘Operating System’), ‘Size’ (including ‘Display’) ‘Battery’,
‘Camera’, and ‘Memory’. All three complexity conditions had these parent attribute categories.
The number of attributes that nested within these categories varied from condition to condition.
For example, while there was only 1 attribute under ‘Camera’ in the low complexity condition, there
were 3 attributes under ‘Camera’ in the high complexity condition. Also note that the information
3Figure 6 in Appendix 9.1 illustrates the options available to consumers in the high complexity condition.
8Marketing Science Institute Working Paper Series

displayed to consumers about each of these attributes was the same in each condition (for example,
Apple was shown with a price of $249.99 in all conditions). Under each of the three complexity
conditions, there were five unique combinations of attribute and brand orders, for a total of 15
unique stimuli. The order of the brands (columns) and attributes (rows) displayed on the screen
was randomized to control for the effect of order on consumer search and purchase decisions.
Consumers were asked to pick only one brand to purchase and they could take as much time as
they needed to make that decision. There was a ‘Click to buy’ button next to each of the options.
Once a consumer clicked on that button, a confirmation page appeared that asked the consumer
to confirm her choice, ending the experiment.
Figure 1: Study Design Under the Low Complexity Condition
Before engaging in the product comparison task just described, consumers were asked to fill
out a survey. We used consumers’ answers to this survey to construct three measures of their prior
brand information: prior ownership, familiarity, and experiences. The exact questions asked to
construct each measure were:
• Prior ownership
– Do you currently own a smartphone? (0 or 1; 1 means own a smartphone)
– What is the current model or brand of the smartphone you own? (choice among the five
brands in the study, or ‘None’ for consumers who do not have smartphones and ‘Others’
for consumers who owned brands that are not included in the study)
9Marketing Science Institute Working Paper Series

• Familiarity
– How familiar are you with the brands in the experiment? (measured on a scale from 1
to 7 where 1 corresponds to ‘Not at All’ and ‘7’ corresponds to ‘Extremely Well’)
• Experience
– How much do you use each of the functions of the smartphone: video taking, photo tak-
ing, internet browsing, video chatting, texting, calling, etc.? (choices included ‘Never’,
‘Less Often than Once per Month’, ‘At Least Once Per Month’, ‘At Least Once Per
Week’, ‘Nearly Every Day’, ‘Several Times Per Day’. We converted responses to a scale
ranging from 0 to 1, where 0 corresponds to ‘Never’ and ‘1’ corresponds to ‘Several
Times Per Day’)
We also gathered information on consumers’ age, income, gender (female coded as 1 and male
coded as 0) and employment status (employed coded as 1 and unemployed coded as 0). There were
four age groups (‘18-29’, ‘30-49’, ‘50-64’, and ‘65 or older’) and eight income groups measured by
annual household income (‘$14, 999 or less’, ‘$15, 000 − $24, 999’, ‘$25, 000 − $34, 999’, ‘$35, 000 −
$49, 999’, ‘$50, 000−$74, 999’, ‘$75, 000−$99, 999’, ‘$100, 000−$149, 999’, and ‘$150, 000 or more’).
There were in total 460 consumers who participated in the experiment, but we observed a
complete set of eye-movements, as well as complete demographic and survey responses, for 342
of them, who will be the focus of our study. The eye-movement data of these consumers was
described by their attention to different areas of interest (AOI) on the screen, such as the seven
main attribute categories for each brand.4 An eye fixation in the data is defined as a period of
200-400 milliseconds during which the eye is relatively fixed on an area.5 Consistent with prior
work, we interpret eye-fixations as deliberate consumer actions to search for and process additional
brand information (Shi et al. (2013); Yang et al. (2015); Lu and Hutchinson (2020)).
3.2 Summary Statistics
In our final data sample, there are 342 consumers and 78,617 observations (78,275 eye-fixations,
and 342 individual consumer brand choices). Each consumer makes on average (median) 229 (186)
4For an illustration of eye-fixations in our study, see Figure 7 in Appendix 9.1.5These data were generated using standard settings in the Tobii eye-tracking software.
10Marketing Science Institute Working Paper Series

fixations on the products and their attributes displayed on the screen. Among these consumers,
the majority of them belong to the age group 30 to 49 years old, 52% are female, 69% are white
and 71% are employed. Around 56% of the consumers have an annual income of at least $50,000.6
Approximately 79% of the consumers in our data own a smartphone.
Table 1 reports the distribution of two measures of prior information (prior ownership and
familiarity with each of the five brands), as well as consumers’ final brand choice in the study. It
can be seen that consumers are most likely to own, be familiar with, and purchase either Apple or
Samsung smartphones, with the latter being most likely to be purchased, although more consumers
own and are familiar with Apple than Samsung. Sizable fractions of consumers also own HTC,
Motorola and Nokia smartphones, with the latter being the least popular. Finally, approximately
7% of consumers own other brands than the ones presented in the task.
Table 1: Summary Statistics on Prior Ownership, Familiarity, and Brand ChoiceBrand Prior Ownership% Familiarity Brand choice%
Apple 29.53 4.76 25.73Samsung 24.27 4.20 29.24HTC 11.11 2.88 21.34Motorola 6.43 3.11 16.08Nokia 0.58 2.41 7.60
Others 7.31None 20.76
In Table 2, we summarize our third measure of prior information given by consumers’ experiences
with various smartphone functions, such as voice-calling or photo-taking. In total, there were 16
functions consumers were asked about in the survey, which we later grouped to coincide with five
of the relevant categories of attributes: Camera (e.g. photo-taking and video-taking), Battery
(e.g. voice-calling, texting, and video-chatting), Size (e.g. dimensions, weight), Technical (e.g.
OS, Wifi, warranty) and Memory (e.g. RAM). We find that consumers are most experienced with
the ‘Battery’ attribute, since it relates to the essential communication functions of the phone. In
contrast, consumers are least experienced with the ‘Technical’ and the ‘Camera’ attributes. In
2013 when we collected our data, photo-taking and video-taking with a smartphone were still new
functions to most users 7, which explains consumers’ low level of experience with these attributes.
6See Figure 8 in Appendix 9.1 for more information on consumer demographics.7https://www.nytimes.com/2014/02/06/technology/personaltech/making-the-case-for-a-more-selfie-friendly-
smartphone.html
11Marketing Science Institute Working Paper Series

Across consumers we also find that there is a large variation in their experience with each attribute.
Table 2: Consumer Experiences with Product AttributesStatistic N Mean St. Dev. Min Pctl(25) Pctl(75) Max
Battery 342 0.706 0.409 0 0.4 1 1Memory 342 0.529 0.358 0 0.1 0.8 1Size 342 0.500 0.339 0 0.2 0.8 1Technical 342 0.447 0.281 0 0.3 0.7 1Camera 342 0.446 0.309 0 0.2 0.7 1
Note: The original responses are converted to numeric values ranging from 0 to 1, where 0corresponds to ‘Never’ and ‘1’ corresponds to ‘Several Times Per Day’.
4 Reduced-Form Evidence
In this section, we present reduced-form evidence relating consumers’ prior information to their
search and purchase decisions. Our results describe these relations, as well as help motivate our
structural model, which we present in the next section.
4.1 Relation between Prior Information and Search
As mentioned, in our data we observe consumer eye fixations on the screen on various AOIs. We
interpret these fixations as search decisions. Consumers can choose to search across brands (e.g.
search Apple versus Samsung), or within brands, choosing which attributes to become informed
about (e.g. price vs. memory). To investigate the relation between prior information and con-
sumers’ search decisions, we consider two types of evidence. First, we ask whether the brands
consumers own are searched more or less than others. To answer this question, we summarize the
percentage of consumers’ fixations to each of the brands, split by whether consumers owned the
brand previously or not. Figure 4.1 reports our results. The left panel shows the share of fixations
early in the search process (first 10 fixations), while the right panel shows the share of the entire
search process.8 In each panel, the left bar shows the average percentage of fixations on brands
the consumer did not previously own, while the right displays the share for the brand they owned.
As can be seen, consumers are more likely to search the brand they previously owned, rather than
other individual brands. This pattern holds both early in the search process and throughout.
8To ensure that our results are comparable, the figure considers only consumers who own a smartphone.
12Marketing Science Institute Working Paper Series

Figure 2: Distribution of Fixations by Prior Ownership
Second, we check how search activity differs based on the identity of the brand previously owned,
as well as investigate how consumers who did not own one of the five brands in our study search.
More precisely, we split consumers based on their prior ownership and final choices into two groups:
consumers who choose to purchase the same brand as they previously owned will be referred to
as ‘loyal consumers’, while all others (including those who own a different or no smartphone) will
be referred to as ‘switchers’. Then, in Figure 3, we analyze the amount of search each group of
consumers performs. In this figure, the y-axis denotes the brands that consumers previously owned,
while the x-axis denotes the five brands available in our study. The size and color of a circle indicate
the share of searches (fixations) to the brands on the x-axis. As can be seen in the top panel, there’s
a strong trend along the diagonal, showing that loyal consumers are more likely to search the brand
they own (which evidently coincides with the one they end up choosing). The bottom panel shows
that for switchers, the distribution of their searches does not have a strong diagonal trend. Rather,
as we will show in Table 3, switchers search the brands they end up buying more often, rather than
the ones they own. For example, Apple owners who switch, search Samsung and HTC the most,
which are the brands they are most likely to choose. Among consumers who own a different or no
smartphone, the share of fixations is more even across brands, with Samsung attracting slightly
more attention.
13Marketing Science Institute Working Paper Series

Figure 3: Fixations by Prior Ownership (y-axis) and Brand Choice (x-axis)
4.2 Relation between Prior Information and Brand Choices
In Table 3, we relate prior ownership to brand choices. As can be seen from the diagonal of the
table, regardless of the brand, most consumers prefer to choose the brand they own. For example,
out all previous Apple consumers, 55.4% (56 out of 101), chose to purchase Apple again. When
prior Apple owners switch to other brands, Samsung and HTC are their top two choices. When
Samsung consumers switch to other brands, HTC and Motorola are their top two choices. It is
to be noted that among consumers who do not have a smartphone, Motorola is the most popular
choice, followed by Samsung and Apple. Among consumers who own a smartphone other than the
five displayed, HTC is the most popular choice.
14Marketing Science Institute Working Paper Series

Table 3: Prior Ownership and Brand Choice
Brand ChoicePrior Ownership Appe HTC Motorola Nokia Samsung Total
Apple 56 14 6 8 17 101HTC 3 16 6 3 10 38
Motorola 2 5 11 0 4 22Nokia 0 0 0 1 1 2
Samsung 8 18 10 2 45 83
None 14 9 20 10 18 71Others 5 11 2 2 5 25
Finally, to analyze more formally how prior information impacts consumers purchase decisions,
we run a conditional logit model at the consumer level with their brand choice as the dependent
variable. In this model, the utility of a consumer i for a brand j is given by
uij = brandj + α ∗ poij + β ∗ famij + π ∗ fixationsij + εij (1)
where utility uij is a function of brand intercepts brandj , prior ownership poij , familiarity with a
brand famij , and the number of searches/fixations accumulated for each of the five brands in our
study, fixationsij .9 Samsung is set as the reference brand.
Our results are presented in Table 4. Model (1) is the baseline model which does not include
prior information (prior ownership and familiarity) or fixations, while model (2) includes prior
information but no fixations. Finally, model (3) includes both prior information and share of fix-
ations for each brand.10 Comparing estimation results for models (1) and (2), we find that prior
ownership and familiarity both have positive and significant coefficients, suggesting that consumers
are more likely to purchase the product they own and are more familiar with, consistent with our
previous results.11 In model (3), we show that fixations also have a positive and significant coeffi-
cient, suggesting that brands consumers spend more time searching are more likely to be chosen.
After accounting for fixations and prior information, brand intercepts are no longer significant.
This suggests that the amount of attention given to each brand, summarized by the accumulated
9Note that we cannot include in the analysis our third measure of prior information, experience with productattributes, since this does not vary by brand.
10To be able to compare estimates across the three models, in the analysis we focus on consumers who own asmartphone.
11The correlation between prior ownership and familiarity is relatively small, ranging from 0.12 to 0.41 acrossbrands, showing a large variation across consumers in the two measures.
15Marketing Science Institute Working Paper Series

fixations and consumers’ prior knowledge and familiarity of the brands, capture consumers’ brand
value. Finally, our measures of model fit suggest the importance of accounting for prior information
and search decisions when studying consumer choices.
Table 4: Prior Information and Brand Choice
Brand Choice(1) (2) (3)
Brand ValueApple −0.110 −0.282 0.354
(0.166) (0.182) (0.244)HTC −0.374∗∗ 0.259 0.236
(0.178) (0.213) (0.290)Nokia −1.705∗∗∗ −0.504 0.040
(0.291) (0.329) (0.451)Motorola −0.847∗∗∗ −0.155 0.149
(0.208) (0.236) (0.320)Samsung - - -
Prior InformationPrior ownership 1.442∗∗∗ 1.624∗∗∗
(0.148) (0.207)Familiarity 0.438∗∗∗ 0.548∗∗∗
(0.082) (0.111)Search
Fixations 0.078∗∗∗
(0.007)
LL −364.928 −308.162 −165.737AIC 737.856 600.218 317.268BIC 758.315 654.907 381.071Observations 1,230 1,230 1,230
Note: ∗p<0.1; ∗∗p<0.05; ∗∗∗p<0.01
The results we presented in this section highlight the importance of calibrating consumer search
models with information on consumers’ prior brand knowledge. The next section introduces our
model relating prior information to consumer search and purchase decisions.
16Marketing Science Institute Working Paper Series

5 Model
5.1 Consumer Problem
Consider a consumer i ∈ {1, . . . , N} who seeks to purchase a brand j ∈ J , where the set of options
available is J = {Apple, HTC, Samsung, Nokia, Motorola}. The consumer faces uncertainty about
her match value with each brand j, but can (partially) resolve this uncertainty by searching j.
This search decision involves paying a search cost, but reveals information to the consumer that
may aid her choice. We build on Ursu et al. (2020) and model consumer search as a learning
process: consumers are uncertain about a brand’s match value, but hold beliefs in the form of
priors; by searching, they receive signals of the brand’s match value and update their beliefs in a
Bayesian manner.12 We extend the model to allow search not only at the brand level, but also
at the brand-attribute level. Therefore, each time period t ∈ {1, . . . , T}, the consumer decides
whether to continue searching, in which case she chooses a brand j and an attribute l ∈ L :
{Brand, Price, Technology, Size, Camera, Memory, Battery} to search, or whether to stop, in which
case she chooses which brand to purchase.
In addition, in our data, we observe three measures of consumer’ prior brand information (prior
ownership, familiarity, and experience), which allow us to model consumer prior beliefs as fully
heterogeneous. In what follows, we choose to allow these measures to affect different learning
parameters of the model, capturing the effect of state dependence.13 In particular, we expect
that prior ownership, which is a direct result of consumer prior choices, will affect the consumer
prior mean value. In other words, a brand the consumer previously owned is more likely to carry
a higher utility weight than other brands. This expectation is consistent with our reduced-form
results, showing that consumers are more likely to both search and purchase products they own.
Thus, at time t = 0, we model the consumer’s prior belief about her match value for j as
N(µij,0, δ2ij,0), (2)
12In Ursu et al. (2020), consumers obtain signals after every minute spent searching; in our paper, one signal isobtained after every eye-fixation.
13More precisely, to disentangle individual heterogeneity and state dependence, we follow Shin et al. (2012) and useour survey data on prior information from previous choice settings to capture state dependence (affecting consumerprior beliefs in our model), while choices consumers make in the current study will reveal heterogeneity in preferences.
17Marketing Science Institute Working Paper Series

where the prior mean is a function of her prior ownership of a brand, poij , as per
µij,0 = λ+ β ∗ poij . (3)
The poij is a binary variable equal to 1 for the brand the consumer previously owned and to 0
for brands she did not own. If the value of β is estimated to be positive, it would suggest that
consumers start their search with a higher utility for the brands they already own compared to
other brands. For consumers who do not have a smartphone or for brands consumers do not own,
the mean of their prior belief is given by λ.
Furthermore, we expect the consumer’s familiarity with a brand to affect her prior uncertainty.
Since familiarity reflects the amount of information a consumer has accumulated for a brand (from
prior searches, purchases or other interactions with a brand), it is likely that the consumer has
lower uncertainty for the brands she knows more about. We model this relation in exponential
form to ensure that variance is non-negative as per
δ2ij,0 =1
exp(γ ∗ famij). (4)
By searching product j and attribute l at time t, the consumer obtains noisy but unbiased
signals slij from the true distribution of match values given by
slij,t ∼ N(µij , σl2ij ), (5)
where the mean of the signal for each brand is a function of brand intercepts that may be hetero-
geneous across consumers. Note that in our data, prices do not vary within a brand. Therefore,
with brand intercepts in the model we cannot separately estimate consumer price sensitivity.
We use data on our third measure of prior uncertainty to model the signal variance. We expect
a consumer’s prior experience with a certain brand attribute to affect the precision of the signal
she receives (e.g. more experience with the phone’s camera may allow the consumer to more
easily grasp the information provided about this attribute on one search). Formally, we model the
variance of the signal as an exponential function of users’ (standardized) experiences with each of
the attributes, Eli (zero if the consumer does not have a smartphone), and constant θ0 as in
18Marketing Science Institute Working Paper Series

σl2ij =θ0
exp(θE ∗ Eli). (6)
After observing signal slij,t, the consumer uses Bayes’ rule to construct her posterior belief about
brand j, given by N(µij,t, δ2ij,t), where
µij,t+1 =
µij,tδ2ij,t
+slij,tσl2ij
1δl2ij,t
+ 1σl2ij
, (7)
δ2ij,t+1 =1
1δ2ij,t
+ 1σl2ij
. (8)
Because draws are independent, the consumer does not learn about the match value of one brand
by searching another. Therefore, after observing signal slij,t, only the posterior belief of j changes.
To obtain product information, the consumer needs to pay a search cost. We model a consumer’s
search cost for brand j as follows
cij = exp(κi + d1Distl + d2Distj + d3Ctrl + d4Ctrj + ω ∗ Complexityi+
η ∗Whitespacei + φ ∗Demoi)(9)
where the κi denotes the mean search cost, which may vary across consumers. When modeling
search costs, we also account for the distance the consumer’s eyes traveled on the current search.
Previous studies (e.g., Yang et al. (2015) and Wedel and Pieters (2008)) suggest that people are
more likely to move their eyes to contiguous cells to minimize on cognitive effort. Also, consumers’
fixations may more naturally gravitate towards the center of the screen (e.g. Wedel and Pieters
(2008) and Atalay et al. (2012)). We account for these two effects as follows. First, we include
Distl and Distj in the search cost to denote the standardized distance traveled vertically (in the
attribute space) and horizontally (in the brand space) to reach j. These range from 0 to 1, where
1 stands for the farthest possible fixation location on the screen. Second, we use Ctrj and Ctrl
to denote the location of product j and attribute l in standardized distance to the center of the
screen. These also range from 0 to 1, with 0 denoting the center of the screen.
In addition to these distance and location-based effects, search costs also account for the com-
plexity level of the task the consumer is in (low, medium or high). Based on prior work, we expect
19Marketing Science Institute Working Paper Series

higher choice complexity to decrease consumers’ processing resources and therefore increase search
costs (Malhotra (1982); Swait and Adamowicz (2001); Payne (1976)).
A unique feature of our data is that we observe not only cases where the consumer chooses to
search for information, but also cases where she chooses to be idle, that is to spend time in the
task without obtaining any valuable information. More precisely, we observe consumer fixations
to what we call “white space” or the area around the matrix with product comparisons that does
not contain any purchase relevant information. We use the ratio of the number of fixations on
this area to the overall number of fixations, variable Whitespacei, as an (exogenous) proxy for
the consumer’s value of time, which would affect her search costs. Across consumers, the average
Whitespacei is 0.305 with a minimum of 0 and a maximum of 0.69.
Finally, we also account for consumer demographics, such as age, income, gender, and employ-
ment status, when modeling search costs (similar to De los Santos (2018)). We converted the four
age groups (1 representing the ‘18-29’ years old group) and eight income groups to numeric values
(1 representing the ‘$14, 999 or less’ income group).
Figure 5.1 provides an illustration of our model. As can be seen, given information obtained
before time period t (summarized by the consumer’s prior uncertainty at that time), the consumer
decides whether to continue searching or whether to stop. If she decides to continue searching,
then she decides which brand-attribute combination to search, pays a search cost, and receives an
information signal. In this illustration, the consumer chooses to search brand 2 attribute 2, for
which she observes a signal that she then uses to update her posterior belief. With this updated
posterior, the consumer then faces the same search decision in the next period, t + 1. If instead
the consumer decides to stop searching, then she makes a purchase decision. In what follows, we
describe consumer search and purchase decisions in more detail.
20Marketing Science Institute Working Paper Series

Figure 4: How Consumers Make Search and Purchase Decisions
5.2 Search and Choice Rules
Every time period, the consumer decides whether to continue searching, in which case she chooses
a brand and an attribute l to search, or whether to stop, in which case she chooses which brand
to purchase. In this section, we describe consumer decisions that are relevant for our setting where
searching involves simply moving one’s eyes and making another fixation on the screen. This setting
differs from most other settings considered in the search literature, where consumers physically
visit a store (Yavorsky et al. (2020)) or where they need to click on product links online to obtain
information (Chen and Yao (2017); De los Santos et al. (2012); De los Santos and Koulayev (2017);
Koulayev (2014); De los Santos (2018); Ursu (2018)). More precisely, consumers in our setting
make a large number of search decisions (278 on average). Therefore, we expect the computational
burden of determining the optimal decision for each of the eye fixations consumers make to outweigh
the benefit, leading consumers to prefer partially myopic decision rules or heuristics. Motivated by
this observation, we rely on the literature on rational inattention and model consumers as forward-
looking agents that use heuristics to make decisions. Such heuristics have been shown to perform
well in explaining consumer behavior (Camerer and Johnson (2004); Gabaix et al. (2006); Tehrani
and Ching (2020)). We follow Gabaix et al. (2006) and Yang et al. (2015), and model consumers as
searching as if they have to make a purchase decision right after the immediate search (i.e. as if the
next search decision is their last). Also, to capture risk-aversion behavior, we follow Tehrani and
21Marketing Science Institute Working Paper Series

Ching (2020) and assume the consumer’s utility function has the constant absolute risk-aversion
form with risk coefficient r. This assumption also implies that utility has diminishing returns.
Let α denote a consumer’s available actions: α ∈ {Search(j, l), Purchase(j)}. Also, let Iit
indicate the information or beliefs of consumer i at time t: Iit = {µij,t, δij,t}. At t, the consumer
faces a trade-off:
• Purchase product j and receive expected utility14:
Eα [uij,t|Iit]α=purchase(j)
= −exp(−r ∗ µij,t +r2
2∗ δ2ij,t). (10)
• Search product j and attribute l, and receive the maximum utility derived from choosing
one of the alternatives at time t+ 1:
Eα [uij,t|Iit]]α=search(j,l),k 6=j
= max
{−exp(−r ∗ µij,t +
r2
2∗ δ2ij,t+1),−exp(−r ∗ µik,t +
r2
2∗ δ2ik,t)
}− cij .
(11)
In words, if at t the consumer chooses to stop and purchase product j, then she receives expected
utility as per equation (10). This utility is increasing in her posterior mean and decreasing in her
remaining uncertainty. If instead she chooses to continue searching, then she will determine what
option to search by considering the value of searching once more and then stopping to make a
purchase decision immediately after. The expression in equation (11) gives the value of searching
j and then stopping immediately after. This is given by either the value of stopping and choosing
j after an additional search, obtaining the first term in the maximum in equation (10) minus the
search costs of searching j, or stopping and choosing any other option k 6= j, given by the second
term in the maximum in equation (10) minus the search costs of searching j. Since the value of
the posterior variance evolves deterministically, we assume the consumer can compute the value
of δ2ij,t+1 obtained from an additional search of j, in order to construct the expected benefit from
choosing j after searching it again.
14Note that a higher variance decreases consumer utility, making consumers less likely to search an option, unlikein standard sequential search models (e.g. in Weitzman (1979)).
22Marketing Science Institute Working Paper Series

5.3 Likelihood Function
There are 5 brands and 7 attributes in our choice setting. Therefore, a consumer can choose among
35 different possible brand-attribute combinations, or 35 different locations on the screen, to search.
At the same time, a consumer has 5 purchase options corresponding to the 5 brands. Combining
these search and purchase options, a consumer needs to choose one out of 40 options at a given
time. Assuming utility error terms follow the type-1 extreme value distribution, the probability of
consumer i taking action αit at time t equals
p(αit|Iit) =exp(Eα [uij,t|Iit])∑αexp(Eα [ij,t|Iit])
(12)
which leads to the following likelihood function
Likelihood =∏i,t
p(αit|Iit). (13)
To integrate over the signals consumers obtain while searching, we needed to estimate our model
using simulated maximum likelihood. Given the large number of observations per consumer in our
data, we increase estimation efficiency using the following steps: (i) we compute each consumer’s
likelihood and each integration in parallel, and run our model on hundreds of computer nodes
simultaneously; (ii) we impose upper and lower bounds on the magnitude of the prior variance
and signal variance (corresponding to 100 and 0.01, respectively) based on preliminary estimation
results of our model; and (iii) to avoid calculating the Hessian corresponding to our problem, we
use the outer product of gradients estimator (OPG) to compute standard errors.15 Finally, in our
model we capture consumer heterogeneity in parameters of interest (brand match values and mean
search costs) using a latent class approach.
5.4 Identification
In this section, we discuss how the parameters of our model are identified. We seek to identify
three sets of parameters: (i) learning parameters, given by consumer prior beliefs (λ, β, γ), brand
match values (µij), and signal variance (θ0, θE); (ii) search cost parameters (κi, d1, d2, d3, d4, ω, η);
15More details about this estimator, including its asymptotic properties, are available in Berndt et al. (1974) andGreene (2003).
23Marketing Science Institute Working Paper Series

and (iii) risk coefficient (r). Our data provide information on consumers’ search decisions, i.e.
what brand and what attribute they searched every fixation, their final brand choices, as well as
survey information on consumer’s prior knowledge of the brands and their demographics. These
data together with the decision rules in equations 10 and 11 constitute the essential components of
our identification strategy.
Learning parameters are identified from the purchase probability of consumers with different
information sets (similar to Erdem and Keane (1996); Narayanan and Manchanda (2009); Ma
(2019); Ursu et al. (2020)). More precisely, consumers who search very little make purchase decisions
largely based on their prior beliefs. Observed heterogeneity in consumer’s prior brand information
(given by consumers’ prior ownership) identifies β which affects the prior mean. Consistent with
prior work (e.g. Erdem and Keane (1996)), we assume the prior mean constant λ equals the average
brand value across the five brands in the study, which can be interpreted as the average quality of
the smartphone. In contrast, when consumers search extensively, uncertainty reduces to zero and
prior beliefs converge to the true match values, which allows us to estimate brand match values
from purchase frequencies, as is typical in discrete choice models. For example, the odds of a
consumer choosing to purchase Apple over Samsung reveals her higher preference weight for this
brand. Finally, variation across consumers in their experience level with brand functions and their
search and purchase prevalence identifies the signal variance parameters.
Search costs are identified from consumers’ stopping decision. From equation (11), when the
utility of continued search decreases to such a degree that it becomes lower than the search cost,
consumers will stop search. Thus, the total number of searches a consumer performs will identify
the range of mean search costs (κi) that must have made it beneficial for the consumer to perform
that number of searches (Honka and Chintagunta (2016)). The level of mean search costs is pinned
down by the functional form and the value of product utility differences, as well as consumer prior
beliefs. In addition, differences across consumers in complexity level (randomized) and demograph-
ics identify the deviations from mean search costs. Also, consumers’ choice to focus on options that
are further or closer to the previously searched option or the center of the screen, together with
the fact that they were randomly assigned the order in which brands were displayed on the screen,
identify the distance and location parameters in the search cost.
Both high prior uncertainty and low search costs can encourage consumers to search a lot. To
24Marketing Science Institute Working Paper Series

identify these two effects separately, we rely on both distinct data patterns and functional form
identification. More precisely, the search rule in equation (11) dictates not only when consumers
should continue rather than stop searching, but also when they should search the same option again
or switch to searching a different one. Similar to the identification strategy in Ursu et al. (2020),
we note that as consumers search an option, their uncertainty decreases steadily, while the search
cost remains the same (after the first search, in our case). Thus, observing both the total number
of searches and the number of searches per option helps us separately identify these two effects.
Because all the parameters in the prior mean, prior variance, signal mean and signal variance
are estimated jointly, the risk parameter r will not be uniquely identified. Following the strategy
in Erdem et al. (2005), we normalize r to 1, which maintains the assumption that consumers are
risk averse.
5.5 Monte Carlo Simulation
To show that our model’s parameters can be recovered using our estimation strategy, we performed
the following Monte Carlo simulation exercise. To mimic our data, we generated 1000 consumers
and their prior ownership (random binary variable), familiarity with 5 brands and experiences with
7 attributes (both familiarity and experience are uniformly distributed on the interval from -5 to
5). We assigned one of the 5 brands as the reference brand with a mean match value of zero, and
assumed the same mean match value for the remaining brands. Also, to simplify estimation, we
assumed only the constant κi = κ affected search costs.
In the simulation, consumers follow the same search and choice rules we described in equations
(11) and (10). To integrate over all possible signal draws, we compute the likelihood function as
an average over 1000 draws from the signal distribution. Also, we perform the estimation exercise
50 times and report results after averaging across these estimates. We also report the standard
deviation of the mean estimate across these simulations.
Table 5 reports our results. The first column displays the true coefficients we used to generate
our data, while the second column shows our estimates. We find that our estimation strategy is
able to recover parameters in our model well.
In addition, we check the direction of the estimation bias arising when we ignore the impact of
25Marketing Science Institute Working Paper Series
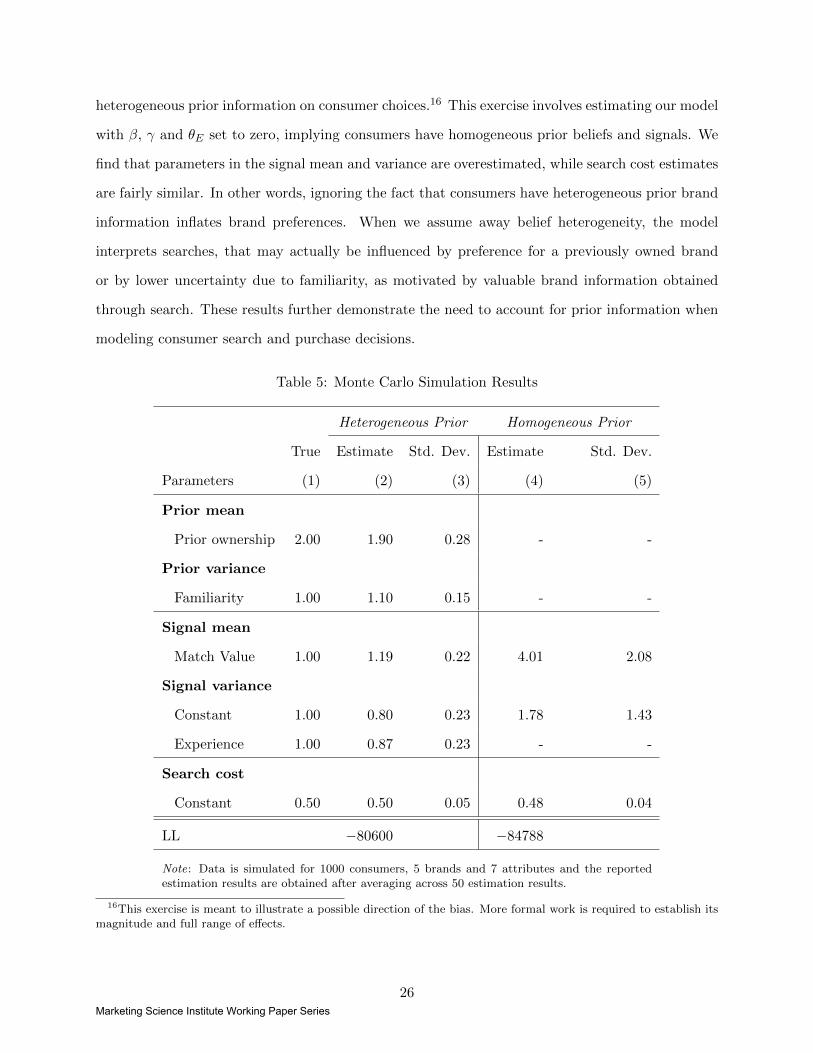
heterogeneous prior information on consumer choices.16 This exercise involves estimating our model
with β, γ and θE set to zero, implying consumers have homogeneous prior beliefs and signals. We
find that parameters in the signal mean and variance are overestimated, while search cost estimates
are fairly similar. In other words, ignoring the fact that consumers have heterogeneous prior brand
information inflates brand preferences. When we assume away belief heterogeneity, the model
interprets searches, that may actually be influenced by preference for a previously owned brand
or by lower uncertainty due to familiarity, as motivated by valuable brand information obtained
through search. These results further demonstrate the need to account for prior information when
modeling consumer search and purchase decisions.
Table 5: Monte Carlo Simulation Results
Heterogeneous Prior Homogeneous Prior
True Estimate Std. Dev. Estimate Std. Dev.
Parameters (1) (2) (3) (4) (5)
Prior mean
Prior ownership 2.00 1.90 0.28 - -
Prior variance
Familiarity 1.00 1.10 0.15 - -
Signal mean
Match Value 1.00 1.19 0.22 4.01 2.08
Signal variance
Constant 1.00 0.80 0.23 1.78 1.43
Experience 1.00 0.87 0.23 - -
Search cost
Constant 0.50 0.50 0.05 0.48 0.04
LL −80600 −84788
Note: Data is simulated for 1000 consumers, 5 brands and 7 attributes and the reportedestimation results are obtained after averaging across 50 estimation results.
16This exercise is meant to illustrate a possible direction of the bias. More formal work is required to establish itsmagnitude and full range of effects.
26Marketing Science Institute Working Paper Series

6 Estimation Results
Our results from estimating the model in section 5 can be found in Table 6 and Table 7. First, in
table 6’s columns (1) and (2), we report the results from the model that accounts for consumers’
heterogeneous prior information. In columns (3) and (4), we report estimation results when we
ignore consumers’ heterogeneous prior information, by estimating our model with β, γ and θE set
to zero.
Considering first the results accounting for prior information, we find that, consistent with our
reduced-form results, prior ownership is positive and significant, indicating that consumers place
a higher value on the brand they own prior to commencing search. Also, familiarity negatively
impacts prior variance (positive effect on the inverse of prior variance; recall the expression in
equation (4)), suggesting that the more familiar the consumer is with a brand, the lower her prior
uncertainty.
Our estimates of the signal mean (functions of brand intercepts) appear in the second panel
of Table 6. We find that, compared to Samsung (the reference brand), HTC’s brand value is the
highest, followed by Motorola’s value. We also estimate that Apple has the lowest match value.
This result may seem surprising at first given the high market share of Apple among our consumers.
However, this result in part reflects consumers’ prior ownership and their switching patterns shown
in Table 3: close to half of prior Apple owners switch and choose another brand. When such a
switch occurs, prior Apple owners opt most frequently for Samsung or HTC. In contrast, when
Samsung consumers switch, most of them also switch to HTC (and Motorola), but not to Apple.
Comparing these results to those in column (3), we find that a model that ignores consumers’
heterogeneous prior information generally inflates brand preferences. For example, it estimates a
higher brand value for Apple than Samsung. More precisely, we find that when we assume away
belief heterogeneity, the model interprets searches, that may actually be influenced by preference
for a previously owned brand or by lower uncertainty due to familiarity, as motivated by valuable
brand information obtained through search. This effect is stronger for brands that have a high
share of prior ownership and high familiarity. This is an important piece of evidence that supports
accounting for consumers’ prior information in modeling search and purchase decisions. Without
such data, estimated parameters, as well as their implications for marketing strategy, may be biased.
27Marketing Science Institute Working Paper Series

The signal variance shows the effect of prior experience with different smartphone functions.
We find that such experience increases the precision of the signals (positive effect on the inverse of
the signal variance) that consumers obtain about each function. In other words, consumers who
know more about for example the ‘Battery’ function search more efficiently, obtaining more precise
information from every fixation.
Table 6: Estimation ResultsHeterogeneous Prior Homogeneous Prior
Estimates Std. Error Estimates Std. ErrorParameters (1) (2) (3) (4)
Prior MeanPrior Ownership 18.233 0.00105
Prior VarianceFamiliarity (inverse) 0.357 0.00097
Signal MeanApple -0.908 0.00106 0.627 0.00156HTC 0.747 0.00105 1.558 0.00154Motorola 0.549 0.00055 1.089 0.00157Nokia -0.588 0.00107 -0.648 0.00145Samsung - - - -
Signal VarianceConstant 20.586 0.00093 18.930 0.00147Experience (inverse) 1.165 0.00105
Search CostsConstant -1.003 0.00098 -0.996 0.00113Distance: Attribute 2.299 0.00089 2.297 0.00098Distance: Brand 1.388 0.00088 1.388 0.00094Center: Attribute 0.318 0.00089 0.317 0.00072Center: Brand 0.264 0.00090 0.264 0.00078Low Complexity - - - -Medium Complexity 0.110 0.00093 0.111 0.00083High Complexity 0.218 0.00099 0.217 0.00058Whitespace -0.146 0.00104 -0.174 0.00141Female -0.042 0.00102 -0.056 0.00151Age 0.131 0.00104 0.139 0.00134Employed 0.381 0.00103 0.430 0.00151Income -0.029 0.00086 -0.032 0.00099
LL −238520 −238606AIC 477042 477215BIC 477046 477219Observations 78617 78617
Note: The results are averaged over 50 estimations using different starting seeds. Standarderrors are calculated using the Outer Product of Gradients estimator (OPG).
28Marketing Science Institute Working Paper Series

Search cost estimates are reported in the bottom panel of Table 6.17 We find that distance
parameters increase search costs, result which confirms the findings from Yang et al. (2015): the
further away another option, the higher the search cost, which implies consumers are more likely
to search options that are close to their previously searched locations. Similarly, moving away
from the center of the screen, increases consumer search costs. Our results also suggest that
when consumers move to a new cell on the screen, they are more likely to move their eyes to a
different brand than a different attribute, given the estimated cost differences for each action. When
comparing search costs across complexity conditions, we find that the more attributes displayed
to consumers, the higher their search costs, confirming prior findings in the literature (Payne
(1976); Malhotra (1982); Swait and Adamowicz (2001)). The parameter for the white space is
negative, which suggests that consumers who spend more time on that area of the screen have a
lower valuation of their time and thus lower search cost. In other words, it is the consumers with
lower search costs who can afford to be idle. Finally, we also report the effect of demographics
on search costs. We find that male, older, and employed consumers have higher search costs,
while those with a higher income have lower search costs. These results are in contrast to those
found in some prior work that shows higher income and younger consumers have higher search
cost (De los Santos (2018)). This contrast may stem from differences in our settings. For example,
in contrast to prior work, consumers in our study do not need to browse and click through web-
pages to search, lowering the time and energy requirements of each search decision. Instead,
our study manipulates informational complexity, putting greater demand on consumers’ memory
and information-processing. This difference may explain why we observe higher search costs for
older consumers. In addition, smartphones are relatively expensive durable goods. Controlling for
consumers’ employment status, low income consumers may have stricter budget constraints and
thus may be more likely to search less. Comparing estimates with those in column (3), we find
no sizable impact on search cost estimates of omitting heterogeneous prior information from the
model. Since search costs are identified primarily from the number of options searched, they are
less affected by the omission of belief heterogeneity.
Comparing the two models in terms of log-likelihood in Table 6, AIC and BIC measures, we
17Since we cannot estimate consumers’ price sensitivity (prices do not vary within brand), we are unable to expresssearch cost estimates in dollar terms.
29Marketing Science Institute Working Paper Series

find that accounting for prior information improves fit. To further compare model fit, in Figure 5
we present aggregated market shares (obtained by averaging over 500 simulations) for each brand
under the two models, as well as in the data. It can be seen that the model with heterogeneity in
prior information performs better at predicting market shares than the one without heterogeneity.
Figure 5: Predicted Market Share from Model Estimation Results
Finally, in Table 7 we account for heterogeneity in consumer brand preferences and search
costs using a latent class approach. More precisely, we allow the signal mean and mean search
cost parameters to vary across two segments. We find that segments vary drastically in their
preferences: the larger segment (segment 1, approximately 83% of consumers) prefers Motorola,
followed by Apple, while the smaller segment strongly prefers HTC, followed by Nokia. In addition,
we observe substantial differences in the search costs: the segment 1 has much larger search costs
than the smaller segment (segment 2). This result implies that Apple is more likely to be chosen
when search is short and consumers consider few other alternatives, while other brands are favored
by additional search. Interestingly, during the time the study was conduct, Motorola’s smartphones
were being advertised and positioned as the ‘IPhone’ of Android smartphones18. It’s possible that
the larger segment consumers were more likely to be influenced by the marketing efforts given
the high search cost. During the estimation, we also observe more variations in the results across
different seeds when we estimate the effects of demographics on search cost. It’s likely that the
18https://www.pcworld.com/article/173865/verizonsdroidtargetsiphone.html
30Marketing Science Institute Working Paper Series

Table 7: Estimation Results: Latent Class Model with Heterogeneous PriorSegment 1 Segment 2
Estimates Std. Error Estimates Std. ErrorParameters (1) (2) (3) (4)
Prior MeanPrior Ownership 30.5427 0.01069
Prior VarianceFamiliarity (inverse) 0.3122 0.00641
Signal MeanApple 0.4737 0.01310 -1.1396 0.01334HTC -0.1279 0.01247 1.2576 0.01259Motorola 0.8440 0.01262 -0.1469 0.01265Nokia -0.7465 0.01034 0.4030 0.00961Samsung - - - -
Signal VarianceConstant 28.9038 0.00760Experience (inverse) 0.1439 0.00860
Search CostsConstant -0.8378 0.00659 -6.7928 0.01103Distance: Attribute 4.2055 0.00409Distance: Brand 1.7194 0.00334Center: Attribute 0.0941 0.00293Center: Brand 0.2258 0.00359Low Complexity - - - -Medium Complexity 0.0048 0.00335High Complexity 0.1185 0.00636Whitespace -0.0426 0.00687Female 0.0608 0.00864Age 0.1158 0.00822Employed -0.2451 0.00815Income -0.0142 0.00624
Segment 1 Probability: exp(π)1+exp(π)
π 1.6050 0.00440LL -226179AIC 452360BIC 452363Observations 78617 78617
Note: The results are averaged over 50 estimations using different starting seeds. Standarderrors are calculated using the Outer Product of Gradients estimator (OPG).
segment assignment correlates with the demographics, which can potentially explain the differences
in the estimation results compared to Table 6. In terms of model fit, we find that accounting for
heterogeneous consumer segments fits the data better.
In conclusion, our estimation results suggest that prior information impacts consumers’ search
31Marketing Science Institute Working Paper Series

and purchase decisions. When we do not account for prior information, model estimates and fit
may be biased.
7 Counterfactuals
In this section, we present the results of a series of counterfactual exercises that explore the man-
agerial value of accounting for consumers’ prior information. Towards this goal, we study whether
a ranking algorithm personalized based on consumers’ prior information benefits consumers and
managers. Our setting is well-suited to examine and compare different ranking algorithms because
the order in which products were shown to consumers was randomized in our study. Since in our
data we do not observe price variation across brands, which led us to estimate consumer preferences
at the brand level, we cannot compute brand or platform revenues. Thus, in what follows we will
focus on consumer welfare as a measure of consumer satisfaction and of long term revenues. The
value a consumer obtains from a ranking is defined as her expected utility from the option chosen
for purchase, net of total search costs. We obtain the change in consumer welfare from the change
in this value between two ranking algorithms considered.
In our model, a brand’s ranking influences consumer search decisions by affecting the distance
the eye is required to travel between relevant brands and attributes. Previous work in marketing
has looked at a plethora of different ranking algorithms, such as utility-based, profit-based, or
price-based rankings (e.g. Ferreira et al. (2016); Ursu (2018); Chen and Yao (2017); Ghose et al.
(2014); Choi and Mela (2019); Donnelly et al. (2020)). We contribute to this work in at least two
ways. First, we consider the impact of using prior information, in addition to product features
and consumer choices, to rank products. Second, in contrast to prior work that solely focuses on
settings where products are ordered vertically on a screen (top-down), in our setting products are
displayed horizontally (left-right), making our results more applicable to cases where consumers
use comparison websites or recommendations systems, such as Amazon’s ‘Customers who viewed
this item also viewed’ (Linden et al. (2003)), to make search and purchase decisions.
We consider five alternative ranking algorithms. Each algorithm places the highest ranked
option in the left-most position on the screen, the second highest ranked option in the second
32Marketing Science Institute Working Paper Series

position from the left, and so on.19 Algorithm (1) ranks brands based on our model that accounts for
heterogeneous prior beliefs. More precisely, it orders brands by their signal match value estimated
in column (1) in Table 6: 1. HTC, 2. Motorola, 3. Samsung, 4. Nokia and 5. Apple. Algorithm
(2) ranks brands based on the number of times a consumer searched each brand. In this case,
each consumer sees a potentially different brand ranking. Algorithm (3) ranks brands based on
consumer reported levels of familiarity and prior ownership with the brands.20 More precisely, we
placed the previously owned brand (if one existed) in the left-most position on the screen, and
ordered remaining brands based on familiarity, with ties broken randomly. In this case the ranking
also varied by consumer. Algorithm (4) ranks brands based on market share: 1. Samsung, 2. Apple,
3. HTC, 4. Motorola and 5. Nokia. Finally, algorithm (5) ranks brands based on the model that
assumes consumer prior beliefs are homogeneous, i.e. based on the signal matchs value estimated
in column (3) in Table 6: 1. HTC, 2. Motorola, 3. Apple, 4. Samsung and 5. Nokia. The brand
features and the signals consumers obtain while searching are the same across counterfactuals, with
only the order in which brands are displayed varying.
19An important distinction between ranking for vertical or horizontal lists is that in the latter case one needs tobalance both distances between products and distance from the center of the screen. To resolve this balance, wechoose to place the highest ranked product in the left-most position, ensuring that consumers’ eyes need not traveltoo far to learn about highly ranked options (for example, the 2nd and 3rd ranked options, or the 4th and 5th rankedoptions).
20Note that reported experience levels cannot be used to rank products, since these measures do not vary acrossbrands.
33Marketing Science Institute Working Paper Series
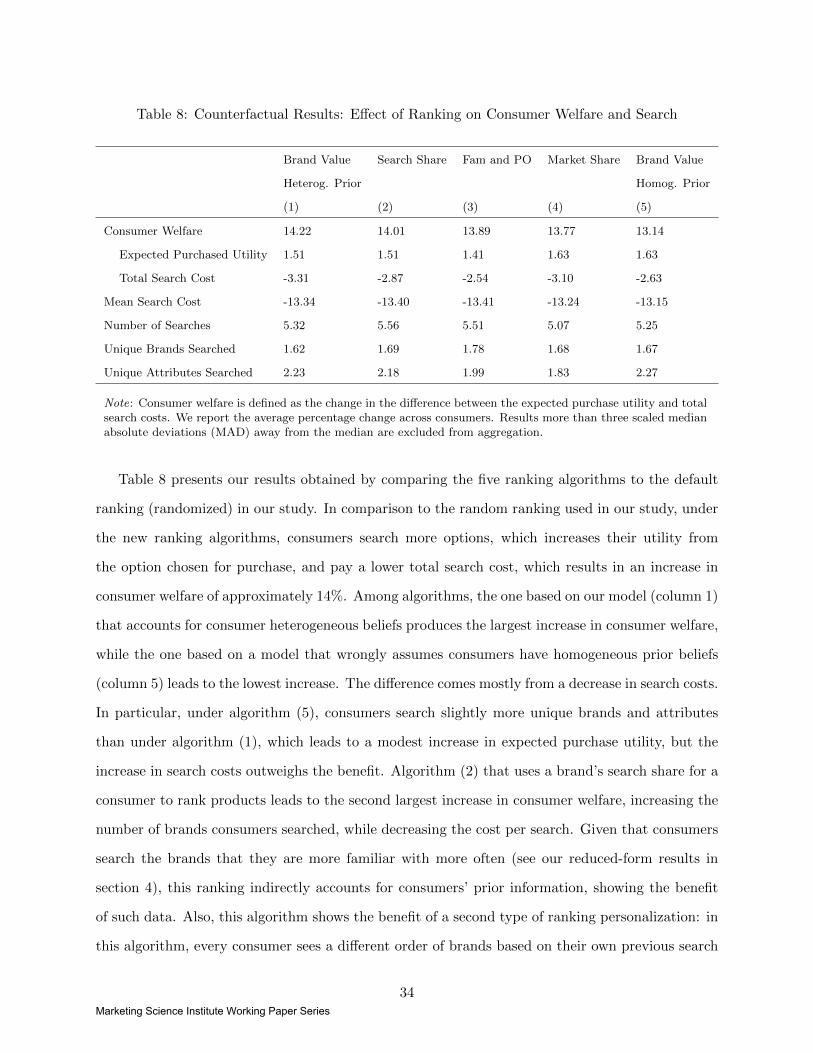
Table 8: Counterfactual Results: Effect of Ranking on Consumer Welfare and Search
Brand Value Search Share Fam and PO Market Share Brand Value
Heterog. Prior Homog. Prior
(1) (2) (3) (4) (5)
Consumer Welfare 14.22 14.01 13.89 13.77 13.14
Expected Purchased Utility 1.51 1.51 1.41 1.63 1.63
Total Search Cost -3.31 -2.87 -2.54 -3.10 -2.63
Mean Search Cost -13.34 -13.40 -13.41 -13.24 -13.15
Number of Searches 5.32 5.56 5.51 5.07 5.25
Unique Brands Searched 1.62 1.69 1.78 1.68 1.67
Unique Attributes Searched 2.23 2.18 1.99 1.83 2.27
Note: Consumer welfare is defined as the change in the difference between the expected purchase utility and totalsearch costs. We report the average percentage change across consumers. Results more than three scaled medianabsolute deviations (MAD) away from the median are excluded from aggregation.
Table 8 presents our results obtained by comparing the five ranking algorithms to the default
ranking (randomized) in our study. In comparison to the random ranking used in our study, under
the new ranking algorithms, consumers search more options, which increases their utility from
the option chosen for purchase, and pay a lower total search cost, which results in an increase in
consumer welfare of approximately 14%. Among algorithms, the one based on our model (column 1)
that accounts for consumer heterogeneous beliefs produces the largest increase in consumer welfare,
while the one based on a model that wrongly assumes consumers have homogeneous prior beliefs
(column 5) leads to the lowest increase. The difference comes mostly from a decrease in search costs.
In particular, under algorithm (5), consumers search slightly more unique brands and attributes
than under algorithm (1), which leads to a modest increase in expected purchase utility, but the
increase in search costs outweighs the benefit. Algorithm (2) that uses a brand’s search share for a
consumer to rank products leads to the second largest increase in consumer welfare, increasing the
number of brands consumers searched, while decreasing the cost per search. Given that consumers
search the brands that they are more familiar with more often (see our reduced-form results in
section 4), this ranking indirectly accounts for consumers’ prior information, showing the benefit
of such data. Also, this algorithm shows the benefit of a second type of ranking personalization: in
this algorithm, every consumer sees a different order of brands based on their own previous search
34Marketing Science Institute Working Paper Series
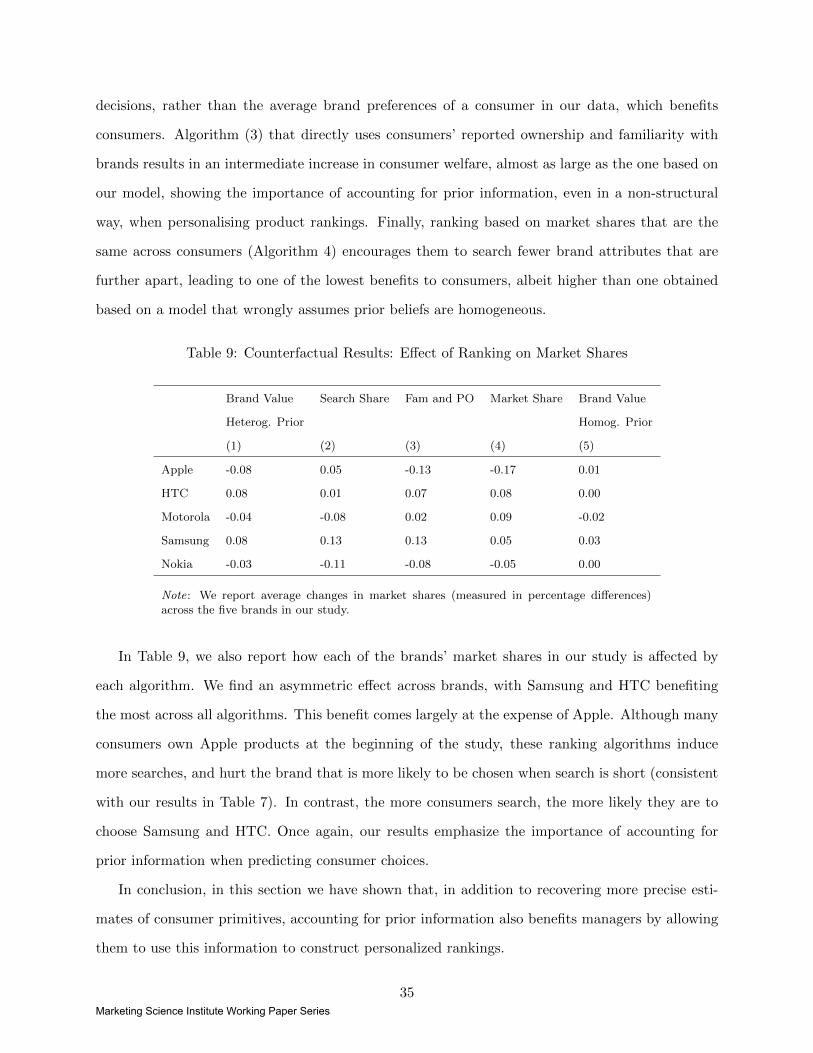
decisions, rather than the average brand preferences of a consumer in our data, which benefits
consumers. Algorithm (3) that directly uses consumers’ reported ownership and familiarity with
brands results in an intermediate increase in consumer welfare, almost as large as the one based on
our model, showing the importance of accounting for prior information, even in a non-structural
way, when personalising product rankings. Finally, ranking based on market shares that are the
same across consumers (Algorithm 4) encourages them to search fewer brand attributes that are
further apart, leading to one of the lowest benefits to consumers, albeit higher than one obtained
based on a model that wrongly assumes prior beliefs are homogeneous.
Table 9: Counterfactual Results: Effect of Ranking on Market Shares
Brand Value Search Share Fam and PO Market Share Brand Value
Heterog. Prior Homog. Prior
(1) (2) (3) (4) (5)
Apple -0.08 0.05 -0.13 -0.17 0.01
HTC 0.08 0.01 0.07 0.08 0.00
Motorola -0.04 -0.08 0.02 0.09 -0.02
Samsung 0.08 0.13 0.13 0.05 0.03
Nokia -0.03 -0.11 -0.08 -0.05 0.00
Note: We report average changes in market shares (measured in percentage differences)across the five brands in our study.
In Table 9, we also report how each of the brands’ market shares in our study is affected by
each algorithm. We find an asymmetric effect across brands, with Samsung and HTC benefiting
the most across all algorithms. This benefit comes largely at the expense of Apple. Although many
consumers own Apple products at the beginning of the study, these ranking algorithms induce
more searches, and hurt the brand that is more likely to be chosen when search is short (consistent
with our results in Table 7). In contrast, the more consumers search, the more likely they are to
choose Samsung and HTC. Once again, our results emphasize the importance of accounting for
prior information when predicting consumer choices.
In conclusion, in this section we have shown that, in addition to recovering more precise esti-
mates of consumer primitives, accounting for prior information also benefits managers by allowing
them to use this information to construct personalized rankings.
35Marketing Science Institute Working Paper Series

8 Discussion
In this paper, we developed a model of sequential search that explains consumers’ search and brand
purchase choices when accounting for consumers’ prior information. We estimated this model on
a data set of consumers making smartphone search and brand purchase decisions that allows us to
observe consumers’ prior ownership, familiarity and experience with available brands. We showed
that prior information impacts consumer search and purchase decisions in three ways: (1) prior
ownership of a brand increases the initial evaluation of the brand; (2) prior familiarity with the
brand decreases initial uncertainty and allows consumers to search more options; and (3) prior
experience with product attributes allows consumers to extract more precise information from
every search action. Also, we have documented the direction of the estimation bias arising if prior
information is not accounted for when modeling consumer search and purchase decisions. Finally,
using our estimation results, we performed a series of counterfactual exercises and showed the
managerial importance of modeling prior brand information when constructing product rankings.
Even in the absence of such a model, accounting for prior information by ranking products based
on consumer ownership or familiarity can benefit consumers and managers.
Our paper emphasizes the importance of prior information in understanding consumers search
and purchase decisions. In particular, it shows that preferences for brands that consumers are more
knowledgeable of are inflated and that product rankings are biased when consumer prior information
is not accounted for. As access to diverse product information sources is becoming easier than every
before, it is paramount for managers to have a framework to account for consumers’ differing level
of prior brand knowledge. We provide exactly such a framework.
Our paper can be extended in a number of directions. One direction may involve considering
different heuristics that consumers use at different stages of decision-making. It is possible that
in later stages of the search process consumers have different goals compared to initial stages (for
example wanting to confirm or compare rather than obtain new information), changing the type
of heuristics they use. It’s also possible that consumers assign a different weight to information
based on how surprising it is, and further studies can explore models that allow for such flexible
heuristics. At another extreme, one can attempt to derive the optimal search rules for our problem,
in order to compare model fit. In addition, one can further explore the role of prior information
36Marketing Science Institute Working Paper Series
in guiding managerial decisions. For example, such data may be useful in informing decisions of
whether and how to advertise to a consumer based on her prior experience with a brand (e.g. Zhang
et al. (2018)). For example, consumers with a lot of prior information on a brand may be harmed
by advertising for that brand, since it prevents them to obtaining information on other brands that
they may be less familiar with. Also, future work could investigate the role of prior information in
affecting decisions over a longer time frame when forgetting may play an additional role.
One limitation to our study is its reliance on a single data set, where consumers used a product
comparison website to make smartphone search and purchase decisions. While our focus helps
us examine the impact of prior information in a well-controlled environment, this setting may be
narrow compared to other consumer search settings. Therefore, studying the importance of prior
beliefs across a larger range of both product categories and information environments would be
recommended.
37Marketing Science Institute Working Paper Series

References
Ackerberg DA (2001) Empirically Distinguishing Informative and Prestige Effects of Advertising. RAND
Journal of Economics 32(2):316–333.
Atalay AS, Bodur HO, Rasolofoarison D (2012) Shining in the center: Central gaze cascade effect on product
choice. Journal of Consumer Research 39(4):848–866.
Berndt ER, Hall BH, Hall RE, Hausman JA (1974) Estimation and Inference in Nonlinear Structural Models.
Annals of Economic and Social Measurement, volume 3, 653–665.
Branco F, Sun M, Villas-Boas JM (2012) Optimal Search for Product Information. Management Science
58(11):2037–2056.
Branco F, Sun M, Villas-Boas JM (2015) Too Much Information? Information Provision and Search Costs.
Marketing Science 35(4):605–618.
Bronnenberg B, Kim J, Mela C (2016) Zooming In on Choice: How Do Consumers Search for Cameras
Online? Marketing Science 35(5):693–712.
Camerer CF, Johnson EJ (2004) Thinking about Attention in Games: Backward and Forward Induction.
In: The Psychology of Economic Decisions. Oxford University Press 2:111–129.
Chandon P, Hutchinson JW, Young SH (2002) Unseen is Unsold: Assessing Visual Equity with Commercial
Eye-tracking Data. Working paper.
Chen Y, Yao S (2017) Sequential Search with Refinement: Model and Application with Click-stream Data.
Management Science 63(12):4345–4365.
Chick SE, Frazier P (2012) Sequential Sampling with Economics of Selection Procedures. Management
Science 58(3):550–569.
Ching AT, Erdem T, Keane MP (2013) Learning Models: An Assessment of Progress, Challenges, and New
Developments. Marketing Science 32(6):913–938.
Choi H, Mela CF (2019) Monetizing online marketplaces. Marketing Science 38(6):948–972.
Dang CI, Ursu RM, Chintagunta PK (2020) Search revisits. Working paper.
De los Santos B (2018) Consumer Search on the Internet. International Journal of Industrial Organization
58:66–105.
De los Santos B, Hortacsu A, Wildenbeest M (2012) Testing Models of Consumer Search Using Data on
Web Browsing and Purchasing Behavior. American Economic Review 102(6):2955–80.
De los Santos B, Koulayev S (2017) Optimizing Click-through in Online Rankings with Endogenous Search
Refinement. Marketing Science 36(4):542–564.
38Marketing Science Institute Working Paper Series

Donnelly R, Kanodia A, Morozov I (2020) A unified framework for personalizing product rankings. Working
Paper .
Dube JP, Hitsch GJ, Rossi PE (2010) State Dependence and Alternative Explanations for Consumer Inertia.
The RAND Journal of Economics 41(3):417–445.
Dukes A, Liu L (2015) Online Shopping Intermediaries: The Strategic Design of Search Environments.
Management Science 62(4):1064–1077.
Erdem T, Keane MP (1996) Decision-making Under Uncertainty: Capturing Dynamic Brand Choice Pro-
cesses in Turbulent Consumer Goods Markets. Marketing Science 15(1):1–20.
Erdem T, Keane MP, Oncu TS, Strebel J (2005) Learning about Computers: An Analysis of Information
Search and Technology Choice. Quantitative Marketing and Economics 3(3):207–247.
Ferreira P, Zhang X, Belo R, Godinho de Matos M (2016) Welfare properties of recommender systems:
Theory and results from a randomized experiment. Working Paper .
Gabaix X, Laibson D, Moloche G, Weinberg S (2006) Costly Information Acquisition: Experimental Analysis
of a Boundedly Rational Model. American Economic Review 96(4):1043–1068.
Gabaix X, Laibson DI (2000) A Boundedly Rational Decision Algorithm. American Economic Review
90(2):433–438.
Gardete P, Antill M (2020) Guiding Consumers through Lemons and Peaches: A Dynamic Model of Search
over Multiple Characteristics. Working paper.
Ghose A, Ipeirotis P, Li B (2019) Modeling Consumer Footprints on Search Engines: An Interplay with
Social Media. Management Science 65(3):1363–1385.
Ghose A, Ipeirotis PG, Li B (2014) Examining the Impact of Ranking on Consumer Behavior and Search
Engine Revenue. Management Science 60(7):1632–1654.
Greene WH (2003) Econometric Analysis (Pearson Education).
Hauser JR (2014) Consideration-Set Heuristics. Journal of Business Research 67(8):1688–1699.
Hong H, Shum M (2006) Using Price Distributions to Estimate Search Costs. The RAND Journal of Eco-
nomics 37(2):257–275.
Honka E (2014) Quantifying Search and Switching Costs in the US auto insurance industry. The RAND
Journal of Economics 45(4):847–884.
Honka E, Chintagunta P (2016) Simultaneous or Sequential? Search Strategies in the US Auto Insurance
Industry. Marketing Science 36(1):21–42.
Hu M, Dang C, Chintagunta PK (2019) Search and learning at a daily deals website. Marketing Science
38(4):609–642.
39Marketing Science Institute Working Paper Series

Iyengar R, Ansari A, Gupta S (2007) A Model of Consumer Learning for Service Quality and Usage. Journal
of Marketing Research 44(4):529–544.
Jindal P, Aribarg A (2020) The Importance of Price Beliefs in Consumer Search. Working paper.
Johnson EJ, Russo JE (1984) Product familiarity and learning new information. Journal of Consumer
Research 11(1):542–550.
Ke TT, Shen ZJM, Villas-Boas JM (2016) Search for Information on Multiple Products. Management Science
62(12):3576–3603.
Ke TT, Villas-Boas JM (2019) Optimal Learning before Choice. Journal of Economic Theory 180:383–437.
Kim JB, Albuquerque P, Bronnenberg BJ (2010) Online Demand under Limited Consumer Search. Marketing
Science 29(6):1001–1023.
Koulayev S (2013) Search with Dirichlet Priors: Estimation and Implications for Consumer Demand. Journal
of Business & Economic Statistics 31(2):226–239.
Koulayev S (2014) Search for Differentiated Products: Identification and Estimation. The RAND Journal of
Economics 45(3):553–575.
Linden G, Smith B, York J (2003) Amazon. com recommendations: Item-to-item collaborative filtering.
IEEE Internet computing 7(1):76–80.
Lu J, Hutchinson J (2020) Information Search within a Webpage: Boundedly Rational Models of Eye
Movements and Clicks. Working paper.
Ma L (2019) Only the Interested Learn–A Model of Proactive Learning of Product Reviews. Working paper.
Malhotra NK (1982) Information Load and Consumer Decision Making. Journal of Consumer Research
8(4):419–430.
Meißner M, Musalem A, Huber J (2016) Eye Tracking Reveals Processes that Enable Conjoint Choices to
Become Increasingly Efficient with Practice. Journal of Marketing Research 53(1):1–17.
Moorthy S, Ratchford BT, Talukdar D (1997) Consumer Information Search Revisited: Theory and Empirical
Analysis. Journal of Consumer Research 23(4):263–277.
Moraga-Gonzalez J, Sandor Z, Wildenbeest M (2017) Consumer Search and Prices in the Automobile Market.
Working paper.
Moraga-Gonzalez JL, Wildenbeest MR (2008) Maximum Likelihood Estimation of Search Costs. European
Economic Review 52(5):820–848.
Narayanan S, Manchanda P (2009) Heterogeneous Learning and the Targeting of Marketing Communication
for New Products. Marketing Science 28(3):424–441.
40Marketing Science Institute Working Paper Series

Ning Z, Villas-Boas JM (2020) Browse or Experience. Working paper.
Orquin JL, Loose SM (2013) Attention and Choice: A Review on Eye Movements in Decision Making. Acta
psychologica 144(1):190–206.
Payne JW (1976) Task Complexity and Contingent Processing in Decision Making: An Information Search
and Protocol Analysis. Organizational behavior and human performance 16(2):366–387.
Pieters R, Erdem T, Martinovici A (2019) Attention Trajectories and Brand Choice: An Eye-Movement
Analysis. Working paper.
Seiler S (2013) The Impact of Search Costs on Consumer Behavior: A Dynamic Approach. Quantitative
Marketing and Economics 11(2):155–203.
Shi SW, Wedel M, Pieters F (2013) Information Acquisition during Online Decision Making: A Model-based
Exploration Using Eye-tracking Data. Management Science 59(5):1009–1026.
Shin S, Misra S, Horsky D (2012) Disentangling Preferences and Learning in Brand Choice Models. Marketing
Science 31(1):115–137.
Stigler GJ (1961) The Economics of Information. Journal of Political Economy 69(3):213–225.
Swait J, Adamowicz W (2001) The Influence of Task Complexity on Consumer Choice: A Latent Class
Model of Decision Strategy Switching. Journal of Consumer Research 28(1):135–148.
Tehrani SS, Ching AT (2020) A Heuristic Approach to Explore: Value of Perfect Information. Working
paper.
Ursu RM (2018) The power of rankings: Quantifying the effect of rankings on online consumer search and
purchase decisions. Marketing Science 37(4):530–552.
Ursu RM, Wang Q, Chintagunta PK (2020) Search Duration. Marketing Science (Forthcoming).
Wedel M, Pieters R (2000) Eye Fixations on Advertisements and Memory for Brands: A Model and Findings.
Marketing Science 19(4):297–312.
Wedel M, Pieters R (2008) Eye Tracking for Visual Marketing. Foundations and Trends in Marketing
1(4):231–320.
Weitzman ML (1979) Optimal Search for the Best Alternative. Econometrica: Journal of the Econometric
Society 641–654.
Yang L, Toubia O, De Jong MG (2015) A Bounded Rationality Model of Information Search and Choice In
Preference Measurement. Journal of Marketing Research 52(2):166–183.
Yavorsky D, Honka E, Chen MK (2020) Consumer Search in the US Auto Industry: The Value of Dealership
Visits. Working paper.
41Marketing Science Institute Working Paper Series

Zhang Q, Hill S, Rothschild D (2018) Post purchase search engine marketing. Companion Proceedings of the
The Web Conference 663–670.
42Marketing Science Institute Working Paper Series

9 Appendix
9.1 Further Evidence for Section 3
Figure 6: Study Design Under the High Complexity Condition
Figure 7: Illustrating Eye-Fixations
43Marketing Science Institute Working Paper Series

Figure 8: Consumer Demographics
44Marketing Science Institute Working Paper Series