Toxicokinetics 1 Crispin Pierce, Ph.D. University of Washington [email protected] (206) 616-4390.

Biochemical and Molecular Toxicology
ENVR 442; TOXC 442; BIOC 442
Principles of Toxicokinetics/Toxicodynanics
Kim L.R. Brouwer, PharmD, PhD
[email protected]; 919-962-7030

Pharmacokinetics/ Toxicokinetics:
the study of the time course of
xenobiotic absorption, distribution, metabolism and
excretion

ADME
Absorption – how the xenobiotic enters the body
Distribution – where the xenobiotic goes in the body
Metabolism – what the body does to the xenobiotic
Elimination – how the xenobiotic is removed from the body

Pharmacodynamics/ Toxicodynamics:
the relationship between
xenobiotic concentration at the site of action and the resulting
effect, including the time course and intensity of therapeutic and
adverse effects

Pharmacokinetics/ Pharmacodynamics/ Toxicokinetics Toxicodynamics
Dosage Regimen/ Exposure
Plasma Concen- tration
Site of Action
Effects: Pharmacologic Toxic

Toxicokinetic/ADME Studies
Pharmacokinetics / Bioavailability Mass Balance Tissue Distribution Metabolite Profile Plasma Protein Binding Inhibition / Induction

Clinical Testing Pre-Clinical Testing
In Vitro PK / PD
Animal PK / PD
Toxicology
PK-Guided Dose
Escalation
Safety Assessment
Phase 1
Dose/Response
Efficacy
Dose Selection
Patient Variables
Pop’n PK In Large Efficacy
Trials
Special Populations
Phase 2
Phase 3
Bio- Equivalence
Generics
Product line extension
Post Marketing

Terms used in Pharmacokinetics/Toxicokinetics:
Cmax Tmax λ t 1/2
AUC AUMC
Vdss
fu Cl MRT MAT F

Cmax maximum concentration of compound
observed in the matrix of interest
Tmax time of maximum concentration

100
1000
10000
0 5 10 15 20 25
Cmax
Time
Con
cent
ratio
n
Tmax - time of maximum concentration

lambda (λ) terminal elimination rate constant (slope from a semi-log concentration vs time
plot)
t 1/2 half-life: the time it takes for the
concentration of the compound to decrease by 50%

100
1000
10000
0 5 10 15 20 25
- slope =
t12
2=
lnλ
λ
Time
Con
cent
ratio
n

The Half-life is Compound- and Subject-Dependent
Compound Name t1/2 (h)
Rosiglitazone Avandia 3-4
Lamotrigine Lamictal 25-33
Buproprion Wellbutrin 21
Fluticasone Flovent n/a
Paroxetine Paxil 21
Data from LexiComp

Half-life Half-life is used to:
– Determine the time to reach steady-state (5 x t1/2) – Determine the time to eliminate all the compound from
the body (5 t1/2) – Calculate dosing intervals – Determine how much compound accumulates in the body
given a fixed dosing interval or exposure Half-life is a secondary pharmacokinetic parameter
that is determined by the volume of distribution (V) and clearance (Cl) of the compound
ClxVt 693.0
21 =

AUC area under the
concentration vs time curve
ln C
once
ntra
tion
∞
AUC
Time

tau
ln C
once
ntra
tion
Time
AUC 0→∞ = AUC tau
Single Dose Multiple Dose to Steady-State
∞Time

Steady-state
At Steady-State: Rate of input = Rate of elimination

AUMC area under the
first moment curve
Tim
e *
Con
cent
ratio
n ∞
AUMC
Time

Mean Residence Time (MRT)
The average time one molecule resides in the body
MRT = AUMC/AUC Used to express overall persistence of
compound in the body

Clearance (Cl) – volume of fluid
(usually blood) from which compound is removed completely per unit time
Mathematically:
ClDoseAUC
=∞
Organs that may be involved in clearance: » GI tract » Liver » Kidney » Lungs » Other sites (e.g., blood, skin)

Clearances (Cl) are Additive

Pharmacokinetic Parameters of
GI158104X in Dog
Dose mg/kg/day
ClIV (mL/min/kg)
Clr (mL/min/kg)
9.5 10 0.7
Clother (mL/min/kg)
9.3

Linear Pharmacokinetics
Linear Kinetics = Dose-Proportional kinetics AUC (or concentration) changes
proportionally with dose
Dose
AU
C

Avandia Package Insert

Stationary Pharmacokinetics
Pharmacokinetic parameters are independent of time
Package insert for Tegretol (carbamazepine)
Because Tegretol induces its own metabolism, the half-life is also variable. Autoinduction is completed after 3-5 weeks of a fixed dosing regimen. Initial half-life values range from 25-65 hrs, decreasing to 12-17 hr s on repeated doses. Tegretol is metabolized in the liver.

Volume of Distribution at Steady-State (Vdss) a parameter that relates
plasma concentration to total mass of compound in the body
Mathematically:
VdDose AUMC
AUCss =*
2

The Volume of Distribution is Compound- and Subject-Dependent
Compound Name V (L)
Rosiglitazone Avandia 18
Lamotrigine Lamictal 70
Buproprion Wellbutrin 140
Fluticasone Flovent 280
Paroxetine Paxil 560
Data from LexiComp

Fraction Unbound (fu) – fraction of drug that is not
bound to plasma proteins – the unbound
concentration is in equilibrium between the tissues and blood
Blood
Tissue
Bound Drug
Unbound Drug
Bound Drug
Unbound Drug

Protein-Binding Changes May be Clinically Relevant for the Following Types of
Compounds and Routes of Administration High Extraction
Ratio Low Extraction
Ratio IV Administration
Hepatic Clearance Yes No
Nonhepatic Clearance Yes No Oral Administration
Hepatic Clearance No No
Nonhepatic Clearance Yes† No † No drugs from a list of 456 met these criteria Benet and Hoener, Clin Pharmacol Ther 71:115, 2002
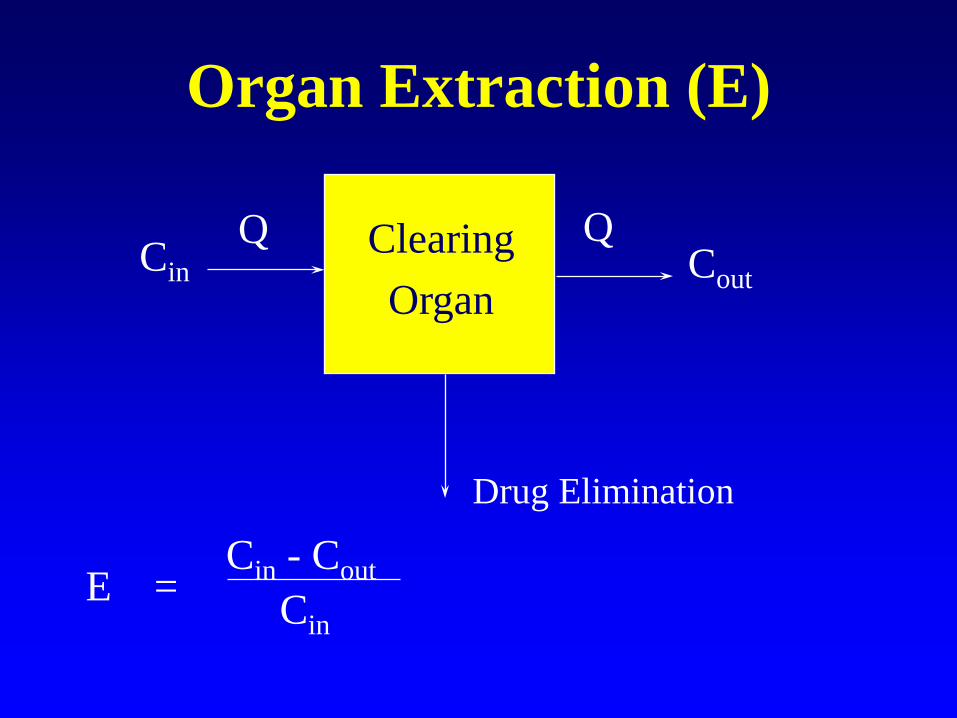
Organ Extraction (E)
Clearing Organ
Cin Cout Q Q
Drug Elimination
E =
Cin - Cout Cin

When Is Protein Binding Important?
In vitro ADME/preclinical toxicology studies Scaling pharmacokinetic/pharmacodynamic
parameters from animal models to humans Calculating human doses from in vitro
measures of target concentrations Therapeutic drug monitoring of blood/plasma
concentrations for drugs with a narrow therapeutic index

Bioavailability (F) fraction of the administered
dose that reaches the systemic circulation intact
0 < F < 1
Mathematically:
FAUCAUC
DoseDose
PO
IV
IV
PO= *

Relative Bioavailability fraction of the dose of a test product
that reaches the systemic circulation relative to a reference product
Mathematically:
F AUCtestAUCref
DoserefDosetest
= *

Bioavailability is an important determinant of pharmacologic
response and therapeutic effectiveness

Estimation of Oral Bioavailability (F) After an IV and Oral Dose of
Compound X Dose
mg/kg/day AUCIV1 (µg*hr/mL)
AUCPO 1 (µg*hr/mL)
5.0 6.25 5.94
25.0 32.4
1 mean, n=4
8.15
F
0.25
0.95

Factors Responsible for Poor
or Variable Oral Bioavailability
Physicochemical Factors Physiologic Factors

Influence of Formulation Factors on the Concentration-Time Profile
Formulations with different release rates (absorption kinetics)
Time, h
0 4 8 12 16 20 24 28 32 36Ros
iglit
azon
e Pl
asm
a C
once
ntra
tion,
ng/
mL
0
50
100
150
200
CC CCCC
C
CC
C
C
C
C
C
CCDDDD
DD
D
D
D
D
DD
D
D
D
DEE
EE
E
EE
E
E
E
E
E
E
E
E
EEFF
F
F
F
F
F F F
F
FF
F
F
F
F
GG
G
G
G
G
G
G
GG
G
G
G
GG
GHH
H
H
H
H
HH H
H
H
H
H
HH
H
Formulation #1CFormulation #2DFormulation #3EFormulation #4FFormulation #5GFormulation #6H

Influence of Formulation on the Bioavailability of a Compound
Bioequivalence studies are performed to select the formulation which gives the greatest oral exposure to the drug
Serum Concentration vs Time Profile
0
50
100
150
200
250
0 5 10 15Time (hours)
Con
cent
ratio
n (n
g/m
L)
Form. AForm. B

Special Studies: Effects of Food on Exposure
Often the fed/fasted state of the animal/human can influence the absorption of drugs
Food can enhance or inhibit absorption
Food can impact clinical dosing
0
500
1000
1500
2000
2500
3000
3500
4000
4500
Fed Fasted
AUC (inf)(ng*hr/mL)

Physiologic Factors Responsible
for Poor or Variable Oral Bioavailability
Cell Membranes pH, Volume and Content of GI Fluid GI Motility Vascularity and Blood Flow Enzymatic Degradation / Metabolism Disease States

The Gastrointestinal Tract

Liver
Portal Vein Gut Lumen
Gut Wall
Systemic Circulation
Metabolism
Feces
Factors Affecting Systemic Availability
Solubility Chemical Stability Permeability Mucosal Metabolism Transport/Efflux
Protein Binding RBC Partitioning Blood/Plasma Stability
Metabolism Biliary Excretion

Presystemic Elimination: (First-Pass Effect) Loss or metabolism of drug between the administration and sampling site Example: Grapefruit Juice Decreases Felodipine Bioavailability

In Vivo Pharmacokinetic and Bioavailability Studies Resulting Information:
– pharmacokinetic parameters (t1/2, AUC, Vdss, Cl, F) in the species used for the multiple dose toxicology studies
– rate and extent of drug absorption – primary routes of elimination
Utility: – identifies bioavailability problems – parameters are used in scaling to humans to
predict the initial human dose

Additional Studies for Compounds That Exhibit Poor Bioavailability In Vivo Studies to Assess Sites of
Presystemic Elimination:

Liver
Portal Vein
Systemic Circulation
Assessing Sites of Presystemic Elimination
Duodenum
Jejunum & Ileum
Dose
Dose Stomach
Dose

Additional Studies for Compounds That Exhibit Poor Bioavailability
In Vivo Portal Vein Administration Studies:
– If FPV approximates 100%, presystemic elimination occurs prior to the portal vein (gut lumen or gut wall)
– If FPV approximates FPO, presystemic elimination occurs primarily in the liver
PV
IV
IV
PVPV Dose
DoseAUCAUCF *=

Liver
Portal Vein
Systemic Circulation
Assessing Sites of Presystemic Elimination
Duodenum
Jejunum & Ileum
Dose
Dose Stomach
Dose
Dose

Case Study: Assessing Sites of Presystemic Elimination
Route of Administration
AUC (µg*hr/ml)
Bioavailability (%)
Oral 972 21
Intraduodenal 1378 30
Portal Vein 4386 94
Intravenous 4653 100

In Situ and In Vitro Models to Assess Sites of Presystemic Elimination Models to Assess Presystemic Elimination Prior to
the Portal Vein – Isolated Perfused Intestinal Segments – Everted Gut Sacs – Intestinal Rings – Cell Monolayers
Models to Assess Hepatic Presystemic Elimination – Isolated Perfused Liver – Liver Slices – Hepatocytes (freshly isolated/cultured)

Toxicokinetics
Dose Selection Dose Proportionality Multiple Dose Pharmacokinetics Induction/Inhibition Exposure Verification

Toxicokinetics: Dose Selection
Determination of the optimum dose – primarily focused on the relationship between
dose and exposure » linearity » saturation

Cmax and AUC Following Escalating Doses of Compound A
Dose mg/kg/day
Cmax 1
(ug/mL)
AUC 1
(ug*hr/mL)
5.0 1.40 6.25
25.0 9.47 32.4
100.0 10.56 47.2
1 mean, n=4

Dose Selection
0 2000 4000 6000 8000
10000 12000
0 100 200 300 400
Dose (mg/kg/day)
AUC (ng*h/mL)
Rat Dog

Saturation of Absorption
05
10152025303540
25 500 10 500
Dose (mg/kg)
Bio
avai
labi
lity
(%)
Mouse Dog

Toxicokinetics: Dose Proportionality A = AUC increases proportional to dose.
B = Less than proportional increase in exposure: Absorption-limited exposure.
C = Greater than proportional increase in exposure: Capacity-limited elimination
0
200
400
600
800
1000
1200
1400
1600
0 50 100 150 200 250 300Dose (mg/kg)
AU
C h
r*µg
/m
A
B
C
Interpretation of results demonstrating lower toxicity at higher doses depends on whether compound exhibits dose-proportional kinetics.

Toxicokinetics: Multiple Dose Pharmacokinetics
Determine how drug distribution is altered after multiple dosing – Examine changes in clearance, half-life, accumulation,
linearity – Assure dose related continuous exposure of the animals
to the test compound Evaluate:
– Toxicokinetic changes with dose and time – Effect of advancing age of the animals – Decreases in lean body mass, total body water, cardiac
output, renal, hepatic and GI tract blood flow

Terminal t1/2 (mean and SD) on Days 1 and 30 During a Rat 1-Month
Oral Multiple Dosing Study Males Females
Half-life (hr) Half-life (hr)Dose Day 1 Day 30 Dose Day 1 Day 30
(mg/kg/day) (mg/kg/day)
5 2.94 2.31 5 2.15 1.720.86 0.29 0.10 0.09
25 2.18 2.06 25 2.45 1.990.30 0.25 1.07 0.39
150 15.33 2.14 150 9.76 2.723.32 0.14 4.54 0.71

Effect of Age on the Toxicokinetics of N-Acetylprocainamide HCl After IV Administration of 100 mg/kg in Rats
Age
Parameters
Half-life (hr)
C (0) (ug/mL)
AUC (ug*hr/mL)
Cl (L/hr/kg)
Vd (L/kg)
13 Weeks Mean
1.66
19.0
45.3
2.01
4.75
(n=7) CV%
12.1
12.1
18.2
14.8
11.2
26 Weeks Mean
1.82
27.7
72.6
1.29
3.35
(n=11) CV%
14.2
21.6
27.0
23.5
22.0
52 Weeks Mean
2.29
46.9
156.0
0.664
1.98
(n=7) CV%
42.3
21.8
51.4
71.4
24.9
From: S. Garattini, Drug Metabolism Reviews 13, (3), 1982

Time (Exposure) Dependence
0
5
10
15
20
25
30
35
40
0 5 10 15 20 25Time
Inhibition
Normal
Induction
1
10
100
0 5 10 15 20 25Time
Inhibition
Normal
Induction
Induction and Inhibition of metabolism as examples of elimination changes
Induction or Inhibition may occur without affecting the overall disposition of the test compound

Exposure Verification - Example
Continuous IV infusion for 14 days in rats and dogs
Infusion solution at pH = 5 Blood samples taken at various times to
document exposure Pilot (24 hr) study in both species

Exposure Verification
1
10
100
1000
10000
0 50 100 150 200
Con
cent
ratio
n (n
g/m
L)
Time (h)
MalesFemalesExpected

Special Toxicokinetic Issues
Toxicity / Potency Evaluations Metabolic Sites Correlation of Residual Drug with Toxicity Species Selection Gender Effects Placental Transfer Milk Transfer

Coverage for Human Metabolites
From: Ferrero, J.L. and Brendel, K. Advances in Pharmacology V43, pp131-169, 1997.
Species Selection − confirmation that the
species chosen for oncogenicity studies supports the human metabolism
− is there coverage in the animal species for all metabolites generated in human systems

Antiviral Alone
Antiviral + GF120918 CSF
Brain
CSF Brain
Blood
Ratio
Antiviral Alone
Antiviral + GF120918
Brain/Blood
CSF/Blood
0.35
0.86
0.06
0.45
0.00
0.10
0.20
0.30
0.40
0.50
0.60
0.70
0.80
0.90
Ratio
Antiviral Alone
Antiviral + GF120918
Brain/Blood
CSF/Blood
0.35
0.86
0.06
0.45
0.00
0.10
0.20
0.30
0.40
0.50
0.60
0.70
0.80
0.90
Ratio
Brain/Blood CSF/Blood
Use of Whole Body Autoradiography (WBA) to Assess Effect of GF120918 on
Antiviral Distribution in Rats
Courtesy of Glaxo, Inc.

Toxicokinetic Modeling
Classic Compartmental Modeling – 1-Compartment Model – Multi-compartment Model
Physiologic Compartmental Modeling
– Perfusion-Limited Compartments – Diffusion-Limited Compartments – Specialized Compartments

Scheme Describing Disposition of Prodrug and Metabolite in Isolated Perfused Liver and Sandwich-
Cultured Hepatocytes
Yan et al. J Pharmacol Exp Ther, 337:503-512, 2011

Intrahepatic Binding Markedly Influences Disposition of Active Metabolite
• Hepatic accumulation of active metabolite was extensive (>95% of total formed)
• Hepatic unbound fraction (fu,L) of furamidine was only 0.3% explaining, at least in part, low perfusate (systemic) exposure of furamidine.
Yan et al. J Pharmacol Exp Ther, 337:503-512, 2011

1. Parameters » Molecular Weight » Log P » Partition Coefficients » Protein Binding » Metabolic (Vmax & Km) » Clearance
2. Structure – Organs & tissues involved – Organ Weights – Organ Flows – Perfusion/Diffusion and/or
Transport 3. Equations
– Mass Balance – Clearance from tissues
Schematic of Physiologically-Based Pharmacokinetic Model

Schematic Structure of Physiologically-Based Toxicokinetic Model for Inhaled Propylene Oxide
Csanády G A , Filser J G Toxicol. Sci. 2006;95:37-62