Principles of Applications of Polarography and Voltammetry...
20
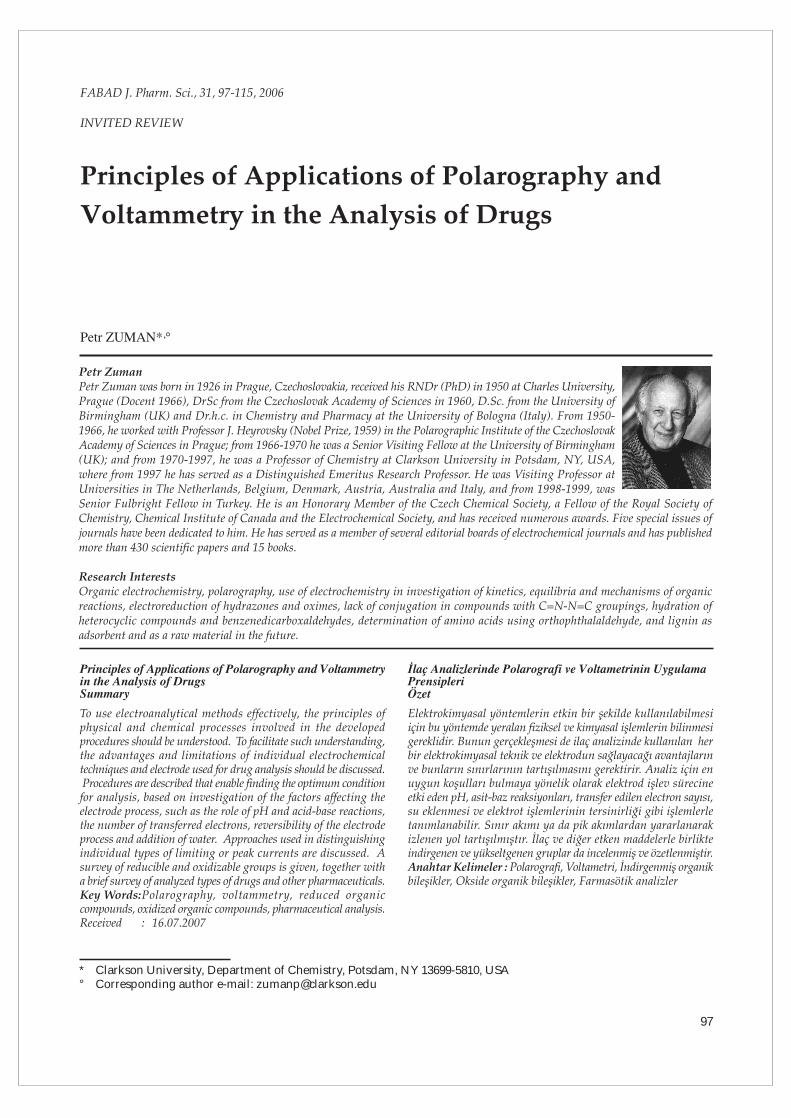
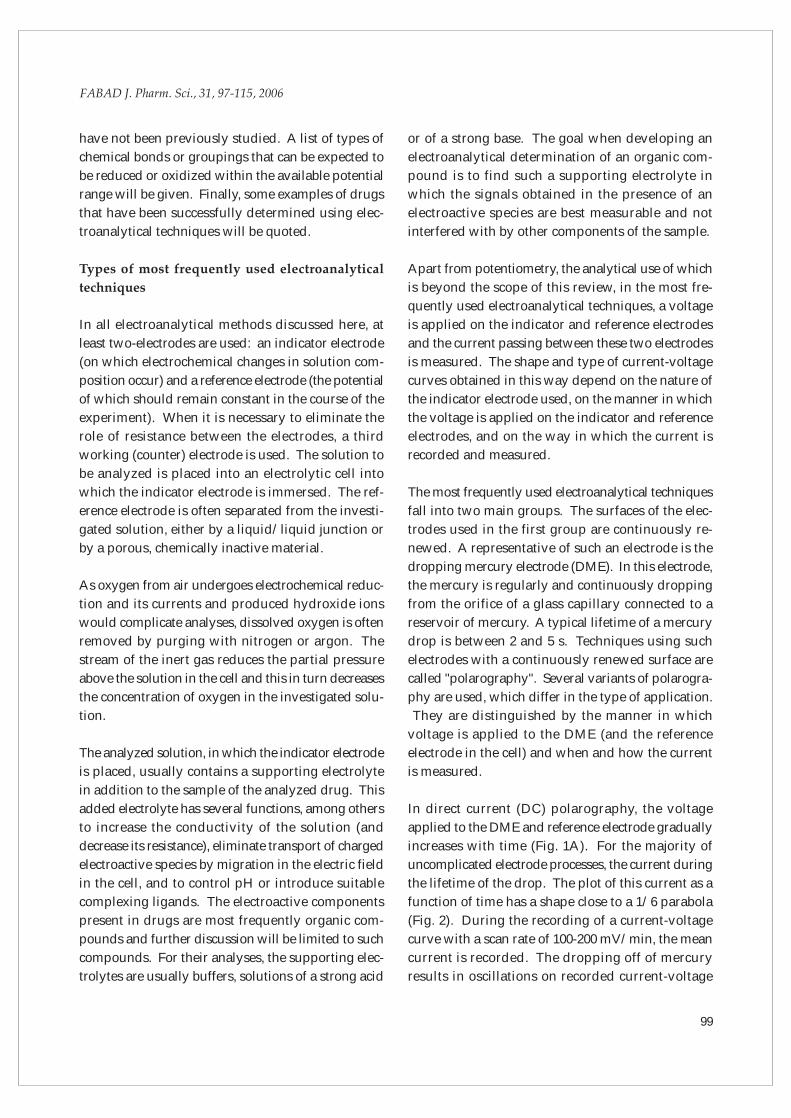
97 FABAD J. Pharm. Sci., 31, 97-115, 2006 INVITED REVIEW Principles of Applications of Polarography and Voltammetry in the Analysis of Drugs * ° Clarkson University, Department of Chemistry, Potsdam, NY 13699-5810, USA Corresponding author e-mail: [email protected] Principles of Applications of Polarography and Voltammetry in the Analysis of Drugs Summary To use electroanalytical methods effectively, the principles of physical and chemical processes involved in the developed procedures should be understood. To facilitate such understanding, the advantages and limitations of individual electrochemical techniques and electrode used for drug analysis should be discussed. Procedures are described that enable finding the optimum condition for analysis, based on investigation of the factors affecting the electrode process, such as the role of pH and acid-base reactions, the number of transferred electrons, reversibility of the electrode process and addition of water. Approaches used in distinguishing individual types of limiting or peak currents are discussed. A survey of reducible and oxidizable groups is given, together with a brief survey of analyzed types of drugs and other pharmaceuticals. Key Words: Polarography, voltammetry, reduced organic compounds, oxidized organic compounds, pharmaceutical analysis. Received : 16.07.2007
Transcript of Principles of Applications of Polarography and Voltammetry...
97
FABAD J. Pharm. Sci., 31, 97-115, 2006
INVITED REVIEW
Principles of Applications of Polarography and Voltammetry in the Analysis of Drugs
*°
Clarkson University, Department of Chemistry, Potsdam, NY 13699-5810, USACorresponding author e-mail: [email protected]
Principles of Applications of Polarography and Voltammetry in the Analysis of Drugs Summary
To use electroanalytical methods effectively, the principles of physical and chemical processes involved in the developed procedures should be understood. To facilitate such understanding, the advantages and limitations of individual electrochemical techniques and electrode used for drug analysis should be discussed. Procedures are described that enable finding the optimum condition for analysis, based on investigation of the factors affecting the electrode process, such as the role of pH and acid-base reactions, the number of transferred electrons, reversibility of the electrode process and addition of water. Approaches used in distinguishing individual types of limiting or peak currents are discussed. A survey of reducible and oxidizable groups is given, together with a brief survey of analyzed types of drugs and other pharmaceuticals.Key Words:Polarography, voltammetry, reduced organic compounds, oxidized organic compounds, pharmaceutical analysis.Received : 16.07.2007
98
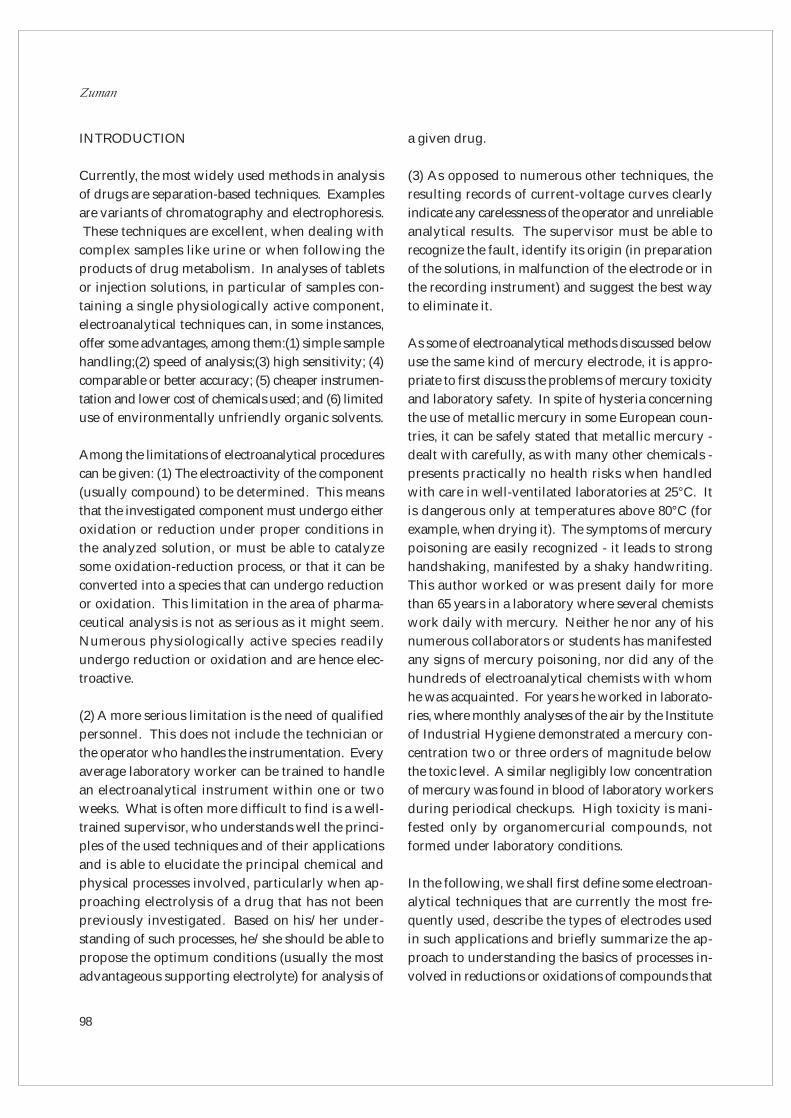
INTRODUCTION
Currently, the most widely used methods in analysis
of drugs are separation-based techniques. Examples
are variants of chromatography and electrophoresis.
These techniques are excellent, when dealing with
complex samples like urine or when following the
products of drug metabolism. In analyses of tablets
or injection solutions, in particular of samples con-
taining a single physiologically active component,
electroanalytical techniques can, in some instances,
offer some advantages, among them:(1) simple sample
handling;(2) speed of analysis;(3) high sensitivity; (4)
comparable or better accuracy; (5) cheaper instrumen-
tation and lower cost of chemicals used; and (6) limited
use of environmentally unfriendly organic solvents.
Among the limitations of electroanalytical procedures
can be given: (1) The electroactivity of the component
(usually compound) to be determined. This means
that the investigated component must undergo either
oxidation or reduction under proper conditions in
the analyzed solution, or must be able to catalyze
some oxidation-reduction process, or that it can be
converted into a species that can undergo reduction
or oxidation. This limitation in the area of pharma-
ceutical analysis is not as serious as it might seem.
Numerous physiologically active species readily
undergo reduction or oxidation and are hence elec-
troactive.
(2) A more serious limitation is the need of qualified
personnel. This does not include the technician or
the operator who handles the instrumentation. Every
average laboratory worker can be trained to handle
an electroanalytical instrument within one or two
weeks. What is often more difficult to find is a well-
trained supervisor, who understands well the princi-
ples of the used techniques and of their applications
and is able to elucidate the principal chemical and
physical processes involved, particularly when ap-
proaching electrolysis of a drug that has not been
previously investigated. Based on his/her under-
standing of such processes, he/she should be able to
propose the optimum conditions (usually the most
advantageous supporting electrolyte) for analysis of
a given drug.
(3) As opposed to numerous other techniques, the
resulting records of current-voltage curves clearly
indicate any carelessness of the operator and unreliable
analytical results. The supervisor must be able to
recognize the fault, identify its origin (in preparation
of the solutions, in malfunction of the electrode or in
the recording instrument) and suggest the best way
to eliminate it.
As some of electroanalytical methods discussed below
use the same kind of mercury electrode, it is appro-
priate to first discuss the problems of mercury toxicity
and laboratory safety. In spite of hysteria concerning
the use of metallic mercury in some European coun-
tries, it can be safely stated that metallic mercury -
dealt with carefully, as with many other chemicals -
presents practically no health risks when handled
with care in well-ventilated laboratories at 25°C. It
is dangerous only at temperatures above 80°C (for
example, when drying it). The symptoms of mercury
poisoning are easily recognized - it leads to strong
handshaking, manifested by a shaky handwriting.
This author worked or was present daily for more
than 65 years in a laboratory where several chemists
work daily with mercury. Neither he nor any of his
numerous collaborators or students has manifested
any signs of mercury poisoning, nor did any of the
hundreds of electroanalytical chemists with whom
he was acquainted. For years he worked in laborato-
ries, where monthly analyses of the air by the Institute
of Industrial Hygiene demonstrated a mercury con-
centration two or three orders of magnitude below
the toxic level. A similar negligibly low concentration
of mercury was found in blood of laboratory workers
during periodical checkups. High toxicity is mani-
fested only by organomercurial compounds, not
formed under laboratory conditions.
In the following, we shall first define some electroan-
alytical techniques that are currently the most fre-
quently used, describe the types of electrodes used
in such applications and briefly summarize the ap-
proach to understanding the basics of processes in-
volved in reductions or oxidations of compounds that
99
have not been previously studied. A list of types of
chemical bonds or groupings that can be expected to
be reduced or oxidized within the available potential
range will be given. Finally, some examples of drugs
that have been successfully determined using elec-
troanalytical techniques will be quoted.
Types of most frequently used electroanalytical
techniques
In all electroanalytical methods discussed here, at
least two-electrodes are used: an indicator electrode
(on which electrochemical changes in solution com-
position occur) and a reference electrode (the potential
of which should remain constant in the course of the
experiment). When it is necessary to eliminate the
role of resistance between the electrodes, a third
working (counter) electrode is used. The solution to
be analyzed is placed into an electrolytic cell into
which the indicator electrode is immersed. The ref-
erence electrode is often separated from the investi-
gated solution, either by a liquid/liquid junction or
by a porous, chemically inactive material.
As oxygen from air undergoes electrochemical reduc-
tion and its currents and produced hydroxide ions
would complicate analyses, dissolved oxygen is often
removed by purging with nitrogen or argon. The
stream of the inert gas reduces the partial pressure
above the solution in the cell and this in turn decreases
the concentration of oxygen in the investigated solu-
tion.
The analyzed solution, in which the indicator electrode
is placed, usually contains a supporting electrolyte
in addition to the sample of the analyzed drug. This
added electrolyte has several functions, among others
to increase the conductivity of the solution (and
decrease its resistance), eliminate transport of charged
electroactive species by migration in the electric field
in the cell, and to control pH or introduce suitable
complexing ligands. The electroactive components
present in drugs are most frequently organic com-
pounds and further discussion will be limited to such
compounds. For their analyses, the supporting elec-
trolytes are usually buffers, solutions of a strong acid
or of a strong base. The goal when developing an
electroanalytical determination of an organic com-
pound is to find such a supporting electrolyte in
which the signals obtained in the presence of an
electroactive species are best measurable and not
interfered with by other components of the sample.
Apart from potentiometry, the analytical use of which
is beyond the scope of this review, in the most fre-
quently used electroanalytical techniques, a voltage
is applied on the indicator and reference electrodes
and the current passing between these two electrodes
is measured. The shape and type of current-voltage
curves obtained in this way depend on the nature of
the indicator electrode used, on the manner in which
the voltage is applied on the indicator and reference
electrodes, and on the way in which the current is
recorded and measured.
The most frequently used electroanalytical techniques
fall into two main groups. The surfaces of the elec-
trodes used in the first group are continuously re-
newed. A representative of such an electrode is the
dropping mercury electrode (DME). In this electrode,
the mercury is regularly and continuously dropping
from the orifice of a glass capillary connected to a
reservoir of mercury. A typical lifetime of a mercury
drop is between 2 and 5 s. Techniques using such
electrodes with a continuously renewed surface are
called "polarography". Several variants of polarogra-
phy are used, which differ in the type of application.
They are distinguished by the manner in which
voltage is applied to the DME (and the reference
electrode in the cell) and when and how the current
is measured.
In direct current (DC) polarography, the voltage
applied to the DME and reference electrode gradually
increases with time (Fig. 1A). For the majority of
uncomplicated electrode processes, the current during
the lifetime of the drop. The plot of this current as a
function of time has a shape close to a 1/6 parabola
(Fig. 2). During the recording of a current-voltage
curve with a scan rate of 100-200 mV/min, the mean
current is recorded. The dropping off of mercury
results in oscillations on recorded current-voltage
FABAD J. Pharm. Sci., 31, 97-115, 2006
100
curves. Measurement of the mean current in the
center of oscillations is recommended. For such
current the theory is available and moreover, such
current is less affected by the presence of surface-
active substances in the sample than the maximum
current recommended by some. The maximum cur-
rent is, furthermore, less reliable, as its intensity may
be affected by the instrumentation used.
In the solution of a supporting electrolyte in the
absence of an electroactive species, recording of a
current-voltage curve results in a current varying
slightly with applied voltage until a potential is
reached, where a component of the supporting elec-
trolyte is reduced (at negative potentials) (Fig. 3A,
curve 1) or oxidized (at positive potentials). In the
presence of an electroactive species, the current also
remains low, but only until the potential region is
reached where the electroactive species is reduced or
oxidized. In the following, the discussion will be
limited to reductions, more often investigated when
DME is used. So, for reductions, as the rate of the
electroreduction increases with an increasingly more
negative voltage and in a potential range, characteristic
for the nature of the reduced species, the current
increases. This happens until a potential is reached,
where the rate of electrolysis becomes faster than the
rate of transport of the reducible species to the surface
of the electrode (most often by diffusion). When the
rate of the transport becomes the slow step, the current
remains independent of the applied potential, as the
rate of the transport is independent of the applied
potential. Such potential independent current is called
limiting current. The current remains practically
constant until a potential is reached where the next
electrolytic process takes place. The resulting current-
voltage curve has a shape shown in Figure 3A (curve
2).
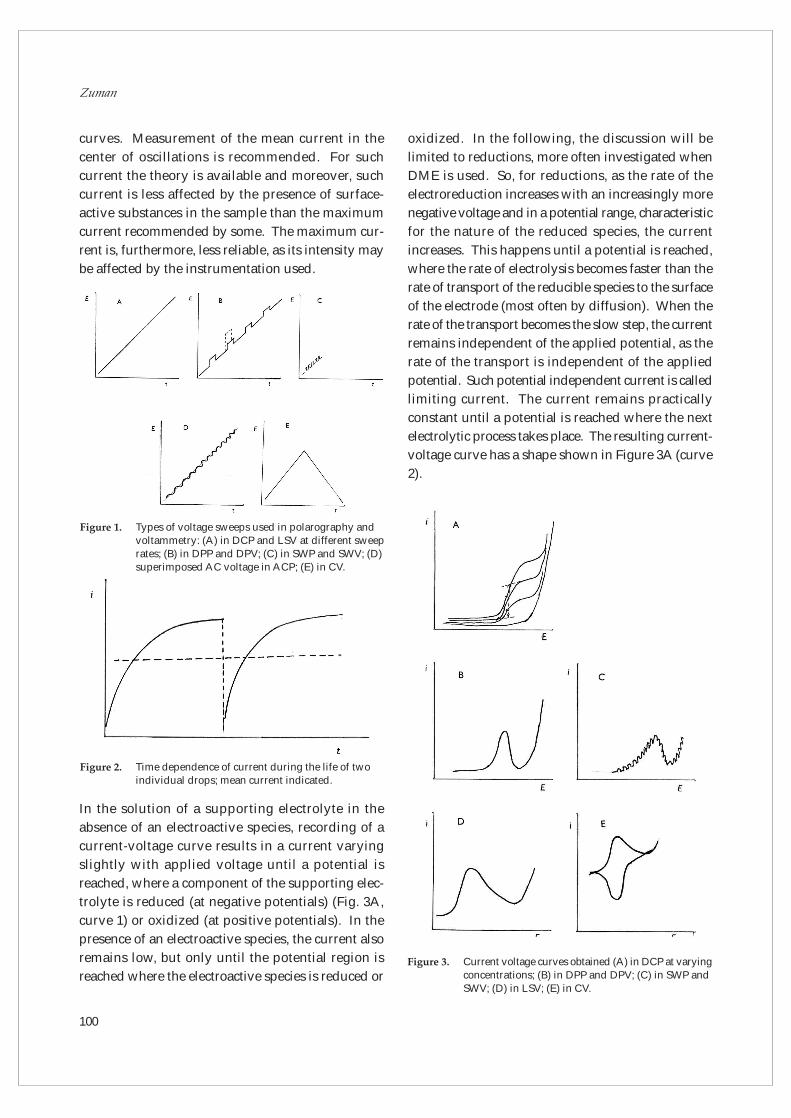
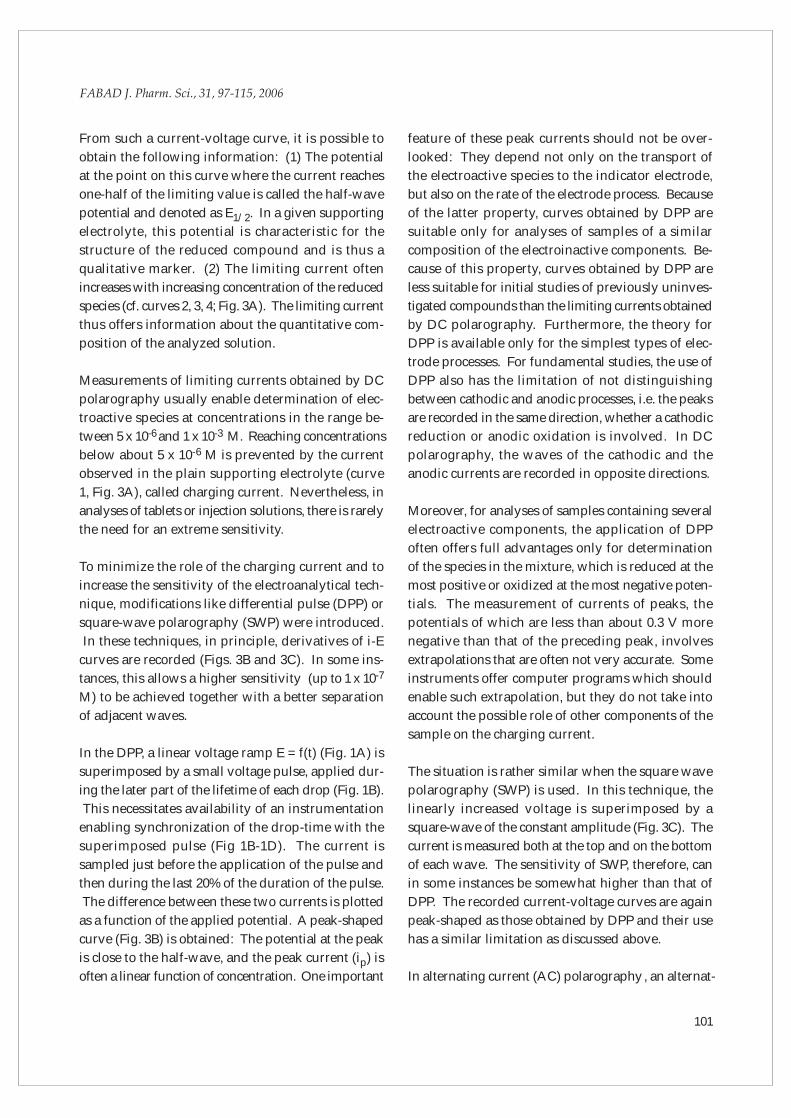
Figure 1. Types of voltage sweeps used in polarography and voltammetry: (A) in DCP and LSV at different sweep rates; (B) in DPP and DPV; (C) in SWP and SWV; (D) superimposed AC voltage in ACP; (E) in CV.
Figure 2. Time dependence of current during the life of two individual drops; mean current indicated.
Figure 3. Current voltage curves obtained (A) in DCP at varying concentrations; (B) in DPP and DPV; (C) in SWP and SWV; (D) in LSV; (E) in CV.
101
From such a current-voltage curve, it is possible to
obtain the following information: (1) The potential
at the point on this curve where the current reaches
one-half of the limiting value is called the half-wave
potential and denoted as E1/2. In a given supporting
electrolyte, this potential is characteristic for the
structure of the reduced compound and is thus a
qualitative marker. (2) The limiting current often
increases with increasing concentration of the reduced
species (cf. curves 2, 3, 4; Fig. 3A). The limiting current
thus offers information about the quantitative com-
position of the analyzed solution.
Measurements of limiting currents obtained by DC
polarography usually enable determination of elec-
troactive species at concentrations in the range be-
tween 5 x 10⁻⁶ and 1 x 10⁻³ M. Reaching concentrations
below about 5 x 10⁻⁶ M is prevented by the current
observed in the plain supporting electrolyte (curve
1, Fig. 3A), called charging current. Nevertheless, in
analyses of tablets or injection solutions, there is rarely
the need for an extreme sensitivity.
To minimize the role of the charging current and to
increase the sensitivity of the electroanalytical tech-
nique, modifications like differential pulse (DPP) or
square-wave polarography (SWP) were introduced.
In these techniques, in principle, derivatives of i-E
curves are recorded (Figs. 3B and 3C). In some ins-
tances, this allows a higher sensitivity (up to 1 x 10⁻⁷
M) to be achieved together with a better separation
of adjacent waves.
In the DPP, a linear voltage ramp E = f(t) (Fig. 1A) is
superimposed by a small voltage pulse, applied dur-
ing the later part of the lifetime of each drop (Fig. 1B).
This necessitates availability of an instrumentation
enabling synchronization of the drop-time with the
superimposed pulse (Fig 1B-1D). The current is
sampled just before the application of the pulse and
then during the last 20% of the duration of the pulse.
The difference between these two currents is plotted
as a function of the applied potential. A peak-shaped
curve (Fig. 3B) is obtained: The potential at the peak
is close to the half-wave, and the peak current (ip) is
often a linear function of concentration. One important
feature of these peak currents should not be over-
looked: They depend not only on the transport of
the electroactive species to the indicator electrode,
but also on the rate of the electrode process. Because
of the latter property, curves obtained by DPP are
suitable only for analyses of samples of a similar
composition of the electroinactive components. Be-
cause of this property, curves obtained by DPP are
less suitable for initial studies of previously uninves-
tigated compounds than the limiting currents obtained
by DC polarography. Furthermore, the theory for
DPP is available only for the simplest types of elec-
trode processes. For fundamental studies, the use of
DPP also has the limitation of not distinguishing
between cathodic and anodic processes, i.e. the peaks
are recorded in the same direction, whether a cathodic
reduction or anodic oxidation is involved. In DC
polarography, the waves of the cathodic and the
anodic currents are recorded in opposite directions.
Moreover, for analyses of samples containing several
electroactive components, the application of DPP
often offers full advantages only for determination
of the species in the mixture, which is reduced at the
most positive or oxidized at the most negative poten-
tials. The measurement of currents of peaks, the
potentials of which are less than about 0.3 V more
negative than that of the preceding peak, involves
extrapolations that are often not very accurate. Some
instruments offer computer programs which should
enable such extrapolation, but they do not take into
account the possible role of other components of the
sample on the charging current.
The situation is rather similar when the square wave
polarography (SWP) is used. In this technique, the
linearly increased voltage is superimposed by a
square-wave of the constant amplitude (Fig. 3C). The
current is measured both at the top and on the bottom
of each wave. The sensitivity of SWP, therefore, can
in some instances be somewhat higher than that of
DPP. The recorded current-voltage curves are again
peak-shaped as those obtained by DPP and their use
has a similar limitation as discussed above.
In alternating current (AC) polarography , an alternat-
FABAD J. Pharm. Sci., 31, 97-115, 2006
102
ing current of a small amplitude is superimposed
over the linearly increasing voltage (Fig. 3D). This
technique offers some useful information in basic
studies, in particular in processes complicated by
adsorption, but its application in practical analyses
is rare.
To summarize, among the variants of polarography,
using as indicator electrode the DME, DC polarogra-
phy and AC polarography are suitable to use in basic
studies. In practical analysis, the use of DC polarog-
raphy, mostly for reductions, is often sufficient and
most reliable. The DPP and SWP, which offer deriv-
atives of i-E curves, are recommended for use when
ill-separated waves are encountered or when extreme-
ly low concentrations are involved. They may be of
use in analyses of biological material, but are rarely
needed in analyses of tablets or injection solution.
To the second group belong techniques that use elec-
trodes in which the surfaces are not renewed. Fre-
quently used electrodes of this type include the hang-
ing mercury drop electrode (HMDE) and other
mercury electrodes that have a constant surface,
carbon electrodes (frequently used glass carbon elec-
trode) as well as gold electrodes. Complex processes
taking place at the surface of platinum electrodes
make them less suitable for analytical applications.
All techniques involving recording of current-voltage
curves obtained with electrodes with nonrenewed
surface are called voltammetry. Two main forms of
voltage scans are used - the linearly increasing voltage
(Fig. 1A) in linear sweep voltammetry (LSV) and the
triangular voltage scan (Fig. 1E) in cyclic voltammetry
(CV). The current-voltage curves in LSV are not
usually manifested by a sharp, symmetrical peak, but
have a shape where a sharp current increase is fol-
lowed by a slow current decrease (Fig. 3D). In CV,
the recorded curve has between the initial and reversal
potentials a shape similar to that observed in LSV,
but on the reversed sweep, the i-E curve may show
a current increasing in an opposite direction than
observed during the forward scan, as in Fig. 3E. The
techniques like differential pulse voltammetry (DPV)
or square wave voltammetry (SWV) use a voltage
change similar to that in DPP and SWP. As the re-
corded curves represent a derivative of the first, steep
part of the current-voltage plot, they may be in some
instances measured instead of the LSV or CV curves.
There are substantial differences between voltammet-
ric and polarographic methods, reflecting the differ-
ences between the two types and properties of elec-
trode used. The main difference reflects the nature
of the voltage change on the two types of electrodes
used. When DME is applied under the most frequent-
ly used conditions, the potential applied to the given
mercury drop varies only by 10-15 mV [and thus DC
polarography (further DCP) is practically a potentio-
static method]. When electrodes are used, the surfaces
of which are not renewed, the scan rate varies from
10 mV/s to several volts and the same electrode is
exposed to the whole investigated potential range.
In DCP, the limiting current measured is unaffected
by the scan-rate (V), while in LSV and CV the peak
currents usually strongly depend on V. Another
difference is the role played by the starting potential
(and reversal potential in CV). The choice of the
starting potential (provided that it sufficiently precedes
the potential range in which the electrolysis takes
place) does not affect the curves obtained by DCP.
On the other hand, the choice of the initial potential
(and of the reversal potential in CV) may considerably
affect the i-E curves in LSV and CV. In DCP, using a
good instrumentation, practically identical i-E curves
are obtained, if the recording is started at positive or
back from negative potentials. The direction of the
applied voltage scan can play a considerable role in
the shape of i-E curves obtained by LSV or CV. Finally,
the time elapsed between the moment at which the
electrode was immersed into the investigated solution
and the time at which the initial potential was applied,
which plays no role in DCP, can sometimes affect the
results in LSV or CV.
The above comparison indicates that particularly CV
may be an excellent technique in basic studies, par-
ticularly for studying processes that follow the electron
uptake and for investigation of reversibility of elec-
trochemical processes. It is thus an excellent research
tool. In some instances, a strong adsorption of organic
103
compound at the surface of HMDE enables a transfer
of a species adsorbed at the electrode surface in one
solution into another solution, where the properties
of the adsorbed species can be better investigated.
In practical applications, nevertheless, for example
in pharmaceutical analyses, the LSV and CV tech-
niques are used in cases in which polarographic
procedures cannot be used. It is particularly in situ-
ations when solid electrodes must be used, as in
electrochemical detectors in chromatography or in
following processes in living organisms, as for expels
of studying variation of dopamine levels in the brain.
Another area in which electrodes other than mercury
must be used is during investigation of processes of
potential more positive than about +0.3 V. This is
due to an oxidation of mercury, which in most solu-
tions takes place at +-.3 V to 0.4 V.
At potentials more positive than about +0.3 V, it is
possible to follow reductions of some easily reduced
species, but it is in particular a region where numerous
oxidations take place. Various forms of carbon elec-
trodes proved particularly useful for following nu-
merous oxidation processes.
The users of solid electrodes should be aware of some
differences affecting their applications when compared
with mercury electrodes. In general, the reproduc-
ibility of results obtained with solid electrodes is
generally worse than that which can be achieved
when mercury electrodes are used. This reflects
differences in the definition of the surface area of the
electrode and its cleanliness. There is no problem in
obtaining sufficiently clean mercury. Its surface is
always well defined and in most instances does not
change in the course of electrolysis. On the other
hand, the definition of the surface of solid electrodes
almost always remains questionable. These electrodes
are never completely smooth and are often covered
by oxides, the composition and structure of which
are usually not known in sufficient detail. To achieve
the highest possible reproducibility of results, both
mechanical and electrochemical cleaning have to be
attempted before each experiment. The mechanical
cleaning is based on handling the electrode surface
with Emory papers of varying particle size, more
frequently by rubbing the electrode against a firm
surface, covered by a slurry containing small hard
particles (such as various size of alumina particles,
silicon carbides or even diamond powder), followed
by a final polishing with cloth or leather. The most
effective cleaning can be achieved with carbon paste
electrodes located in hollow Teflon tubing. Slicing
off a thin layer of the carbon paste and of the encasing
Teflon tubing after each experiment results in a fresh
surface. Electrochemical cleaning consists of exposure
to extremely positive or/and extremely negative
potentials, which can be repeated.
A good measure of the cleanliness of the surface of
the solid electrode used is the width of the potential
window over which the given electrode can be used.
This is usually tested in the pure supporting electro-
lyte. It should be kept in mind, however, that the
surface area of the well-cleaned and best-polished
solid electrode is almost always defined only to a
limited degree.
Solutions used
Even though a whole area of electrochemistry deals
with oxidation and reduction reactions in nonaqueous,
in particular aprotic, solvents and another area deals
with electrochemistry in molten salts, such media are
rarely used in practical applications in pharmaceutical
analysis. The majority of reported analytical proce-
dures have been carried out in either aqueous solu-
tions or in mixtures of water with miscible organic
solvents. The organic components in such mixtures
serve to increase the solubility of the studied organic
compounds. Alcohols, frequently used as co-solvents,
are economical and available in high purity, but in
their application it is necessary to keep in mind that
they can also act as nucleophiles. Widely used mix-
tures of water and acetonitrile offer the additional
advantage of the possibility of a parallel investigation
in UV-vis spectra. These combinations offer the
opportunity to follow in more detail some equilibria
and kinetics. Such combination of the use of comple-
mentary techniques is limited to wavelength longer
than about 270 nm, when dimethylformamide or
dimethylsulfoxide is used as a co-solvent. These two
FABAD J. Pharm. Sci., 31, 97-115, 2006
104
solvents sometimes increase the solubility of slightly
soluble organic compounds better than even acetoni-
trile and offer useful electrochemical applications.
Tetrahydrofuran and 1,4-dioxane also have excellent
solubilizing properties, but show a tendency to form
peroxides and often have to be distilled just before
use.
A variety of supporting electrolytes can be used in
determination of organic compounds. These are
usually buffers or solutions of strong acids or strong
bases. Tetraalkylammonium salts are used only for
reductions at extremely negative potentials. It is
essential that the concentration of the strong acid or
the strong base or of the minor buffer component is
kept at least 20 times higher than the concentration
of the electroactive species.
The supporting electrolytes have several functions in
electroanalytical methods: (a) They decrease the
resistance of the investigated solution; (b) they prevent
migration of charged, investigated particles in the
electrical field in the electrolytic cell; (c) by using
buffers or solutions of strong acids or bases at a
sufficiently high concentration mentioned above, they
assure that no change in pH takes place in the vicinity
during the electrochemical experiment; (d) they
convert the species undergoing reduction into the
more easily reducible acid form or they convert an
oxidized species into a more easily oxidizable conju-
gate base; and (e) in some instances, components of
the supporting electrolyte enable formation of elec-
troactive ion pairs or complexes.
Among solutions of strong acids, perchloric, sulfuric
and hydrochloric are the most frequently used (nitric
acid has in some instances complicating nitrating and
oxidizing properties). Sodium and potassium hydrox-
ides are the bases most frequently used - calcium
hydroxide for effects of divalent cation, and lithium
hydroxide for smaller extension of potential range.
Even more negative potentials can be reached by
using tetraalkylammonium hydroxides, but their
purity may cause problems.
All buffers are used for the pH-range given by the
pKa ± 1 of the buffer acid to assure a sufficient buffer
capacity. Apart from their use in preliminary studies,
use of universal or mixed buffers, like the Britton-
Robinson buffer, is not recommended. In this univer-
sal buffer, phosphoric, acetic and boric acids are
simultaneously present. The complex forming boric
acid can participate in chemical reaction even in pH-
ranges controlled by other buffer components. In
addition to complex formation, the currents are some-
times affected by protonations not only by hydrogen
ions, but also by acid buffer components. To detect,
follow and interpret such reactions, it is necessary at
a given pH to follow the effect of concentration of a
buffer on i-E curves. Such an approach is not possible
in universal or mixed buffers.
The most commonly used buffers are acetate (pH 3.7
to 5.7), phosphate (pH 2 to 3.5, 5.8 to 7.8 and 10.5 to
12.0) and borate (pH 8.3-10.3). As alternative to the
complex-forming (with 1,2-diols, α-hydroxy and
amino ketones, etc.), borate buffers compared of
ammonia and an ammonium salt can sometimes be
used, but the possible reactivity of NH3 as a nucleo-
phile should be kept in mind. Buffers like TRIS or
TEA can sometimes be used. The use of 4-
hydroxyphenylsulfonate, which covers a similar range
as borate and ammonia buffers, has sometimes proven
advantageous. The use of modern buffers like HEPES,
CAPS, BICINE, and PIPES, etc. manifested compli-
cating behavior in some instances.
Ultimately, the choice of a supporting electrolyte is
made such that the investigated compound is stable
for at least 30 min and yields a well-developed wave
separated from waves of other components present
in the sample and well-separated from the current of
the supporting electrolyte. This, together with the
range of potentials in which the electrolysis occurs,
is a goal of the preliminary studies leading to the
development of an electroanalytical procedure.
Preliminary investigation of the course of the elec-
trolytic process
In any analytical method used, at least the principles
of the physical and chemical processes involved
105
should be understood. This condition applies in full
extent to electroanalytical methods. When encoun-
tering the need for development of an electroanalytical
procedure for a determination of a chosen compound,
two alternatives exist: Either the compound itself or
a structurally closely related compound has already
been studied or not.
If the investigated compound or a similar one has
been studied before, just a checking of the behavior
of such compound at several pH-values is needed.
If an agreement or a strong similarity is found and
the interpretation of the electrochemical and chemical
steps involved seems logical and proven, it is possible
to propose the optimum conditions for the analytical
application. In practice, this means the choice of the
most suitable supporting electrolyte and potential
range.
If, however, no reliable information for the compound
to be investigated can be found in the literature nor
a description of the electrochemical behavior of struc-
turally related compounds, some preliminary exper-
iments are needed.
The electron transfers involving the majority of the
organic compounds are frequently accompanied by
a proton transfer. The latter can occur either before
or following the electron transfer. For any organic
reduction or oxidation process, it is essential to un-
derstand the sequences of electron and proton trans-
fers. To achieve this goal, the following questions are
often asked: (a) In which pH range does the investi-
gated compound yield one or more cathodic reduction
or anodic oxidation waves? (b) Is the current not
time-dependent? If the waves change with time, in
which pH-range does it occur and how fast is it? If
time-dependence is observed, extrapolation of the
measured current to time zero is needed. Acidic and
basic regions are more prone to changes with time
due to acid or base catalyzed hydrolysis. (c) Next,
following the time-independent waves (or wave ex-
trapolated to t = 0), between which pH values is there
a substantial change in wave heights or in the number
of waves observed?
Typically, their preliminary investigation is carried
out in 0.1 M perchloric or sulfuric acid, acetate buffer
pH 4.7, phosphate buffer pH 6.8, borate buffer pH
9.3 and 0.1 M NaOH. A more detailed pH dependence
is then carried out in the pH ranges where substantial
changes in the number of waves, the height and/or
shape of waves are observed. Plots of currents (ilim or ip) and potentials (E1/2 or Ep) as a function of pH
indicate the pH ranges in which largest changes in
currents and potentials occur. If necessary, more
experimental data in these pH ranges are obtained.
These plots should make it possible to discern the
sequence of electron and proton transfers.
Based on the investigation of the pH dependence, a
pH range is chosen in which the current is indepen-
dent of pH and is diffusion controlled (see below).
In this pH range, it is possible to estimate the number
of electrons transferred in the process of reduction or
oxidation. This goal can be achieved in a simple and
rapid way, when DC polarography is used. Polaro-
graphic limiting currents controlled by diffusion (see
below) are, at a given concentration of the electroactive
species, recorded with the same DME, and are directly
proportional to the number of transferred electrons
(n). Thus, to determine the value of “n” for an un-
known compound, its diffusion currents are compared
with diffusion currents of equimolar solutions of 2-
4 model compounds, for which the values of "n" are
known. The ratio of limiting currents then enables
determination of "n" of the unknown. As models,
compounds of a similar molecular weight are pre-
ferred, as they will have a similar diffusion coefficient
as the investigated compound. As the diffusion
current depends on square root of the diffusion coef-
ficient (D1/2), the uncertainty of the value of D is
usually reflected by a variation of less than 15% of
“n”. As at this stage the integer values of "n" are of
interest, such uncertainty is of limited importance.
Such a simple approach cannot be applied when
techniques like DPP, SWP, LSV, CV, DPV or SWV are
used. The peak currents obtained by these techniques
depend, namely, not only on C, D and conditions like
V, but also on the rate of the electrode process with
rate constant ke. When these techniques are used,
FABAD J. Pharm. Sci., 31, 97-115, 2006
106
the value of the ke must be estimated first before the
value of "n" is to be determined.
Another question that may be asked about the elec-
trochemical behavior of a previously uninvestigated
compound is the reversibility of the electrode process.
Reversibility has in analytical applications only
indirect importance in affecting sensitivity of differ-
ential and square-wave techniques and is of greater
interest in fundamental and electrosynthetic studies.
It will be discussed here only briefly. In DC polarog-
raphy, the theoretical shape of i-E curves was once
considered a source of information about reversibility,
but it has been proven that numerous types of irre-
versible processes yield i-E curves with shapes similar
to those of reversible ones. Hence, in DC polarogra-
phy, the essential proof of reversibility is the equality
of half-wave potentials of the oxidized and the reduced
form. When one of these forms is not available, it
can be prepared in situ, e.g., a reduced form by a
catalytic reduction by atomic hydrogen generated in
the presence of a palladium catalyst.
Simpler proof of reversibility can be obtained based
on CV curves, like the one in Figure 3E. A reversible
system is manifested by the presence of two peaks,
one cathodic and one - in the opposite direction -
anodic. For reversible systems, the difference between
the two peak potentials should be 0.059/n volts and
the peak cathodic current should be equal to the peak
anodic current.
The majority of both currents and of potentials of
reductions and oxidations of organic compounds
depend on pH and composition of the supporting
electrolyte. This is due to the fact that transfers of
electrons are in protic solvents (such as aqueous or
water-containing solutions) accompanied by a transfer
of protons. These proton transfers can take place
either before or after electron transfers, in some cases
between two electron transfers.
To obtain information about such acid-base equilibria
and the sequences of electron and proton transfers,
it is useful to investigate the variations in both currents
and potentials of the previously uninvestigated com-
pound on pH. Based mostly on information obtained
by DC polarography, some common types of pH-
dependences are given here using the following sym-
bols: Kai for i-th dissociation constant at equilibrium;
Ki’ refers to the pH at which i = id/2.
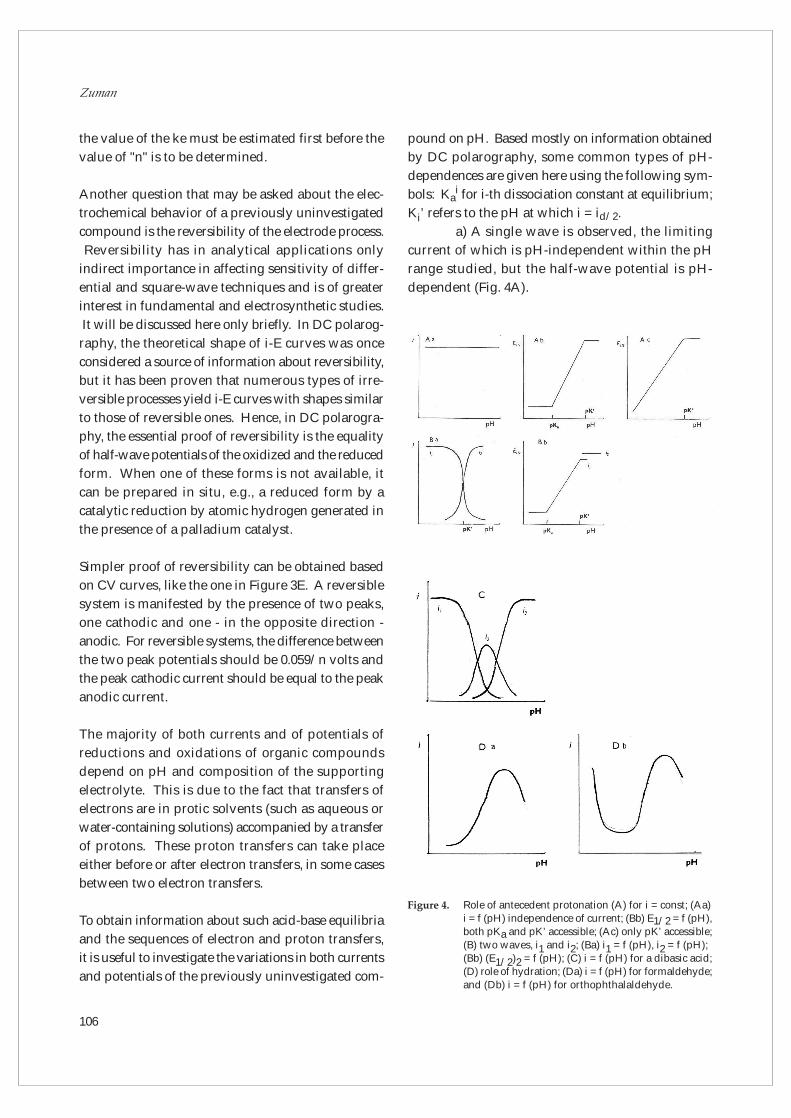
a) A single wave is observed, the limiting
current of which is pH-independent within the pH
range studied, but the half-wave potential is pH-
dependent (Fig. 4A).
Figure 4. Role of antecedent protonation (A) for i = const; (Aa) i = f (pH) independence of current; (Bb) E1/2 = f (pH), both pKa and pK’ accessible; (Ac) only pK’ accessible; (B) two waves, i1 and i2; (Ba) i1 = f (pH), i2 = f (pH); (Bb) (E1/2)2 = f (pH); (C) i = f (pH) for a dibasic acid; (D) role of hydration; (Da) i = f (pH) for formaldehyde; and (Db) i = f (pH) for orthophthalaldehyde.
107
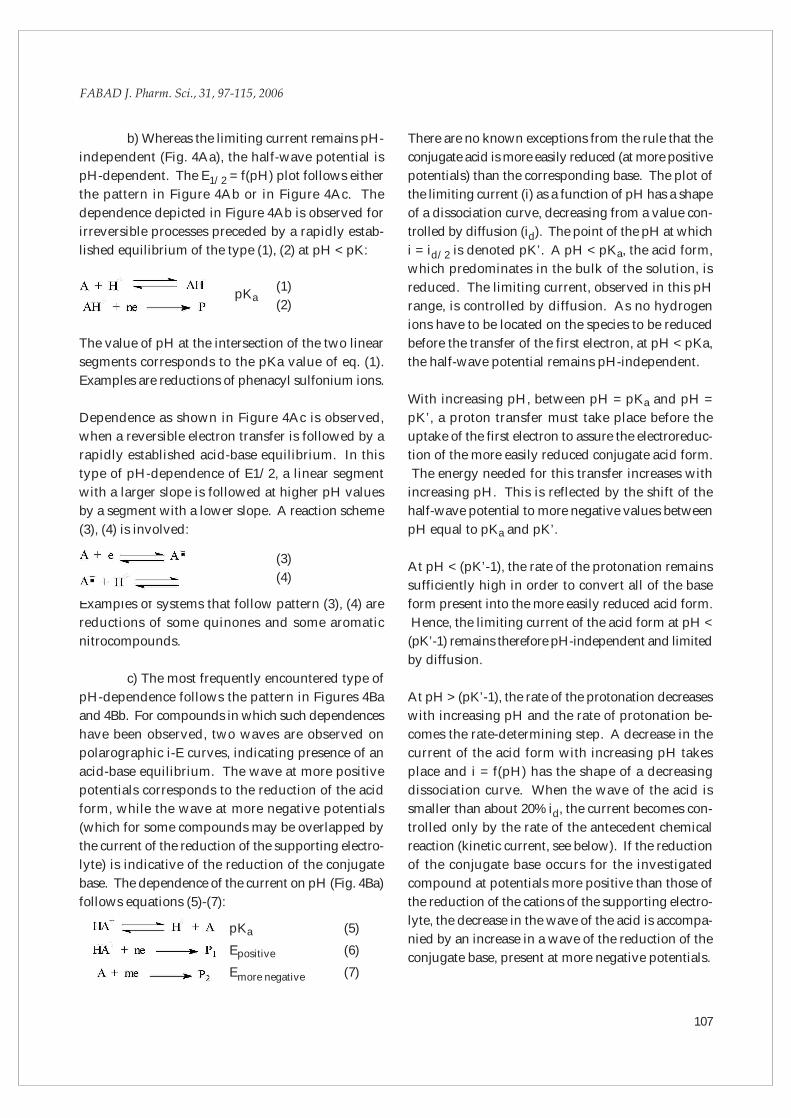
b) Whereas the limiting current remains pH-
independent (Fig. 4Aa), the half-wave potential is
pH-dependent. The E1/2 = f(pH) plot follows either
the pattern in Figure 4Ab or in Figure 4Ac. The
dependence depicted in Figure 4Ab is observed for
irreversible processes preceded by a rapidly estab-
lished equilibrium of the type (1), (2) at pH < pK:
The value of pH at the intersection of the two linear
segments corresponds to the pKa value of eq. (1).
Examples are reductions of phenacyl sulfonium ions.
Dependence as shown in Figure 4Ac is observed,
when a reversible electron transfer is followed by a
rapidly established acid-base equilibrium. In this
type of pH-dependence of E1/2, a linear segment
with a larger slope is followed at higher pH values
by a segment with a lower slope. A reaction scheme
(3), (4) is involved:
Examples of systems that follow pattern (3), (4) are
reductions of some quinones and some aromatic
nitrocompounds.
c) The most frequently encountered type of
pH-dependence follows the pattern in Figures 4Ba
and 4Bb. For compounds in which such dependences
have been observed, two waves are observed on
polarographic i-E curves, indicating presence of an
acid-base equilibrium. The wave at more positive
potentials corresponds to the reduction of the acid
form, while the wave at more negative potentials
(which for some compounds may be overlapped by
the current of the reduction of the supporting electro-
lyte) is indicative of the reduction of the conjugate
base. The dependence of the current on pH (Fig. 4Ba)
follows equations (5)-(7):
There are no known exceptions from the rule that the
conjugate acid is more easily reduced (at more positive
potentials) than the corresponding base. The plot of
the limiting current (i) as a function of pH has a shape
of a dissociation curve, decreasing from a value con-
trolled by diffusion (id). The point of the pH at which
i = id/2 is denoted pK’. A pH < pKa, the acid form,
which predominates in the bulk of the solution, is
reduced. The limiting current, observed in this pH
range, is controlled by diffusion. As no hydrogen
ions have to be located on the species to be reduced
before the transfer of the first electron, at pH < pKa,
the half-wave potential remains pH-independent.
With increasing pH, between pH = pKa and pH =
pK’, a proton transfer must take place before the
uptake of the first electron to assure the electroreduc-
tion of the more easily reduced conjugate acid form.
The energy needed for this transfer increases with
increasing pH. This is reflected by the shift of the
half-wave potential to more negative values between
pH equal to pKa and pK’.
At pH < (pK’-1), the rate of the protonation remains
sufficiently high in order to convert all of the base
form present into the more easily reduced acid form.
Hence, the limiting current of the acid form at pH <
(pK’-1) remains therefore pH-independent and limited
by diffusion.
At pH > (pK’-1), the rate of the protonation decreases
with increasing pH and the rate of protonation be-
comes the rate-determining step. A decrease in the
current of the acid form with increasing pH takes
place and i = f(pH) has the shape of a decreasing
dissociation curve. When the wave of the acid is
smaller than about 20% id, the current becomes con-
trolled only by the rate of the antecedent chemical
reaction (kinetic current, see below). If the reduction
of the conjugate base occurs for the investigated
compound at potentials more positive than those of
the reduction of the cations of the supporting electro-
lyte, the decrease in the wave of the acid is accompa-
nied by an increase in a wave of the reduction of the
conjugate base, present at more negative potentials.
FABAD J. Pharm. Sci., 31, 97-115, 2006
pKa(1)
(2)
(3)
(4)
pKa (5)
Epositive (6)
Emore negative (7)
108
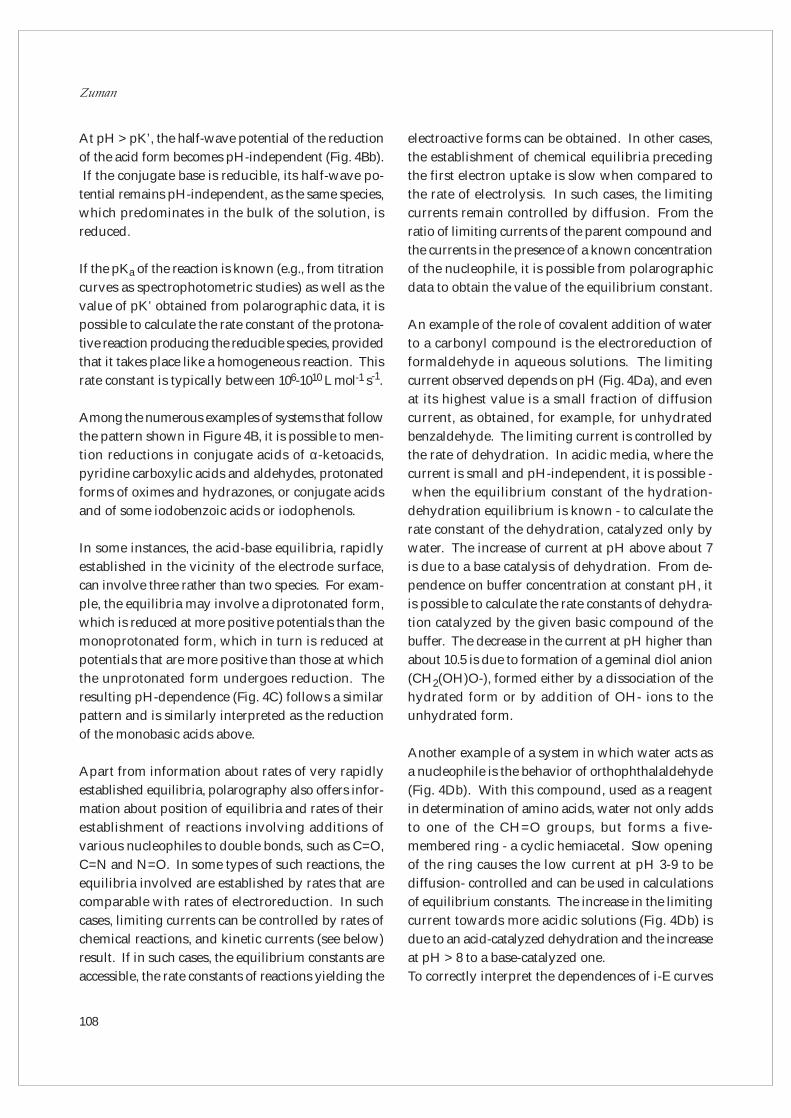
At pH > pK’, the half-wave potential of the reduction
of the acid form becomes pH-independent (Fig. 4Bb).
If the conjugate base is reducible, its half-wave po-
tential remains pH-independent, as the same species,
which predominates in the bulk of the solution, is
reduced.
If the pKa of the reaction is known (e.g., from titration
curves as spectrophotometric studies) as well as the
value of pK’ obtained from polarographic data, it is
possible to calculate the rate constant of the protona-
tive reaction producing the reducible species, provided
that it takes place like a homogeneous reaction. This
rate constant is typically between 106-1010 L mol-1 s-1.
Among the numerous examples of systems that follow
the pattern shown in Figure 4B, it is possible to men-
tion reductions in conjugate acids of α-ketoacids,
pyridine carboxylic acids and aldehydes, protonated
forms of oximes and hydrazones, or conjugate acids
and of some iodobenzoic acids or iodophenols.
In some instances, the acid-base equilibria, rapidly
established in the vicinity of the electrode surface,
can involve three rather than two species. For exam-
ple, the equilibria may involve a diprotonated form,
which is reduced at more positive potentials than the
monoprotonated form, which in turn is reduced at
potentials that are more positive than those at which
the unprotonated form undergoes reduction. The
resulting pH-dependence (Fig. 4C) follows a similar
pattern and is similarly interpreted as the reduction
of the monobasic acids above.
Apart from information about rates of very rapidly
established equilibria, polarography also offers infor-
mation about position of equilibria and rates of their
establishment of reactions involving additions of
various nucleophiles to double bonds, such as C=O,
C=N and N=O. In some types of such reactions, the
equilibria involved are established by rates that are
comparable with rates of electroreduction. In such
cases, limiting currents can be controlled by rates of
chemical reactions, and kinetic currents (see below)
result. If in such cases, the equilibrium constants are
accessible, the rate constants of reactions yielding the
electroactive forms can be obtained. In other cases,
the establishment of chemical equilibria preceding
the first electron uptake is slow when compared to
the rate of electrolysis. In such cases, the limiting
currents remain controlled by diffusion. From the
ratio of limiting currents of the parent compound and
the currents in the presence of a known concentration
of the nucleophile, it is possible from polarographic
data to obtain the value of the equilibrium constant.
An example of the role of covalent addition of water
to a carbonyl compound is the electroreduction of
formaldehyde in aqueous solutions. The limiting
current observed depends on pH (Fig. 4Da), and even
at its highest value is a small fraction of diffusion
current, as obtained, for example, for unhydrated
benzaldehyde. The limiting current is controlled by
the rate of dehydration. In acidic media, where the
current is small and pH-independent, it is possible -
when the equilibrium constant of the hydration-
dehydration equilibrium is known - to calculate the
rate constant of the dehydration, catalyzed only by
water. The increase of current at pH above about 7
is due to a base catalysis of dehydration. From de-
pendence on buffer concentration at constant pH, it
is possible to calculate the rate constants of dehydra-
tion catalyzed by the given basic compound of the
buffer. The decrease in the current at pH higher than
about 10.5 is due to formation of a geminal diol anion
(CH2(OH)O-), formed either by a dissociation of the
hydrated form or by addition of OH- ions to the
unhydrated form.
Another example of a system in which water acts as
a nucleophile is the behavior of orthophthalaldehyde
(Fig. 4Db). With this compound, used as a reagent
in determination of amino acids, water not only adds
to one of the CH=O groups, but forms a five-
membered ring - a cyclic hemiacetal. Slow opening
of the ring causes the low current at pH 3-9 to be
diffusion- controlled and can be used in calculations
of equilibrium constants. The increase in the limiting
current towards more acidic solutions (Fig. 4Db) is
due to an acid-catalyzed dehydration and the increase
at pH > 8 to a base-catalyzed one.
To correctly interpret the dependences of i-E curves
109
on pH and in general to identify the process respon-
sible for the shape and behavior of i-E curves, it is
necessary to distinguish individual types of encoun-
tered currents. There are some polarographic currents
that are of lesser importance in practical applications,
but they must be recognized. An example is charging
currents, which are also observed in solutions that
do not contain any electroactive substances, only a
supporting electrolyte. Minimizing such currents is
important if species present in concentrations below
10-6 M are to be determined.
Sudden increases in current (due to a streaming of
the solution in the vicinity of the dropping electrode),
called maxima, sometimes interfere with measurement
of the limiting current. These can be eliminated by
addition of a low concentration (usually below 0.005%)
of a surface active substance, such as gelatin. In the
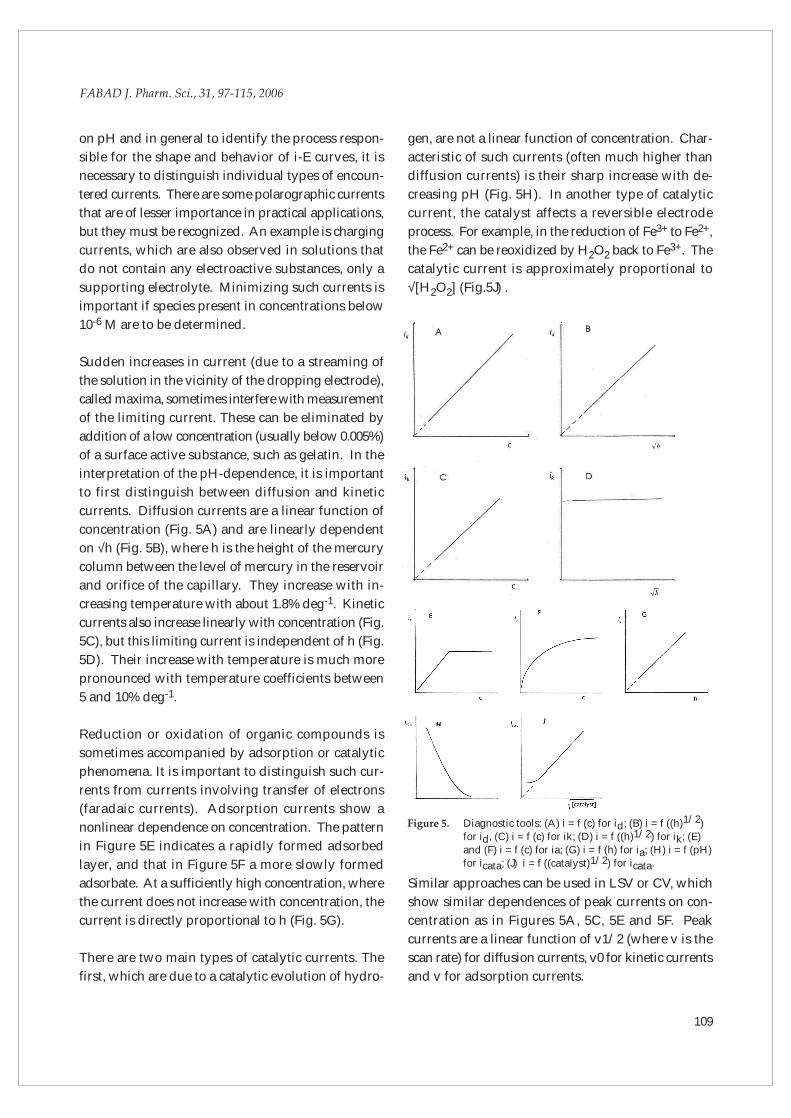
interpretation of the pH-dependence, it is important
to first distinguish between diffusion and kinetic
currents. Diffusion currents are a linear function of
concentration (Fig. 5A) and are linearly dependent
on √h (Fig. 5B), where h is the height of the mercury
column between the level of mercury in the reservoir
and orifice of the capillary. They increase with in-
creasing temperature with about 1.8% deg-1. Kinetic
currents also increase linearly with concentration (Fig.
5C), but this limiting current is independent of h (Fig.
5D). Their increase with temperature is much more
pronounced with temperature coefficients between
5 and 10% deg-1.
Reduction or oxidation of organic compounds is
sometimes accompanied by adsorption or catalytic
phenomena. It is important to distinguish such cur-
rents from currents involving transfer of electrons
(faradaic currents). Adsorption currents show a
nonlinear dependence on concentration. The pattern
in Figure 5E indicates a rapidly formed adsorbed
layer, and that in Figure 5F a more slowly formed
adsorbate. At a sufficiently high concentration, where
the current does not increase with concentration, the
current is directly proportional to h (Fig. 5G).
There are two main types of catalytic currents. The
first, which are due to a catalytic evolution of hydro-
gen, are not a linear function of concentration. Char-
acteristic of such currents (often much higher than
diffusion currents) is their sharp increase with de-
creasing pH (Fig. 5H). In another type of catalytic
current, the catalyst affects a reversible electrode
process. For example, in the reduction of Fe3+ to Fe2+,
the Fe2+ can be reoxidized by H2O2 back to Fe3+. The
catalytic current is approximately proportional to
√[H2O2] (Fig.5J) .
Similar approaches can be used in LSV or CV, which
show similar dependences of peak currents on con-
centration as in Figures 5A, 5C, 5E and 5F. Peak
currents are a linear function of v1/2 (where v is the
scan rate) for diffusion currents, v0 for kinetic currents
and v for adsorption currents.
FABAD J. Pharm. Sci., 31, 97-115, 2006
Figure 5. Diagnostic tools: (A) i = f (c) for id; (B) i = f ((h)1/2) for id, (C) i = f (c) for ik; (D) i = f ((h)1/2) for ik; (E) and (F) i = f (c) for ia; (G) i = f (h) for ia; (H) i = f (pH) for icata; (J) i = f ((catalyst)1/2) for icata.
110
Main electroactive groupings
Relatively the largest body of information useful for
analytical purposes is based on polarographic methods
in which the current-voltage curves are obtained
using a dropping mercury electrode (DME). Types
of chemical bonds that can be reduced using this
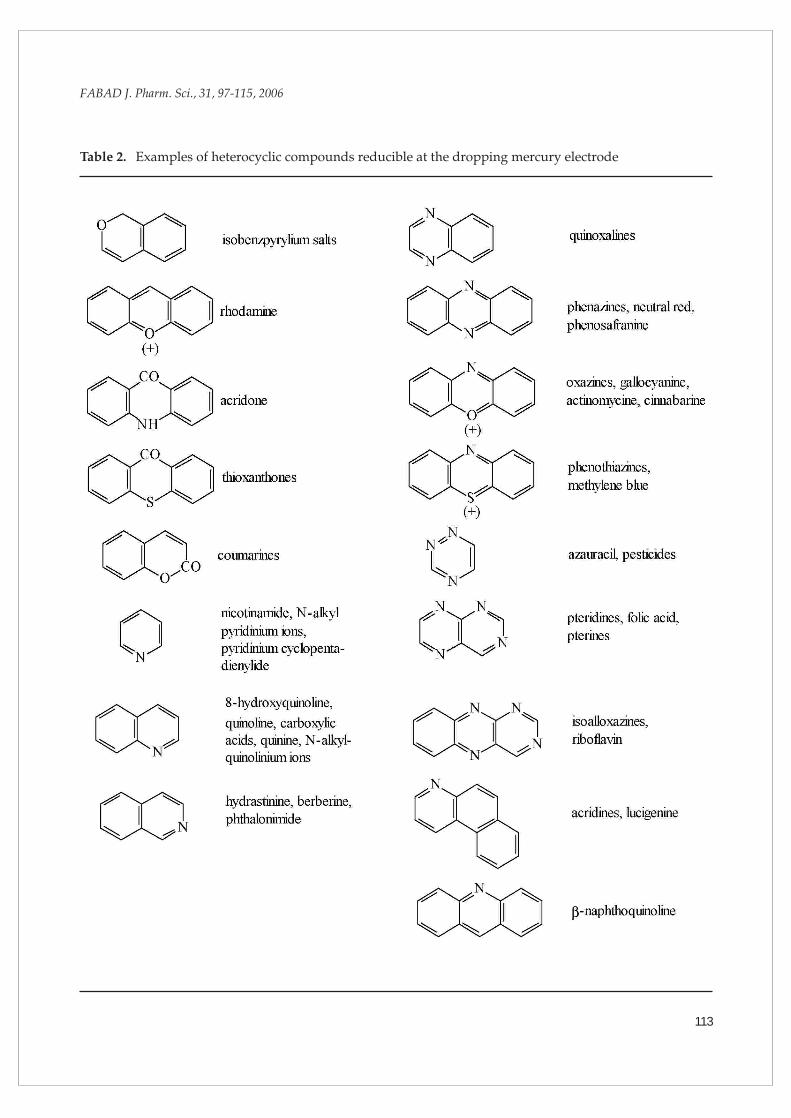
technique are listed in Table 1. Examples of reducible
heterocycles are given in Table 2. The use of DME
for oxidations, which often take place at positive
potentials, is limited to the most easily oxidized types
of compounds. This is due to the fact that in noncom-
plexing supporting electrolytes, mercury is dissolved
at about +0.3 V or +0.2 V. This prevents investigation
of oxidation of those organic compounds, which need
positive potentials of more than about +0.3 V for
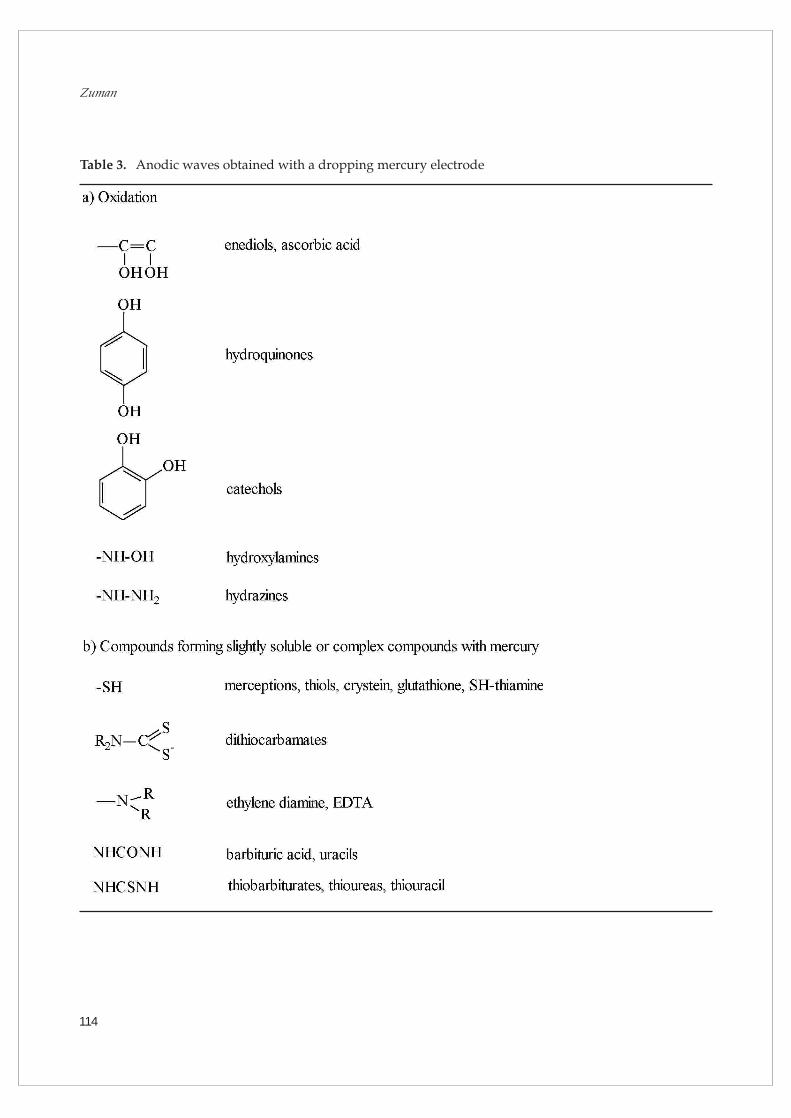
oxidation. On the other hand, anodic dissolution of
mercury offers another advantage: In the presence
of organic compounds, which form slightly soluble
or complex compounds in the presence of mercury
ions, anodic waves are also observed. Such waves,
at concentrations of ligand lower than what corre-
sponds to a complete coverage of electrode surface
by a monolayer, are also a linear function of concen-
tration and can be used for analytical purposes. Both
types of anodic waves, those that correspond to elec-
trooxidation and those due to mercury salt formation,
are listed in Table 3.
Anodic processes on solid electrodes depend on the
composition of the electrode used. All these electrodes
are less suitable for following reductions, as their
useful potential window is limited to considerably
less negative potential than when mercury electrodes
are used. Therefore, the number of reductions that
often take place at negative potentials is rather limited
on solid electrodes. On the other hand, the use of
such electrodes, in particular of carbon electrodes of
various kinds, offer extension of the potential window
to positive potentials and numerous oxidations. The
knowledge of types of species undergoing oxidations
on solid electrodes is more limited: They proved to
be particularly suitable for oxidations of phenols and
anilines, but also alcohols, aliphatic amines, aldehydes,
thiols, some hydrocarbons and carboxylic acids.
Survey of examples of applications in pharmaceu-
tical analysis
To indicate the broadness of types of applications of
electroanalytical techniques in practical analysis of
pharmaceutical preparations, a survey of only the
types of compounds that have been successfully
analyzed in the past is given here. For references, the
reader is directed to sources given at the end of this
contribution.
Alkaloids. Among investigated compounds belong
morphine and related compounds, codeine, atropine
and colchicines. Considerable attention has been paid
to determination of vitamins, particularly ascorbic
acid (vitamin C), vitamins of the B group (B1, B2, B6
and B12) and vitamin K. Anodic waves on glassy
carbon electrode can be used for determination of
vitamin A. Among steroids, the most attention has
been paid to α,β-unsaturated ketones, such as test-
osterone, progesterone, prednisone, prednisolone and
cortisone and some fluorinated steroids. Some atten-
tion has been paid to thyroid hormones, especially
the polyiodated ones. Considerable attention has
also been paid to various antibiotics, including
chloramphenicol, tetracyclines (such as aureomycin
or doxycycline), penicillins, and in particular cepha-
losporins, in which several kinds of electroactive
centers have been utilized. Among antiseptics and
antimicrobial agents, it is possible to list nitrofurans
and nitroimidazoles, organomercurials, hydrazides,
hydrazones and semicarbazones and sulfonamides,
and compounds like trimethoprim, nalidixic acid and
chlorhexidine. Examples of determined anesthetics
are barbiturates and thiobarbiturates and chloral, and
of analgesics are ketoprofen and indomethacin. 1,4-
Benzodiazepines and fluorinated aryl alkyl ketones,
such a fluanisone and haloperidol, represent psychop-
harmaca, which have been extensively studied.
Among antihistamines, attention has been paid to
phenothiazines, such as chlorpromazine, fluphena-
zine, and promazine. Easily reduced are organic
nitrates, such as nitroglycerine, isosorbide dinitrate
or nitranal. Among other cardiotonics and high blood
pressure regulators studied belong L-dopa and
dopamine, determined using their anodic waves.
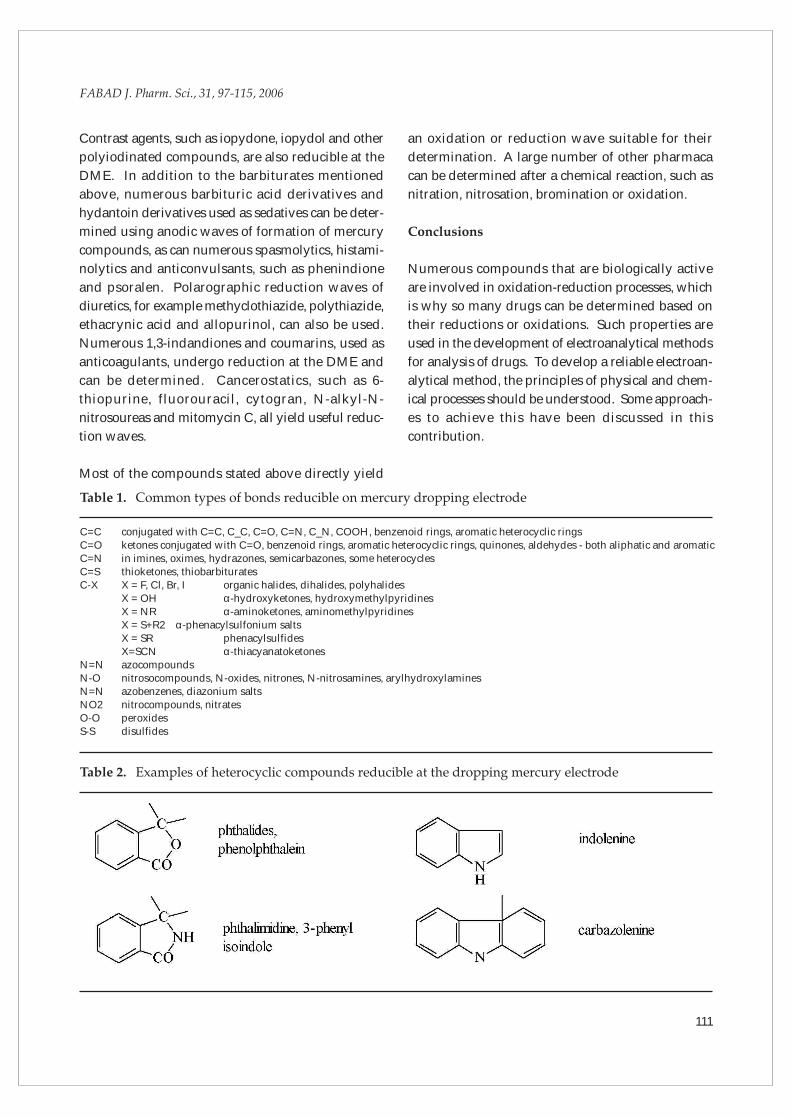
Table 1. Common types of bonds reducible on mercury dropping electrode
C=C conjugated with C=C, C_C, C=O, C=N, C_N, COOH, benzenoid rings, aromatic heterocyclic ringsC=O ketones conjugated with C=O, benzenoid rings, aromatic heterocyclic rings, quinones, aldehydes - both aliphatic and aromaticC=N in imines, oximes, hydrazones, semicarbazones, some heterocyclesC=S thioketones, thiobarbituratesC-X X = F, Cl, Br, I organic halides, dihalides, polyhalides
X = OH α-hydroxyketones, hydroxymethylpyridinesX = NR α-aminoketones, aminomethylpyridinesX = S+R2 α-phenacylsulfonium saltsX = SR phenacylsulfidesX=SCN α-thiacyanatoketones
N=N azocompoundsN-O nitrosocompounds, N-oxides, nitrones, N-nitrosamines, arylhydroxylaminesN=N azobenzenes, diazonium saltsNO2 nitrocompounds, nitratesO-O peroxidesS-S disulfides
111
Contrast agents, such as iopydone, iopydol and other
polyiodinated compounds, are also reducible at the
DME. In addition to the barbiturates mentioned
above, numerous barbituric acid derivatives and
hydantoin derivatives used as sedatives can be deter-
mined using anodic waves of formation of mercury
compounds, as can numerous spasmolytics, histami-
nolytics and anticonvulsants, such as phenindione
and psoralen. Polarographic reduction waves of
diuretics, for example methyclothiazide, polythiazide,
ethacrynic acid and allopurinol, can also be used.
Numerous 1,3-indandiones and coumarins, used as
anticoagulants, undergo reduction at the DME and
can be determined. Cancerostatics, such as 6-
thiopurine, fluorouracil, cytogran, N-alkyl-N-
nitrosoureas and mitomycin C, all yield useful reduc-
tion waves.
Most of the compounds stated above directly yield
an oxidation or reduction wave suitable for their
determination. A large number of other pharmaca
can be determined after a chemical reaction, such as
nitration, nitrosation, bromination or oxidation.
Conclusions
Numerous compounds that are biologically active
are involved in oxidation-reduction processes, which
is why so many drugs can be determined based on
their reductions or oxidations. Such properties are
used in the development of electroanalytical methods
for analysis of drugs. To develop a reliable electroan-
alytical method, the principles of physical and chem-
ical processes should be understood. Some approach-
es to achieve this have been discussed in this
contribution.
FABAD J. Pharm. Sci., 31, 97-115, 2006
Table 2. Examples of heterocyclic compounds reducible at the dropping mercury electrode
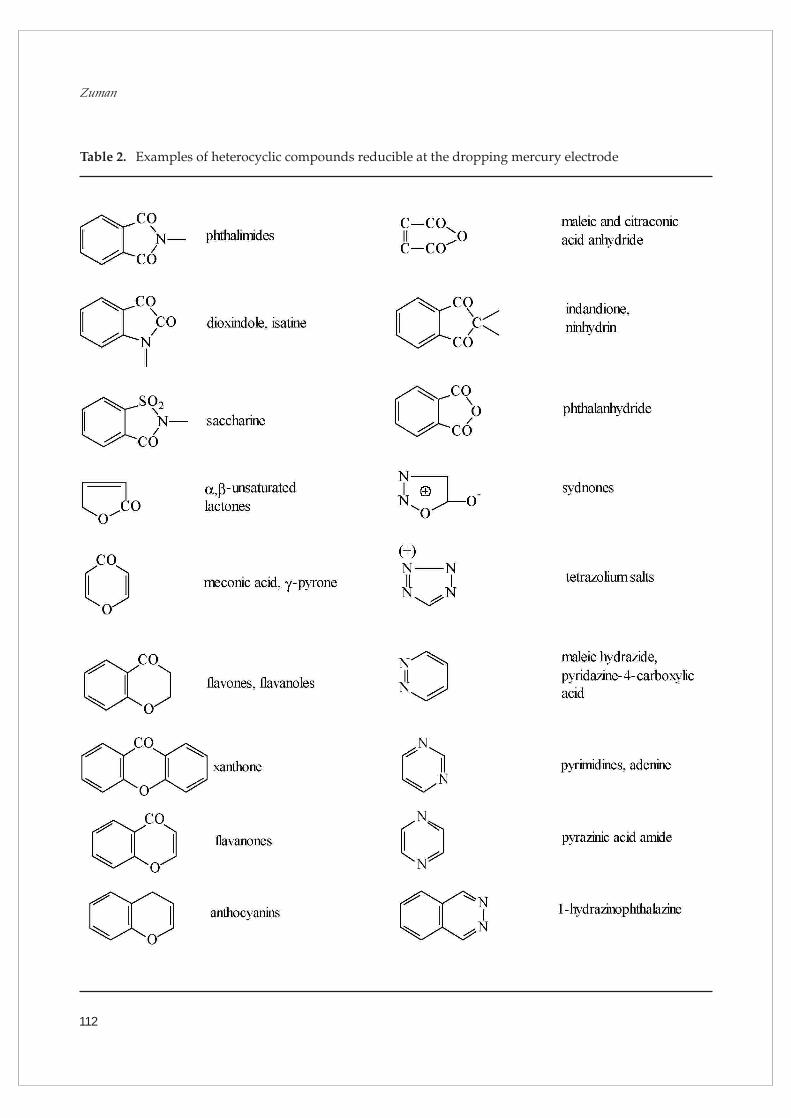
Table 2. Examples of heterocyclic compounds reducible at the dropping mercury electrode
112
113
FABAD J. Pharm. Sci., 31, 97-115, 2006
Table 2. Examples of heterocyclic compounds reducible at the dropping mercury electrode
114
Table 3. Anodic waves obtained with a dropping mercury electrode
115
FABAD J. Pharm. Sci., 31, 97-115, 2006
REFERENCES
B ezina M, Zuman P. Polarography in Medicine,
Biochemistry and Pharmacy, Interscience, New
York, 1958.
Zuman P. Organic Polarographic Analysis, Per-
gamon, London, 1964.
Zuman P. The Elucidation or Organic Electrode
Processes, Academic Press, New York, 1969.
Meites L, Zuman P and others. Handbook Series
in Organic Electrochemistry, Vols. I and II (1977),
CRC Press, Cleveland, Ohio; Vol. III (1978), CRC
Press, West Palm Beach, Florida; Vol. IV (1980),
Vol. V (1982), Vol. VI (1983), CRC Press, Boca
Raton, Florida.
Adams GE, Breccia A, Fielden EM, Wardman P
(eds.). Selective Activation of Drugs by Redox
Processes, NATO ASI Series A, Life Sciences, Vol.
198, Plenum Press, New York and London, 1990.
Dryhurst G. Electrochemistry of Biological Mol-
ecules, Academic Press, New York, 1977.
Smyth WF, (ed.). Polarography of Molecule of
Biological Significance, Academic Press, London,
1979.
Patriarche GJ, Chateau-Gosselin M, Vandenbalck
JL, Zuman P. Polarography and Related Elec-
troanalytical Techniques in Pharmacy and Phar-
macology, Electroanal. Chem. (Bard AJ, ed.), Vol.
II, 1979, 141-289.
Siegerman H. Polarography of Antibiotics and
Antibacterial Agents, Electroanal. Chem. (Bard
AJ, ed.), Vol. II, 1979, 291-343.
1.
2.
3.
4.
5.
6.
7.
8.
9.