Principles for Increasing the Accessibility and ... for... · Principles for Increasing the...
32
Principles for Increasing the Accessibility and Transparency of Power System Planning January 2017
Transcript of Principles for Increasing the Accessibility and ... for... · Principles for Increasing the...
Principles for Increasing the Accessibility and Transparency of Power System Planning
January 2017

ii
ACKNOWLEDGEMENTS
The U.S. Department of Energy’s Office of Energy Policy and Systems Analysis (DOE-EPSA) produced this report with the
cooperation and support of three DOE National Laboratories, including the National Renewable Energy Laboratory, the
Oakridge National Laboratory, and the Pacific Northwest National Laboratory. Within DOE, David Rosner led report
development with support from Carol Battershell, Aaron Bergman, Alex Breckel, Colin Cunliff, Carla Frisch, and Judi
Greenwald. Substantial input was provided by Aaron Boom, Bethany Frew, and Scott Gossett of the National Renewable
Energy Laboratory, Stanton Hadley and Alfonso Tarditi of the Oakridge National Laboratory, and Michael Kintner-Meyer
and Mike Hoffman of the Pacific Northwest National Laboratory. We would like to thank the technical reviewers who
provided helpful comments on the document. These reviewers helped to make this report as technically sound as possible;
however, any remaining errors or omissions are those of the authors.
This report was prepared as an account of work sponsored by an agency of the United States Government. Neither the
United States Government nor any agency thereof, nor any of their employees, makes any warranty, express or implied, or
assumes any legal liability or responsibility for the accuracy, completeness, or usefulness of any information, apparatus,
product, or process disclosed, or represents that its use would not infringe privately owned rights. Reference therein to
any specific commercial product, process, or service by trade name, trademark, manufacturer, or otherwise does not
necessarily constitute or imply its endorsement, recommendation, or favoring by the United States Government or any
agency thereof. The views of the authors do not necessarily reflect those of the United States Government or any agency
thereof.
iii
Principles for Increasing the Accessibility and
Transparency of Power System Planning
Table of Contents
Introduction ................................................................................................................................................................................ 1
Planning for Reliability: Traditional and Emerging Approaches ............................................................................................. 2
Principle 1: Conduct Open Planning Processes .......................................................................................................................... 6
Applying Principle 1: Western Electricity Coordinating Council Benefits from Open Planning Process ................................ 7
Principle 2: Formulate Relevant Reliability Questions to Guide Scenario Planning ................................................................... 8
Applying Principle 2: Formulate Relevant Reliability Questions............................................................................................. 8
Principle 3: Understand and Leverage Vetted Resources ........................................................................................................ 11
Modeling Tools ..................................................................................................................................................................... 11
Data ...................................................................................................................................................................................... 13
Pulling It Together: Scenario Analysis ................................................................................................................................... 15
Scenarios for Modeling Resource Adequacy ........................................................................................................................ 16
Scenarios for Modeling Production Cost .............................................................................................................................. 17
Scenarios for Modeling Power Flow and Transient Stability ................................................................................................ 18
Energy Systems Integration: Accounting for Evolving Factors ............................................................................................. 19
Applying Principle 3: California Harnesses New Modeling Techniques to Integrate Distributed Energy Resources ........... 20
Applying Principle 3: MISO begins to Coordinate Electricity Generation and Natural Gas Deliveries ................................. 20
Appendix A: Data Sources ......................................................................................................................................................... 22
Endnotes ................................................................................................................................................................................... 26
1
Principles for Increasing the Accessibility and
Transparency of Power System Planning
INTRODUCTION
Providing reliable electricity to end users depends on the coordinated analysis of numerous long-term and short-term
planning objectives. As the demand for electricity that is reliable, affordable, sustainable, and resilient continues to grow,a
new and more sophisticated tools, practices, and analytical methods are being developed to economically and reliably plan
and operate the power systems of the future.
This paper provides energy system regulators, environmental regulators, and power system operators with a common set
of concepts, resources, and questions intended to facilitate dialog, increase consistency, transparency, understanding, and,
ultimately, power system reliability. To accomplish these goals, this paper defines three principles for planning:
1. Conduct open planning processes 2. Formulate relevant reliability questions to guide scenario
planning 3. Understand and leverage vetted resources.
These principles are intended to inform stakeholders new to the
power system planning process, while also providing utility to the
experienced practitioners and planners by providing information about
common practices, publically available resources of data, and
methodologies that are vetted and internally consistent when data
from a real-world power system are not available to inform the
planning process. In addition, this paper shows how these principles
can be applied in scenario planning.
Power system reliability planning, consistent with North American
Electric Reliability Corporation (NERC) reliability standards, addresses
only the bulk power system, and has been focused on identifying
elements of the transmission system that do not meet performance
requirements over the planning period. A part of the transmission
system planning process is to propose corrective plans in
circumstances when performance is not achieved, which can include
new transmission lines, system upgrades, or other solutions that
would enable the transmission system to reliably transfer the electric
power from generators to load over the planning period.
However, numerous drivers are shifting planners away from this
paradigm, including smart loads, integration of wind and solar
technologies, as well as policies to reduce the environmental footprint
of electricity production, among others. These drivers are already affecting power system planning, design, and operation
and are likely to continue to do so in the future. This in turn creates a need for a broader and, in many cases, a more
integrated and expansive view of reliability planning. The following are among the trends rewriting the traditional
rulebook:
a U.S. Energy Information Administration (EIA), “Table 8. Electricity Supply, Disposition, Prices, and Emissions,” in Annual Energy Outlook 2016 (Washington, DC: EIA, September 15, 2016), https://www.eia.gov/outlooks/aeo/index.cfm.
Why Reliability Matters
The United States benefits from a highly reliable
power system. Reliable, affordable electric
power fuels the economy and supports our
quality of life. Each time a person turns on a
light, plugs in a phone, approaches a traffic
signal, or logs onto a computer, they trust that
the power system will be working to enable the
services we expect. Power system reliability is
the ability of the system to deliver expected
service through many types of planned and
unplanned events.
The high level of reliability provided by the U.S.
grid is not an accident. The Federal Energy
Regulatory Commission (FERC), U.S.
Department of Energy, North American Electric
Reliability Corporation (NERC), States’ Public
Utility Commissions, regional planning
authorities, utilities, power system operators,
and other organizations have worked to increase
and ensure the reliability of the U.S. power
system through mandatory reliability standards,
FERC-regulated planning, coordination, and
industry investment.
From Department of Energy (DOE), Maintaining
Reliability in the Modern Power System
(Washington, DC: DOE, 2016).
2
Large amounts of thermal generation and inelastic demand (i.e., demand that remains constant regardless of the
price of electricity) are being replaced with resources that present both new constraints and new opportunities to
power system planning. For example, variable renewable generation like wind and solar power offers
environmental benefits, but may also require additional system flexibility. Smart grid technologies like demand
response give power system operators new tools for managing demand and in turn ensuring power system
reliability.
Natural gas use in the electric power sector has expanded significantly, which makes integrated natural gas-
electric systems simulation increasingly important in regions transitioning large portions of their generating mix
from coal to natural gas, according to the staff of the Federal Energy Regulatory Commission (FERC), as well as
many system operators, state regulators, and other stakeholders 1
Rapidly growing distributed photovoltaic (PV) generation means that systems designed for one-way flow of power
from producer to consumer now must accommodate two-way flows of power.
The need for coordinated transmission and distribution planning is increasing, in part due to growing prevalence
of distributed energy resources on the power system in some regions.2
Federal, state, local, and tribal environmental policies and goals are also playing a role in accelerating the changes
described above in the energy sector. Clean and renewable energy standards, energy efficiency standards, state
carbon policies, and the Federal Clean Power Plan, among others, are examples of policies that are contributing to
energy system transition.
An effective reliability plan evaluates the existing electricity system as well as the suite of potential investment options—
including infrastructure, generation, and operational practices—that could be deployed to adequately meet the future
demand for electricity. This paper focuses on established planning methods for the electricity sector, with discussion on
ways to integrate the broader energy system into a reliable planning process.
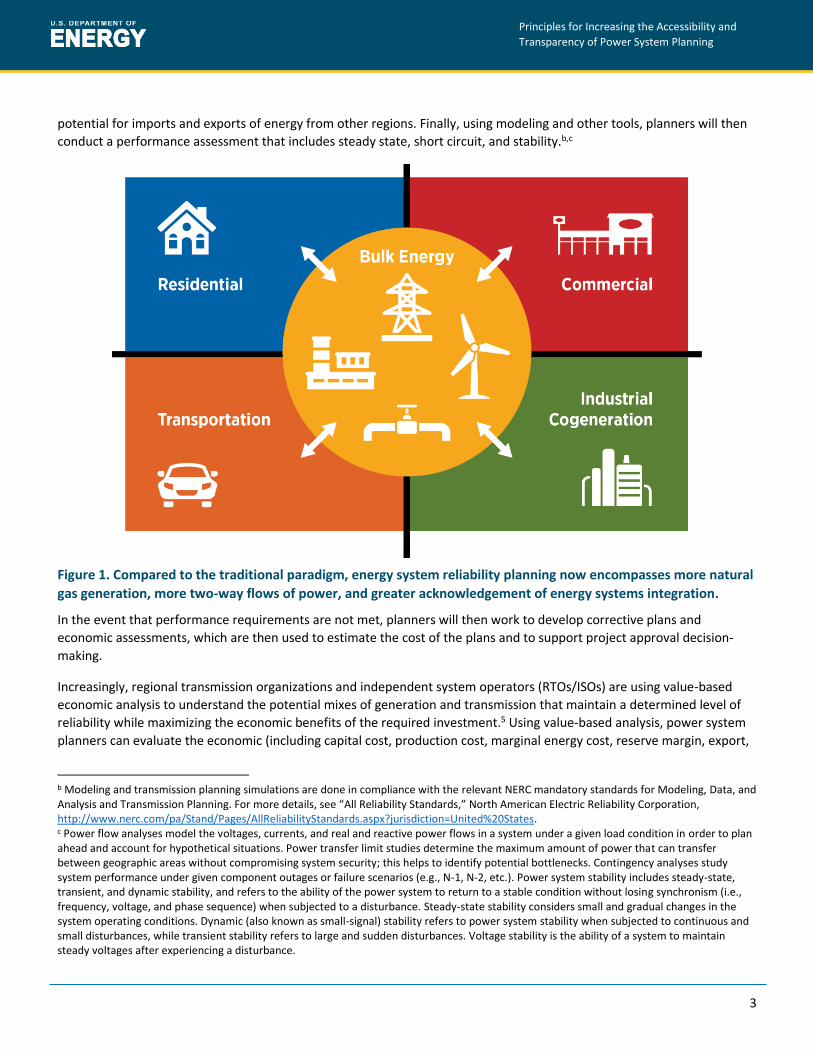
Indeed, many of these drivers call for a broader planning paradigm in which electricity is increasingly part of a more
integrated system of energy systems (Figure 1). In this world of “energy systems integration”3 comprehensive reliability
planning considers the combined impacts of these broader energy systems, including transmission, distribution, natural
gas, and even transportation.
Planning for Reliability: Traditional and Emerging Approaches
Power system planners use two basic approaches to reliability planning: (1) reliability-based and (2) value-based.4
Under the reliability-based planning approach, system planners begin with a model of the existing power system and a
forecast of load for the planning period. In the next step, planners assess the generation capacity additions and their
location that are needed to meet load. Planners will also account for state clean energy standards (and/or other state
requirements) and the list of planned generation in the region’s interconnection queue. Planners will also evaluate the
3
Principles for Increasing the Accessibility and
Transparency of Power System Planning
potential for imports and exports of energy from other regions. Finally, using modeling and other tools, planners will then
conduct a performance assessment that includes steady state, short circuit, and stability.b,c
Figure 1. Compared to the traditional paradigm, energy system reliability planning now encompasses more natural
gas generation, more two-way flows of power, and greater acknowledgement of energy systems integration.
In the event that performance requirements are not met, planners will then work to develop corrective plans and
economic assessments, which are then used to estimate the cost of the plans and to support project approval decision-
making.
Increasingly, regional transmission organizations and independent system operators (RTOs/ISOs) are using value-based
economic analysis to understand the potential mixes of generation and transmission that maintain a determined level of
reliability while maximizing the economic benefits of the required investment.5 Using value-based analysis, power system
planners can evaluate the economic (including capital cost, production cost, marginal energy cost, reserve margin, export,
b Modeling and transmission planning simulations are done in compliance with the relevant NERC mandatory standards for Modeling, Data, and Analysis and Transmission Planning. For more details, see “All Reliability Standards,” North American Electric Reliability Corporation, http://www.nerc.com/pa/Stand/Pages/AllReliabilityStandards.aspx?jurisdiction=United%20States. c Power flow analyses model the voltages, currents, and real and reactive power flows in a system under a given load condition in order to plan ahead and account for hypothetical situations. Power transfer limit studies determine the maximum amount of power that can transfer between geographic areas without compromising system security; this helps to identify potential bottlenecks. Contingency analyses study system performance under given component outages or failure scenarios (e.g., N-1, N-2, etc.). Power system stability includes steady-state, transient, and dynamic stability, and refers to the ability of the power system to return to a stable condition without losing synchronism (i.e., frequency, voltage, and phase sequence) when subjected to a disturbance. Steady-state stability considers small and gradual changes in the system operating conditions. Dynamic (also known as small-signal) stability refers to power system stability when subjected to continuous and small disturbances, while transient stability refers to large and sudden disturbances. Voltage stability is the ability of a system to maintain steady voltages after experiencing a disturbance.
4
and environmental costs) and quantitative (including reliability, right of way, flexibility, and fuel diversity) benefits of
investments over the financial life of an asset under a variety of scenarios, and can allocate costs for those investments to
the end-users in the system for whom the benefits accrue.6
These two reliability planning approaches typically focus solely on the bulk power system. However, given the various
drivers of change in the electricity sector, there is a growing awareness in the planning community that changes in the
distribution system and fuel deliverability can strongly influence electricity reliability. While awareness of this increasing
complexity is growing, current practices generally still address bulk power and distribution system planning independently.
Notable exceptions include the California Public Utilities Commission and the New York State Department of Public Service
Reforming the Energy Vision Initiative, which are moving towards aligning infrastructure planning processes by requiring
consistency among load forecasts, resource adequacy assessments, and transmission planning processes.7
Common practice today is to perform a reliability analysis in each of these domains separately. However, there is growing
interest in power system planning processes that consider the combined impacts of, and interdependencies among, the
distribution, transmission, and natural gas systems.
The following are four common types of power system planning studies that evaluate the reliability and economics of the
power system:8
Resource adequacy
Production cost
Integrated gas-electric systems simulations
Power flow and transient stability.
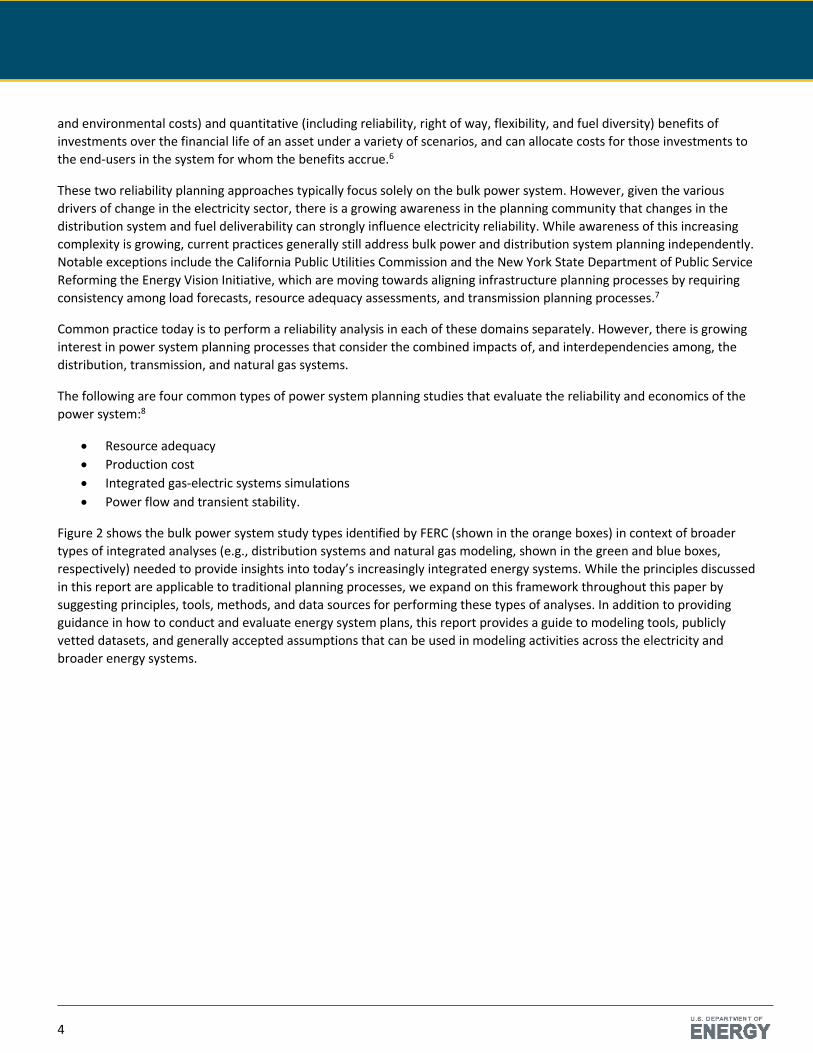
Figure 2 shows the bulk power system study types identified by FERC (shown in the orange boxes) in context of broader
types of integrated analyses (e.g., distribution systems and natural gas modeling, shown in the green and blue boxes,
respectively) needed to provide insights into today’s increasingly integrated energy systems. While the principles discussed
in this report are applicable to traditional planning processes, we expand on this framework throughout this paper by
suggesting principles, tools, methods, and data sources for performing these types of analyses. In addition to providing
guidance in how to conduct and evaluate energy system plans, this report provides a guide to modeling tools, publicly
vetted datasets, and generally accepted assumptions that can be used in modeling activities across the electricity and
broader energy systems.

5
Principles for Increasing the Accessibility and
Transparency of Power System Planning
Figure 2. Components of 21st-century energy systems planning (top) and the time horizon (left) considered by each
component
6
PRINCIPLE 1: CONDUCT OPEN PLANNING PROCESSES
Enlisting energy, environmental, and electricity regulators, policymakers, and other
stakeholders in the planning process can help formulate an effective process for
maintaining reliability of the power sector and increase stakeholder commitment and
acceptance to the resulting plan.
Open and inclusive planning processes can help lead to more robust reliability plans and can improve the ability of system
operators to gain support from all relevant stakeholders for the final plan. Open processes could include the following:
Allowing and encouraging environmental, energy, and electricity regulators, policymakers, and other stakeholders
to participate in regional transmission planning and inter-regional transmission coordination activities and groups,
such as those established through FERC Order 1000 (see FERC and NERC Guidelines text box below). Awareness
and understanding of planning in neighboring regions can help planners understand the challenges they are
anticipating, and how they might impact your system. For example, if a region relies on a coal-fired power plant in
a neighboring region to meet peak load, then retiring that plant could force the grid operator (or equivalent entity)
to add generation capacity or change transmission practices.
Establishing procedures and tools to share information with and gather feedback from stakeholders. Effective
means of information sharing include webinars, public meetings, and publications. Examples of information that
should be made available to stakeholders include the following:
o Assumptions: a clearly defined and well documented set of assumptions about present and future system needs and capabilities, which together provide the foundation for the proposed reliability assessment plan
o Data: information on geographically-relevant grid topology, system performance, technology cost and performance data, and electric loads that can help inform projections of future electric generating capacity requirements
o Methods: management of plan development and how the information is evaluated in order to build a robust reliability plan
o Tools: computer software and code utilized for quantitative assessments of power system capacity and operational needs for reliability purposes
o Decision Process: how responsibility for building the plan is shared, how stakeholder input will be incorporated into the plan, and a timeline with milestones and release dates.
For each of these items, consideration should be given to their relevance and likely impact on the plan, their rationale
(i.e., why a specific item is being considered) and sensitivity for public disclosure (i.e., what can be shared with which
stakeholders?). The planning process may access data and/or provide analysis or conclusions that can be sensitive. For
example, the analysis could be based on data that are proprietary, that has implications on energy infrastructure security,
or that has a potential impact (both positive and negative) on particular groups or communities. In these situations, the
open, transparent process can still be in place, but with the caveat that the level of detail provided in the disclosed
information is carefully vetted. The general practice for sharing sensitive information is to disclose only what is relevant for
the purpose of justifying the assumptions or the proposed actions contained in the reliability plan.

7
Principles for Increasing the Accessibility and
Transparency of Power System Planning
Federal Energy Regulatory Commission (FERC) and North American Electric Reliability Corporation (NERC) Guidelines for Transmission Planning
FERC Order 1000 outlines requirements for transmission planning and cost allocation for public utility transmission
providers, including regional planning and inter-regional coordination in transmission planning, and the consideration
of transmission needs driven by public policy requirements.9 Public utility commissions have formed 14 transmission
planning regions as part of their compliance with Order 1000.10
FERC’s critical energy infrastructure information (CEII) regulations provide guidance on release of information,
including information that may be proprietary, related to system security, or otherwise considered sensitive.11
NERC Standard TPL-001-4 establishes performance requirements for transmission planning that ensure the bulk
power system operates reliably under a wide variety of conditions and contingencies.12
Applying Principle 1: Western Electricity Coordinating Council Benefits
from Open Planning Process
The Western Electricity Coordinating Council (WECC) planning process is one example of an open and transparent
stakeholder engagement process. The WECC engages stakeholders in its planning processes and uses its website to make
planning information (e.g., meeting minutes, meeting announcements, datasets, scenario definitions, assumptions, and
requests for information from stakeholders) publicly available.13 Meeting schedules are posted on the WECC calendar for
each committee or working group.14 The relevant documents and materials prepared for each meeting are embedded in
the calendar and can be accessed by stakeholders.
The Western Interstate Energy Board (WIEB), an organization that works to promote the cooperative development of
energy policy in its members, which include 11 Western states and three Canadian provinces, made the following points
regarding the WECC planning process:15
1. Planning processes must be open and inclusive, and should encourage broad stakeholder participation.
2. Databases should be made available to the public in order to enable stakeholder review and vetting; doing so is
critical for validation, credibility, and support.
3. There is considerable value in planning across the entire Western Interconnection, as the systems in the region are
interdependent.
4. Planning in the electric sector needs to be flexible to respond to important emerging issues.
5. The WECC Transmission Expansion Planning Policy Committee’s (TEPPC) Common Case produces an expected
10-year future that is an important benchmark for policy analysis and contributes to other important research in
the West.

8
PRINCIPLE 2: FORMULATE RELEVANT RELIABILITY QUESTIONS
TO GUIDE SCENARIO PLANNING
Geographic regions differ in generation capacity, transmission infrastructure, load
profiles, market structures, and economics. Understanding these unique characteristics
can help determine priorities for reliability planning. When system planners ask well-
defined reliability questions, they can help frame a range of scenarios that realistically
bound the realm of potential possibilities.
The goal of reliability planning is to engage relevant energy system planners—RTOs/ISOs, transmission utilities, distribution
system utilities, and increasingly natural gas pipeline operators —to identify and implement economically efficient
solutions to manage realistic events that may stress the reliability and resiliency of the power system.
The word realistic is important. Planners can only model a finite number of scenarios due to the cost and time required for
each study. Similarly, simplifying assumptions on input data are often required to make modeling scenarios
computationally tractable. To simplify the task of modeling power systems and better frame the discussion, energy system
planners strive to identify critical questions that must be answered to address near-term and/or long-term needs of their
particular systems.
For example, a region that expects retirements of existing generating resources might consider the following:
Impact of retirements on both the current and future systems
Availability of sufficient natural gas pipeline and supply infrastructure if natural gas use is expected to increase
Use of energy efficiency rather than new generation to meet demand
Effect of adding renewable resources and/or transmission lines
Vulnerability of electric sector infrastructure to climate change and extreme weather.
Regional characteristics also dictate the degree to which other related systems like natural gas infrastructure or
distribution networks should be included in bulk power system reliability analyses. Furthermore, the relative importance of
the traditional focus areas for reliability planning—resource adequacy, production cost, and power flow and transient
stability (see Figure 2)—may vary by reliability questions of interest. The following section provides examples of regions
tailoring reliability questions to important aspects of their local systems.
Applying Principle 2: Formulate Relevant Reliability Questions
The proper issues to investigate during reliability planning can depend on regional characteristics. Regionally-tailored
reliability questions could include the following:
What is the anticipated level of load growth, or how will load change and how load be served?
For example, the Northwest Power and Conservation Council’s Seventh Northwest Conservation and Electric
Power Plan “…provides guidance on which resources can help ensure a reliable and economical regional power
system over the next 20 years…” in the Pacific Northwest.16 The plan anticipates that load growth in the region will
be met with expanded energy efficiency measures, demand response programs to control peak demand,
increased use of existing natural gas generating capacity, and deployment of new renewable resources.17

9
Principles for Increasing the Accessibility and
Transparency of Power System Planning
How can we accommodate reverse power flows as distributed PV expands?
In 2014, the California Energy Commission commissioned a regional transmission and distribution network
impacts assessment for PV18 using a high-definition regional power system simulation model.19 This effort took
into consideration both transmission and distribution system features to evaluate wide-area grid impacts for PV
interconnections. The study used actual utility data to evaluate the impact of distributed PV on a 3,500-square
mile service territory with 51 distribution feeders and regional transmission. The study results indicated that using
a single model to include many generation projects, distribution feeders, substations, and transmissions makes it
easier to evaluate alternative interconnection schemes and better understand reverse power flow for reducing
impacts of load fluctuation. See the Modeling Distribution Systems text box for guidance on distribution system
modeling as a planning activity.
Understanding Scenario Analysis
Focused and appropriately targeted questions lead to development of scenarios, essentially “what if…?” questions
about changing conditions and potential risks faced by the system that can direct modeling and analysis activities.
Scenarios provide a means to evaluate conditions that might exist in the future, bound uncertainty, and explore the
sensitivity of the system to various input parameters. A “Reference,” “Central,” or “Business as Usual” (BAU) scenario
is typically used as a default case upon which subsequent scenarios iterate. Often, this reference scenario is the
current system, which is assumed to be reliable, projected into the future. A conceptual description of the importance
of using a wide range of scenarios is shown in Figure 3. The center point represents a typical reference scenario. The
inner square region represents a traditional range of scenarios that are used for planning and operational decisions.
The larger outer square reflects a broader set of possible futures, which, if designed properly, capture a meaningful
share of the plausible outcomes. Considering a broader set of possible future may be appropriate but depends on the
likely drivers of change in the region—scenarios should be informed by questions realistically bound to the realm of
potential possibilities. The goal with scenario analysis is to capture this broader space by identifying these bounding
scenarios. Finally, the gray outer area in the figure represents the full, unlimited space of possible futures, which
cannot be feasibly captured within any current modeling framework.
Figure 3. Using scenarios to bound a range of possible futures

10
Power flow and reliability assessment in the distribution system is a relatively new field. It is data intensive, and these
data—describing infrastructure and customer load profiles, for example—are often proprietary. Planning authorities may
take advantage of open-source distribution system simulation tools (e.g., CYME,20 Easy Power,21 OpenDSS,22 and
GridLab-D23). At present, there are significant technical challenges with the simulation of power flow because distribution
systems involve numerous dynamic components, which require detailed data inputs and significant computational
resources to model. One way to overcome data limitations and perform detailed distribution system modeling is by using
representative customer profiles. The U.S. Department of Energy’s Pacific Northwest National Laboratory has developed
“archetypical” feeder models that generate representative customer load profiles for distribution circuits based on customer
class composition, climate zone, level of urbanization, and other criteria.24 These archetypical feeder models can serve as
proxy in modeling activities when acquisition of actual data is not feasible. Incorporating infrastructure into distribution
system modeling presents additional challenges, as detailed specifications of the impedance of distribution system
components must be specified in order to accurately model power flows in distribution circuits. In addition, these data may
not be available for some distribution system assets—particularly for those that have been in operation for many decades
and have undergone many replacement cycles.
Is it worthwhile to extend planning across borders to enhance overall system reliability?
At the borders between states, regions, interconnects, RTOs, and ISOs, various issues can arise, including
transmission rights between markets, energy dispatch at market borders, and investment in transmission or
generation between market and nonmarket regions. The RTO PJM Interconnection and Midcontinent Independent
System Operator (MISO) collaborated on long-term planning for capacity delivery and interface pricing to reduce
potential conflicts.25 The result: hourly price matching between PJM and MISO for particular flow gates between
the regions. Also, cross-border bids are compared and those that match are allowed to happen.
Is the power system robust in the face of climate change, particularly lower rainfall?
Because the Northwest region relies heavily on hydro power for both generation and flexibility, regional planning
efforts may want to incorporate increased focus on resource adequacy and power flow. The Northwest Power
Council addressed climate change questions in its adequacy assessment for 2020-2021.26
Are regional markets adequate for facilitating regional power transfers?
The California ISO energy imbalance market is growing quickly to integrate renewable resources across the WECC
region by “…allowing participants to buy and sell power closer to when electricity is consumed and by allowing
system operators real-time visibility across neighboring grids, which supports balancing supply and demand at less
cost.”27 Analyses have shown economic and reliability benefits of this market.28
How do we value renewable technologies such as distributed PV?
On January 28, 2016, the California Public Utilities Commission (CPUC) voted to adopt new rules that uphold net
metering for future solar customers of the state’s large investor-owned utilities (IOUs).29 But in neighboring
Nevada, the state Public Utilities Commission announced in late 2015 a PV rate change that may have impacts on
Nevada’s rooftop solar market.30
Can we accommodate rapid realignment of generation sources?
Traditionally, system operators would seek to build additional conventional capacity to maintain reliability.
However, current utilities have many additional tools to reduce peak demand, including energy efficiency, demand
response, construction of new transmission lines to enable importing more power from other regions, as well as
other options. For example, in 2010, one East Coast transmission company faced a scenario where a generator
was deactivated and resources were not adequate to meet load.31 Rather than constructing new transmission, the
utility resolved the problem relatively inexpensively by purchasing sufficient synchronous generation capability
sites.32
Modeling Distribution Systems
11
Principles for Increasing the Accessibility and
Transparency of Power System Planning
PRINCIPLE 3: UNDERSTAND AND LEVERAGE VETTED
RESOURCES
Reliability planning can benefit from building on work that has been done by others and
by using vetted models, tools, and datasets. Understanding and using available resources
can improve the efficiency of, and confidence in, the planning process and increase
adoption of consistent approaches and methodologies.
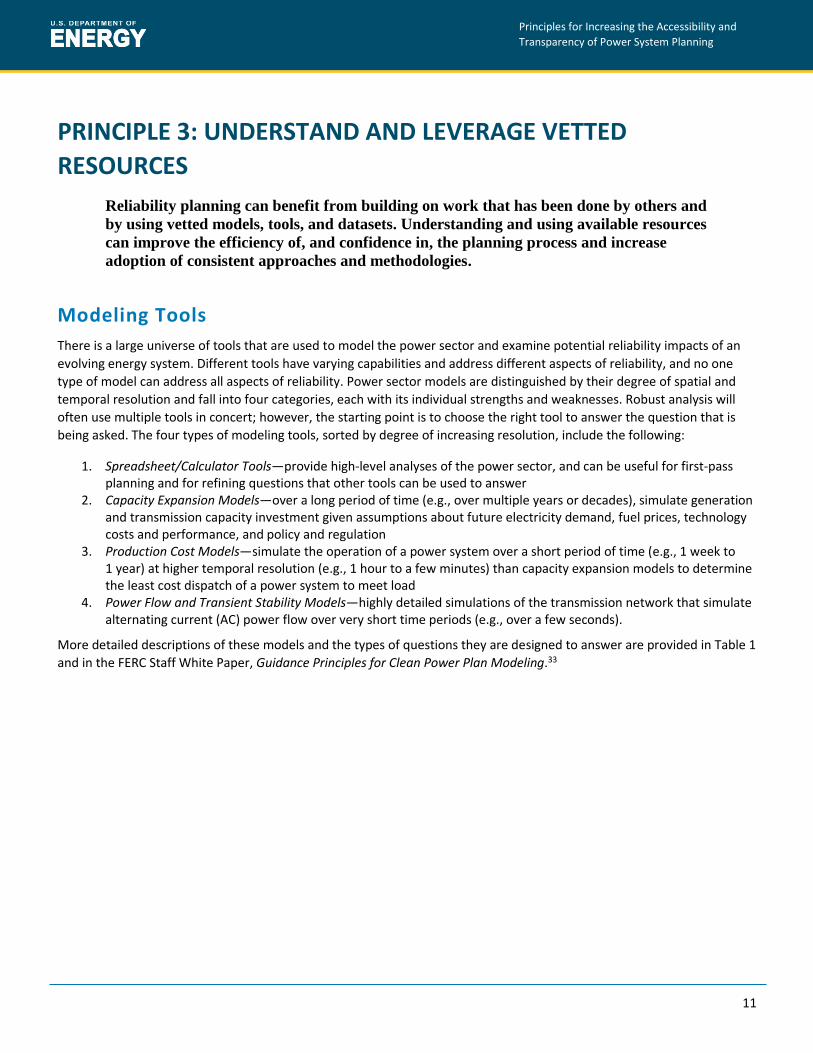
Modeling Tools
There is a large universe of tools that are used to model the power sector and examine potential reliability impacts of an
evolving energy system. Different tools have varying capabilities and address different aspects of reliability, and no one
type of model can address all aspects of reliability. Power sector models are distinguished by their degree of spatial and
temporal resolution and fall into four categories, each with its individual strengths and weaknesses. Robust analysis will
often use multiple tools in concert; however, the starting point is to choose the right tool to answer the question that is
being asked. The four types of modeling tools, sorted by degree of increasing resolution, include the following:
1. Spreadsheet/Calculator Tools—provide high-level analyses of the power sector, and can be useful for first-pass planning and for refining questions that other tools can be used to answer
2. Capacity Expansion Models—over a long period of time (e.g., over multiple years or decades), simulate generation and transmission capacity investment given assumptions about future electricity demand, fuel prices, technology costs and performance, and policy and regulation
3. Production Cost Models—simulate the operation of a power system over a short period of time (e.g., 1 week to 1 year) at higher temporal resolution (e.g., 1 hour to a few minutes) than capacity expansion models to determine the least cost dispatch of a power system to meet load
4. Power Flow and Transient Stability Models—highly detailed simulations of the transmission network that simulate alternating current (AC) power flow over very short time periods (e.g., over a few seconds).
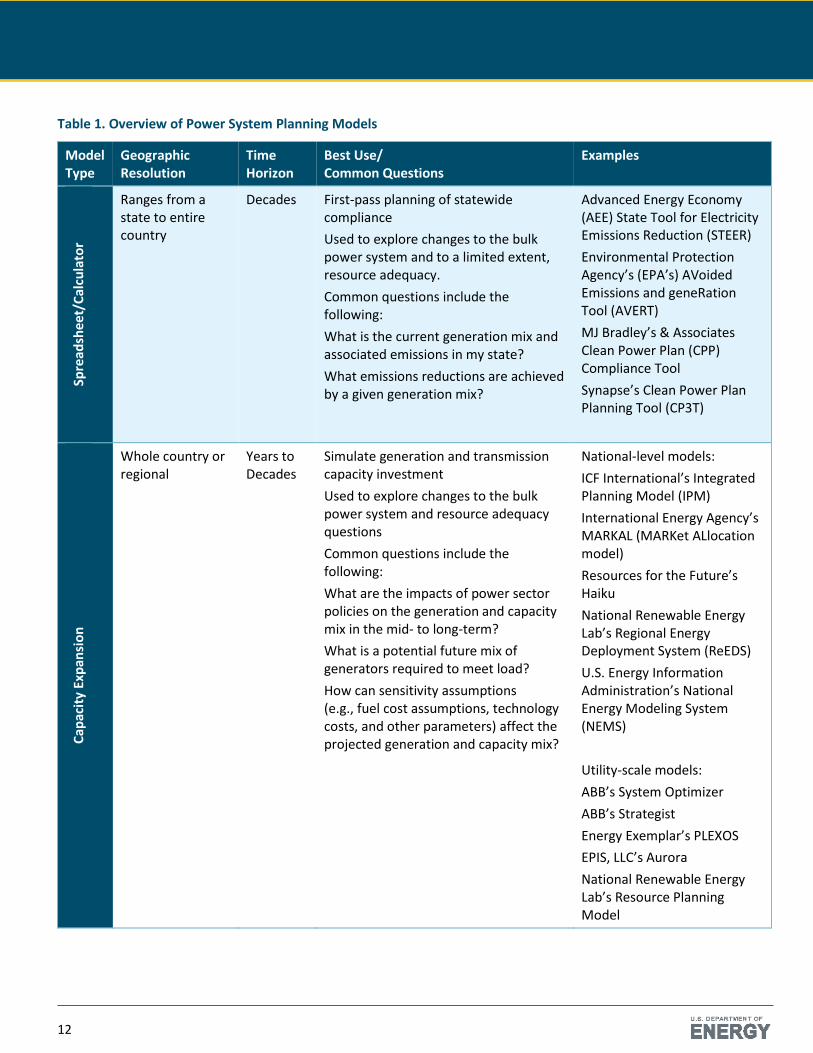
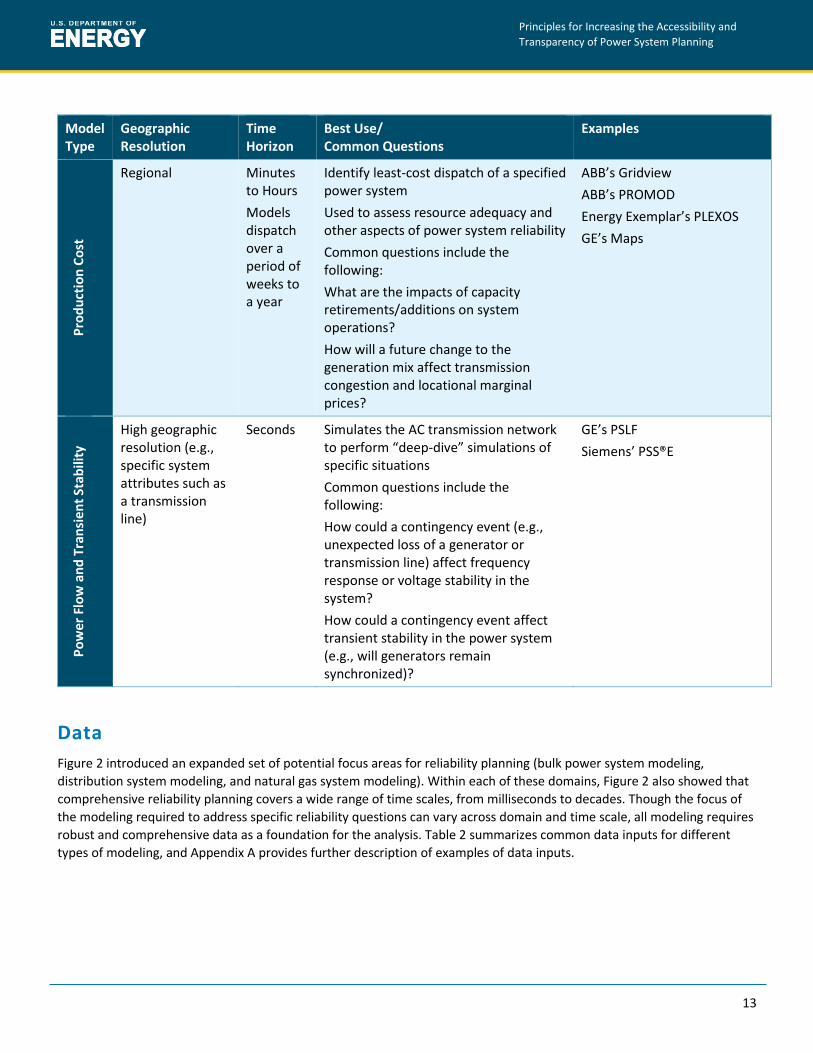
More detailed descriptions of these models and the types of questions they are designed to answer are provided in Table 1
and in the FERC Staff White Paper, Guidance Principles for Clean Power Plan Modeling.33
12
Table 1. Overview of Power System Planning Models
Model Type
Geographic Resolution
Time Horizon
Best Use/ Common Questions
Examples
Spre
adsh
eet/
Cal
cula
tor
Ranges from a state to entire country
Decades First-pass planning of statewide compliance
Used to explore changes to the bulk power system and to a limited extent, resource adequacy.
Common questions include the following:
What is the current generation mix and associated emissions in my state?
What emissions reductions are achieved by a given generation mix?
Advanced Energy Economy (AEE) State Tool for Electricity Emissions Reduction (STEER)
Environmental Protection Agency’s (EPA’s) AVoided Emissions and geneRation Tool (AVERT)
MJ Bradley’s & Associates Clean Power Plan (CPP) Compliance Tool
Synapse’s Clean Power Plan Planning Tool (CP3T)
Cap
acit
y Ex
pan
sio
n
Whole country or regional
Years to Decades
Simulate generation and transmission capacity investment
Used to explore changes to the bulk power system and resource adequacy questions
Common questions include the following:
What are the impacts of power sector policies on the generation and capacity mix in the mid- to long-term?
What is a potential future mix of generators required to meet load?
How can sensitivity assumptions (e.g., fuel cost assumptions, technology costs, and other parameters) affect the projected generation and capacity mix?
National-level models:
ICF International’s Integrated Planning Model (IPM)
International Energy Agency’s MARKAL (MARKet ALlocation model)
Resources for the Future’s Haiku
National Renewable Energy Lab’s Regional Energy Deployment System (ReEDS)
U.S. Energy Information Administration’s National Energy Modeling System (NEMS)
Utility-scale models:
ABB’s System Optimizer
ABB’s Strategist
Energy Exemplar’s PLEXOS
EPIS, LLC’s Aurora
National Renewable Energy Lab’s Resource Planning Model
13
Principles for Increasing the Accessibility and
Transparency of Power System Planning
Model Type
Geographic Resolution
Time Horizon
Best Use/ Common Questions
Examples
Pro
du
ctio
n C
ost
Regional
Minutes to Hours
Models dispatch over a period of weeks to a year
Identify least-cost dispatch of a specified power system
Used to assess resource adequacy and other aspects of power system reliability
Common questions include the following:
What are the impacts of capacity retirements/additions on system operations?
How will a future change to the generation mix affect transmission congestion and locational marginal prices?
ABB’s Gridview
ABB’s PROMOD
Energy Exemplar’s PLEXOS
GE’s Maps
Po
we
r Fl
ow
an
d T
ran
sie
nt
Stab
ility
High geographic resolution (e.g., specific system attributes such as a transmission line)
Seconds Simulates the AC transmission network to perform “deep-dive” simulations of specific situations
Common questions include the following:
How could a contingency event (e.g., unexpected loss of a generator or transmission line) affect frequency response or voltage stability in the system?
How could a contingency event affect transient stability in the power system (e.g., will generators remain synchronized)?
GE’s PSLF
Siemens’ PSS®E
Data
Figure 2 introduced an expanded set of potential focus areas for reliability planning (bulk power system modeling,
distribution system modeling, and natural gas system modeling). Within each of these domains, Figure 2 also showed that
comprehensive reliability planning covers a wide range of time scales, from milliseconds to decades. Though the focus of
the modeling required to address specific reliability questions can vary across domain and time scale, all modeling requires
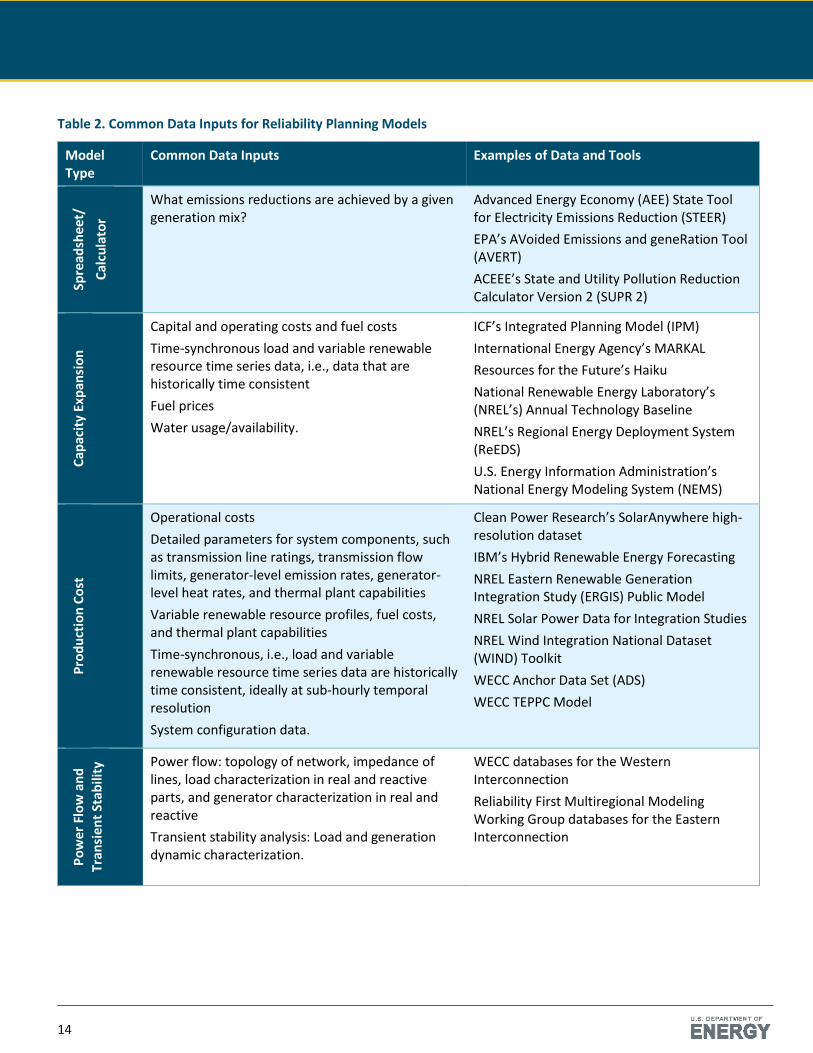
robust and comprehensive data as a foundation for the analysis. Table 2 summarizes common data inputs for different
types of modeling, and Appendix A provides further description of examples of data inputs.
14
Table 2. Common Data Inputs for Reliability Planning Models
Model Type
Common Data Inputs Examples of Data and Tools
Spre
adsh
eet/
Cal
cula
tor
What emissions reductions are achieved by a given generation mix?
Advanced Energy Economy (AEE) State Tool for Electricity Emissions Reduction (STEER)
EPA’s AVoided Emissions and geneRation Tool (AVERT)
ACEEE’s State and Utility Pollution Reduction Calculator Version 2 (SUPR 2)
Cap
acit
y Ex
pan
sio
n
Capital and operating costs and fuel costs
Time-synchronous load and variable renewable resource time series data, i.e., data that are historically time consistent
Fuel prices
Water usage/availability.
ICF’s Integrated Planning Model (IPM)
International Energy Agency’s MARKAL
Resources for the Future’s Haiku
National Renewable Energy Laboratory’s (NREL’s) Annual Technology Baseline
NREL’s Regional Energy Deployment System (ReEDS)
U.S. Energy Information Administration’s National Energy Modeling System (NEMS)
Pro
du
ctio
n C
ost
Operational costs
Detailed parameters for system components, such as transmission line ratings, transmission flow limits, generator-level emission rates, generator-level heat rates, and thermal plant capabilities
Variable renewable resource profiles, fuel costs, and thermal plant capabilities
Time-synchronous, i.e., load and variable renewable resource time series data are historically time consistent, ideally at sub-hourly temporal resolution
System configuration data.
Clean Power Research’s SolarAnywhere high-resolution dataset
IBM’s Hybrid Renewable Energy Forecasting
NREL Eastern Renewable Generation Integration Study (ERGIS) Public Model
NREL Solar Power Data for Integration Studies
NREL Wind Integration National Dataset (WIND) Toolkit
WECC Anchor Data Set (ADS)
WECC TEPPC Model
Po
wer
Flo
w a
nd
Tran
sien
t St
abili
ty Power flow: topology of network, impedance of
lines, load characterization in real and reactive parts, and generator characterization in real and reactive
Transient stability analysis: Load and generation dynamic characterization.
WECC databases for the Western Interconnection
Reliability First Multiregional Modeling Working Group databases for the Eastern Interconnection
15
Principles for Increasing the Accessibility and
Transparency of Power System Planning
Pulling It Together: Scenario Analysis
Scenario analysis applies all of the principles and helps determine the final reliability plan and answer the identified
questions. Scenario analysis consists of selecting the appropriate modeling tool(s), acquiring vetted input data and
assumptions for that tool, and finally, properly designing a suite of scenarios that can answer the identified questions.
Coordination and consistency is critical, particularly when selecting relevant tools, data, assumptions, and scenarios to
maintain internal consistency across these various modeling tool categories and time horizons. For example, for bulk
power system planning, the features and interactions with the distribution system and natural gas systems should all be
taken into consideration when appropriate, recognizing the physical linkage between each of these systems. At the same
time, the interaction between various time horizons should be captured. For example, investment decisions from resource
adequacy modeling have a direct impact on the operational considerations that are evaluated in production cost modeling,
and vice versa.
Coordination and consistency aids in the analysis at hand, and also provides a foundation for systematic future analyses.
For example, National Renewable Energy Laboratory’s (NREL’s) Western Wind and Solar Integration Study (WWSIS)
maintained a consistent study footprint, and, where possible, a consistent baseline scenario across each of its three
phases.34
As energy systems become more integrated, coordination between electricity and natural gas, as well as the transportation
sector, will likely become increasingly relevant for coherent reliability planning. The details of transportation modeling,
including the representation of electric vehicles and rail, are outside of the scope of this document. However, as
transportation becomes more electrified, the representation of its behavior will likely become embedded within bulk power
and distribution system modeling efforts. The same may be true of demand response technologies.
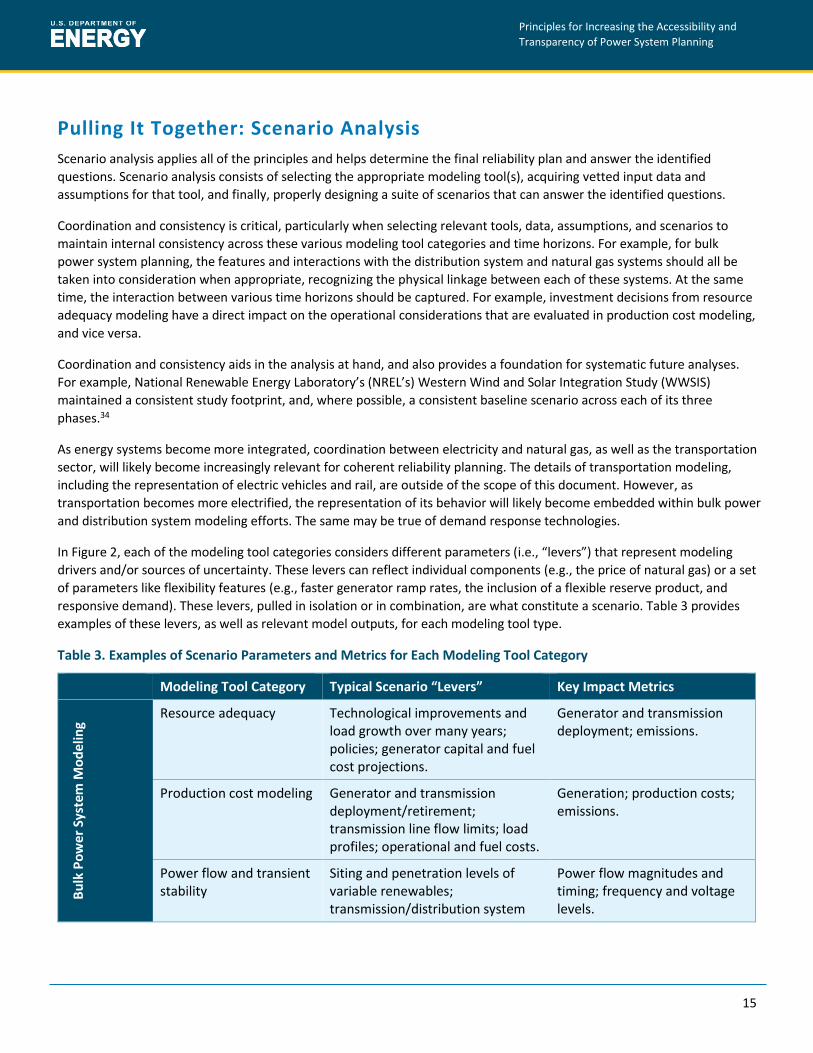
In Figure 2, each of the modeling tool categories considers different parameters (i.e., “levers”) that represent modeling
drivers and/or sources of uncertainty. These levers can reflect individual components (e.g., the price of natural gas) or a set
of parameters like flexibility features (e.g., faster generator ramp rates, the inclusion of a flexible reserve product, and
responsive demand). These levers, pulled in isolation or in combination, are what constitute a scenario. Table 3 provides
examples of these levers, as well as relevant model outputs, for each modeling tool type.
Table 3. Examples of Scenario Parameters and Metrics for Each Modeling Tool Category
Modeling Tool Category Typical Scenario “Levers” Key Impact Metrics
Bu
lk P
ow
er S
yste
m M
od
elin
g
Resource adequacy Technological improvements and load growth over many years; policies; generator capital and fuel cost projections.
Generator and transmission deployment; emissions.
Production cost modeling Generator and transmission deployment/retirement; transmission line flow limits; load profiles; operational and fuel costs.
Generation; production costs; emissions.
Power flow and transient stability
Siting and penetration levels of variable renewables; transmission/distribution system
Power flow magnitudes and timing; frequency and voltage levels.

16
Modeling Tool Category Typical Scenario “Levers” Key Impact Metrics
component settings; governor and load modeling.
Dis
trib
uti
on
Sys
tem
Mo
del
ing
Distribution planning Distribution system upgrades, such as (a) transformer upgrades, (b) re-conductoring of underground cables, and (c) new greenfield integrations.
Owner quality, reliability metrics (e.g., the system average interruption frequency index or the system average interruption duration index) peak demand head space. Circuit loading, load factor of high cost assets, and utilization of grid assets.
Quasi-steady state time series analysis
Testing the efficacy of volt/var control strategies for voltage control, determining hosting capacity for renewable technologies (i.e., distributed PV), deployment of smart grid devices.
Hosting capabilities (kW of PV by sections of distribution system circuits, line losses, load shape changes, peak demand reductions.
Production and fault studies
Protection system capable of bi-directional power flow. Voltage ride-through to explore protective relay settings.
Capabilities of system protection by circuits.
Nat
ura
l Gas
Sys
tem
Mo
de
ling
Natural gas pipelines and storage expansion
Economics of pipeline expansion; cost of infrastructure; fuel cost projections; policies; demand growth over many years.
Pipeline capacity and utilization.
Natural gas system operations
Gas demand; scheduling of gas system operations; physical characteristics of gas system infrastructure.
Pipeline pressure; quantity of gas that can be delivered, often at high temporal resolution.
Scenarios for Modeling Resource Adequacy
For resource adequacy modeling tools, scenarios are often constructed to evaluate the impact of technological
improvements, policy changes, or economic conditions on investment decisions over the course of many years. An
example of a suite of resource adequacy modeling scenarios to explore a range of possible futures is NREL’s Standard
Scenarios, which used NREL’s Annual Technology Baseline (ATB) for cost inputs and the Regional Energy Deployment
System (ReEDS) capacity expansion model to determine the key drivers in the evolution of the U.S. electricity sector from
present to 2050.35 Key sensitivity parameters included fuel prices, generator and transmission costs, load growth,
generator retirement schedules, water usage constraints, and policy assumptions such as renewable and/or clean portfolio
standard requirements.

17
Principles for Increasing the Accessibility and
Transparency of Power System Planning
Penetration is defined as the share of generation provided by renewable energy. The Mid-case Scenario applies reference-
level assumptions; the bidirectional scenarios explore lower-level and higher-level assumptions for fuel costs, technology
capital costs, electricity demand, and retirements. The dashed line in Figure 4 shows historical values.
Figure 4. Renewable energy penetration across a subset of the scenarios explored in the NREL Annual Technology
Baseline36
Scenarios for Modeling Production Cost
Because of its inherent operational timescale, production cost modeling scenarios evaluate the impact of exogenous
system configuration and cost assumptions on system operation, cost, and emissions, typically for a temporal extent of
1 year or less. Examples of sensitivity parameters are load profiles, fuel prices, the treatment of ancillary services,
transmission line flow limits, generator performance parameters, and variable renewable penetration levels. For example,
NREL’s Low Carbon Grid Study (LCGS) explored the potential to reduce carbon emissions by 50% in the State of California.
It conducted a rigorous scenario-based analysis that not only allowed them to compare generation mixes, but also
operational assumptions like flexibility (see Figure 5).37

18
Figure 5. Curtailment in six selected Low Carbon Grid Study scenarios38
Scenarios for Modeling Power Flow and Transient Stability
Scenarios run in power flow and transient stability tools typically evaluate the short-term impact of system configuration
parameters, including siting and penetration levels of variable renewables, transmission/distribution system component
settings, and governor (a device that detects changes in grid frequency and automatically adjusts operations of the
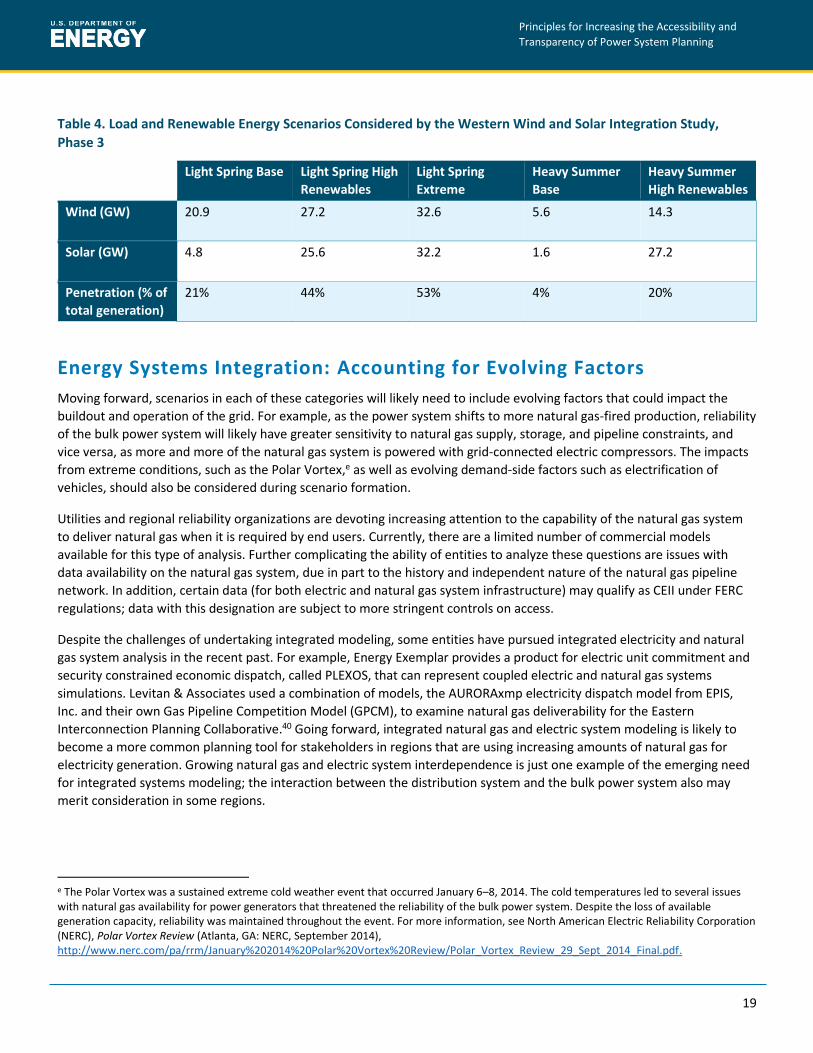
generator to maintain a target frequency) and load modeling.d For example, NREL’s WWSIS Phase 3 operational study
evaluated a set of scenarios with various levels of load and renewable (wind and solar) penetration to capture a wide
range of possible frequency and voltage responses under these extreme system conditions (shown in Table 4).39 Four
primary study scenarios were developed to represent different system conditions (i.e., light and heavy load) as well as
different renewable penetration levels (i.e., base and high renewables). In addition, a sensitivity scenario with extremely
high renewable penetration under light load conditions was also considered.
d Governor modeling represents the presence and response of governors that are embedded within generators. When signaled by the system operator, a governor controls the frequency response of their generator by adjusting the mechanical power output of the generator. Load modeling captures the end-use, multi-sector demand for electricity (or energy in the case of natural gas or heating/transportation fuels).
19
Principles for Increasing the Accessibility and
Transparency of Power System Planning
Table 4. Load and Renewable Energy Scenarios Considered by the Western Wind and Solar Integration Study,
Phase 3
Light Spring Base Light Spring High
Renewables
Light Spring
Extreme
Heavy Summer
Base
Heavy Summer
High Renewables
Wind (GW) 20.9 27.2 32.6 5.6 14.3
Solar (GW) 4.8 25.6 32.2 1.6 27.2
Penetration (% of
total generation)
21% 44% 53% 4% 20%
Energy Systems Integration: Accounting for Evolving Factors
Moving forward, scenarios in each of these categories will likely need to include evolving factors that could impact the
buildout and operation of the grid. For example, as the power system shifts to more natural gas-fired production, reliability
of the bulk power system will likely have greater sensitivity to natural gas supply, storage, and pipeline constraints, and
vice versa, as more and more of the natural gas system is powered with grid-connected electric compressors. The impacts
from extreme conditions, such as the Polar Vortex,e as well as evolving demand-side factors such as electrification of
vehicles, should also be considered during scenario formation.
Utilities and regional reliability organizations are devoting increasing attention to the capability of the natural gas system
to deliver natural gas when it is required by end users. Currently, there are a limited number of commercial models
available for this type of analysis. Further complicating the ability of entities to analyze these questions are issues with
data availability on the natural gas system, due in part to the history and independent nature of the natural gas pipeline
network. In addition, certain data (for both electric and natural gas system infrastructure) may qualify as CEII under FERC
regulations; data with this designation are subject to more stringent controls on access.
Despite the challenges of undertaking integrated modeling, some entities have pursued integrated electricity and natural
gas system analysis in the recent past. For example, Energy Exemplar provides a product for electric unit commitment and
security constrained economic dispatch, called PLEXOS, that can represent coupled electric and natural gas systems
simulations. Levitan & Associates used a combination of models, the AURORAxmp electricity dispatch model from EPIS,
Inc. and their own Gas Pipeline Competition Model (GPCM), to examine natural gas deliverability for the Eastern
Interconnection Planning Collaborative.40 Going forward, integrated natural gas and electric system modeling is likely to
become a more common planning tool for stakeholders in regions that are using increasing amounts of natural gas for
electricity generation. Growing natural gas and electric system interdependence is just one example of the emerging need
for integrated systems modeling; the interaction between the distribution system and the bulk power system also may
merit consideration in some regions.
e The Polar Vortex was a sustained extreme cold weather event that occurred January 6–8, 2014. The cold temperatures led to several issues with natural gas availability for power generators that threatened the reliability of the bulk power system. Despite the loss of available generation capacity, reliability was maintained throughout the event. For more information, see North American Electric Reliability Corporation (NERC), Polar Vortex Review (Atlanta, GA: NERC, September 2014), http://www.nerc.com/pa/rrm/January%202014%20Polar%20Vortex%20Review/Polar_Vortex_Review_29_Sept_2014_Final.pdf.
20
Applying Principle 3: California Harnesses New Modeling Techniques to
Integrate Distributed Energy Resources
In 2013, the State of California adopted amendments to the state’s Public Utilities Code to require utilities create
distributed resource plans.41 Specifically, AB-327 instructed that, “Not later than July 1, 2015, each electrical corporation
shall submit to the commission a distribution resources plan proposal to identify optimal locations for the deployment of
distributed resources…This evaluation shall be based on reductions or increases in local generation capacity needs,
avoided or increased investments in distribution infrastructure, safety benefits, reliability benefits, and any other savings
the distributed resources provides to the electric grid or costs to ratepayers of the electrical corporation.”42
In response to AB-327 California’s IOUs began developing distributed resource plans (DRPs) to more fully incorporate
distributed energy resources (DER), such as rooftop solar, electric vehicles (EVs), or energy storage, into the grid.43 These
DRPs are designed to help utilities develop a methodology to determine the value of DER in specific locations, forecast the
growth of DER, demonstrate DER projects, and identify issues surrounding safety, data, and tariffs that can help or hinder
DER development.44 These DRP plans have become increasingly important because of California’s unprecedented
deployment of DER, like rooftop solar, which has begun to impact the current economic and operational structure of the
grid.
Key to IOU efforts to develop DRPs was the use of modeling tools. For example, Pacific Gas and Electric Company (PG&E)
utilized their Load Forecast Analysis tool, LoadSEER, to create load profiles, which they then compared against
representative DER profiles to determine the DER’s hourly impact on every individual feeder in PG&E’s distribution system.
45 They then utilized a Power Flow Analysis tool, CYMDIST, to understand the power flow effects on the distribution lines at
a granular level.46 Using this information, PG&E was able to map which of its lines were best suited to additional capacity
from DER resources to help inform its customers about where DER investments might be made while maximizing the
benefit to the system.47
Applying Principle 3: MISO begins to Coordinate Electricity Generation
and Natural Gas Deliveries
In October 2012, MISO established the Electric and Natural Gas Coordination Task Force (ENGCTF).48 ENGCTF’s charter
directed it to, “Identify challenges related to an expectation of increasing reliance upon natural gas while ensuring
reliability of the electric system,” and develop, “an approach to resolving identified gas-electric coordination
challenges…[and] recommendations for on-going operations, market impacts, and compliance for regulatory deadlines, as
associated with gas-electric interdependency.” 49
The creation of ENGCTF was prompted by the changing generation mix in MISO due to its increasing reliance on natural gas
as a fuel for electricity generation. Spurred by this transition, MISO convened meetings with stakeholders, including
members from both the natural gas and electricity industries, and commissioned several studies of the capability of the
natural gas distribution system to meet the growing gas demand offered by power plants. These studies were released in
phases. Phases 1 and 2, released in February and July 2012, respectively, examined the northern and central portions of
MISO.50 These studies concluded that, “additional gas pipeline infrastructure is needed to accommodate fuel switching,”51
and, “to ensure generator availability, gas storage may be required.”52 The result of these MISO studies and stakeholder
meetings illustrated the need for a specific MISO entity to address the growing gas-electricity interdependency. Thus,
ENGCTF was created.
21
Principles for Increasing the Accessibility and
Transparency of Power System Planning
Since its creation, ENGCTF has “devoted a significant amount of time to cross-industry education,” including presentations
from various sectors in each industry. Additionally, cross-industry teams were formed to create summary papers
containing recommendations on key issues, such as, “Potential Competition between Generator Demand & Upcoming Gas
Storage injection” 53 and “Process & Timeline for Natural Gas Infrastructure Build-Out.” 54 Beyond ENGCTF, MISO has
increased coordination between the electricity and natural gas sectors in other ways. In 2013, MISO conducted an updated
Phase 3 analysis55, which “featured an expanded study footprint, including the newly integrated South Region, and an
enhanced methodology, adding a dynamic pipeline modeling component,”56 that concluded, “infrastructure expansion is
still needed to move gas into the region and to address area-specific capacity constraints.”57 This analysis was conducted in
addition to other “recommendations aligned with the goals of the ENGCTF.”58 MISO has also begun to use the PLEXOS
Integrated Energy Model, which runs “gas and electric models [that] are solved simultaneously allowing decision makers to
trade-off gas investments, constraints and costs against other alternatives”59 to give MISO a “better understanding and
planning for future gas-electric system interactions.”60
Additionally, MISO has updated their control room to include an overlay of the natural gas infrastructure. 61 This overlay is
linked to critical notices for pipelines and operational flow orders from all pipelines in the MISO footprint, as well as to a
database linking gas-fired generators to their fuel sources. 62 Beginning in November 2016, MISO will align the day-ahead
markets for both electricity and natural gas.63 This will mean listing the results from the day-ahead electricity market at
least 30 minutes earlier in order to give “committed” gas-fired units time to procure gas and pipeline transportation during
the gas industry’s “Timely” scheduling window.64
22
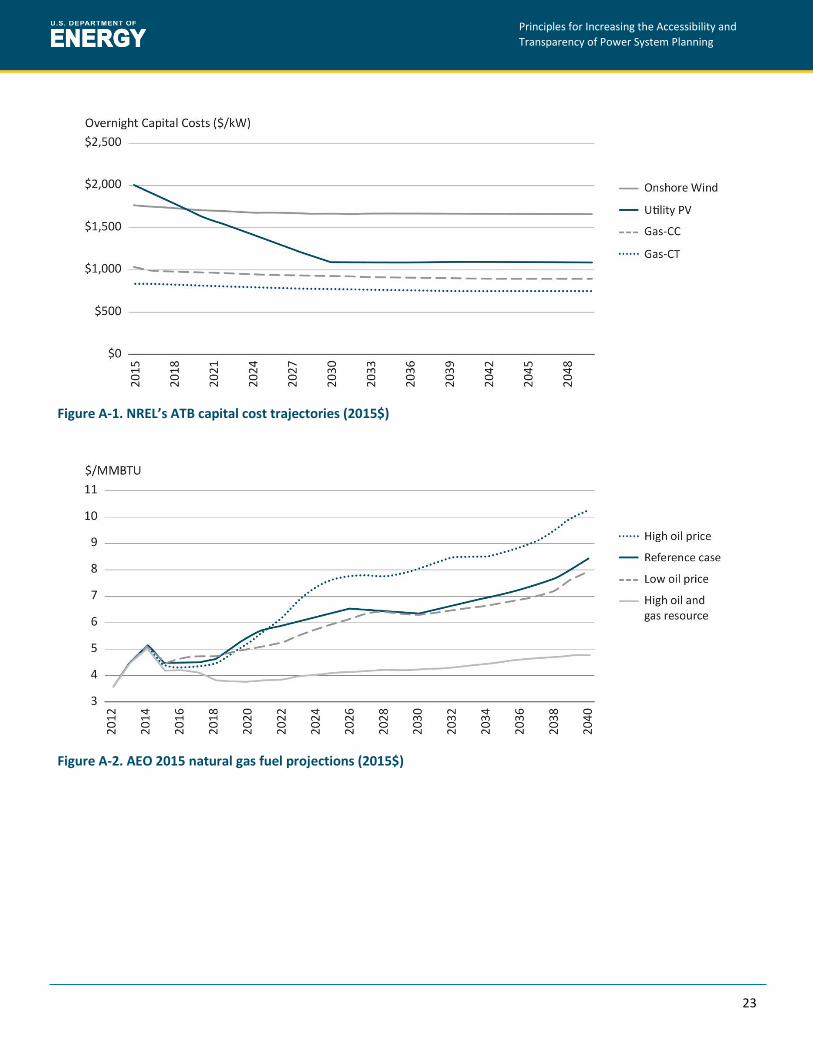
APPENDIX A: DATA SOURCES
Each of the power system planning study types defined in Figure 2 require different input data. For resource adequacy
tools, investment cost and natural gas fuel price assumptions are key drivers in capacity expansion model results. The
National Renewable Energy Laboratory (NREL) has established a formal, annual process for producing an internally-
consistent set of investment and operating cost inputs for conventional and renewable resources in its Annual Technology
Baseline (ATB) database.65 Capital cost trajectories from the 2015 ATB for select technologies are shown in Figure A-1.
Another common source for cost data is the EIA’s Annual Energy Outlook (AEO). The delivered electric sector natural gas
fuel price trajectories for four scenarios from AEO 2015 are summarized in Figure A-2.f In addition, the National Energy
Technology Center (NETL) publishes cost and performance data for fossil-based generators through its Baseline Studies for
Fossil Energy Plants.g
Similar to NREL’s ATB cost inputs for its capacity expansion modeling efforts, Western Electricity Coordinating Council
(WECC) is developing a standardized dataset to align assumptions used in production cost, power flow, and dynamics
modeling work. This Anchor Data Set (ADS) intends to provide a consistent and coordinated planning dataset of loads,
resources, and transmission topology 10 years into the future.66
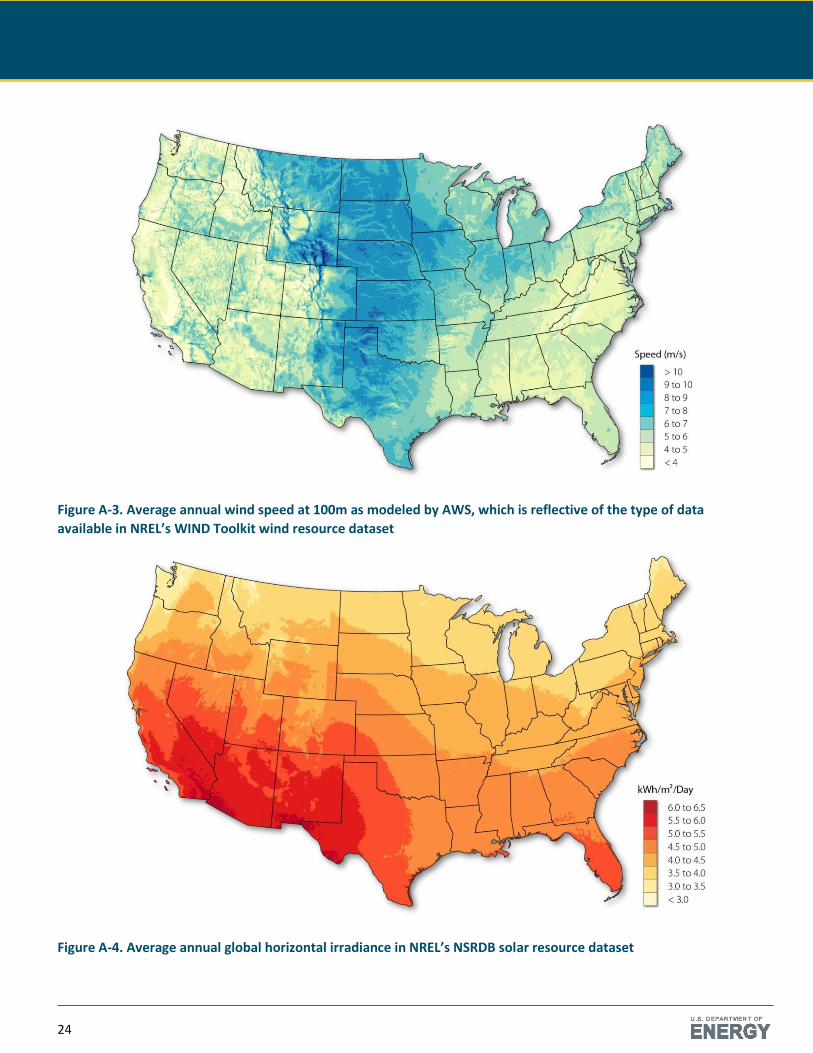
Key model inputs for production cost models include temporally and spatially resolved wind and solar data. Data sources
for such U.S. wind and solar profiles include NREL’s Wind Integration National Dataset (WIND) Toolkit, which includes
5-minute wind resource and hourly forecast datasets, and the National Solar Radiation Database (NSRDB), which includes
hourly solar resource data. Examples of these types of data are shown in Figures A-3 and A-4.67 NREL is developing wind
datasets for select countries, including Mexico and Canada.
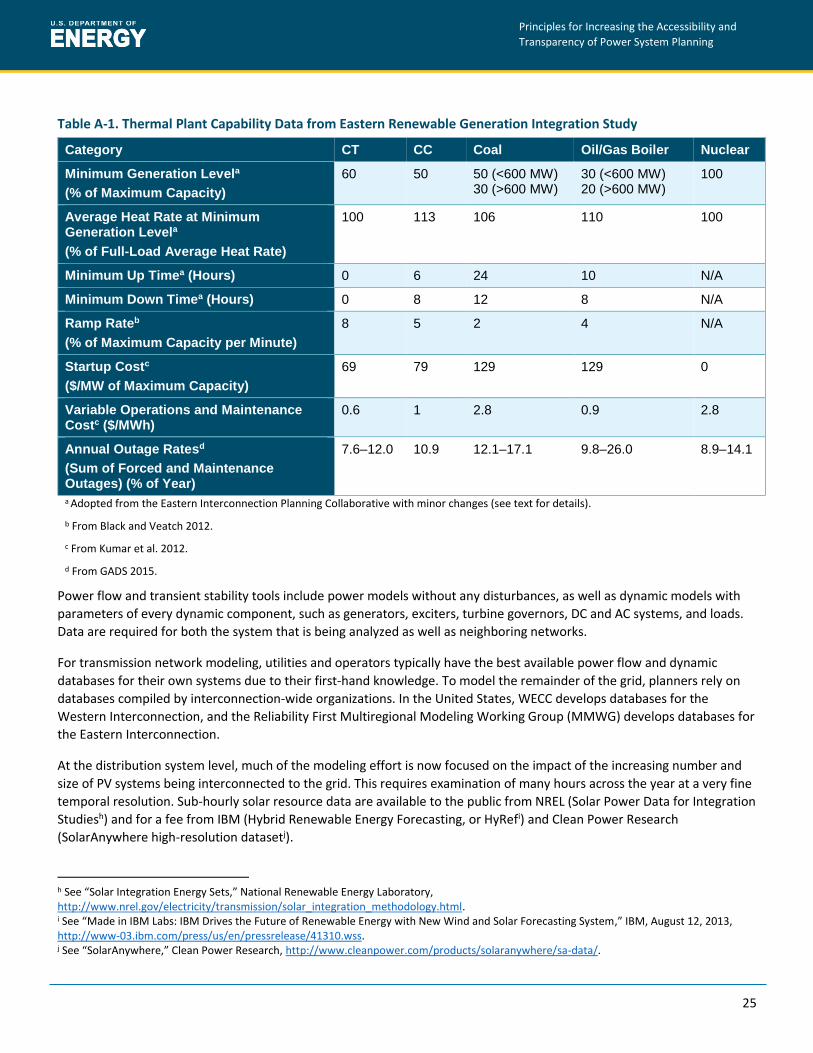
Production cost tools also require detailed parameters for system components, such as thermal generators. An example of
production cost model thermal plant data, which was used in NREL’s Eastern Renewable Generation Integration Study
(ERGIS), is summarized by generator type in Table A-1.68
f These prices reflect the 2015 average heat content for natural gas of 1,000 cubic feet (Mcf)= 1.032 million British thermal units (MMBtu). See “Table A4. Approximate Heat Content of Natural Gas,” Energy Information Administration, Monthly Energy Review, December 2016, https://www.eia.gov/totalenergy/data/monthly/pdf/sec13_4.pdf. g See “Baseline Studies Overview,” National Energy Technology Laboratory, http://www.netl.doe.gov/research/energy-analysis/baseline-studies.
23
Principles for Increasing the Accessibility and
Transparency of Power System Planning
Figure A-1. NREL’s ATB capital cost trajectories (2015$)
Figure A-2. AEO 2015 natural gas fuel projections (2015$)
24
Figure A-3. Average annual wind speed at 100m as modeled by AWS, which is reflective of the type of data
available in NREL’s WIND Toolkit wind resource dataset
Figure A-4. Average annual global horizontal irradiance in NREL’s NSRDB solar resource dataset
25
Principles for Increasing the Accessibility and
Transparency of Power System Planning
Table A-1. Thermal Plant Capability Data from Eastern Renewable Generation Integration Study
Category CT CC Coal Oil/Gas Boiler Nuclear
Minimum Generation Levela
(% of Maximum Capacity)
60 50 50 (<600 MW) 30 (>600 MW)
30 (<600 MW) 20 (>600 MW)
100
Average Heat Rate at Minimum Generation Levela
(% of Full-Load Average Heat Rate)
100 113 106 110 100
Minimum Up Timea (Hours) 0 6 24 10 N/A
Minimum Down Timea (Hours) 0 8 12 8 N/A
Ramp Rateb
(% of Maximum Capacity per Minute)
8 5 2 4 N/A
Startup Costc
($/MW of Maximum Capacity)
69 79 129 129 0
Variable Operations and Maintenance Costc ($/MWh)
0.6 1 2.8 0.9 2.8
Annual Outage Ratesd
(Sum of Forced and Maintenance Outages) (% of Year)
7.6–12.0 10.9 12.1–17.1 9.8–26.0 8.9–14.1
a Adopted from the Eastern Interconnection Planning Collaborative with minor changes (see text for details).
b From Black and Veatch 2012.
c From Kumar et al. 2012.
d From GADS 2015.
Power flow and transient stability tools include power models without any disturbances, as well as dynamic models with
parameters of every dynamic component, such as generators, exciters, turbine governors, DC and AC systems, and loads.
Data are required for both the system that is being analyzed as well as neighboring networks.
For transmission network modeling, utilities and operators typically have the best available power flow and dynamic
databases for their own systems due to their first-hand knowledge. To model the remainder of the grid, planners rely on
databases compiled by interconnection-wide organizations. In the United States, WECC develops databases for the
Western Interconnection, and the Reliability First Multiregional Modeling Working Group (MMWG) develops databases for
the Eastern Interconnection.
At the distribution system level, much of the modeling effort is now focused on the impact of the increasing number and
size of PV systems being interconnected to the grid. This requires examination of many hours across the year at a very fine
temporal resolution. Sub-hourly solar resource data are available to the public from NREL (Solar Power Data for Integration
Studiesh) and for a fee from IBM (Hybrid Renewable Energy Forecasting, or HyRefi) and Clean Power Research
(SolarAnywhere high-resolution datasetj).
h See “Solar Integration Energy Sets,” National Renewable Energy Laboratory, http://www.nrel.gov/electricity/transmission/solar_integration_methodology.html. i See “Made in IBM Labs: IBM Drives the Future of Renewable Energy with New Wind and Solar Forecasting System,” IBM, August 12, 2013, http://www-03.ibm.com/press/us/en/pressrelease/41310.wss. j See “SolarAnywhere,” Clean Power Research, http://www.cleanpower.com/products/solaranywhere/sa-data/.
26
ENDNOTES
1 Federal Energy Regulatory Commission, Staff White Paper on Guidance Principles for Clean Power Plan Modeling: Docket No. AD16-14-000 (Washington, DC: Federal Energy Regulatory Commission, January 2016), 16, accessed June 27, 2016 http://www.ferc.gov/legal/staff-reports/2016/modelingwhitepaperAD16-14.pdf. See also Eastern Interconnection States’ Planning Council, “Study on Long-term Electric and Natural Gas Infrastructure Requirements in the Eastern Interconnection,” (Washington, DC: EISPC, 2014), 1, accessed November 1, 2016, http://pubs.naruc.org/pub/536DFAF7-2354-D714-512C-1BA1BBD00009.
2 Bryan Palmintier, Robert Broderick, Barry Mather, Michael Coddington, Kyri Baker, Fei Ding, Matthew Reno, Matthew Lave, and Ashwini Bharatkumar, On the Path to SunShot: Emerging Issues and Challenges in Integrating Solar with the Distribution System, (Golden, CO: National Renewable Energy Laboratory, 2016), NREL/TP-5D00-65331, 1, accessed November 1, 2016, http://www.nrel.gov/docs/fy16osti/65331.pdf.
3 Mark F. Ruth and Benjamin Kroposki, “Energy Systems Integration: An Evolving Energy Paradigm,” The Electricity Journal 27, no. 6 (2014): 36–47, http://dx.doi.org/10.1016/j.tej.2014.06.001.
4 James McCalley, Ward Jewell, Thomas Mount, Dale Osborn, and Jeff Fleeman, “A Wider Horizon: Technologies, Tools, and Procedures for Energy Systems Planning at the National Level,” IEEE Power and Energy Magazine (2011): 42–54.
5 R. Gutman and E. R. Wilcox, “21st Century Transmission Planning: The Intersection of Engineering, Economics, and Environment” (presented at the Integration of Wide-Scale Renewable Resources Into the Power Delivery System, CIGRE/IEEE PES Joint Symposium, Calgary, Alberta, July 29–31, 2009), 1-17, http://ieeexplore.ieee.org/stamp/stamp.jsp?tp=&arnumber=5211171. See also: Midcontinent Independent System Operator (MISO), MTEP14 MVP Triennial Review: A 2014 review of the Public Policy, Economic, and Qualitative Benefits of the Multi-Value Project Portfolio (MISO, 2014), https://www.misoenergy.org/Library/Repository/Study/Candidate%20MVP%20Analysis/MTEP14%20MVP%20Triennial%20Review%20Report.pdf.
6 Midcontinent Independent Systems Operator (MISO), “Order 890 Planning Compliance Strawman” (presented at Midwest ISO FERC Technical Conference, Pittsburg, Pennsylvania, June 29, 2007), http://www.ferc.gov/CalendarFiles/20070705100428-8-MISO.pdf.
7 “Alignment of Key Infrastructure Planning Processes,” California Public Utilities Commission (CPUC), California Energy Commission (CEC), and California Independent System Operator (CAISO), December 23, 2014, https://www.caiso.com/Documents/TPP-LTPP-IEPR_AlignmentExplanatoryText.pdf. See also: “DPS – Reforming the Energy Vision,” New York State Department of Public Services, accessed November 1, 2016, http://www3.dps.ny.gov/W/PSCWeb.nsf/All/CC4F2EFA3A23551585257DEA007DCFE2?OpenDocument.
8 Federal Energy Regulatory Commission, Staff White Paper on Guidance Principles for Clean Power Plan Modeling: Docket No. AD16-14-000 (Washington, DC: Federal Energy Regulatory Commission, January 2016), 4-5, accessed June 27, 2016 http://www.ferc.gov/legal/staff-reports/2016/modelingwhitepaperAD16-14.pdf.
9 “Order No. 1000 - Transmission Planning and Cost Allocation,” Federal Energy Regulatory Commission, last modified March 17, 2016, http://www.ferc.gov/industries/electric/indus-act/trans-plan.asp.
10 “Order No. 1000 Transmission Planning Regions,” Federal Energy Regulatory Commission, https://www.ferc.gov/industries/electric/indus-act/trans-plan/trans-plan-map.pdf. See also, “Order No. 1000 - Transmission Planning and Cost Allocation,” Federal Energy Regulatory Commission, https://www.ferc.gov/industries/electric/indus-act/trans-plan.asp.
11 “Critical Energy Infrastructure Information (CEII) Regulations,” Federal Energy Regulatory Commission, last modified June 28, 2010, http://www.ferc.gov/legal/maj-ord-reg/land-docs/ceii-rule.asp
12 “Standard TPL-001-4 — Transmission System Planning Performance Requirements,” North American Electricity Reliability Council, http://www.nerc.com/_layouts/PrintStandard.aspx?standardnumber=TPL-001-4&title=Transmission%20System%20Planning%20Performance%20Requirements&jurisdiction=United%20States.
13 “Datasets,” Western Electricity Coordinating Council, accessed November 1, 2016, https://www.wecc.biz/SystemAdequacyPlanning/Pages/Datasets.aspx. See also: “Scenario Planning,” Western Electricity Coordinating Council, accessed November 1, 2016, https://www.wecc.biz/SystemAdequacyPlanning/Pages/Scenario-Planning.aspx.
14 “Calendar,” Western Electricity Coordinating Council, https://www.wecc.biz/Pages/Calendar.aspx.
27
Principles for Increasing the Accessibility and
Transparency of Power System Planning
15 Thomas Carr, “Evolution of Grid Planning in the West” (presented at CREPC/WIRAB Meeting, Salt Lake City, UT, April 27, 2016), 12, accessed July 26, 2016, http://westernenergyboard.org/wp-content/uploads/2016/04/04-27-16_CREPC_WIRAB_carr_future_interconnection_wide_planning_analysis.pdf.
16 Northwest Power and Conservation Council, Seventh Northwest Conservation and Electric Power Plan (Portland, Oregon: Northwest Power and Conservation Council, February, 2016), 1-1, accessed July 26, 2016, http://www.nwcouncil.org/media/7149940/7thplanfinal_allchapters.pdf.
17 Northwest Power and Conservation Council, Seventh Northwest Conservation and Electric Power Plan (Portland, Oregon: Northwest Power and Conservation Council, February, 2016), 1-5, accessed July 26, 2016, http://www.nwcouncil.org/media/7149940/7thplanfinal_allchapters.pdf.
18 Peter Evans, “Consultant Report prepared for the California Energy Commission: Regional Transmission and Distribution Network Impacts Assessment for Wholesale Photovoltaic Generation,” August, 2014, Contract Number: 800-10-001; WA1930.007, http://www.energy.ca.gov/2014publications/CEC-200-2014-004/CEC-200-2014-004.pdf.
19 “High-Definition™ Network Model” New Power Technologies, http://www.newpowertech.com/energynetplatform/highdefinitionwideareanetworkmodel.html.
20 “Distribution System Analysis,” Eaton, accessed November 1, 2016, http://www.cyme.com/software/cymdist/.
21 “EasyPower® Electrical Software,” Easy Power, http://www.easypower.com/products/EasyPower/EasyPower_family.php
22 “Simulation Tool – OpenDSS,” Electric Power Research Institute, http://smartgrid.epri.com/SimulationTool.aspx
23“GridLAB-D,” last updated December, 2012, http://www.gridlabd.org/
24 K. P. Schneider, Y. Chen, D. Engle, and D. Chassin, “A Taxonomy of North American Radial Distribution Feeders,” (presented at 2009 IEEE PES General Meeting); see also, K. Schneider, Y. Chen, D. Chassin, R. Pratt, D. Engel, and S. Thompson, Modern Grid Initiative Distribution Taxonomy Final Report (Richland, WA: Pacific Northwest National Laboratory, 2008), http://www.gridlabd.org/models/feeders/taxonomy_of_prototypical_feeders.pdf.
25 Paul Ciampoli, “FERC examines seams coordination between MISO and PJM,” Public Power Daily, January 27, 2015, http://www.publicpower.org/media/daily/ArticleDetail.cfm?ItemNumber=43054
26 “Pacific Northwest Power Supply Adequacy Assessment for 2020-21,” Northwest Power and Conservation Council, May 6, 2015, http://www.nwcouncil.org/energy/powersupply/2015-05/
27“Energy Imbalance Market (EIM) Overview” California Independent System Operator,
https://www.caiso.com/informed/Pages/EIMOverview/Default.aspx
28 California ISO, “ISO Markets and Energy Imbalance Market Update.” (Folsom, CA: California ISO, July 12, 2016), 3, accessed November 1, 2016, https://www.wecc.biz/Administrative/WECC%20MIC%20Update%2020160712.pdf. See also: FERC, “Commission Staff Paper: Qualitative Assessment of Potential Reliability Benefits from a Western Energy Imbalance Market.” (Washington, DC: FERC, February 26, 2013), accessed November 1, 2016, http://www.caiso.com/Documents/QualitativeAssessment-PotentialReliabilityBenefits-WesternEnergyImbalanceMarket.pdf.
29 California Public Utilities Commission,” CPUC Ensures Customers Continue to Benefit from Going Solar by Approving New Net Metering Guidelines.” (San Francisco, CA: California Public Utilities Commission, January 28, 2016), accessed November 1, 2016, http://docs.cpuc.ca.gov/PublishedDocs/Published/G000/M158/K181/158181664.PDF.
30 State of Nevada Public Utilities Commission, “PUCN to Consider Revised Rates for Customers Who Participate in Net Energy Metering.” (Carson City, NV: State of Nevada Public Utilities Commission, December 21, 2015), accessed November 1, 2016, http://pucweb1.state.nv.us/PDF/AXImages/PRESS_RELEASES/300.pdf.
31 Fairley, P. “Zombie Coal Plants Reanimated to Stabilize the Grid,” IEEE Spectrum, July 24, 2015, accessed December 20, 2016, http://spectrum.ieee.org/energy/the-smarter-grid/zombie-coal-plants-reanimated-to-stabilize-the-grid. See also: Rob D’Aquila, “Examining Reliability with High Renewables and Coal Retirements: Experiences from Recent Studies” (Presented at the Joint CREPC-SPSC-WIRAB Meeting, San Diego, California, October 29, 2015), 4, 4, 23, http://westernenergyboard.org/wp-content/uploads/2015/10/10-30-15_CREPC-SPSC-WIRAB_daquila_examining_reliability_high_renewables_and_coal_retirements.pdf.
32 Rob D’Aquila, “Examining Reliability with High Renewables and Coal Retirements: Experiences from Recent Studies” (Presented at the Joint CREPC-SPSC-WIRAB Meeting, San Diego, California, October 29, 2015), 4, 4, 23, http://westernenergyboard.org/wp-content/uploads/2015/10/10-30-15_CREPC-SPSC-WIRAB_daquila_examining_reliability_high_renewables_and_coal_retirements.pdf.
33 FERC, “Staff White Paper on Guidance Principles for Clean Power Plan Modeling.” Appendix A. Docket No. AD16-14-000. https://www.ferc.gov/legal/staff-reports/2016/modelingwhitepaperAD16-14.pdf. Accessed March 17, 2016.
28
34 “Western Wind and Solar Integration Study,” National Renewable Energy Laboratory, accessed November 1, 2016, http://www.nrel.gov/grid/wwsis.html.
35 Wesley Cole, Trieu Mai, Jeffrey Logan, Daniel Steinberg, James McCall, James Richards, Benjamin Sigrin, and Gian Porro, 2016 Standard Scenarios Report: A U.S. Electricity Sector Outlook (Golden, CO: National Renewable Energy Laboratory, 2016), NREL/TP-6A20-66939, http://www.nrel.gov/analysis/data_tech_baseline.html.
36 Wesley Cole, Trieu Mai, Jeffrey Logan, Daniel Steinberg, James McCall, James Richards, Benjamin Sigrin, and Gian Porro, 2016 Standard Scenarios Report: A U.S. Electricity Sector Outlook (Golden, CO: National Renewable Energy Laboratory, 2016), NREL/TP-6A20-66939, vii, http://www.nrel.gov/docs/fy17osti/66939.pdf.
37 D. Lew, G. Brinkman, E. Ibanez, A. Florita, M. Heaney, B.-M. Hodge, M. Hummon, G. Stark, J. King, S.A. Lefton, N. Kumar, D. Agan, G. Jordan, and S. Venkataraman, The Western Wind and Solar Integration Study Phase 2 (Golden, CO: National Renewable Energy Laboratory, 2013), NREL/TP-5500-55588, http://www.nrel.gov/docs/fy13osti/55588.pdf. See also: Bloom et al., Eastern Renewable Generation Integration Study (Golden, CO: National Renewable Energy Laboratory, August 2016), http://www.nrel.gov/grid/ergis.html.
38 G. Brinkman, J. Jorgenson, A. Ehlen, and J. Caldwell, “Lowe Carbon Grid Study: Analysis of a 50% Emissions Reduction in California,” (Golden, CO: National Renewable Energy Laboratory, November 2016), vii, accessed November 1, 2016, http://www.nrel.gov/docs/fy16osti/64884.pdf.
39 N. W. Miller, M. Shao, S. Pajic, and R. D’Aquila, Western Wind and Solar Integration Study Phase 3 – Frequency Response and Transient Stability, (Golden, CO: National Renewable Energy Laboratory, 2014), NREL/SR-5D00-62906, http://www.nrel.gov/docs/fy15osti/62906.pdf.
40 “Gas-Electric Documents,” Eastern Interconnection Planning Collaborative, accessed November 1, 2016, http://www.eipconline.com/gas-electric-documents.html.
41 “AB-327 Electricity: Natural Gas: Rates: Net Energy Metering: California Renewables Portfolio Standard Program,” State of California Legislative Information, §8, accessed August 1, 2016, https://leginfo.legislature.ca.gov/faces/billNavClient.xhtml?bill_id=201320140AB327.
42 “AB-327 Electricity: Natural Gas: Rates: Net Energy Metering: California Renewables Portfolio Standard Program,” State of California Legislative Information, §8, accessed August 1, 2016, https://leginfo.legislature.ca.gov/faces/billNavClient.xhtml?bill_id=201320140AB327. See also “DRP Proceeding Overview,” State of California Public Utilities Commission, accessed August 1, 2016, http://www.cpuc.ca.gov/General.aspx?id=5071.
43 “PG&E’s Distribution Resources Plan Webinar” PG&E, 5, accessed August 1, 2016, http://www.cpuc.ca.gov/WorkArea/DownloadAsset.aspx?id=5140.
44 “PG&E’s Distribution Resources Plan Webinar” PG&E, 6, accessed August 1, 2016, http://www.cpuc.ca.gov/WorkArea/DownloadAsset.aspx?id=5140.
45 “PG&E’s Distribution Resources Plan Webinar” PG&E, 14, accessed August 1, 2016, http://www.cpuc.ca.gov/WorkArea/DownloadAsset.aspx?id=5140.
46 “PG&E’s Distribution Resources Plan Webinar” PG&E, 14, accessed August 1, 2016, http://www.cpuc.ca.gov/WorkArea/DownloadAsset.aspx?id=5140.
47 “PG&E’s Distribution Resources Plan Webinar” PG&E, 19, accessed August 1, 2016, http://www.cpuc.ca.gov/WorkArea/DownloadAsset.aspx?id=5140.
48 “6.3 Electric-Gas Coordination,” MISO, accessed August 1, 2016, http://www.misomtep.org/electric-gas-coordination/.
49 “6.3 Electric-Gas Coordination,” MISO, accessed August 1, 2016, http://www.misomtep.org/electric-gas-coordination/.
50 Gregory Peters, Gas and Electric Infrastructure Interdependency
Analysis (Richmond, VA: EnVision Energy Solutions, 2012), accessed August 1, 2016, https://www.misoenergy.org/Library/Repository/Communication%20Material/Key%20Presentations%20and%20Whitepapers/Natural%20Gas-Electric%20Infrastructure%20Interdependency%20Analysis_022212_Final%20Public.pdf.
51 Midcontinent Independent System Operator (MISO), Gas-Electric Infrastructure Analysis Phase 1 and Phase 2: 2011–2030, MISO Region. (MISO: Carmel, IN, 2012), 3, accessed August 1, 2016, https://www.misoenergy.org/Library/Repository/Communication%20Material/Key%20Presentations%20and%20Whitepapers/Overview%20Phase%202%20Gas%20Electric%20Instrastructure%20Analysis.pdf.
52 Midcontinent Independent System Operator (MISO), Gas-Electric Infrastructure Analysis Phase 1 and Phase 2: 2011–2030, MISO Region. (MISO: Carmel, IN, 2012), 3, accessed August 1, 2016, https://www.misoenergy.org/Library/Repository/Communication%20Material/Key%20Presentations%20and%20Whitepapers/Overview%20Phase%202%20Gas%20Electric%20Instrastructure%20Analysis.pdf.
29
Principles for Increasing the Accessibility and
Transparency of Power System Planning
53 “6.3 Electric-Gas Coordination,” MISO, accessed August 1, 2016, http://www.misomtep.org/electric-gas-coordination/.
54 “6.3 Electric-Gas Coordination,” MISO, accessed August 1, 2016, http://www.misomtep.org/electric-gas-coordination/.
55 Gregory L. Peters, Justin Carlson, Rick Notarianni, and Jeff Moore, Phase III: Natural Gas-Fired Electric Power Generation Infrastructure Analysis; An Analysis of Pipeline Capacity Availability (Midcontinent Independent Transition System Operator, 2013), https://www.misoenergy.org/Library/Repository/Communication%20Material/Key%20Presentations%20and%20Whitepapers/Phase%20III%20Gas-Electric%20Infrastructure%20Report.pdf.
56 “MTEP15 Chapter 6.3 Gas-Electric Coordination,” MISO, accessed August 1, 2016, http://www.misomtep.org/electric-gas-coordination-mtep15/.
57 Gregory L. Peters, Justin Carlson, Rick Notarianni, and Jeff Moore, Phase III: Natural Gas-Fired Electric Power Generation Infrastructure Analysis; An Analysis of Pipeline Capacity Availability (Midcontinent Independent Transition System Operator, 2013), 123, https://www.misoenergy.org/Library/Repository/Communication%20Material/Key%20Presentations%20and%20Whitepapers/Phase%20III%20Gas-Electric%20Infrastructure%20Report.pdf.
58 “MTEP15 Chapter 6.3 Gas-Electric Coordination,” MISO, accessed August 1, 2016, http://www.misomtep.org/electric-gas-coordination-mtep15/.
59 “PLEXOS® Integrated Energy Model,” Energy Exemplar Pty. Ltd., accessed August 1, 2016, http://energyexemplar.com/software/plexos-desktop-edition/.
60 “MTEP15 Chapter 6.3 Gas-Electric Coordination,” MISO, accessed August 1, 2016, http://www.misomtep.org/electric-gas-coordination-mtep15/.
61 “6.3 Electric-Gas Coordination,” MISO, accessed August 1, 2016, http://www.misomtep.org/electric-gas-coordination/.
62 “6.3 Electric-Gas Coordination,” MISO, accessed August 1, 2016, http://www.misomtep.org/electric-gas-coordination/.
63 “Electricity and Natural Gas Markets Align,” MISO, accessed August 1, 2016, http://www.misomatters.org/2016/04/electricity-and-natural-gas-markets-align/.
64 “Electricity and Natural Gas Markets Align,” MISO, accessed August 1, 2016, http://www.misomatters.org/2016/04/electricity-and-natural-gas-markets-align/.
65 Annual Technology Baseline, National Renewable Energy Laboratory, 2016, http://www.nrel.gov/analysis/data_tech_baseline_legacy.html.
66 G. Lemler, WECC Anchor Data Set Proposal (Western Electricity Coordinating Council, 2016), https://www.wecc.biz/Administrative/Anchor%20Data%20Set%20Proposal%20v4.pdf.
67 C. Draxl, B. M. Hodge, A. Clifton, and J. McCaa, “The Wind Integration National Dataset (WIND) Toolkit,” Applied Energy 151 (2015): 355–366, http://dx.doi.org/10.1016/j.apenergy.2015.03.121; see also M. Sengupta, A. Weekley, A. Habte, A. Lopez, C. Molling, A. Heidinger, Validation of the National Solar Radiation Database (NSRDB) (2005‒2012): Preprint (Golden, CO: National Renewable Energy Laboratory, 2015), NREL/CP-5D00-64981, http://www.nrel.gov/docs/fy15osti/64981.pdf.
68 Aaron Bloom, Aaron Townsend, David Palchak, Josh Novacheck, Jack King, Matthew O’Connell, Eduardo Ibanez, Gary Jordan, Clayton Barrows, Marissa Hummon, and Caroline Draxl, Eastern Renewable Generation Integration Study (Golden, CO: National Renewable Energy Laboratory, 2016), NREL/TP-6A20-64472, http://www.nrel.gov/docs/fy16osti/64472.pdf.