
Princeton University Facilities EngineeringPrinceton University Facilities Engineering Environmental...
14
1 Princeton University Facilities Engineering Environmental & Energy Study Institute International District Energy Association District Energy & Combined Heat & Power at Princeton University Rayburn House Office Building Tuesday, April 21, 2009 Ted Borer, PE, CEM, LEED AP [email protected] Overview Campus Energy Demands E Pl t & Di t i t E S t Energy Plant & District Energy Systems Combined Heat and Power Production Plant Economic Dispatch Historic & Projected Emissions Opportunities
Transcript of Princeton University Facilities EngineeringPrinceton University Facilities Engineering Environmental...
1
Princeton University Facilities Engineering
Environmental & Energy Study Institute
International District Energy Association
District Energy & Combined Heat & Power
at Princeton University
Rayburn House Office Building
Tuesday, April 21, 2009
Ted Borer, PE, CEM, LEEDAP
Overview
Campus Energy Demands
E Pl t & Di t i t E S t Energy Plant & District Energy Systems
Combined Heat and Power Production
Plant Economic Dispatch
Historic & Projected Emissions
Opportunitiespp

2
Energy Demands at Princeton
> 150 Buildings
Academic
Research
Administrative
ResidentialResidential
Athletic
Energy Equipment & Peak Demands
Electricity Rating Peak Demand (1) Gas Turbine Generator 15 MW 27 MW( )
Steam Generation (1) Heat Recovery Boiler 180,000 #/hr (2) Auxiliary Boilers 300,000 #/hr 240,000 #/hr
Chilled Water Production (3) Steam Driven Chillers 10 100 Tons (3) Steam-Driven Chillers 10,100 Tons (5) Electric Chillers 10,700 Tons 13,800 Tons
(1) Thermal Storage Tank 40,000 Ton-hours *peak discharge 10,000 tons (peak)
3
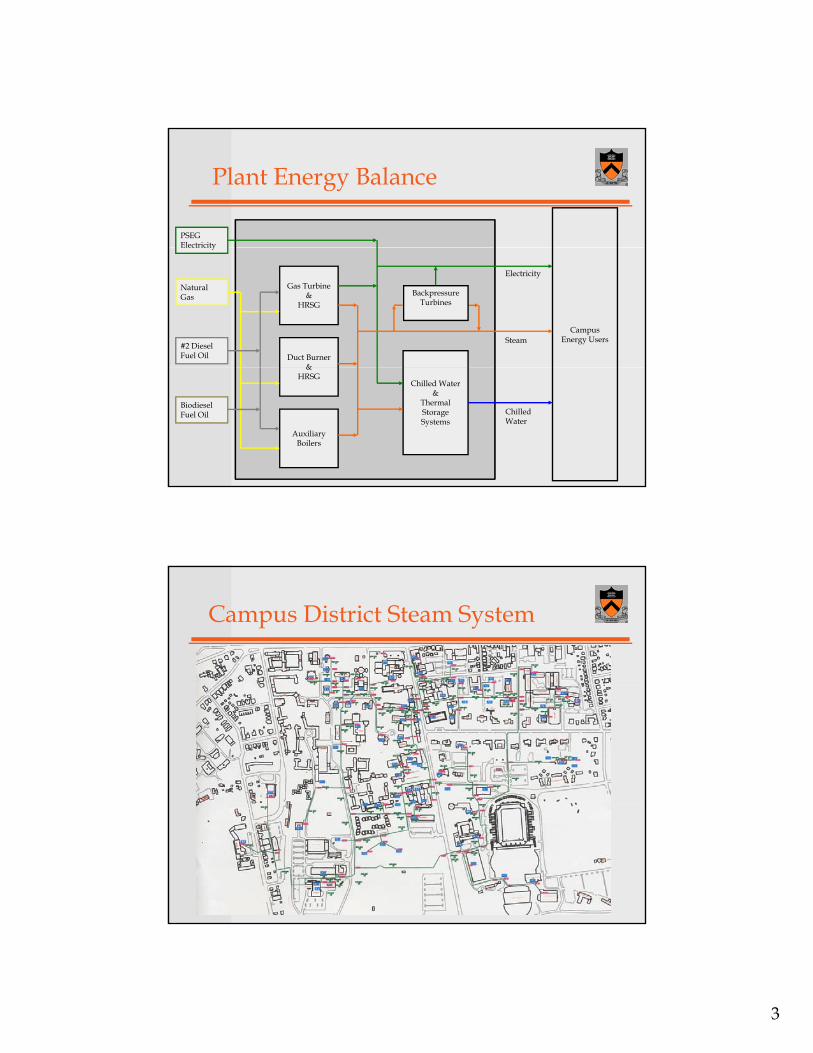
Plant Energy Balance
PSEG Electricity
CampusEnergy Users
Gas Turbine&
HRSG
Duct Burner &
Electricity
Natural Gas
#2 Diesel Fuel Oil
Electricity
Steam
Backpressure Turbines
Chilled Water&
Thermal StorageSystems
&HRSG
AuxiliaryBoilers
ChilledWater
Biodiesel Fuel Oil
Campus District Steam System

4
Power T rbine
Fuel & Water
Combined Cycle “Cogeneration”
Gas Turbine
Turbine
Gearbox Electric Generator
Hot exhaust Gas
CO Catalyst
AC ElectricityAir
SteamFeed WaterHeat Recovery Boiler
Exhaust Gas
Princeton Power Demand With Cogen Dispatch To Minimize Cost
18
20
Generation
Campus Demand
6
8
10
12
14
16
Me
ga
wa
tts
.
p
Power Purchase
-2
0
2
4
6
08 Jul 05 08 Jul 05 09 Jul 05 09 Jul 05 10 Jul 05 10 Jul 05 11 Jul 05
5
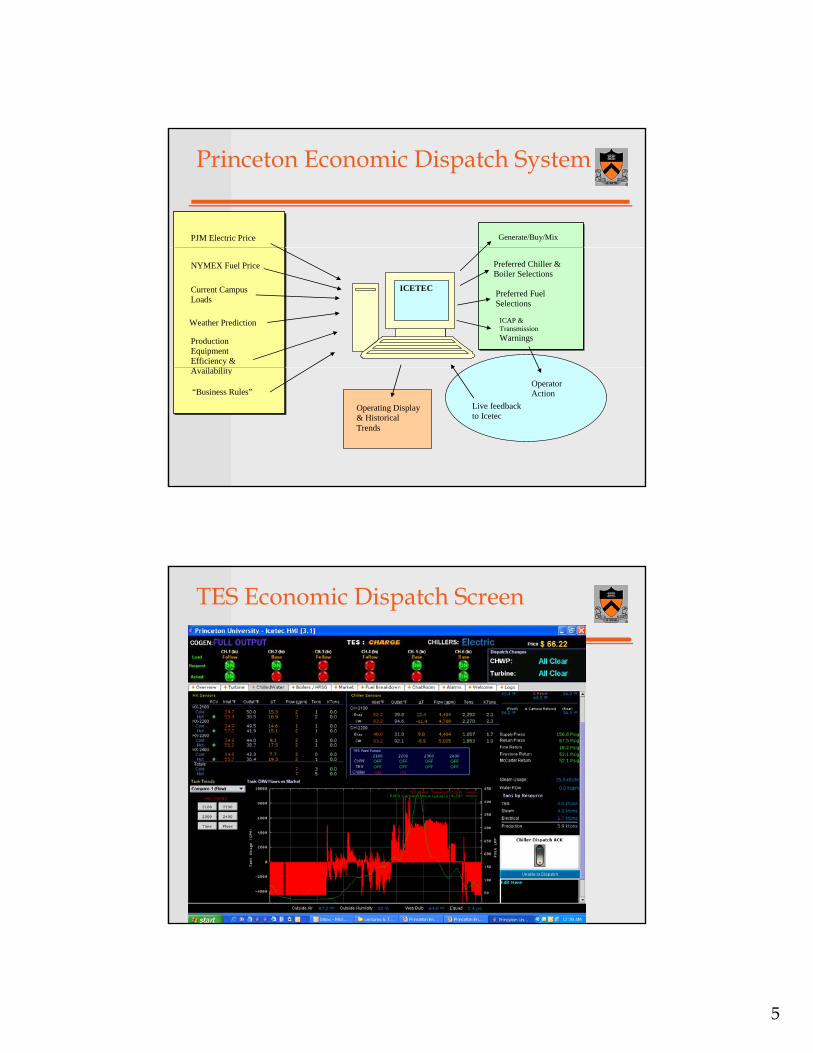
Princeton Economic Dispatch System
PJM Electric Price Generate/Buy/Mix
ICETEC
NYMEX Fuel Price
Current Campus Loads
Weather Prediction
Production Equipment Efficiency &
Preferred Chiller & Boiler Selections
Preferred Fuel Selections
ICAP & Transmission Warnings
Availability
“Business Rules”
Operating Display & Historical Trends
Live feedback to Icetec
Operator Action
TES Economic Dispatch ScreenTES Economic Dispatch Screen

6
THIS Is The Smart Grid
2005 Peak Grid Demand Hour: 27MW
2006 Peak Grid Demand Hour: 2 MW 2006 Peak Grid Demand Hour: 2 MW
This frees 25 MW of system capacity for use elsewhere by the local grid – and saves $$$!
HOW?...
CHP Power Generation
Steam-Driven Cooling
Thermal Storage
Demand-Side Management
Climate Change Legislation
Comparison of Legislative Climate Change Targets in the 110th Congress 1990 - 2050
Princeton Historic % of 1990 CO2
8,000
10,000
12,000
14,000
120%
140%
160%
180%
200%
220%
O2e
U
S E
mis
sio
ns
.Business as UsualBingaman-Specter w/ price CapBingaman-Specter, conditional targetLieberman-McCain and Oliver GilchrestLieberman-Warner draft outlineBingaman-Specter no price capKerry-SnoweSanders-Boxer, WaxmanKyoto ProtocolNJ Executive Order 54 (linear change)
-
2,000
4,000
6,000
0%
20%
40%
60%
80%
100%
1990 2000 2010 2020 2030 2040 2050
Mil
lio
n m
etri
c T
on
s C
O
Legislative source data estmated from World Resources Institute http://www.wri.org/usclimatetargets

7
Reduced Chilled Water Use
Princeton University Chilled Water Load Growth
40M
illi
on
s 12
Mil
lio
ns
15
20
25
30
35
Ch
illed
Wat
er U
se (
To
n-H
ou
rs)
6
8
10
amp
us
Flo
or
Are
a (S
q.F
t.)
0
5
10
FY 88
FY 89
FY 90
FY 91
FY 92
FY 93
FY 94
FY 95
FY 96
FY 97
FY 98
FY 99
FY 00
FY 01Fy 0
2Fy 0
3Fy 0
4Fy 0
5Fy 0
6Fy 0
7Fy 0
8
Year
An
nu
al C
-
2
4 Ca
Chilled Water
Bldg Sq.Ft.
Reduced Annual Steam Energy
Princeton University Annual Steam Use
900
1,000
Mil
lio
ns 12
Mil
lio
ns
400
500
600
700
800
900M
An
nu
al S
team
Use
(lb
s)
6
8
10
Mam
pu
s F
loo
r A
rea
(sq
.ft.
)
0
100
200
300
FY 88
FY 89
FY 90
FY 91
FY 92
FY 93
FY 94
FY 95
FY 96
FY 97
FY 98
FY 99
FY 00
FY 01
Fy 02
Fy 03
Fy 04
Fy 05
Fy 06
Fy 07
Fy 08
Fiscal Year
A
-
2
4 Ca
Steam Use
Floor Area

8
FY 2008 Summary
Goal: Return to 1990 CO2 emissions by 2020.
1990 Baseline: 105,000 short tons
FY 2007: 145,000 short tons
FY 2008: 128,000 short tons
12% improvement this year due to:12% improvement this year due to:
Improved energy production and delivery
Repairs & upgrades
Economic dispatch
PSEG accounting correction
2007 & 2008Energy Delivered & CO2 Emissions – Common Units
60 000
70,000
600 000
700,000
20,000
30,000
40,000
50,000
60,000
200,000
300,000
400,000
500,000
600,000
2007 2008
2007 2008
0
10,000
20,000
-
100,000
200,000
Million Btu Million Btu Million Btu Short Tons CO2
Short Tons CO2
Short Tons CO2
Delivered Power
Delivered Steam
Delivered Chilled Water
. Delivered Power
Delivered Steam
Delivered Chilled Water

9
2008 vs. 2007 Changes
We purchased less energy but delivered more of it to campus.
Purchased power is ~1/3 of our CO2. PSEG changed CO2 accounting methodology to better reflect the mix of power delivered. That reduced our purchased power emission rate by 16%.
Campus power consumption (outside the plant) was reduced by ~ 5%.
There were 5% more heating & 2% more cooling degree-days ’08 vs.’07
We burned half as much diesel fuel and a little less natural gas.
We reduced thermal losses through repairs, insulation, trap & valve upgrades.
W i d d t f 67% t 83% We improved condensate recovery from 67% to 83%.
We ran the cogeneration system at a higher average efficiency (fewer hours on-line at low efficiency).
We used more “free cooling” and a lower-emission mix of chillers; (1% less steam and 14% more electric).
We used economic dispatch more effectively.
CO2 Reduction Goals
Low Flow Fixtures, 1% Lighting, 9%
HVAC/GSHP, 17%
Utilit Grid Red ctions
Unknown/Future Technology, 25%
Energy Conservation, 8%
Thermal Distribution Improvements, 8%Plant Efficiency, 14%
Biodiesel, 9%
Utility Grid Reductions, 9%

10
Ongoing Opportunities
Ground Source Heat Pumps Ground Source Heat Pumps
Backpressure Steam Turbine-Generators
Cogen Plant Efficiency Upgrades
Real-time emissions calculation
CHW-HTW Heat Pumps
Biodiesel
Energy Star & Smart Start Programs
Thank you

11
CO2 Emissions by Source
140
150
san
ds
Campus CO2 Emissions
70
80
90
100
110
120
130
rbo
n D
ioxi
de
Em
issi
on
sT
ho
us
-
10
20
30
40
50
60
1990 1991 1992 1993 1994 1995 1996 1997 1998 1999 2000 2001 2002 2003 2004 2005 2006 2007 2008
Sh
ort
To
ns
Ca
Net electric purchase (PSEG data)
Natural gas combustion
#6 oil combustion
#2 oil combustion
Gasoline combustion
Backpressure Turbine - Generators

12
Chilled Water Campus Loop
Warm vapor
Chiller Cooling Tower
Cool ~ 70 F
Cold water To Campus ~ 41 F
Warm water from campus ~ 56 F Hot ~ 90 F
Warm vapor
Warm water from HTX or tank ~ 56° F
Warm
Chilled Water Thermal Storage
Thermal Storage Tank
water from Campus ~ 58° F
Cold water
Chiller Cooling Tower
Hot
Cool
Cold water To HTX or tank ~ 32° F Plate & Frame Heat Exchanger
To Campus ~ 34° F

13
TES Tank Stratification
Reducing Cost and Emissions with TES
Purchase daily power at least cost Reduce energy use gy
High efficiency equipment selection Equipment operates at full load design point More efficient: lower night time wet-bulb temperature Reduced transmission losses Lower storage temp increased campus differential
temperature lower pumping energy required
Increase Reliability and Ease of Operation Increase Reliability and Ease of Operation De-coupled production from demand Increase night-time load, reduced daytime load Easier daytime maintenance Reduced peak demand Excellent low-load performance

14
Growing Electrical Demand
Princeton University Electrical Use Growth
160 12
Mil
lio
ns
60
80
100
120
140
l Ele
ctri
cal U
sag
e (1
000
Mw
h)
6
8
10
M
amp
us
Flo
or
Are
a (s
q.f
t.)
0
20
40
FY 8
8
FY 8
9
FY 9
0
FY 9
1
FY 9
2
FY 9
3
FY 9
4
FY 9
5
FY 9
6
FY 9
7
FY 9
8
FY 9
9
FY 0
0
FY 0
1
Fy 0
2
Fy 0
3
Fy 0
4
Fy 0
5
Fy 0
6
Fy 0
7
Fy 0
8
Fiscal Year
An
nu
al
-
2
4 Ca
Electric
Floor Area
Campus and CHW Power Use
Princeton University Electrical Usage
160
60
80
100
120
140
cal U
se
(
Mill
ion
Kw
h)
Main Campus Electric
Electric to CHW
Campus Elec w/o ChW Plant
Linear (Main Campus Electric)
0
20
40
FY
79
FY
80
FY
81
FY
82
FY
83
FY
84
FY
85
FY
86
FY
87
FY
88
FY
89
FY
90
FY
91
FY
92
FY
93
FY
94
FY
95
FY
96
FY
97
FY
98
FY
99
FY
00
FY
01
Fy
02
Fy
03
Fy
04
Fy
05
Fy
06
Fy
07
Fy
08
Fiscal Year
Ele
ctri
c
Load increase averages 2.8 M kwh per year as of fy 2002.


![[XLS]List of RPS Facilities - California Energy Commission · Web view604-638-5042 Santa Paula 60770A Ventura Regional Sanitation District Cuyama Solar Energy Project -Phase 2 Cuyama](https://static.fdocuments.net/doc/165x107/5b02b0897f8b9a84339001c4/xlslist-of-rps-facilities-california-energy-view604-638-5042-santa-paula-60770a.jpg)


