
Pricing Hybrid Securities: The Case of Malaysian ICULS
35
Munich Personal RePEc Archive Pricing Hybrid Securities: The Case of Malaysian ICULS Bacha, Obiyathulla I. INCEIF the Global University in Islamic Finance 2004 Online at https://mpra.ub.uni-muenchen.de/12764/ MPRA Paper No. 12764, posted 15 Jan 2009 15:29 UTC
Transcript of Pricing Hybrid Securities: The Case of Malaysian ICULS
Munich Personal RePEc Archive
Pricing Hybrid Securities: The Case of
Malaysian ICULS
Bacha, Obiyathulla I.
INCEIF the Global University in Islamic Finance
2004
Online at https://mpra.ub.uni-muenchen.de/12764/
MPRA Paper No. 12764, posted 15 Jan 2009 15:29 UTC
�������������� ������ ����
�� ���� �������������������
��������
������������ ��������������
�
�������������������������
���
�(First draft : January 2004)
(Revised : June 2004) ������
������������������ �����������������������������������������
����������� ��� ����������������� ������
������������� ���������������������� �������������� �����
������
����������������� ������
2
Abstract
This paper provides an indepth analysis of Irredeemable Convertible Unsecured Loan Stocks
or ICULS. A Malaysian variant of the convertible bond, ICULS are a hybrid security.
Despite their introduction and trading since the late 1980’s, not much work have been done
on them. This paper presents the first empirical evidence on the pricing of ICULS. We
propose a pricing model for ICULS, built on the replication technique of options. Using 30
months (2½ years) of daily price data, we test our model on a sample of 34 ICULS. Though
on average ICULS are underpriced by 2.3%, we find an equal number of under and
overpriced ICULS. Our findings show that not only does the market misprice ICULS, the
mispricing is sustained over quite a while. Infact, even over a one year window period,
marginal mispricing remains. We argue that issuers of ICULS benefit much more than
investors do.�
3
ICULS or Irredeemable Convertible Unsecured Loan Stocks appear to be a uniquely
Malaysian hybrid security. Aside from the fact that there are no equivalent instruments
traded elsewhere, there appears to be a dearth of literature and no systematic means of pricing
the ICULS traded. This, despite the fact the ICULS have been around since the late 1980’s,
are listed and exchange traded and have traded volumes much higher than other hybrids like
convertible bonds (CULS), warrants and derivative instruments like options. All of these
makes the study of ICULS interesting and worthwhile.
This paper presents the first empirical evidence on the pricing of ICULS. We
undertake a systematic evaluation of ICULS, identify its salient features and build a pricing
model based on the breakdown of cash flows. We next examine the pricing efficiency of the
market for ICULS by using our proposed model. We identify significant deviations in
pricing. When examined over time, we find a very slow reduction in mispricing.
Convergence towards equilibrium values takes place only after significant time lapse. We
next ask why, arbitrage, which could have quickly eliminated the inefficiencies has been
absent. We identify institutional and the regulatory frameworks that hinder arbitrage and
enable sustained mispricing.
That there has been no prior work on ICULS despite their relative popularity nor any
attempt at pricing them post issuance have been the motivation and justification for this
paper.
1.1 : What are ICULS?
An Irredeemable Convertible Unsecured Loan Stock (ICULS) is a hybrid instrument
that has the features of both debt and equity. In essence, it resembles a fixed income debt
4
instrument until converted into equity at predetermined dates, at or prior to maturity. At first
glance, one would be tempted to think of ICULS as being similar to Convertible Bonds.
Indeed, its two variants, CULS (Convertible Unsecured Loan Stocks), and RCLS
(Redeemable convertible Loan Stocks) can be considered the Malaysianised version of
convertible bonds. What differentiates RCLS/CULS from ICULS is that the latter is
“irredeemable” meaning, can never be redeemed for cash. The fact that ICULS must be
converted to the underlying stock, substantially changes the risk profile of an ICULS from
that of a convertible bond. As we will see later, this has important implications for cash flow
and pricing. Similar to convertible bonds, ICULS carry fixed interest, coupons, payable
either semi-annually or annually. It is unsecured and normally subordinated to all other
obligations of the company. ICULS have fixed maturity dates and holders of ICULS must
convert their ICULS into the underlying ordinary shares either at predetermined exercise
points before maturity or at maturity as specified by the issuer. Conversion is done
automatically, regardless of whether the holder of ICULS surrenders them or not. This
means that unlike convertible bonds where partial dilution is possible, ICULS ultimately
result in full dilution.
The price at which the ICULS can be converted into the underlying shares is
determined by the conversion price1. The conversion price can be satisfied by tendering the
ICULS or a combination of ICULS and cash. Thus, if the ICULS expires in-the-money,
given the predetermined conversion price, the holder receives the stipulated number shares
without having to pay anymore. On the other hand, should the ICULS expire out-of-the-
money, i.e. stock price is less than the conversion price, the holder will be required to pay the
1 The conversion price can be subject to adjustments under certain circumstances in accordance with the terms and
conditions set out in the document called trust deed.
5
difference between the conversion price and the stock price in order to receive the underlying
shares.
Thus, ICULS are never redeemable for cash. While a holder may delay conversion
when the ICULs is out of the money, he ultimately has to convert. ICULS have a nominal
value which is usually set at RM1.00 and are tradeable in board lots of RM1,000.00 nominal
amounts.
Any new shares issued upon conversion of ICULS will rank pari passu in all respects
with the then existing shares. However, the new shares will not be entitled to dividend,
rights, allotments or other distributional entitlements which are before the conversion date of
the ICULS. Neither would accrued interest since the last coupon date, be payable. As
ICULS are not redeemable for cash, the requirement for bond rating is exempted. This
enables companies with weak financial standing to gain access to finding new capital2.
In a sense both ICULS and RCLS are convertible bonds since they both begin as debt
securities. However, while RCLS like convertible bonds may be redeemed for cash, ICULS
always end up being converted to the underlying stock. Thus, the issuer of ICULS not only
has no further cash outflow at maturity but could potentially have inflows if the ICULS
expire out of the money.
Given that the motivation of this paper is to subject the market for ICULS, in
particular the pricing of these instrument, to rigorous analysis, we attempt the study by way
of addressing several research questions. Based on a survey of similar work, in particular on
2 On the other hand CULS or RCLS which like convertible bonds can be redeemed for cash require ratings prior to issuance.
6
convertible bonds in foreign markets, we designed the study to address the following five
research questions:
(i) How do we price an ICULs?
(ii) How efficient is the market in pricing ICULS?
(iii) If there is mispricing how sustained are the deviations?
(iv) How do the ICULS compare to the underlying stock in terms of returns and volatility?
(v) What are the key determinants of mispricing for ICULS?
A sixth, and obvious question would be the implications for policy from the above
findings. We address this in our concluding remarks. This paper is divided into five
sections. Section two below, is a review of relevant literature. Section 3, details our data and
methodology. The following section (Section 4), presents the results and analysis. The final
section, Section 5 concludes and discusses implications for policy.
SECTION 2 : Literature Review
Since ICULS are uniquely Malaysian and have not been previously researched, we
looked at literature on similar hybrid securities in other markets. Since the closest hybrid
security to ICULS is the convertible bond, we examined relevant literature on convertibles.
The literature reviewed below can be categorized into two broad categories, previous studies
on pricing and those that examine why companies issue convertibles and why investors buy
them. We then adapt the underlying logic/principles of these studies to our task of
investigating ICULS.

7
2.1: Pricing Mechanism and Efficiency of the Market for Convertibles
Among the earliest work on the pricing of convertible bonds were those of Brennan
and Schwartz (1977) and Ingersoll (1977a). They used the firm value as a stochastic variable
with credit risk being modeled endogenously by assuming that default occurs when the firm
value falls below the value of the debt.
In similar vein, McConnell and Schwartz (1986), present a pricing model based on
the stock value as stochastic variable. To account for credit risk, they use an interest rate that
is ‘grossed up’ to capture the default risk of the issuer rather than the risk-free rate. Since
they implicitly use a constant credit spread, they do not consider that the credit risk of a
convertible bond varies with respect to its moneyness.
Other researchers such as Bardhan et al (1993) and Tsiveriotis and Fernandes (1998)
proposed an approach that splits the value of a convertible bond into a stock component and a
straight bond component. These two components belong to different credit risk categories as
the former is risk free because a company is always able to deliver its own stock whereas the
latter is risky because coupon and principal payment depend on the issuer’s capability of
distributing the required cash amounts. It is easy to discount the stock part of the convertible
with the risk-free interest rate and the straight bond component with a risk-adjusted rate.
When the convertible is deep out of the money, the straight bond component is very high and
so is its defaultable part.
Ammann, Kind and Wilde (2003), propose another approach. They examine the
pricing of French convertible bonds to find out whether prices observed on secondary

8
markets are below their theoretical fair values. Instead of using a firm-value model, they
used stock-based binomial tree model with exogenous credit risk. They found that the
theoretical values for the convertible bonds were on average more than 3% higher than the
observed market prices. The difference between market and model prices is greater for out-
of-the-money convertibles than for at-or in-the money convertibles. Additionally, they find a
positive relationship between underpricing and maturity. Mispricing decreases as time to
maturity reduces. These findings are contrary to previous research on the subject by King
(1986) who found a negative relationship between underpricing and maturity where there is
increasing mispricing for bonds with shorter time to maturity.
Yigitbasiouglu (2002) studied the pricing of convertibles using a comprehensive
theoretical framework taking into account interest rate, equity, credit, currency and volatility
risk and employed a quasi five factor model incorporating most of the contractual features.
He observes that it was surprising that despite the huge USD 400 billion convertible bond
market, there is little consensus on the best way to price these instruments, unlike bonds or
other securities. He found that convertible bond prices display the same sensitivity to short
and medium term volatility as other exotics.
Greiner et. al. (2002) study 1,357 callable-convertible bonds in Japan and find
evidence of substantial underpricing. The underpricing grows as bonds age and remain
underpriced throughout the period of study from 1982 to 1992. Convertible bondholders
therefore responded to the extreme underpricing by choosing to convert to equity rather than
sell the bonds.
9
2.2: Reasons Why Firms Issue Convertible Bonds
The underlying reasons for firms to issue convertible bonds vary from being
‘backdoor equity’ to being a method to control sequential financing problem. Brennan and
Schwartz (1988) observed that “to the perplexity of academics, however, the popularity of
convertibles has shown little sign of abating. Consequently, we have been faced with the task
of finding a convincing explanation for the corporate use of convertible, one that is consistent
with rational investors and sophisticated financial markets”.
According to Stein (1992), convertible bond is actually a “backdoor equity” financing
technique. Corporations use it as an indirect way to get equity into their capital structures
particularly, when adverse-selection problems make a conventional stock issue unattractive.
In his model, he finds that the call feature is important to force investors to exercise their
conversion option early and to tempt them to swap their bonds for shares of stocks. This call
option is also valuable as it helps avoid possible financial distress.
Mayers (1998) viewed convertibles as a method to resolve the sequential financing
problem where managers have investment options with a future maturity date. If funds are
already available upfront for both the initial project and subsequent investment options, it
creates a conflict between managers who are the investment decision makers and their
shareholders. This conflict is similar to the overinvestment problem of Free Cash Flow
presented by Jensen (1986). Thus, convertible debt is an attractive alternative to straight
debt, as it can reduce issue costs and simultaneously control the overinvestment problem. In
Mayer’s model, the paramount purpose of a call provision is to provide flexibility for future
financing whenever the needs for funding profitable investment arises.
10
Isagawa (2000) found that convertible bonds are superior to common debt and equity
in controlling managerial opportunism. When managers have both empire-building
tendencies and fears of default, over-investment can occur under low debt levels and under-
investment occurs under high-debt levels. With convertible bonds, the firm can adjust its
debt levels via the conversion option and the inefficiencies caused by managerial
opportunism can be reduced.
Chang, Chen & Liu (2003), find further support for Mayer’s model in that, firms issue
convertible debt to minimize security issue costs and agency costs of over-investment. This
was particularly true for firms with promising growth opportunities to finance a sequence of
potential investment options. Bancel and Mittoo (2003) study 295 convertibles issued by 229
companies across 16 European countries. Their finding provides support for Stein (1992).
They conclude that firms issue convertible bond as a “delayed equity” which means that
firms already have the expectation that the debt would eventually be converted to equity.
They argue that most managers viewed convertible bonds as cheaper than straight debt and
value the delayed impact of convertibles on earnings per share dilution relative to the equity
alternative.
Convertibles also allow firms to take advantage of the tax deductibility of the coupon
payments until conversion occurs. As long as the firm ensures that all of the tax savings
obtained are not passed on to the convertible bondholders, it stands to increase the value of
existing equity by using convertible debt financing.
Convertible debt also allows companies to push their debt capacity beyond what is
normally considered acceptable by creditors, due to the expectation that with future
11
conversion, a consequent reduction in gearing is likely to occur. One of the main attraction
of convertible debt is that it can be self-liquidating whereas straight bond must be redeemed
at maturity.
If there are rational reasons why firms might want to issue hybrid instruments like
convertibles, there are similar reasons for why investors should want to invest in hybrids. A
hybrid instrument such as a convertible combines the fixed income certainly of a bond with
the right to participate in the potential capital appreciation of a company’s equity. In essence
a defensive form of equity exposure to a particular issuer. As Das (2001) puts it, convertible
bonds provide a middle ground between the relative stability of a fixed interest instrument
and the relative volatility of an equity instrument.
SECTION 3 : Data and Methodology
3.1: What differentiates ICULS from Convertible Bonds
Though, ICULS are a convertible security, they differ from conventional convertible
bonds in significant ways–especially from a cash-flow viewpoint. A convertible bond, in its
basic form is a combination of a straight bond and a call option on the issuing company’s
stock. Thus, the value of a convertible at exercise or maturity can be determined as follows;
Value of Convertible at Maturity / at Exercise.
[ ]
−++
++
= ∑= CP
FVxCPMPS
r
FV
r
Cn
nn
tt
t
)1()1(1
………………..(1)
OCPMPSts ;:. >

12
where;
tC = amount of coupon, nFV = Face Value of bond
r = discount rate /required return, MPS is current market price of stock and CP is the
conversion price.
Thus, the value of a convertible bond at maturity or at exercise (if exercise is before
maturity) is equal to the value of the straight bond and conversion premium. In Eq.(1); the
conversion premium is shown within brackets. This conversion value equals 0 if MPS, the
current market price of stock is less than its conversion price. In other words, conversion
premium is worthless if the convertible expires out of the money.
The value of the convertible bond prior to exercise / maturity is given by ;
[ ]ValueCallK
FV
K
Cn
nn
tt
t ++
++
= ∑= )1()1(1
………………(2)
What differentiates Eq. (2) from Eq. (1) is that the call value in Eq. (2) includes the
‘time value’ of the option whereas at maturity or at exercise time value is always zero. Since
time value is always positive before maturity3, the call value in Eq. (2) will always be greater
than the conversion value in Eq. (1).4
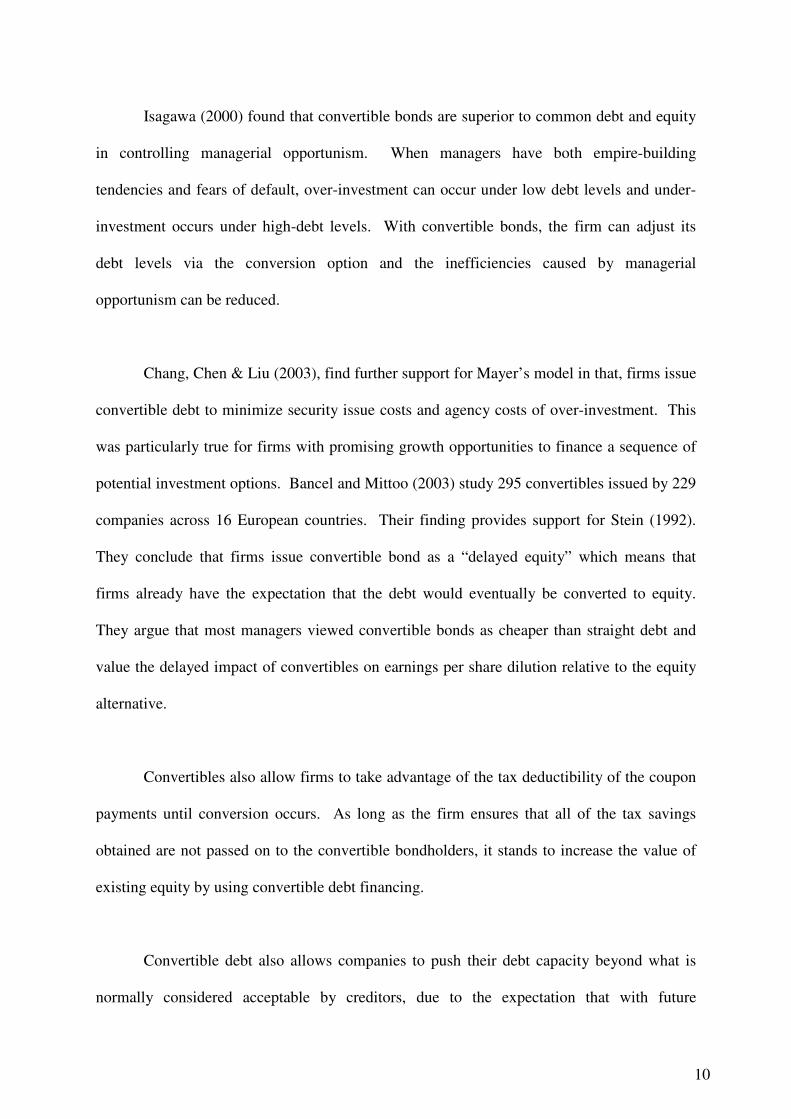
Fig. 1 below shows the value profile of a hypothetical convertible bond with the
following features; 3 years to maturity, annual coupon of 10%, FV of RM1,000, required
return, r of 12% and a conversion ratio of 200 common shares or conversion price of RM5.00
per share. (Note: The value of the straight bond using equations 1 or 2; will be RM951.96).
3 This is true even for deep out of the money options
4 The logic here is the same as that of why it never makes sense in normal circumstances to exercise early an American style
option.
13
Figure 1 – Conversion, Time and Total Value for A Convertible Bond
The payoff profile to the above convertible bond at maturity is given by Fig. 2 below.
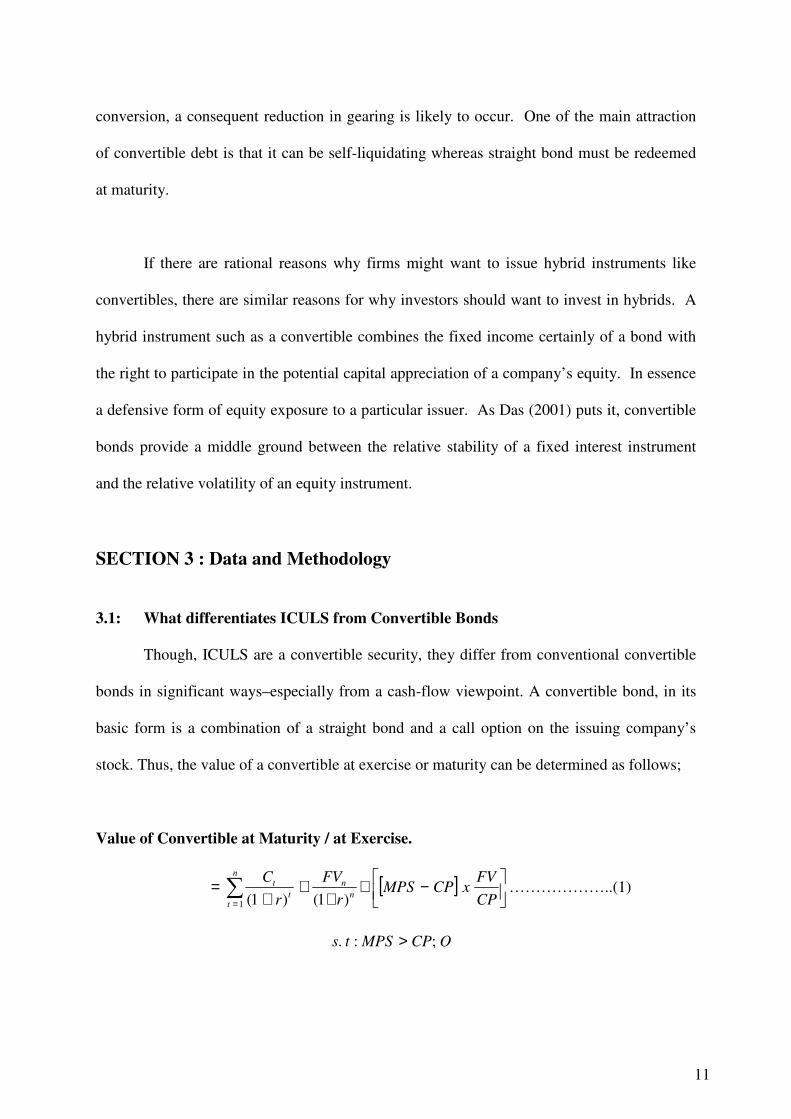
Figure 2 : Payoff Profile to Convertible Bond At Maturity
P/L
0
Notice from Fig. (2), that the payoff profile is a minimum RM1,000 for common stock values
below RM5.00 and higher for subsequent common stock values. Note that this is precisely
1,600
1,400
1,200
1,000
900
700
500
0 2 3 4 5 6 7 8 9 (RM)
Val
ue
of
Con
ver
tible
Bo
nd
(R
M)
Total Value Conversion Value
Straight Bond Value
Time Premium
Ex. Price
1,000
RM5
Val
ue
of
Con
ver
tible
Bo
nd
(R
M)
Price per share of Common Stock
14
the payoff profile to a combined Long Call position on the stock at an Exercise price of
RM5.00 and a long straight bond position with RM1,000 Face Value.
3.2: Payoff Profile to ICULS.
Recall from our description earlier that an ICULS provides fixed predetermined
interest payments, much like the coupon above and has a conversion feature. Thus, at first
glance it appears similar to a convertible bond. However, there is a key difference which
consequently leads to a very different payoff profile for ICULS. This key difference is the
fact that conversion is compulsory with ICULS. Unlike the convertible holder who can
decide between either receiving the face value of the bond or converting to stocks, the holder
of ICULS must convert to stocks even if it is unfavourable for him to do so. Thus if as in the
above example, an ICULS with a nominal value of RM1000 has a conversion ratio of 200
stocks implying a conversion price of RM5.00, the holder has no choice but receive the 200
underlying stocks even if their current market price is less then RM5.00. For example, if their
current market price was RM2.00, he effectively gets at maturity stocks worth RM400 when
converting the ICULS. Therefore unlike convertible bonds where loss is not possible and a
minimum value equivalent to the RM1,000 face value is received, there is no such guarantee
with ICULS. Losses are entirely possible.
Seen from the viewpoint of payoff profiles the ICULS has a risk profile similar to that
of a long stock position. In essence, when an investor buys an ICULS with a nominal value of
RM1,000, his exposure is essentially that of being invested in the stock for RM1,000.
Subsequent declines in stock prices hurt him while increases add to his potential profit. This
potential gain / loss is independent of the fixed interest income. Thus, the difference between
a long stock and long ICULS position is the fixed interest received on ICULS. Where the

15
ICULS has a zero coupon interest, the ICULS and long stock position would essentially be
the same in risk profile terms.
In terms of component parts, ICULS like convertible bonds, have two parts. A fixed
rate/annuity portion and a convertible portion. Algebraically;
CPr
CICULS
t
t ++
=∑)1(
………………(3)
where;
tC = annual coupon amount
r = required return
CP = Value of convertible portion
In terms of Cash flow/Payoff Profile these two components can be shown as follows:
Figure 3 – Payoff Profit to ICULS
Profit / Loss
RM5.00
0
-
RM5.00
Value of Annuity (Coupon)
RM5.00 RM10.00
Stock Value at Exercise
Value of
Convertible Portion
Combined Value of ICULS
16
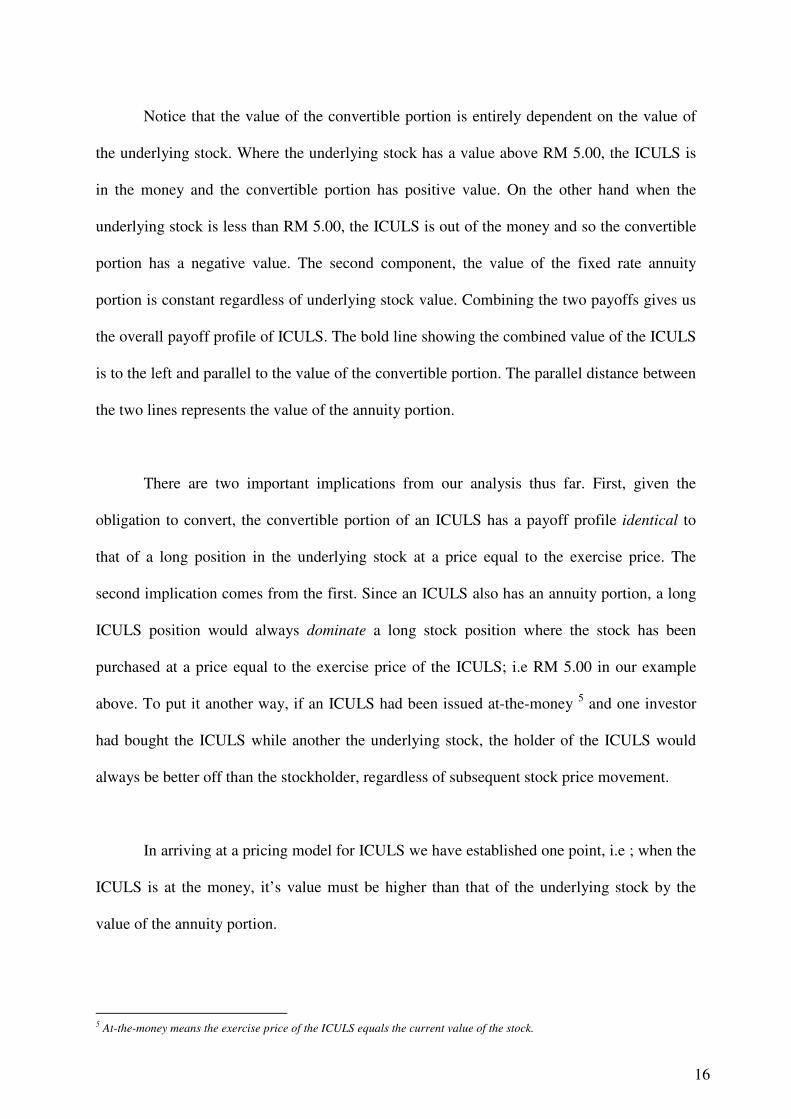
Notice that the value of the convertible portion is entirely dependent on the value of
the underlying stock. Where the underlying stock has a value above RM 5.00, the ICULS is
in the money and the convertible portion has positive value. On the other hand when the
underlying stock is less than RM 5.00, the ICULS is out of the money and so the convertible
portion has a negative value. The second component, the value of the fixed rate annuity
portion is constant regardless of underlying stock value. Combining the two payoffs gives us
the overall payoff profile of ICULS. The bold line showing the combined value of the ICULS
is to the left and parallel to the value of the convertible portion. The parallel distance between
the two lines represents the value of the annuity portion.
There are two important implications from our analysis thus far. First, given the
obligation to convert, the convertible portion of an ICULS has a payoff profile identical to
that of a long position in the underlying stock at a price equal to the exercise price. The
second implication comes from the first. Since an ICULS also has an annuity portion, a long
ICULS position would always dominate a long stock position where the stock has been
purchased at a price equal to the exercise price of the ICULS; i.e RM 5.00 in our example
above. To put it another way, if an ICULS had been issued at-the-money 5 and one investor
had bought the ICULS while another the underlying stock, the holder of the ICULS would
always be better off than the stockholder, regardless of subsequent stock price movement.
In arriving at a pricing model for ICULS we have established one point, i.e ; when the
ICULS is at the money, it’s value must be higher than that of the underlying stock by the
value of the annuity portion.
5 At-the-money means the exercise price of the ICULS equals the current value of the stock.
17
At the money;
ICULS – Stock Value = Value of annuity
or ICULS > Stock Value ; by the amount of annuity value.
3.3: A Pricing Model For ICULS
To arrive at a pricing model let us first summarize three key points from our analysis
above:
(i) for ICULS at the money, we know that the premium of the ICULS must be worth at
least the PV of the annuity. The PV of the annuity thus, establishes the lower
boundary.
(ii) to the above value of the PV annuity, we must account for the fact that since there is
time left to maturity, the ICULS could become in-the-money in the future (or
otherwise) and therefore be more (less) profitable. This probability that more (less)
profits are possible in the future has a value, and is denoted “time-value” in options
literature.
(iii) We know that with the exception of the annuity portion, ICULS have a payoff profile
exactly as a long underlying stock position established at a price equal to the exercise
price of the ICULS.
Taking all these into consideration, we turned to options literature on synthetics and
replication for a pricing model. As a derivative, but one with compulsory conversion, the
ICULS has a payoff profile similar to that of the long underlying position. Going by PUT-
CALL parity which is:
PCS −+= ……………………...(4)
18
or
PCr
KS
t−+=
+−
)1( ………………..(5)
One could argue that value of the convertible portion of an ICULS is equivalent to being long
an at-the-money, call and short an at-the-money put on the underlying stock. Thus, the value
of this convertible portion of the ICUL should equal the cost of the net premiums for the long
call and short put. Since the ICULS has a fixed annuity portion, we add to this net premium
the PV of annuity. Thus, the value of an ICULS given Eq. (5) is:
AnnuityofValuePCrKICULS t +−+=+− −)1( …………(6)
or rearranged as:
∑ ++++−+= −
t
tt
r
CrKPCICULS
)1()1( ……………(7)
where;
C = Value of an at the money Call on underlying
P = Value of an at the money Put on underlying stock
trK =+ )1( = PV of Exercise Price of Call/Put
tC = RM Amount of Coupon received on ICULS
Since the exercise of ICULS results in the issuance new shares, there obviously is dilution.
As conversion is compulsory, dilution is a certainly with ICULS. In accounting for this
dilution, we multiply Eq. (7) by the ratio of the number of outstanding stocks pre to post
dilution.
∏•
++++−+= ∑− θ
t
tt
r
CrKPCICULS
)1()1( ……………(8)
0:. >ICULts

19
where;
θ is the number of existing shares pre-dilution
Π is the number of shares post dilution
Π = (θ + No. of ICULS issued x Conversion Ratio)
The logic of Eq. (7) and (8) is straight forward. The long call, short put and PV of
Exercise price of options essentially replicate a long stock position. When the ICUL is in the
money, the call premium is higher while put premium low. This leads to a high value for the
ICULS. When the ICULS is out of the money, i.e; stock price is lower than ICULS exercise
price, the call’s value is lower whereas put value is high, thus the net premium would be
negative making the combined value of ICULS less than its annuity value. As in the case of
deep out of the money options, the ICULS cannot have negative values; thus the ‘subject to’
constraint.
In estimating the values of the call and Put Options in Equation (8), we use the
standard Black-Scholes Option Pricing Model (BSOPM). The parameter inputs such as
volatility, were estimated using the historical volatility of the underlying stock. Time to
maturity of the options equals the time to maturity of the ICULS. The prevailing 3 month
KLIBOR rate is used as estimate for the risk-free rate. Since both the options are assumed to
be at-the-money, their exercise price equals the exercise price of the ICULS6. Thus, the call
and Put Values are estimated respectively as Eq. (9) and (10).
6 Though restrictive, several of the assumptions underlying the BSOPM are congruent to ICULS. For example the
assumption of no dividends is appropriate since ICULS holders do not receive dividends paid on underlying stock. Credit
risk is irrelevant since, unlike convertible bonds where redemption for cash is possible and therefore a default by issuer,
ICULS are non redeemable for cash. Finally, though the assumption is of European style exercise and ICULS may be
exercised prior to maturity, early exercise is not advantageous here as in the case of American style options where no large
dividend payments are due. As in the case of American style options on non-dividend paying stocks, it is always more
sensible for the ICULS holder to sell rather than exercise the ICULS. As with options, selling lets him capture Time Value
which exercising would not.

20
)()( 21 dNKedNSC rt •−•= − ……………(9)
)()( 12 dNSdNKeP rt −•−−•= − ……………(10)
where;
if xdNthenxdN −=−= 1)(,)( 11
and;
( ) ( )[ ]
Tdd
T
Trk
sInd
σ
σ
σ
−=
++=
12
12
2
3.4: Data & Methodology
This study covers a period of two and a half years or 30 months from 2nd
January
2001 to 30th
June 2003. Daily price data of Irredeemable Convertible Unsecured Loan Stocks
(ICULS) and their underlying stocks were collected for the 30 month period. The ICULS
outstanding were identified from Investor’s Digest, a monthly publication of the Kuala
Lumpur Stock Exchange. There were a total of 53 different ICULS listed for trading.
However, of these 19 ICULS had to be dropped due to illiquid trading and / or other
problems of data. This left us with 34 ICULS to be included as sample for this study. Of
these 34 issues, 30 ICULS were issued by firms listed on the Main Board of the KLSE while
the remaining four, by Second Board Companies.
Table 1 in Appendix provides a list of our study sample. While most of the ICULS
were issued with 5 year maturity, several had 10 year maturity while two ICULS were each
21
of 3 year and 7 year maturity. Over the 30 month study period, a total of 11 ICULS matured
while 12 were newly issued during the study period.7
With the exception of 2 ICULS, all had fixed coupon rates. These range from 0.5% to
8%. Most were also exercisable at anytime until maturity. Table 2 in appendix shows the key
features of the 34 sample ICULS. In addition to these, the daily quotes of the 3 month
KLIBOR were collected. The average daily 3 month KLIBOR rate over the 30 month study
period was 3.03%. This was used as the input for the risk free rate in calculating the option
values.
In addressing our five research questions we use different methodologies as required.
In determining how to price an ICULS we use the earlier mentioned replication technique
We determine the theoretical value of an ICULS using Equation 8. In addressing question 2
and 3, we examine the extent of mispricing and the duration of mispricing; i.e how long does
it take for convergence. We calculate mispricing as follows;
100%*
*)(
xI
IImispricingdaily
a
t
−= ………… (11)
where; )(a
tI is the actual/quoted price of ICUL on day t.
*I is the theoretical price of ICUL from Eq. 8
In examining how sustained the mispricing is, we examine the percentage returns from a buy
ICULS, convert to stock at end of window and immediately sell the stock, trading strategy for
4 different window periods. These being one, three, six months and one year.
7 Thus, while many had 611 days of daily price data (full 30 months) others had less since due to their maturing or being
newly issued.

22
In identifying which parameters are key determinants of mispricing (question 5), we
estimate the coefficients of multiple regression model, regressing percentage mispricing on
parameters such as maturity, % dilution, size of coupon, moneyness, stock and ICULS
volatility and exercise style. Our model is specified as;
)12........(..............................).(7
.)(6
.)(5
)(4
%)(3
.)(%2
.)(1
%
teTypeConv
volSICULVolStockmoneyness
CoupondilMatMisp
++
+++
+++=
ββββ
βββα
The final variable is input as dummy variable with a value of one if conversion is fixed and 0
otherwise.
4. 0 : Results & Analysis
In this section we provide the results for the various tests / analysis described earlier.
For ease of elucidation we provide the results and analysis in the order of our five research
questions. The first question of how should we price an ICUL, has been answered. Our
proposed pricing model for ICULS is given in Eq. (8). We address our second research
question using Eq. (8).
So, how efficient is the market in pricing ICULS? Tables 3 and 4 provide the answer.
Table 3 shows the extent of mispricing among the 34 samples ICULS when our pricing
model is applied. The % mispricing has been ranked in ascending order. Interestingly, we
have an equal number of underpriced and overpriced ICULS, i.e. 17 underpriced while the
remaining 17 are overpriced. Our pricing model does not include transaction costs. Using a
23
liberal 2% margin on either side of the theoretical price to account for transaction costs, 32 of
the 34 ICULS, or 94% of the ICULS in our study are mispriced. The extent of mispricing, as
Table 3 shows, is indeed substantial. Ranging from –85% to 124%.
Table 4 shows the descriptive statistics for the overall sample and by category.
Overall, Malaysian ICULS are on average underpriced by about 2.3%. These results are
consistent with Amman et.al (2003), who find French convertible bonds to priced on average
3% lower than theoretical values and Greiner et.al (2002) who find underpricing of Japanese
convertible bonds. Though an average underpricing of 2.3% does not seem much, notice the
large standard deviation, the range of mispricing is indeed large. Columns (b) and (c) show
the breakdown by category. Underpriced ICULS have a mean underpricing of 43% while
overpriced ones, 38%. Thus, the mean mispricing of 2.3% hides substantial deviations in
pricing.
The results in Table 5, further confirm the extensiveness of mispricing. Recall the
argument in Section 3, that according to our pricing model, if an ICULS is issued at-the-
money, i.e. its exercise price equals the stock price at time of issue, than the ICULS should
always be worth more than the stock. Furthermore, since we had argued that a long position
in ICULS is equivalent to a long position in stock given compulsory conversion, their
valuations should be close. The difference being due to the fixed annuity portion of ICULS.
To see if ICULS prices and underlying stock prices are close, we checked the ratio of their
prices. Column (A) of Table 5 shows that on average, ICULS prices are only 80% of their
underlying stock’s prices. This despite their having a fixed annuity portion. Underpriced
ICULS (Column B) have prices approximately 60% lower than their underlying stock prices8.
8 Since the mean of the ratio is 41.7% in Column (B)

24
Overpriced ICULS have on average, prices 14% higher than their underlying stocks. While
these confirms that mispricing is indeed extensive, it also raises the question of why ICULS,
despite having a fixed annuity portion should be at such a substantial ‘discount’ to their
underlying shares. Since we are comparing actual prices relative to each other and not to a
theoretical price, the only logical explanation would be that most of the ICULS were issued
deep out of the money. That is, the exercise prices were set much higher than prevailing
stock price at time of ICULS issue. To see if this is true, we checked the moneyness of all
our ICULS. Table 6 shows the results as at 30th
June 2003, the last day of our study period.
With the exception of 5 ICULS, the remaining 29 or 85% of the ICULS were indeed out of
the money. Of the 5 that were in the money, three were only marginally so.
4.2 : Extent and Duration of Mispricing
If on average ICULS are underpriced relative to their stocks, then a trading strategy
that arbitrages between the two should provide superior returns. Additionally, wth arbitrage,
such pricing deviations should disappear quickly. To test if both these implications hold, we
examined the returns from a strategy of buying an ICULS holding it for a given window
period, then converting it to stock and selling the stock on the same day of exercise. To see if
such a strategy does indeed provide ‘superior’ returns, we compare it to returns from
investing in the underlying stocks; i.e. a simple buy & hold strategy for the same window
period9. Chart 1 below shows the results.
9 The last day of each window period corresponds with the last day of our study period; 30/6/03.
25
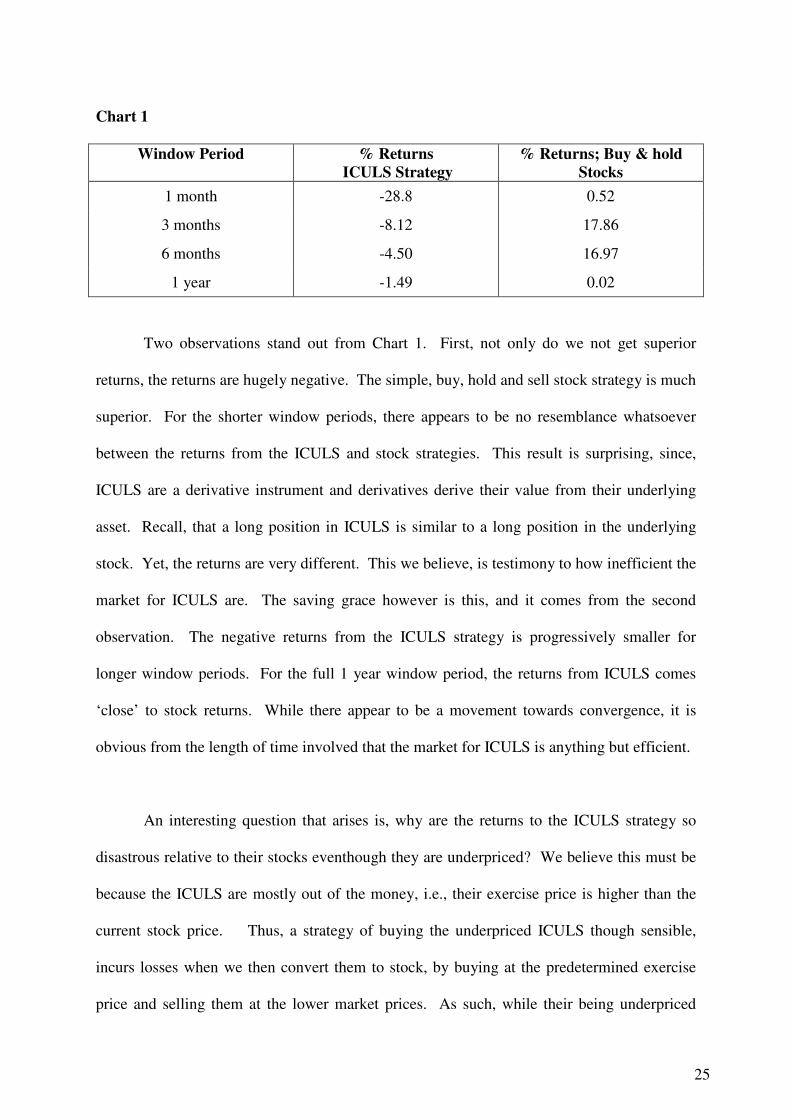
Chart 1
Window Period % Returns
ICULS Strategy
% Returns; Buy & hold
Stocks
1 month -28.8 0.52
3 months -8.12 17.86
6 months -4.50 16.97
1 year -1.49 0.02
Two observations stand out from Chart 1. First, not only do we not get superior
returns, the returns are hugely negative. The simple, buy, hold and sell stock strategy is much
superior. For the shorter window periods, there appears to be no resemblance whatsoever
between the returns from the ICULS and stock strategies. This result is surprising, since,
ICULS are a derivative instrument and derivatives derive their value from their underlying
asset. Recall, that a long position in ICULS is similar to a long position in the underlying
stock. Yet, the returns are very different. This we believe, is testimony to how inefficient the
market for ICULS are. The saving grace however is this, and it comes from the second
observation. The negative returns from the ICULS strategy is progressively smaller for
longer window periods. For the full 1 year window period, the returns from ICULS comes
‘close’ to stock returns. While there appear to be a movement towards convergence, it is
obvious from the length of time involved that the market for ICULS is anything but efficient.
An interesting question that arises is, why are the returns to the ICULS strategy so
disastrous relative to their stocks eventhough they are underpriced? We believe this must be
because the ICULS are mostly out of the money, i.e., their exercise price is higher than the
current stock price. Thus, a strategy of buying the underpriced ICULS though sensible,
incurs losses when we then convert them to stock, by buying at the predetermined exercise
price and selling them at the lower market prices. As such, while their being underpriced

26
should provide positive returns, the substantial loss incurred on exercise leads to overall
negative returns.
In Chart 2 below, we split the ICULS into underpriced and overpriced ones10
. We use
the same ICULS strategy as above for the underpriced ones but vary the strategy for
overpriced ICULS. Since the appropriate trading strategy for an overpriced asset would be to
short it first and then buy it back later, we used this strategy for the 4 window periods.
Chart 2
Window Period % Returns to Strategy
Underpriced ICULS
% Returns to Strategy
Overpriced ICULS
1 month -10.78 0.012
3 months -11.49 -0.0011
6 months -5.64 -0.0013
1 year -2.54 0.0015
The returns to the same strategy but confined to underpriced ICULS alone produces the same
negative returns. It reinforces our argument that despite being undervalued relative to the
underlying stock, the high conversion price causes losses on exercise and therefore negative
returns to the strategy. The returns to a strategy of shorting the overpriced ICULS barely
produces any returns at all. The consistent near zero returns despite different window
periods, implies that the mispricing remains the same even over a one year period.
4.3: Comparative Analysis Returns & Volatility
If the above analysis provided evidence of market inefficiency, the results to our
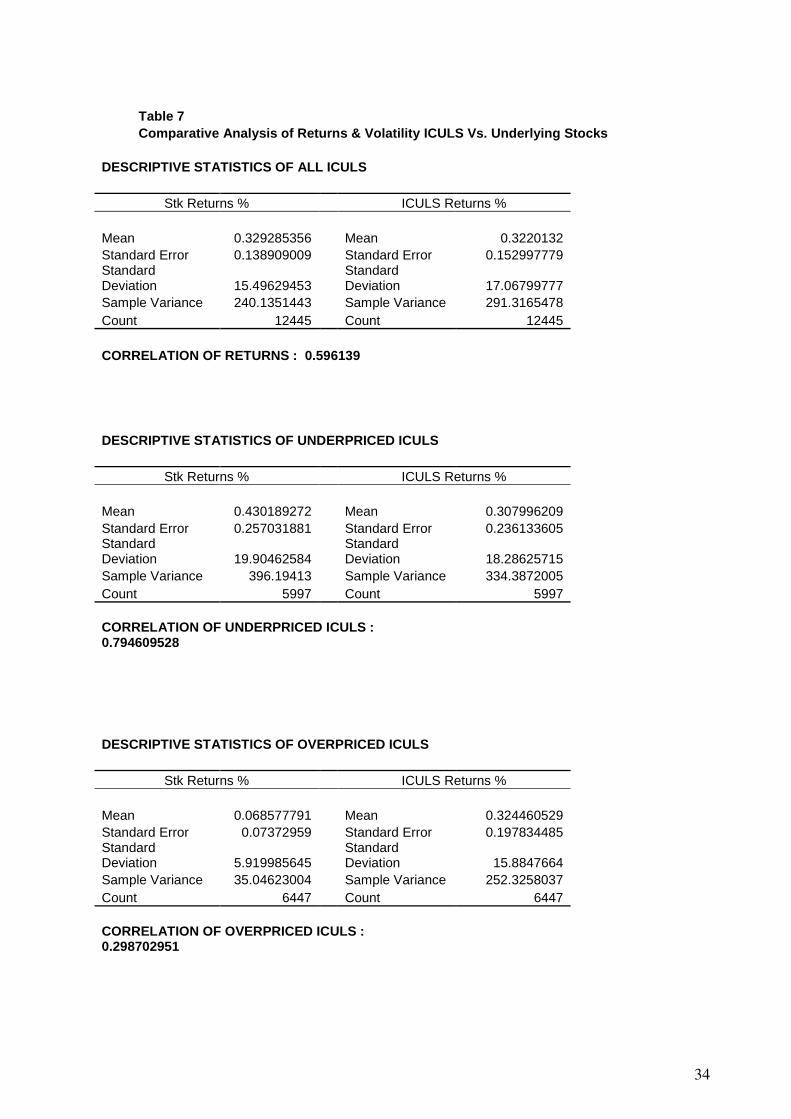
fourth research question appears to provide further confirmation. Table 7 provides the results
10 Recall that we had 17 underpriced and 17 overpriced ICULS.
27
of our comparative analysis of the returns and volatility of ICULS versus their underlying
stocks. The results show the mean, std. deviation and correlation of returns for the entire 30
month period of study. Across all 34 ICULS and their respective stocks, we see little
difference in the mean and standard deviation of returns. This is to be expected. Since
ICULS are a derivative and have a payoff profile equivalent to long stock position, similar
returns are logical. Infact, even the marginally higher volatility of ICULS is to be expected.
What is not consistent is the low correlation between the returns of ICULS and their
underlying stock. The analysis gets more interesting when we examine the results of
underpriced and overpriced ICULS with their respective underlying stocks.
Underpriced ICULS have mean returns lower than their underlying stocks. Though
the correlation is higher than the overall average, the volatility of ICULS returns are
marginally lower than those of their stocks. Overpriced ICULS on the other hand have much
higher mean returns than their underlying stocks. With mean returns more than 4 times
higher, the difference is statistically significant11
. The correlation between returns is barely
30%.
These results are contrary to expectations. In rational markets, one would expect
underpriced assets/instruments to earn higher than normal returns while overpriced ones,
lower returns. This does not appear to be the case here. The logical arbitrage strategy of
going long underpriced ICULS and shorting their respective stocks would have provided
disastrous results. Similarly, shorting overpriced ICULS and buying their underlying stocks
would also have been disastrous. It appears that underpriced ICULS remain underpriced over
the entire 30 months of the study whereas overpriced ones remain so. Taken together with
11 Based on pair-wise t-tests; at 10% significance.
28
the low correlation, it appears that ICULS and their underlying stocks may be taking their
own price paths with little of no arbitrage to bring them in line. While these results are
contrary to efficient markets, they are consistent with our findings in Section 4.2 above.
They are also consistent with Greiner et. al (2002), who found Japanese convertible bonds to
remain underpriced throughout their 4 year period of study.
Our final research question was an attempt to identify the key determinants of
mispricing. We did this by estimating the coefficients of the multiple regression model of
Eq. (12). The results are shown in Table 8. The goodness of fit measure, R2 is 0.58, the F-
test that all coefficients are equal is rejected. Two of the seven estimated coefficients are
significant at 5%. These are, Time to Maturity and underlying stock volatility. Given that
both coefficients are positive, the longer the time to maturity and the higher the underlying
stock volatility, the greater is the mispricing. These results are contrary to King (1986), who
found a negative relationship between time to maturity and mispricing, but are consistent
with Amman et.al (2003) who find a positive relationship between the two. Amman et.al
(2003), also find moneyness to be an important determinant of mispricing. Our results
however do not show this to be the case.
4.4: Limitations of Study
Before concluding, it should be useful to point out some of the potential limitations of
the study. We see three limitations. First, in pricing the ICULS, we have ignored the
potential for exercise before maturity of some of the ICULS (see Table 2). We have valued
the embedded options as European options. While many ICULS do allow for exercise on
fixed predetermined periods before maturity, one should be mindful of the fact that selling off

29
an option would always be superior to exercising – even if it is deep in the money.12
The
second limitation arises from our use of the Black-Scholes option pricing model.
Specifically, the model’s assumptions of constant volatility and interest rates. Malaysia’s
highly regulated interest rate regime however, blunts somewhat the extent of this limitation.
The final limitation has to do with our use of the replication technique. The Put-Call parity
assumes the options are traded. However, the embedded options within the ICULS are not
detachable and not traded. The absence of such traded options and therefore the impossibility
to arbitrage may also explain the very significant and extended deviations that we find in
pricing.
5.0: Summary & Conclusion
This paper provides an indepth study of Irredeemable Convertible Unsecured Loan
Stocks or ICULS. A Malaysian variant of the convertible bond, ICULS are a hybrid security.
Despite its long presence and listed trading status, there appears to be a dearth of literature
and no means of pricing them. This paper presents the first empirical evidence on the pricing
of ICULS. We propose a pricing model of ICULS built on the replication technique of
options. The basic premise of our model is the same as that of Bardhan et.al (1993) and
Tsiveriotis et.al (1998). We split the value of an ICULS into its annuity and convertible
components. The value of conversion is determined through replication. Testing our pricing
model on the sample ICULS, we find extensive mispricing. Though on average ICULS are
underpriced by 2.3%, there were an equal number of over and underpriced ICULS.
12
This is due to the fact that while exercising only allows one to realize the intrinsic value, selling the option
would mean receiving the premium that includes both the intrinsic and time values. The only exception would
be just prior to a large unexpected dividend payout by the underlying stock’s firm.
30
Our findings show that not only does the market misprice ICULS, the mispricing is
sustained over quite a while. Infact, even over a one year window period, marginal
mispricing remains. Furthermore, logical trading strategies to arbitrage the mispricing
produce inconsistent results. Based on these, we can only conclude that the market for
ICULS in Malaysia is a highly inefficient one. This however, raises a number of questions.
The most obvious one being, who is being helped and who is hurt in such a market situation?
Our analysis leads us to believe that issuers of ICULS stand to benefit from the current
situation to the detriment of investors.
Recall that ICULS unlike convertible bonds have no ratings requirement, furthermore
we have noted that most ICULS have such high Exercise prices that they are out-of-the-
money for most of their life. Infact most ICULS that expired during the study period did so,
out of the money. Add to this the fact that there is forced conversion and we can see why the
odds are stacked against investors but in favour of issuers.
Even a financially weak company with adverse-selection problems that make a
conventional stock issue unattractive, can get “backdoor equity” financing by way of
ICULS, Stein (1992)13
. Infact, it is possible that it may even be cheaper than straight debt for
a financially weak company.
While there is pressure on managers of companies that have issued convertible bonds
to increase firm value in order to ensure a high rate of conversion or face huge cash outflows
through cash redemption, companies issuing ICULS have no such pressure. Seen in this
light, the main theoretical argument for hybrids such as this, the sequential financing
13 Stein uses this argument for convertible bonds.
31
argument, does not hold14
. This brings us to the next question of; what then, is the value
added of having ICULS? Particularly if with a high exercise price and forced conversion, an
investor is squeezed.
Regulation can affect this state of affairs in two important ways. For a start, removing
short-selling regulation can go a long way towards enabling arbitrage and thereby reducing
mispricing. While hybrid instruments can add to “completing the markets”, their usefulness
will be limited if regulation is restrictive. A change in regulatory philosophy could also help.
Though an investor ought to know what he is getting into, in emerging markets, caveat
venditor may be better suited than caveat emptor15
.
14 Especially where ICULS can be exercised at anytime, sequencing financing is not possible. 15 Caveat Venditor – let the seller beware, caveat emptor, let the buyer beware.
32
Reference
Ammann, Manuel., Kind, Axel & Wilde, Christian (2003). Are convertible bonds
underpriced? An analysis of the French market, Journal of Banking & Finance Vol 27, Issue
4, April, 635-653
Bancel, Franck., & Mittoo, Usha R (2003). Why European firms issue convertible debt.
Working paper submitted for Conference on Forecasting Financial Markets, Paris, June 2003
Bardhan, I., Bergier, A., Derman, E., Dosemblet, C., Kani, I., Karasinki, P., (1993). Valuing
convertible bonds as derivatives. Goldman Sachs Quantitative Strategies Research Notes,
July
Brennan, M.J., & Schwartz, E.S., (1977). Convertible bonds: valuation and optimal strategies
for call and conversion. Journal of Finance, Vol 32, No. 5, 1699 – 1715
Brennan, M.J., & Schwartz , E.S., (1988). The case for convertibles. Journal of Applied
Corporate Finance, 1, 55-64
Chang, Shao-Chi, Chen, Sheng-Syan & Liu, Yichen (2003). Why firms use convertibles: a
further test of the sequential-financing hypothesis. Journal of Banking & Finance
Das, Satyajit., (2001). Structured products and hybrid securities. John Wiley & Sons (Asia)
Pte Ltd.
Greiner, Daniel, Kalay, Avner, & Kato, Hideaki Kiyoshi (2002). The market for callable-
convertible bonds: evidence from Japan. Pacific-Basin Finance Journal, Vol 10, Issue 1, Jan,
1-27
Ingersoll, Jonathan E Jr (1977). A contingent-claims valuation of convertible securities.
Journal of Financial Economics, Vol 4, Issue 3, May, 289-321
Isagawa, Nobuyuki (2000). Convertible debt: an effective financial instrument to control
managerial opportunism. Review of Financial Economics, Vol 9, Issue 1, Spring, 15-26
Jensen, M. (1986). The agency costs of free cash flow, corporate finance and takeovers.
American Economic Review 76, 323-329
King, R., (1986). Convertible bond valuation: An empirical test. Journal of Financial
Research 9 1, 53-69
Mayers, David (1998). Why firms issue convertible bonds: the matching of financial and real
investment options. Journal of Financial Economics 478, 83-102
McConnell and Schwartz (1986), LYON Traming, Journal of Finance 41, 3, 561 576.
Obiyathulla Ismath Bacha (2001), Financial Derivatives Markets and Applications in
Malaysia, Universiti Putra Malaysia Press

33
Stein, Jeremy C (1992). Convertible bonds as backdoor equity financing. Journal of
Financial Economics Vol 32, Issue 1, August, 3-21
Tsiveriotis, K., & Fernandes, C.(1998). Valuing convertible bonds with credit risk. The
Journal of Fixed Income 8, 3, 95-102
Yigitbasioglu, Ali Bora (2002). Pricing convertible bonds with interest rate, equity, credit,
FX and volatility risk. Retrieved 6th
November 2003 from website
http://ideas.repec.org/p/wpa/wuwpfi/0201001.html
34
Table 7 Comparative Analysis of Returns & Volatility ICULS Vs. Underlying Stocks
DESCRIPTIVE STATISTICS OF ALL ICULS
Stk Returns % ICULS Returns %
Mean 0.329285356 Mean 0.3220132 Standard Error 0.138909009 Standard Error 0.152997779 Standard Deviation 15.49629453
Standard Deviation 17.06799777
Sample Variance 240.1351443 Sample Variance 291.3165478 Count 12445 Count 12445
CORRELATION OF RETURNS : 0.596139
DESCRIPTIVE STATISTICS OF UNDERPRICED ICULS
Stk Returns % ICULS Returns %
Mean 0.430189272 Mean 0.307996209 Standard Error 0.257031881 Standard Error 0.236133605 Standard Deviation 19.90462584
Standard Deviation 18.28625715
Sample Variance 396.19413 Sample Variance 334.3872005 Count 5997 Count 5997
CORRELATION OF UNDERPRICED ICULS : 0.794609528
DESCRIPTIVE STATISTICS OF OVERPRICED ICULS
Stk Returns % ICULS Returns %
Mean 0.068577791 Mean 0.324460529 Standard Error 0.07372959 Standard Error 0.197834485 Standard Deviation 5.919985645
Standard Deviation 15.8847664
Sample Variance 35.04623004 Sample Variance 252.3258037 Count 6447 Count 6447
CORRELATION OF OVERPRICED ICULS : 0.298702951


![[Bank of America] Pricing Mortgage-Back Securities](https://static.fdocuments.net/doc/165x107/545f4a8eb1af9f09598b4c4e/bank-of-america-pricing-mortgage-back-securities.jpg)

![[Copenhagen Business School, Nielsen] Dividends in the Theory of Derivative Securities Pricing](https://static.fdocuments.net/doc/165x107/577cdd0e1a28ab9e78ac1c92/copenhagen-business-school-nielsen-dividends-in-the-theory-of-derivative.jpg)


