Pricing and Competition in US Airline Markets: Changes in...
30
MIT MIT ICAT ICAT Fares and Competition in US Markets: Changes in Fares and Demand Since 2000 Peter Belobaba Celian Geslin Nikolaos Pyrgiotis
Transcript of Pricing and Competition in US Airline Markets: Changes in...

MIT MIT ICAT ICAT
Fares and Competition in US Markets: Changes in Fares and Demand Since 2000
Peter BelobabaCelian Geslin
Nikolaos Pyrgiotis

2
MIT MIT ICAT ICAT Objectives & Approach
ObjectivesTrack fare and traffic changes in US domestic markets since 2000
• By distance and market size• In hub vs. non-hub markets• In markets with LCC presence and new entry
Examine relative fares of major competitors • Which airlines obtain a “yield premium” in these
markets?
Data SampleTop 1000 US O+D Markets extracted from O&D PlusMarkets were matched across each year 2000-2005
• 856 matching markets – Total “Market Sample”

3
MIT MIT ICAT ICAT Total Traffic in Market Sample
Passenger volumes rebounded by 2005 to 4% above 2000 levels after dropping by 11%.
Total PDEW Passengers - Total Market Sample
330
340
350
360
370
380
390
400
410
420
2000 2001 2002 2003 2004 2005
Thou
sand
s
- 7.2%- 11.0% - 9.5%
- 1.0%
+ 4.1%

4
MIT MIT ICAT ICAT Average Fares
After dropping 16%, fares increased slightly in 2005 but were still 14.8% lower than in 2000.
Average Fares - Total Market Sample
$100
$110
$120
$130
$140
$150
$160
2000 2001 2002 2003 2004 2005
- 7.7%
- 14.2% - 13.1% - 16.4%
- 14.8%

5
MIT MIT ICAT ICAT Total Market Revenues
Slow recovery since 24% drop from 2000 to 2002, but still 11% below 2000 levels.
Total PDEW Revenues - Total Market Sample
$30
$35
$40
$45
$50
$55
$60
$65
2000 2001 2002 2003 2004 2005
Mill
ions
- 14.4%
- 23.7% - 21.3% - 17.4%
- 11.4%

6
MIT MIT ICAT ICAT Distribution of Fare Changes
Most, but not all markets have seen lower fares

7
MIT MIT ICAT ICAT Average Fares by Distance
Average fares 24% lower in long haul markets, while short haul fares have remained stable.
Average Fare - Total Market Sample- by distance
$60
$80
$100
$120
$140
$160
$180
$200
Short Haul Medium Haul Long Haul
200020042005
-0.7%
-15.1%
-23.9%

8
MIT MIT ICAT ICAT Total Passengers by Distance
Passenger traffic in short haul markets dropped 13%, while increasing 15% in long haul markets.
Total Passengers PDEW - Total Market Sample- by distance
020406080
100
120140160180200
Short Haul Medium Haul Long Haul
Thou
sand
s
200020042005
-12.5%+6.5%
+15.4%
9
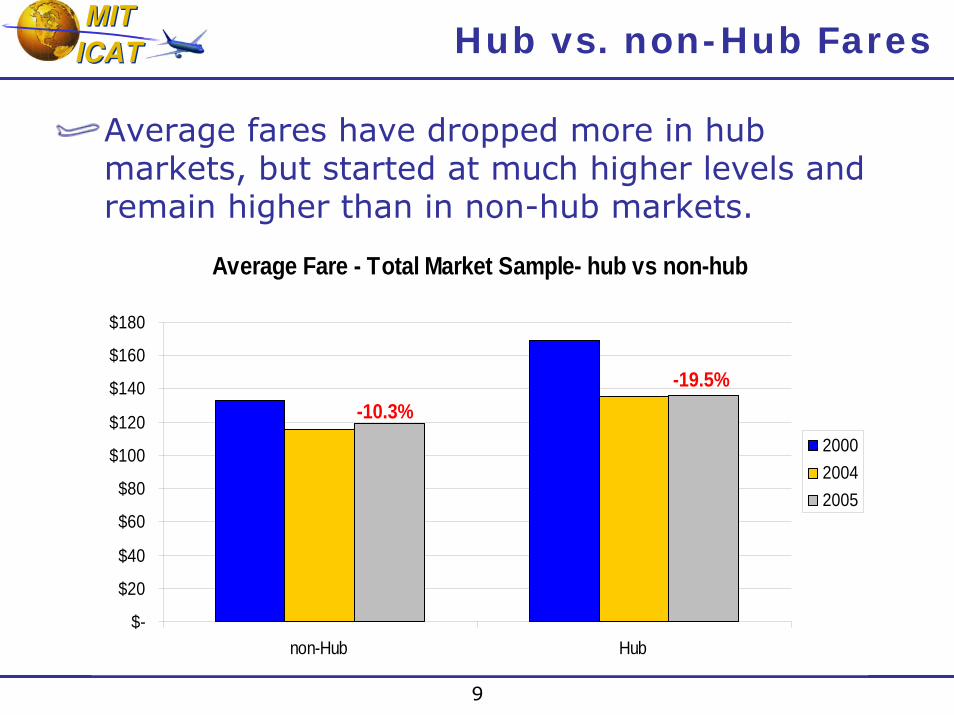
MIT MIT ICAT ICAT Hub vs. non-Hub Fares
Average fares have dropped more in hub markets, but started at much higher levels and remain higher than in non-hub markets.
Average Fare - Total Market Sample- hub vs non-hub
$-
$20
$40
$60
$80
$100
$120
$140
$160
$180
non-Hub Hub
200020042005
-10.3%-19.5%

10
MIT MIT ICAT ICAT Hub vs. non-Hub Revenues
Lower fares in hub markets have reduced total revenues by 17%, given similar 3-4% traffic growth in hub and non-hub markets.
Total Revenues PDEW - Total Market Sample- hub vs non-hub
$-
$5
$10
$15
$20
$25
$30
$35
non-Hub Hub
Mill
ions
200020042005
-6.0%
-17.0%

11
MIT MIT ICAT ICAT LFA Market Presence and Fares
Fares decreased more for markets with small LFA market shares (than those with bigger LFA presence), but remain higher overall.Largest (29%) decrease in fares observed for markets with new entry by LFA since 2000.
Average Fare - Total Market Sample- by LFA MS
$60
$80
$100
$120
$140
$160
$180
$200
LFA <10% 2004 LFA > 10% 2004 New Entry (00-04)
200020042005
-16.6%
-13.0%
-29.1%

12
MIT MIT ICAT ICAT LFA Entry and Traffic Growth
Traffic increased in markets with LFA presence, but decreased in markets with small/no LFA shareGreatest traffic increase (24%) in markets with new LFA entry 2000 to 2005.
Total Passengers PDEW - Total Market Sample- by LFA MS
0
50
100
150
200
250
300
350
LFA <10% 2004 LFA > 10% 2004 New Entry (00-04)
Thou
sand
s
200020042005
- 4.2%
+7.4%
+23.9%

13
MIT MIT ICAT ICAT Average Fare Regression Model
2000 2004
• Larger markets had lower fares, more so in 2004
• Presence of LFA reduces fares, but less so in 2004
• Higher fares in more concentrated markets, less so in 2004
• “Hub premium” still exists, but cut by half between 2000 and 2004

14
MIT MIT ICAT ICAT Relative Fares by Airline
Calculated “yield index” for each airline in each market of the Total Sample:
Yield Index YIij = (Airline i Yield in a market j)/(Avg Yield in market j)
Aggregate yield index for each airline by year, weighting by passenger volumes in each market:
Aggregate Yield Index AXi = ∑(YIij × Pax of airline i in market j) / ∑(Pax of airline i)

15
MIT MIT ICAT ICAT Carrier Participation in Top Markets
Carrier Participation in Top 856 Markets 2005
0
50
100
150
200
250
300
350
400
450
500
WN AA UA DL CO US HP NW FL F9
Carrier Participation in Top 856 Markets 2000
050
100150200250300350400450500
DL WN AA UA US CO HP NW FL F9
Change in carrier participation 2000 to 2005
-140-120-100
-80-60-40-20
0204060
WN AA UA DL CO US HP NW FL F9

16
MIT MIT ICAT ICAT Legacy Carriers with Yield Premium
CO, UA, NW and AA have maintained above average fares AA yield index has decreased, moving closer to 1.0 by 2005
Aggregate Yield Index
0.75
0.80
0.85
0.90
0.951.00
1.05
1.10
1.15
2000 2001 2002 2003 2004 2005
CO
UA
AA
NW

17
MIT MIT ICAT ICAT Other Legacy Carriers
DL and US obtained little or no yield premium for most years during the period 2000-05.Both US and (especially) HP have increased their yield premium in recent past.
Aggregate Yield Index
0.75
0.80
0.85
0.90
0.95
1.00
1.05
1.10
1.15
2000 2001 2002 2003 2004 2005
USDLHP

18
MIT MIT ICAT ICAT Largest Low Fare Airlines
The largest LFA have below average yieldsB6 (JetBlue) and WN (Southwest) closer to 1.0 than FL (AirTran)
Aggregate Yield Index
0.75
0.80
0.85
0.90
0.95
1.00
1.05
1.10
1.15
2000 2001 2002 2003 2004 2005
B6WNFL

19
MIT MIT ICAT ICAT Remaining Major Carriers
F9 (Frontier), NK (Spirit) and TZ (Am. Trans Air) also below average yields, while AS (Alaska) premium is disappearing
Aggregate Yield Index
0.75
0.80
0.85
0.90
0.95
1.00
1.05
1.10
1.15
2000 2001 2002 2003 2004 2005
ASNKF9TZ

20
MIT MIT ICAT ICAT Summary of Results
Fare and traffic trends differ by distance:Short haul fares have remained stable, while traffic has decreased 13%Long haul market fares down 24%, traffic up 15%
LFA presence lowers fares and increases trafficGreatest impacts observed for new LFA entry
Hub fares decreased more than non-Hub faresBut hub premium is still evident
Largest Legacy airlines have maintained a yield premium over LCCs in top markets:
DL is the exception, while US/HP have shown upward trendWN and B6 are closer to market averages than smaller LCCs

21
MIT MIT ICAT ICAT Fares and Competition – Next Steps
Continue updates as 2006 data become availableCapture recent upward fare movementDetermine whether market differences persist
More detailed analysis to examine correlation between individual carrier yield indices and
Markets shares, market concentration measuresLFA presence and timing of entryFor hub vs. non-hub markets
Relationship of yield premium to capacity shiftsChanges in seat capacity and load factors

22
MIT MIT ICAT ICAT Appendix

23
MIT MIT ICAT ICAT Analysis by Distance Category
Total revenues decreased most in long haul markets despite traffic growth – down 12% overall.
Total Revenues PDEW - Total Market Sample- by distance
$-
$5
$10
$15
$20
$25
$30
$35
Short Haul Medium Haul Long Haul
Mill
ions
200020042005
-11.9%
-9.5%
-12.2%

24
MIT MIT ICAT ICAT Hub vs. non-Hub Analysis
Hub Definition Connecting traffic > 50% of total trafficExclude international entry airports
• Cincinnati, Charlotte, Atlanta, Houston, Dallas/Fort Worth, Memphis, Chicago O’hare, Detroit, Minneapolis/St. Paul, Pittsburgh, Denver.
DistributionTop 1000 US Markets
Non-Hub Markets(491 markets)
Hub Markets(365 markets)
Total Market Sample(856 markets)

25
MIT MIT ICAT ICAT Hub vs. non-Hub Traffic
The hub/non-hub segmentation has no real difference in traffic growth as both segments experienced a passenger increase between 3-5%.
Total Passengers PDEW - Total Market Sample- hub vs non-hub
0
50
100
150
200
250
300
non-Hub Hub
Thou
sand
s
200020042005
+4.8%
+3.1%

26
MIT MIT ICAT ICAT
Analysis of Competition by Low-Fare Airlines
DefinitionLow-fare competition is significant for total low-fare carriers market share > 10%
Distribution
LFA < 10% Markets(277 markets)
LFA > 10% Markets(579 markets)
Total Market Sample(856 markets)
Top 1000 US Markets
Market Share of total LFA > 10%
LFA > 10% Markets(497 markets)
LFA < 10% Markets(359 markets)
2004
Market Share of total LFA < 10%
From LFA >10% to <10% (legacy new entrants) – 22 markets.
From LFA <10% to >10% (LFA new entrants) – 104 markets.
2000
27
MIT MIT ICAT ICAT
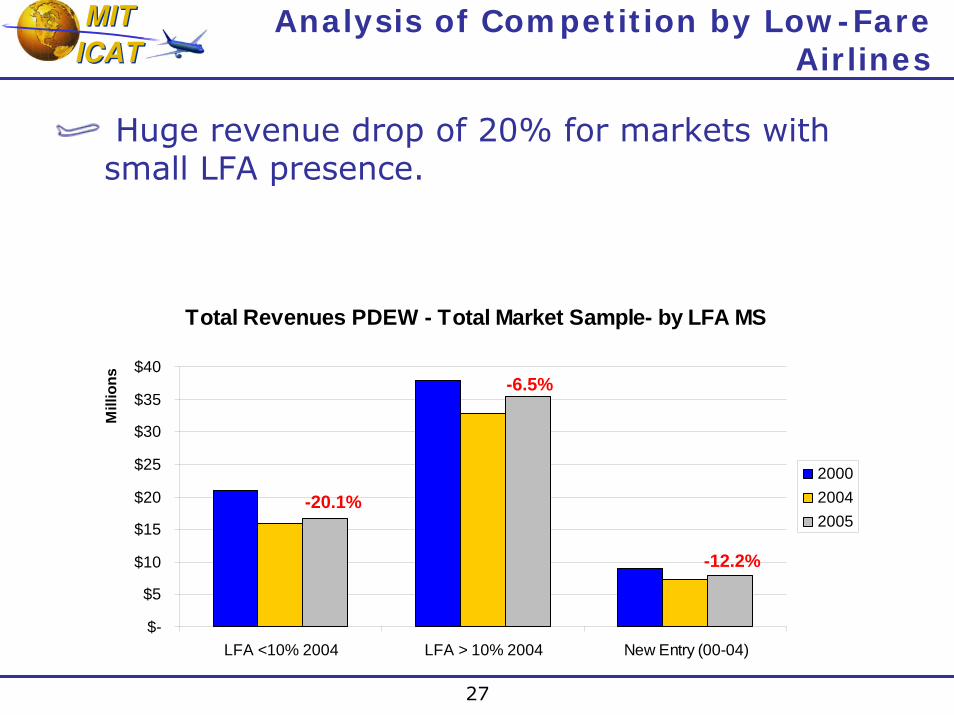
Analysis of Competition by Low-Fare Airlines
Huge revenue drop of 20% for markets with small LFA presence.
Total Revenues PDEW - Total Market Sample- by LFA MS
$-
$5
$10
$15
$20
$25
$30
$35
$40
LFA <10% 2004 LFA > 10% 2004 New Entry (00-04)
Mill
ions
200020042005
-20.1%
-6.5%
-12.2%
28
MIT MIT ICAT ICAT
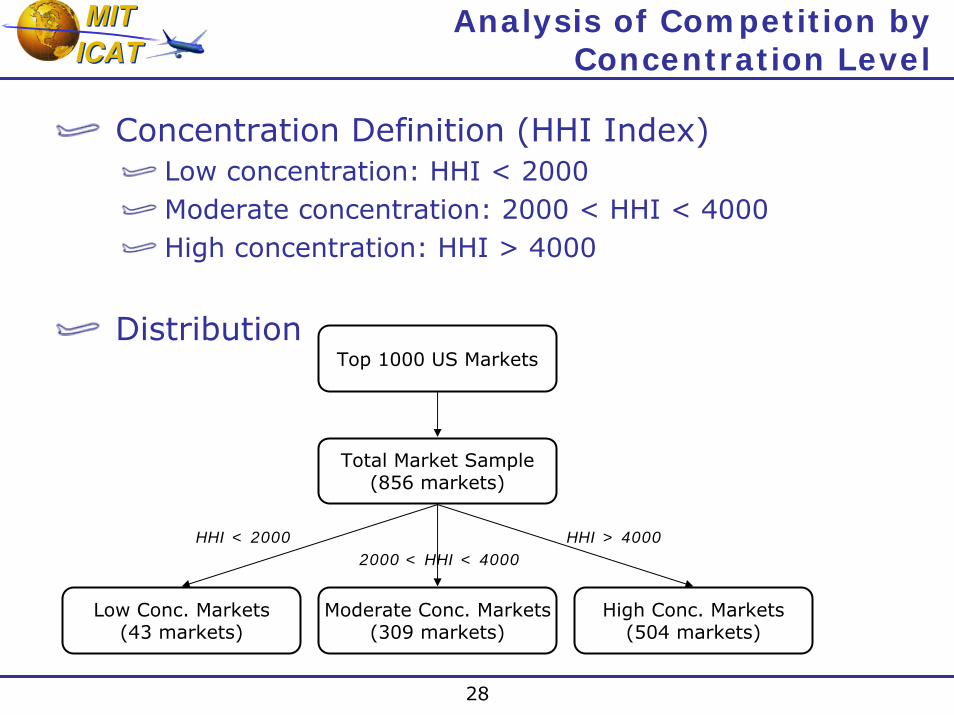
Analysis of Competition by Concentration Level
Concentration Definition (HHI Index)Low concentration: HHI < 2000Moderate concentration: 2000 < HHI < 4000High concentration: HHI > 4000
Distribution
Moderate Conc. Markets(309 markets)
High Conc. Markets(504 markets)
Low Conc. Markets(43 markets)
Total Market Sample(856 markets)
Top 1000 US Markets
HHI < 20002000 < HHI < 4000
HHI > 4000

29
MIT MIT ICAT ICAT
Analysis of Competition by Concentration Level
As a result, total revenues are down for all three concentration levels between 7 and 13%.
Total Revenues PDEW - Total Market Sample- by concentration
$-
$5
$10
$15
$20
$25
$30
Low Concentration Moderate Concentration High Concentration
Mill
ions
200020042005
-7.1%
-13.0% -10.1%

30
MIT MIT ICAT ICAT Model of Change in Average Fare
Model:Change in Fare Linear Results
Change in Fare Log-Linear Results