PricewaterhouseCoopers/ National Venture Capital Association MoneyTree™ Report based on data from...
45
PricewaterhouseCoopers/ National PricewaterhouseCoopers/ National Venture Capital Association Venture Capital Association MoneyTree™ Report MoneyTree™ Report based on data from Thomson based on data from Thomson Financial Financial Shaking the MoneyTree ™ ™ Raleigh, NC Raleigh, NC May 2007 May 2007 Q1 2007 Update May 2007
-
date post
18-Dec-2015 -
Category
Documents
-
view
218 -
download
1
Transcript of PricewaterhouseCoopers/ National Venture Capital Association MoneyTree™ Report based on data from...

PricewaterhouseCoopers/ National Venture PricewaterhouseCoopers/ National Venture Capital Association MoneyTree™ ReportCapital Association MoneyTree™ Reportbased on data from Thomson Financialbased on data from Thomson Financial
Shaking the MoneyTree™™
Raleigh, NCRaleigh, NCMay 2007May 2007
Q1 2007 UpdateMay 2007

Slide 2PricewaterhouseCoopers/National Venture Capital Association MoneyTree™ Report based on data from Thomson Financial
May 2007
Today’s program
The MoneyTree Report – Q1 2007 Analysis• presented by Laura Hoke, PricewaterhouseCoopers LLP
Venture Capital Panel• Michael Elliott, Noro-Moseley• Steve Nelson, Wakefield Group
Question and Answer Session
1)
2)
3)

Slide 3PricewaterhouseCoopers/National Venture Capital Association MoneyTree™ Report based on data from Thomson Financial
May 2007
Speaker Bios

Slide 4PricewaterhouseCoopers/National Venture Capital Association MoneyTree™ Report based on data from Thomson Financial
May 2007
Laura Hoke
Laura is a senior manager in the Raleigh office of PricewaterhouseCoopers ("PwC"), where she
is responsible for providing a range of audit, business advisory and consulting services. She
has extensive experience in the software industry, as well as other technology-backed
industries including biotech, pharmaceutical and professional services. In addition to her audit
and business advisory services, Laura has significant SEC experience, including several initial
public offerings. She has been involved in numerous Sarbanes Oxley projects and has led the
404 implementation efforts at several organizations. Laura rejoined PwC’s Raleigh office after
serving as the Corporate Controller for a global software company, where she was responsible
for the domestic and international accounting functions, as well as the development,
implementation and maintenance of the internal control structure. Laura has extensive
experience in mergers and acquisitions and was responsible for the integration of acquisitions
for a global distribution and manufacturing company.
Laura’s primary client is Lenovo Group, Limited although she participates on several other
technology-backed engagements throughout the Carolinas. Laura graduated with a B.S. from
Virginia Tech, is a member of the AICPA and the North Carolina Association of Certified Public
Accountants. She also serves on the Board of Directors of Artspace, a nonprofit visual arts
center in downtown Raleigh.
Slide 5PricewaterhouseCoopers/National Venture Capital Association MoneyTree™ Report based on data from Thomson Financial
May 2007
Mike Elliott
Mike Elliott joined NMP in early 2005 with 21 years of successful venture capital investment experience. Mike spent the last eight years as a Managing Director of The Wakefield Group, a private venture firm based in Charlotte, North Carolina with an investment focus similar to that of NMP. Mike invested primarily in technology and business services companies, at early and growth stages of development, and will continue that focus in his deployment of Fund VI. Several of The Wakefield Group’s investments were syndicated co-investments with several of the Prior Funds.
Prior to his service at The Wakefield Group, Mike was a Managing Director of NationsBank Capital (now Bank of America Capital Investors), Bank of America’s private equity investment arm, where he managed large financings of later-stage growth companies. He began his venture investment career as a founding partner of NCNB Venture Co., L.P., the venture investment arm of NCNB, the predecessor of Bank of America. During his venture career, Mike has been an active board member and sponsor of several highly successful ventures, including Affiliated Managers (NYSE: AMG), Redgate Communications (sold to AOL), Medic Computer Systems (sold to Misys), OpenSite Technologies (sold to Siebel Systems), SciQuest (Nasdaq: SQST) and Serologicals (Nasdaq: SERO).
During his nine years as a partner at NCNB Ventures starting in 1985, Mike returned 3.4x capital, generating a 29% gross IRR for investments he sponsored. During his three years as a Managing Director at NationsBank Capital, he led growth company financings generating a 25% gross IRR and returning 2.1x capital. While at The Wakefield Group, he sponsored transactions generating a 37% gross IRR, returning 1.5x capital. Mike’s experience and known culture fit with the NMP team make him an ideal addition to the Firm and the Fund VI team.
Mike is extensively involved in North Carolina’s entrepreneurial community, having served in many leadership roles, including the Executive Committee of the NASBIC Board of Governors and as a board member of the Council for Entrepreneurial Development in Research Triangle Park. Mike received a BS in mathematics and an MBA from the University of North Carolina, where he was both a Morehead Scholar and Maurice Lee Fellow.

Slide 6PricewaterhouseCoopers/National Venture Capital Association MoneyTree™ Report based on data from Thomson Financial
May 2007
Steve Nelson
Steve Nelson joined Wakefield Group in October 1999 as Managing Director and Partner. He established the venture capital firm’s Research Triangle Park, NC office.
Steve joined Wakefield after 19 years of executive and general management experience in technology, software and Internet-based businesses. During the last three years of his career before starting in venture capital, Steve was at Quokka Sports, a digital media company, in several executive capacities. Quokka raised over $140m in capital and successfully completed an IPO in July, 1999. Steve served as chief executive of a joint venture company between NBC Sports and Quokka Sports, NBC/Quokka Ventures, LLC.
Prior to Quokka, Steve served as a Vice President with Informix Software, based in Menlo Park, CA. His first business experience was 14-plus years at IBM, ultimately as Vice President and General Manager in San Francisco where he had executive and P&L responsibility for all customers in the eleven western states, all IBM products and services, 800 employees, $2.2B in revenues and several hundred million dollars in profit.
Steve is a member of the board of directors and the executive committee at Motricity. He is also Wakefield’s board representative for Liquidia Technologies where he is also interim CEO, Integrian, Constella Group, Near-Time, rPath, APEX Analytix, and BlueCross BlueShield of North Carolina. He was a past Chairman of North Carolina’s Council for Entrepreneurial Development (CED), and is a member of the Investment Advisory Committee for the State Treasurer of North Carolina and helps oversee their $74B portfolio.
Steve received his B.S. degree in Business from Wake Forest University.

Slide 7PricewaterhouseCoopers/National Venture Capital Association MoneyTree™ Report based on data from Thomson Financial
May 2007
About The Report
• PricewaterhouseCoopers and the National Venture Capital Association produce the MoneyTree Report™ based on data from Thomson Financial
• ‘Core’ measure of equity investments in venture-backed companies in the United States
• Companies have received at least one round of financing involving a professional VC firm or equivalent
• Captures: tranches, not term sheets, foreign VCs, qualified private placement
• Excludes: debt, bridge loans, recaps, roll-ups, IPOs, PIPEs, leasing, etc.
• MoneyTree™ Report in its 13th year
• Results online at www.pwcmoneytree.com, www.nvca.org, www.venturexpert.com

Slide 8PricewaterhouseCoopers/National Venture Capital Association MoneyTree™ Report based on data from Thomson Financial
May 2007
The National Picture
Historical Trends
Slide 9PricewaterhouseCoopers/National Venture Capital Association MoneyTree™ Report based on data from Thomson Financial
May 2007
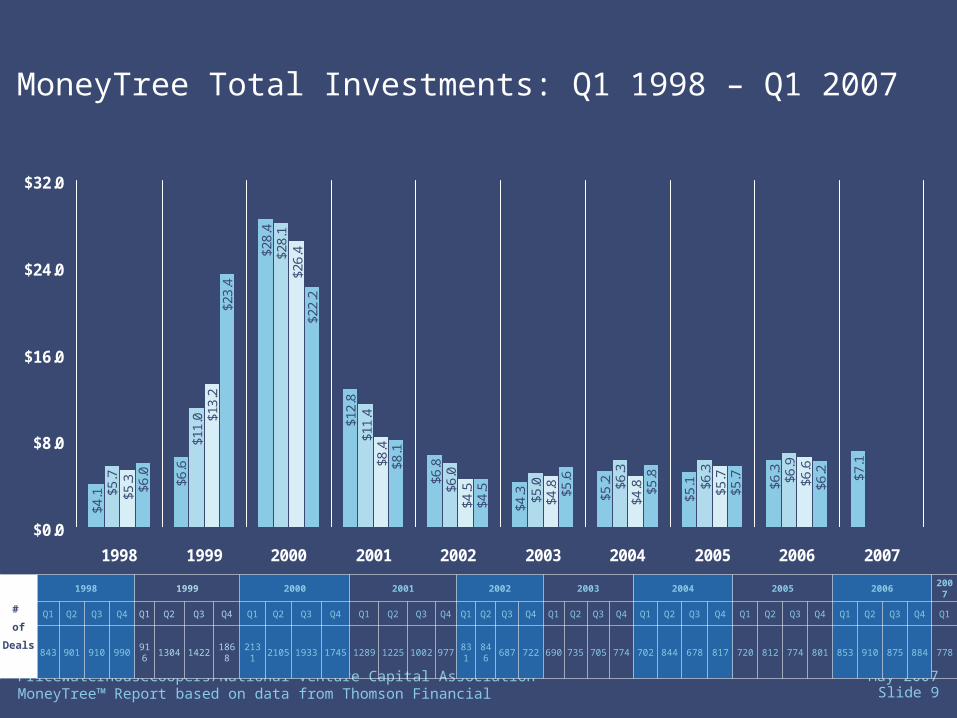
MoneyTree Total Investments: Q1 1998 – Q1 2007($ in billions)
$4.1
$6.6
$28.
4
$12.
8
$6.8
$4.3 $5
.2
$5.1 $6
.3 $7.1
$5.7
$11.
0
$28.
1
$11.
4
$6.0
$5.0 $6
.3
$6.3
$6.9
$5.3
$13.
2
$26.
4
$8.4
$4.5
$4.8
$4.8 $5
.7 $6.6
$6.0
$23.
4
$22.
2
$8.1
$4.5 $5
.6
$5.8
$5.7
$6.2
$0.0
$8.0
$16.0
$24.0
$32.0
1998 1999 2000 2001 2002 2003 2004 2005 2006 2007
#
of
Deals
1998 1999 2000 2001 2002 2003 2004 2005 2006 2007
Q1 Q2 Q3 Q4 Q1 Q2 Q3 Q4 Q1 Q2 Q3 Q4 Q1 Q2 Q3 Q4 Q1 Q2 Q3 Q4 Q1 Q2 Q3 Q4 Q1 Q2 Q3 Q4 Q1 Q2 Q3 Q4 Q1 Q2 Q3 Q4 Q1
843 901 910 990 916 1304 1422 1868 2131 2105 1933 1745 1289 1225 1002 977 831 846 687 722 690 735 705 774 702 844 678 817 720 812 774 801 853 910 875 884 778

Slide 10PricewaterhouseCoopers/National Venture Capital Association MoneyTree™ Report based on data from Thomson Financial
May 2007
MoneyTree Total Investments: 1980 – YTD Q1 2007
($ in billions)
$0.6
$1.2
$1.6
$3.0
$3.0
$2.8
$3.1
$3.3
$3.3
$3.3
$2.8
$2.2
$3.5
$3.7
$4.1 $8
.1 $11.
3
$14.
9
$21.
1
$54.
2
$105
.0
$40.
7
$21.
8
$19.
7
$22.
2
$22.
8
$26.
1
$7.1
$0
$20
$40
$60
$80
$100
$120
1980
1981
1982
1983
1984
1985
1986
1987
1988
1989
1990
1991
1992
1993
1994
1995
1996
1997
1998
1999
2000
2001
2002
2003
2004
2005
2006
2007
Annual Venture Capital Investments 1980 to YTD Q1 2007
Slide 11PricewaterhouseCoopers/National Venture Capital Association MoneyTree™ Report based on data from Thomson Financial
May 2007
HA W AII
MA UI
KAHOOL A WE
LANAI
MOLOKAI
OAHU
KAU AI
NIIHA U
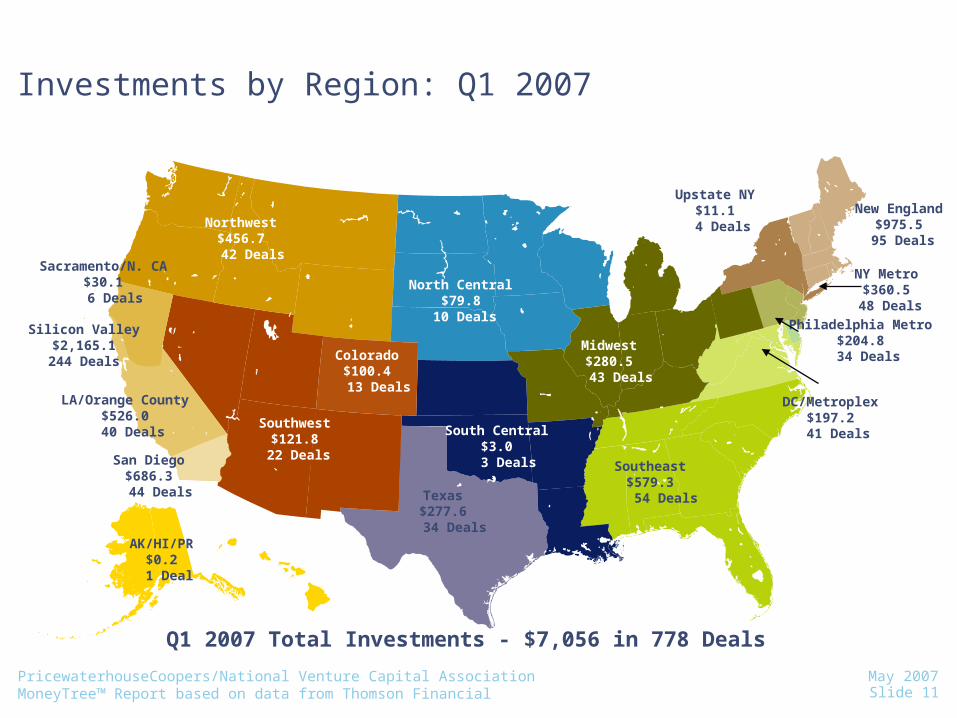
Investments by Region: Q1 2007
Texas$277.6
34 Deals
Silicon Valley$2,165.1
244 Deals
New England$975.5
95 Deals
Midwest$280.5
43 Deals
South Central$3.0
3 Deals
Northwest$456.7
42 DealsSacramento/N. CA
$30.1 6 Deals
San Diego$686.3
44 Deals
Southeast$579.3
54 Deals
Southwest$121.8
22 Deals
LA/Orange County$526.0
40 Deals
DC/Metroplex$197.2
41 Deals
NY Metro$360.5
48 Deals
Philadelphia Metro$204.8
34 Deals
North Central$79.8
10 Deals
Q1 2007 Total Investments - $7,056 in 778 Deals
Colorado$100.4
13 Deals
AK/HI/PR$0.2
1 Deal
Upstate NY$11.1
4 Deals

Slide 12PricewaterhouseCoopers/National Venture Capital Association MoneyTree™ Report based on data from Thomson Financial
May 2007
Investments by Region: Q1 2007($ in millions)
$0.2
$3.0
$100.4
$121.8
$197.2
$204.8
$277.6
$280.5
$360.5
$456.7
$526.0
$579.3
$686.3
$975.5
$2,165.1
$79.8
$30.1
$11.1
$0 $700 $1,400 $2,100
AK/HI/PR
South Central
Upstate NY
Sacramento/N.Cal
North Central
Colorado
SouthWest
DC/Metroplex
Philadelphia Metro
Texas
Midwest
NY Metro
Northwest
LA/Orange County
Southeast
San Diego
New England
Silicon Valley
Region# of
Deals
% Change $
from Q4 ‘06
Silicon Valley 244 -7.28%
New England 95 29.14%
San Diego 44 73.91%
Southeast 54 54.05%
LA/Orange County 40 26.51%
Northwest 42 52.30%
NY Metro 48 -39.90%
Midwest 43 15.13%
Texas 34 61.06%
Philadelphia Metro 34 48.81%
DC/Metroplex 41 5.29%
South West 22 127.38%
Colorado 13 35.85%
North Central 10 -18.07%
Sacramento/N.Cal 6 329.78%
Upstate NY 4 -71.45%
South Central 3 -83.10%
AK/HI/PR 1 -98.36%
Total 778 13.47%
Q1 2007 Total: $7,056 in 778 Deals
NM = Not Meaningful

Slide 13PricewaterhouseCoopers/National Venture Capital Association MoneyTree™ Report based on data from Thomson Financial
May 2007
Investments by Region – Quarterly Percent of Total U.S. Investments
Top U.S. Regions Q1 ‘06– Q1’07(% of Total Dollars)
38
.4%
15
.0%
5.1
%
4.1
% 6.0
%
35
.2%
10
.7%
3.3
%
4.3
% 7.3
%
33
.9%
9.9
%
4.4
%
5.1
% 8.5
%
37
.6%
12
.2%
6.4
%
6.1
%
6.7
%
30
.7%
13
.8%
9.7
%
8.2
%
7.5
%
0%
10%
20%
30%
40%
Silicon Valley New England San Diego Southeast LA/Orange County
Q1 '06 Q2 '06 Q3 '06 Q4 '06 Q1 '07

Slide 14PricewaterhouseCoopers/National Venture Capital Association MoneyTree™ Report based on data from Thomson Financial
May 2007
Q1 2007 Top 10 States Garnering Venture FundsQ1 2007 Top 10 States Garnering Venture Funds
State Deals Investment Amount
1.California 334 $ 3,407,455,800
2.Massachusetts 84 $ 901,224,000
3.Washington 33 $ 365,881,600
4.Texas 34 $ 277,607,300
5.New York 34 $ 261,279,800
6.North Carolina 16 $ 224,816,300
7.Pennsylvania 34 $ 199,643,300
8.Florida 13 $ 150,833,600
9.Illinois 17 $ 134,887,000
10. New Jersey 18 $ 108,627,900

Slide 15PricewaterhouseCoopers/National Venture Capital Association MoneyTree™ Report based on data from Thomson Financial
May 2007
Investments by Industry: Q1 2007($ in millions)
$0.4
$75.4
$161.5
$176.6
$212.3
$274.7
$288.1
$358.1
$489.4
$501.2
$588.1
$1,078.4
$1,097.9
$1,488.8
$77.3
$93.4
$93.9
$0 $900 $1,800
Undisclosed/Other
Consumer Products and Services
Financial Services
Computers and Peripherals
Retailing/Distribution
Healthcare Services
Electronics/Instrumentation
Business Products and Services
Networking and Equipment
IT Services
Semiconductors
Media and Entertainment
Industrial/Energy
Telecommunications
Medical Devices and Equipment
Software
Biotechnology
Industry# of
Deals
% Change $
from Q4 ‘06
Biotechnology 102 19.65%
Software 193 -10.29%
Medical Devices & Equipment 96 59.83%
Telecommunications 63 27.19%
Industrial/Energy 44 20.50%
Media & Entertainment 72 16.47%
Semiconductors 42 -26.07%
IT Services 38 7.60%
Networking & Equipment 29 31.45%
Business Products and Services 22 37.12%
Electronics/Instrumentation 16 77.64%
Healthcare Services 10 20.86%
Retailing/Distribution 12 56.71%
Computers and Peripherals 9 61.92%
Financial Services 17 20.43%
Consumer Products and Services 12 -67.91%
Undisclosed/Other 1 NM
TOTAL 778 13.47%
Q1 2007 Total: $7,056 in 778 DealsVisit www.pwcmoneytree.com for Industry definitions
NM = Not Meaningful

Slide 16PricewaterhouseCoopers/National Venture Capital Association MoneyTree™ Report based on data from Thomson Financial
May 2007
Investments by Industry – Quarterly Percent of Total U.S. Investments
Top 5 Industries – Q1 ‘06 to Q1 ‘07(% of Total Dollars)
13.9
%
21.7
%
11.5
%
9.2%
4.5%
19.6
%
19.9
%
8.2% 9.
2%
8.1%
17.4
%
17.2
%
10.4
%
13.9
%
9.5%
20.0
%
19.7
%
10.9
%
7.4%
6.7%
21.1
%
15.6
%
15.3
%
8.3%
7.1%
0%
5%
10%
15%
20%
25%
30%
Biotechnology Software Medical Devices andEquipment
Telecommunications Industrial/Energy
Q1 '06 Q2 '06 Q3 '06 Q4 '06 Q1 '07
Slide 17PricewaterhouseCoopers/National Venture Capital Association MoneyTree™ Report based on data from Thomson Financial
May 2007
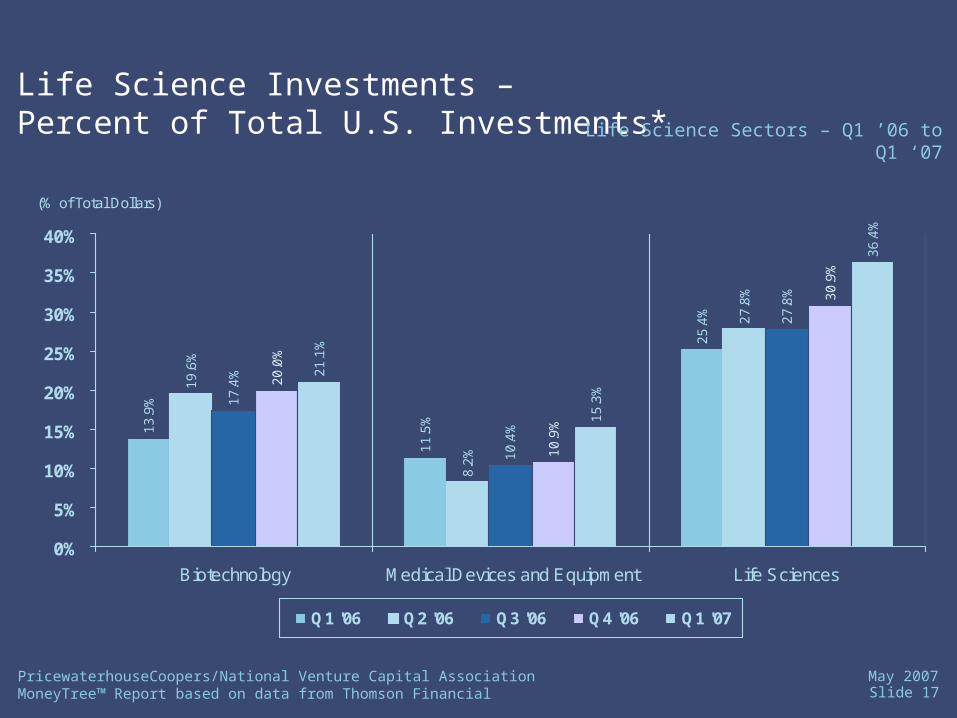
Life Science Investments – Percent of Total U.S. Investments*
(% of Total Dollars)
13
.9%
11
.5%
25
.4%
19
.6%
8.2
%
27
.8%
17
.4%
10
.4%
27
.8%
20
.0%
10
.9%
30
.9%
21
.1%
15
.3%
36
.4%
0%
5%
10%
15%
20%
25%
30%
35%
40%
Biotechnology Medical Devices and Equipment Life Sciences
Q1 '06 Q2 '06 Q3 '06 Q4 '06 Q1 '07
Life Science Sectors – Q1 ’06 to Q1 ‘07

Slide 18PricewaterhouseCoopers/National Venture Capital Association MoneyTree™ Report based on data from Thomson Financial
May 2007
Investments by Stage of Development: Q1 2007
($ in millions)
$169.3
$962.7
$2,875.1
$3,048.5
$0 $1,000 $2,000 $3,000
Startup/Seed
Early Stage
Expansion
Later Stage
Stage of Development
# of
Deals
% Change in $ Amount
from Q4 2006
Later Stage 245 56.72%
Expansion Stage 274 8.57%
Early Stage 188 -28.48%
Startup/Seed 71 -39.29%
Total 778 13.47%
Q1 2007 Totals: $7,056 in 778 Deals
Slide 19PricewaterhouseCoopers/National Venture Capital Association MoneyTree™ Report based on data from Thomson Financial
May 2007
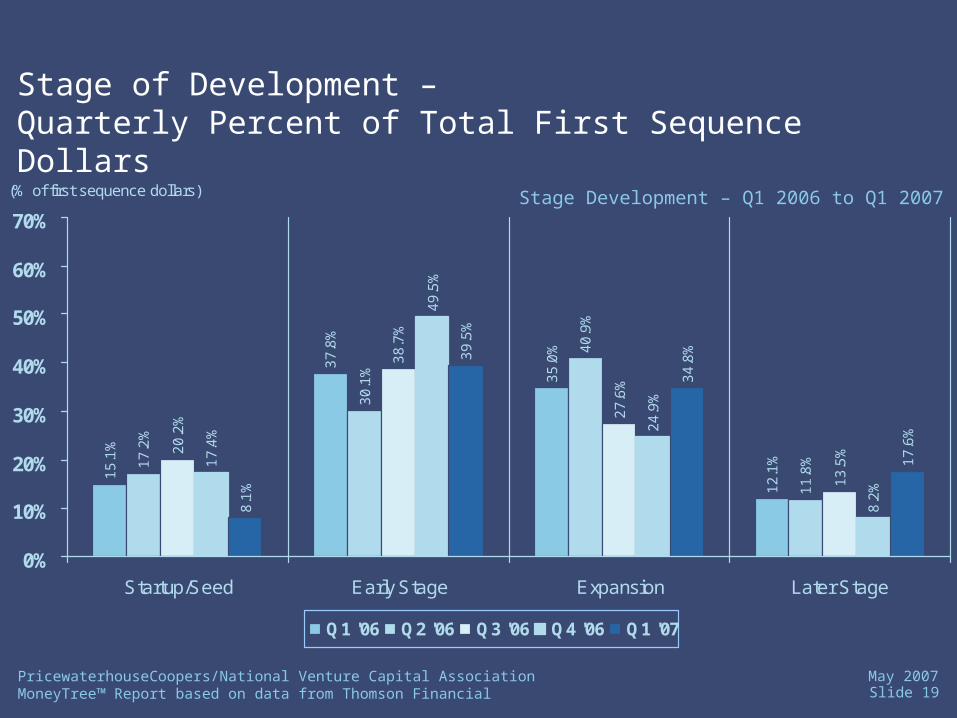
Stage of Development – Quarterly Percent of Total First Sequence Dollars
(% of first sequence dollars)
15
.1%
37
.8%
35
.0%
12
.1%17
.2%
30
.1%
40
.9%
11
.8%
38
.7%
27
.6%
13
.5%
17
.4%
49
.5%
24
.9%
8.2
%
8.1
%
39
.5%
34
.8%
17
.6%
20
.2%
0%
10%
20%
30%
40%
50%
60%
70%
Startup/Seed Early Stage Expansion Later Stage
Q1 '06 Q2 '06 Q3 '06 Q4 '06 Q1 '07
Stage Development – Q1 2006 to Q1 2007

Slide 20PricewaterhouseCoopers/National Venture Capital Association MoneyTree™ Report based on data from Thomson Financial
May 2007
Stage of Development – Quarterly Percent of Total First Sequence Deals
(% of first sequence deals)
21
.2%
44
.4%
29
.3%
5.0
%
22
.9%
43
.9%
24
.9%
8.3
%
32
.1%
40
.1%
20
.4%
7.4
%
22.6
%
57.1
%
14.3
%
6.0%
26.0
%
45.7
%
21.5
%
6.7%
0%
10%
20%
30%
40%
50%
60%
70%
Startup/Seed Early Stage Expansion Later Stage
Q1 '06 Q2 '06 Q3 '06 Q4 '06 Q1 '07
Stage Development – Q1 2006 to Q1 2007

Slide 21PricewaterhouseCoopers/National Venture Capital Association MoneyTree™ Report based on data from Thomson Financial
May 2007
Investments by Sequence of Financing: Q1 2007
($ in millions)
$950.5
$1,194.8
$1,297.4
$1,536.1
$2,076.7
$0 $500 $1,000 $1,500 $2,000 $2,500
Fourth
Third
Second
First
5th and Beyond
Financing# of
Deals
% Change in
$ Amount from
Q4 2006
Fifth & Beyond 192 23.39%
First 223 6.09%
Second 163 4.30%
Third 115 18.87%
Fourth 85 13.41%
Total 778 13.47%
Q1 2007 Totals: $7,056 in 778 Deals

Slide 22PricewaterhouseCoopers/National Venture Capital Association MoneyTree™ Report based on data from Thomson Financial
May 2007
First Sequence Financing – Investment Amount
($ in billions)
$8
.8
$2
.9
$1
.3
$0
.8
$1
.0 $1
.4
$1
.3
$1
.5$2
.0
$1
.2
$1
.0
$1
.3
$1
.5
$1
.6
$6
.3
$1
.3
$1
.0
$1
.1
$1
.2
$1
.3
$1
.5
$5
.4
$1
.3
$0
.8 $1
.1
$1
.2
$1
.4
$1
.4
$8
.5
$0
$1
$2
$3
$4
$5
$6
$7
$8
$9
$10
2000 2001 2002 2003 2004 2005 2006 2007
Q1 Q2 Q3 Q4
First Sequence Investments

Slide 23PricewaterhouseCoopers/National Venture Capital Association MoneyTree™ Report based on data from Thomson Financial
May 2007
First Sequence Financing – Number of Deals
95
6
38
5
22
5
17
0
19
0 22
9 25
9
22
3
94
5
32
9
24
1
18
6 24
5 30
1
80
0
26
5
18
5
17
9 21
9 24
8 29
9
66
7
23
6
18
6 21
3 25
0 27
9
26
6
23
9
0
200
400
600
800
1000
2000 2001 2002 2003 2004 2005 2006 2007
Q1 Q2 Q3 Q4
First Sequence Deals($ in billions)

Slide 24PricewaterhouseCoopers/National Venture Capital Association MoneyTree™ Report based on data from Thomson Financial
May 2007
First Sequence Financing –Percent of Total U.S. Investments
30.1%
23.8%24.4%22.3%
17.6%15.2%16.0%
19.6%20.3%22.4%
17.8%17.3%
20.7%21.9%
20.3%20.0%19.9%
25.4%
21.1%
28.4%
23.3%22.4%
25.1%23.0%23.3%
21.8%
44.9%
41.4%
38.2%
29.9%
26.9%26.4%24.2%
27.1%28.5%
26.9%25.8%24.6%25.3%25.4%
27.5%27.1%29.0%
32.3%30.6%
31.8%29.4%
32.0%
34.8%33.1%
34.2%
30.1%28.7%
31.0%
20.8%22.6%
44.9%
30.4%
0%
5%
10%
15%
20%
25%
30%
35%
40%
45%
50%
55%
60%
Q1
2000
Q2
2000
Q3
2000
Q4
2000
Q1
2001
Q2
2001
Q3
2001
Q4
2001
Q1
2002
Q2
2002
Q3
2002
Q4
2002
Q1
2003
Q2
2003
Q3
2003
Q4
2003
Q1
2004
Q2
2004
Q3
2004
Q4
2004
Q1
2005
Q2
2005
Q3
2005
Q4
2005
Q1
2006
Q2
2006
Q3
2006
Q4
2006
Q1
2007
% of Total Dollars % of Total Deals

Slide 25PricewaterhouseCoopers/National Venture Capital Association MoneyTree™ Report based on data from Thomson Financial
May 2007
First Sequence Deals in Startup & Early Stage Companies
728 81
1 943
1,75
6
905
606
579 68
3
160
799
2,49
9
689
538
28.3%
22.2% 22.7%
20.6%
25.9%
29.1%
25.7%
31.9% 31.6%
20.1%
19.6% 19.9%
22.5%
0
1000
2000
3000
1995
1996
1997
1998
1999
2000
2001
2002
2003
2004
2005
2006
YTD 200
7
0%
5%
10%
15%
20%
25%
30%
35%
40%
Seq 1 Deals in Startup/Early Stage% of Total US Deals

Slide 26PricewaterhouseCoopers/National Venture Capital Association MoneyTree™ Report based on data from Thomson Financial
May 2007
Median Deal Size vs. Mean Deal Size –Quarterly Total U.S. Investments
$7.0$6.5 $6.2 $6.0
$5.0 $5.0
$4.0$4.6 $4.5
$4.0 $4.0$3.2
$3.7 $4.0 $4.0$4.5
$5.0 $4.7 $4.5 $4.8 $4.5 $4.6$4.0
$4.8 $4.5 $4.2 4.1 4.04.5
$13.3 $13.3 $13.6
$12.7
$8.2
$7.1$6.7 $6.8 $6.9 $7.2 $7.1 $7.1 $7.1
$7.8$7.3 $7.1 $7.4 $7.6 7.6
7.0
9.1
$8.4
$10.0$9.3
$8.3
$6.3 $6.2
$7.5 $7.5
$0
$2
$4
$6
$8
$10
$12
$14
Q1
2000
Q2
2000
Q3
2000
Q4
2000
Q1
2001
Q2
2001
Q3
2001
Q4
2001
Q1
2002
Q2
2002
Q3
2002
Q4
2002
Q1
2003
Q2
2003
Q3
2003
Q4
2003
Q1
2004
Q2
2004
Q3
2004
Q4
2004
Q1
2005
Q2
2005
Q3
2005
Q4
2005
Q1
2006
Q2
2006
Q3
2006
Q4
2006
Q1
2007
Median Deal Size Mean Deal Size

Slide 27PricewaterhouseCoopers/National Venture Capital Association MoneyTree™ Report based on data from Thomson Financial
May 2007
Post-Money Valuations – Early Stage Companies 1997 to 2006
$12.
8
$17.
9
$17.
6
$26.
1
$19.
3
$10.
1
$8.7
$9.6
$8.6
$6.9
$5
.8
$5
.4
$8
.6
$1
0.2
$7
.8
$5
.4
$4
.2
$6
.9
$6
.4
$4
.8
$0
$5
$10
$15
$20
$25
$30
$35
$40
Q4 97 Q4 98 Q4 99 Q4 00 Q4 01 Q4 02 Q4 03 Q4 04 Q4 05 Q4 06
Pre-money Valuation Investment Amount
Year 1997 1998 1999 2000 2001 2002 2003 2004 2005 2006
Total $17.55 $24.30 $25.41 $36.22 $27.92 $15.41 $14.13 $15.37 $15.52 $11.13
12 Month Average

Slide 28PricewaterhouseCoopers/National Venture Capital Association MoneyTree™ Report based on data from Thomson Financial
May 2007
Post-Money Valuations – Expansion Stage Companies 1997 to 2006
$30.
8
$34.
3
$62.
9
$87.
3
$48.
5
$33.
4
$32.
1
$48.
5
$46.
4
$54.
9
$1
2.4
$1
1.3
$1
3.8
$2
1.7
$1
6.5
$1
2.5
$1
4.0
$1
4.2
$8
.8
$8
.1
-$10
$10
$30
$50
$70
$90
$110
Q4 97 Q4 98 Q4 99 Q4 00 Q4 01 Q4 02 Q4 03 Q4 04 Q4 05 Q4 06
Pre-money Valuation Investment Amount
12 Month Average
Year 1997 1998 1999 2000 2001 2002 2003 2004 2005 2006
Total $38.88 $43.02 $79.43 $108.99 $62.33 $45.89 $43.46 $60.87 $60.62 $68.90

Slide 29PricewaterhouseCoopers/National Venture Capital Association MoneyTree™ Report based on data from Thomson Financial
May 2007
Post-Money Valuations – Later Stage Companies 1997 to 2006
$60.
8
$55.
3
$105
.3
$130
.5
$78.
4
$48.
7
$54.
4
$56.
4
$80.
2
$81.
3
$1
6.7
$1
4.3
$2
0.5
$2
8.9
$2
0.6
$1
6.7
$1
4.1
$1
5.1
$1
0.6
$9
.8
$0
$20
$40
$60
$80
$100
$120
$140
$160
$180
Q4 97 Q4 98 Q4 99 Q4 00 Q4 01 Q4 02 Q4 03 Q4 04 Q4 05 Q4 06
Pre-money Valuation Investment Amount
Year1997 1998 1999 2000 2001 2002 2003 2004 2005 2006
Total $70.58 $65.97 $125.87 $159.40 $98.87 $65.44 $68.71 $73.17 $95.29 $95.33
12 Month Average

Slide 30PricewaterhouseCoopers/National Venture Capital Association MoneyTree™ Report based on data from Thomson Financial
May 2007
Q1 2007 – Most Active Venture Investors
Venture Capital Firm LocationTotal Deals
Alta Partners San Francisco, California 18
New Enterprise Associates Baltimore, Maryland 18
Draper Fisher Jurvetson Menlo Park, California 17
Canaan Partners Westport, Connecticut 16
Intel Capital Santa Clara, California 15
Menlo Ventures Menlo Park, California 15
Sequoia Capital Menlo Park, California 15
ARCH Venture Partners Chicago, Illinois 14
Venrock Associates New York, New York 14

Slide 31PricewaterhouseCoopers/National Venture Capital Association MoneyTree™ Report based on data from Thomson Financial
May 2007
Thomson FinancialU.S. Private Equity Performance Index (PEPI)
Fund Type 1 Year 3 Year 5 Year 10 Year 20 Year
Early/Seed VC 9.9 6.5 -3.0 36.4 20.5
Balanced VC 20.5 11.7 4.1 17.6 14.6
Later Stage VC 25.2 9.4 3.7 9.0 14.0
All Venture 16.4 9.1 1.0 20.3 16.6
All Buyouts 24.5 14.6 10.4 8.5 12.9
Mezzanine 12.6 5.0 4.1 6.1 8.5
All Private Equity 23.3 12.7 7.5 11.0 13.9
NASDAQ 4.7 6.2 4.3 6.4 10.1
S&P 500 10.8 8.2 4.2 6.6 9.2
(Investment Horizon Performance as of 12/31/2006)
Source: Thomson Financial/National Venture Capital Association *Data as of 4/13/2007--The Private Equity Performance Index (PEPI) is based on the latest quarterly statistics from the Thomson Financial Private Equity Performance Database analyzing the cashflows and returns for over 1860 US venture capital and private equity partnerships with a capitalization of $679 billion. Sources are financial documents and schedules from Limited Partners investors and General Partners. All returns are calculated by Thomson Financial from the underlying financial cashflows. Returns are net to investors after management fees and carried interest.

Slide 32PricewaterhouseCoopers/National Venture Capital Association MoneyTree™ Report based on data from Thomson Financial
May 2007
Analysis of Venture-Backed IPO and M&A Activity*
Date Number of IPOs**
Total Venture-Backed Offering Size ($M)
Average Venture-Backed Offering Size ($M)
Number of Venture-backed M&A deals
Average M&A deal size***
2003 29 2,022.7 69.8 291 62.8
2004 93 11,014.9 118.4 339 83.0
2005 56 4,461.0 79.7 347 95.8
2006 Q1 10 540.8 54.1 104 112.2
2006 Q2 19 2,011.0 105.8 92 101.3
2006 Q3 8 934.2 116.8 87 95.6
2006 Q4 20 1,631.1 81.6 57 165.3
2006 57 5,117.1 89.8 340 113.3
2007 Q1 17 2,091.9 123.1 62 161.2
2007 17 2,091.9 123.1 62 161.2
* Q1 2007 M&A data, current as of April 2, 2007, is preliminary and subject to change** Includes all companies with at least one U.S. VC investor that trade on U.S. exchanges, regardless of domicile***Only accounts for deals with disclosed valuesSource: Thomson Financial/ National Venture Capital Association

Slide 33PricewaterhouseCoopers/National Venture Capital Association MoneyTree™ Report based on data from Thomson Financial
May 2007
Venture Capital Fundraising*
Year First Time Funds
Follow-On Funds
Total Number of Funds
VC Raised ($M)
2002 57 115 172 3,767.4
2003 50 97 147 10,622.3
2004 56 149 205 18,566.0
2005 55 163 218 27,957.3
2006 44 168 212 30,260.4
2007 YTD 13 43 56 4,939.8
Quarter
Q1 ‘06 17 55 72 6,640.1
Q2 ‘06 13 59 72 14,050.9
Q3 ‘06 13 52 65 5,426.0
Q4 ‘06 14 42 56 4,143.4
Q1 ‘07 13 43 56 4,939.8
Source: Thomson Financial/National Venture Capital Association
*These figures take into account the subtractive effect of downsized funds Date current as of 4/16/07

Slide 34PricewaterhouseCoopers/National Venture Capital Association MoneyTree™ Report based on data from Thomson Financial
May 2007
North Carolina Picture
Historical Trends

Slide 35PricewaterhouseCoopers/National Venture Capital Association MoneyTree™ Report based on data from Thomson Financial
May 2007
MoneyTree Total North Carolina InvestmentsMoneyTree Total North Carolina Investments2000 – Q1 20072000 – Q1 2007
2000 2001 2002 2003 2004
# of Deals
2005 2006 2007
$408
$622
$497
$303
$224
$140$144$158
$40
$123
$163
$108 $93$119
$83$102
$29
$97
$175$128
$83$56
$82
$225
$114$119 $91$141
$153
$0
$100
$200
$300
$400
$500
$600
$700
Q1 Q2 Q3 Q4 Q1 Q2 Q3 Q4 Q1 Q2 Q3 Q4 Q1 Q2 Q3 Q4 Q1 Q2 Q3 Q4 Q1 Q2 Q3 Q4 Q1 Q2 Q3 Q4 Q1
34 31 24 15 18 1542 38 40 22 14 20 23 22 20 14 28 14 20 9 11 13 18 19 16 1510 20 16
($ in millions)
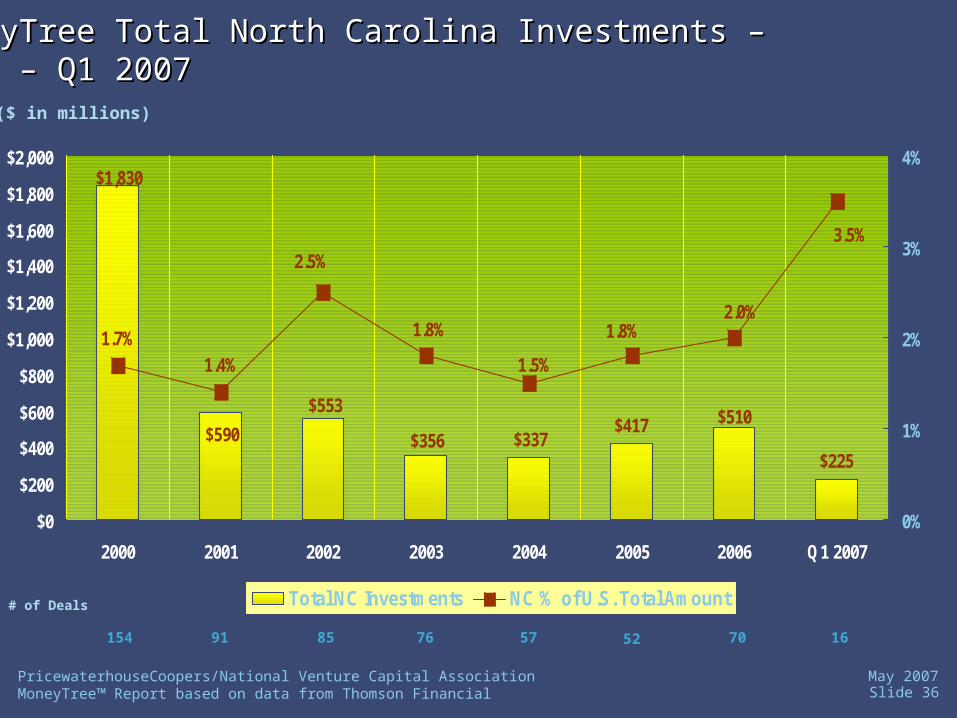
Slide 36PricewaterhouseCoopers/National Venture Capital Association MoneyTree™ Report based on data from Thomson Financial
May 2007
$417
$225
$1,830
$553$510
$337$356$590
1.7%
1.4%
1.8%2.0%
3.5%
1.5%
1.8%
2.5%
$0
$200
$400
$600
$800
$1,000
$1,200
$1,400
$1,600
$1,800
$2,000
2000 2001 2002 2003 2004 2005 2006 Q1 2007
0%
1%
2%
3%
4%
Total NC Investments NC % of U.S. Total Amount# of Deals
154 91 85 76 57 1652 70
MoneyTree Total North Carolina Investments – MoneyTree Total North Carolina Investments – 2000 – Q1 20072000 – Q1 2007($ in millions)

Slide 37PricewaterhouseCoopers/National Venture Capital Association MoneyTree™ Report based on data from Thomson Financial
May 2007
85
70
57
76
91
154
52
16
2.0%
2.1%
1.9%1.7%
2.8%2.0% 2.6%
2.0%
$0
$20
$40
$60
$80
$100
$120
$140
$160
2000 2001 2002 2003 2004 2005 2006 Q1 2007
0%
1%
2%
3%
Total # NC Deals NC % of U.S. Total DealsAmountInvested
(in millions)
$1,830 $590 $553 $356 $337 $225$417 $510
MoneyTree Total North Carolina Deals– MoneyTree Total North Carolina Deals– 2000 – Q1 20072000 – Q1 2007
($ in millions)

Slide 38PricewaterhouseCoopers/National Venture Capital Association MoneyTree™ Report based on data from Thomson Financial
May 2007
$6.7
$7.3
$16.0
$50.0
$52.0
$87.5
$0 $20 $40 $60 $80 $100
Electronics/Instrumentation
Software
IT Services
Industrial/Energy
Telecommunications
Medical Devices &equipment
Biotech
Total Deals
Q1 2007
% Change in $ Amount from
Q1 2006($ in millions)
2
Total North Carolina Investments by Industry –Total North Carolina Investments by Industry –Q1 2007Q1 2007
Q1 2007 Total: $224.8
1$5.2
7
1
2
1
2
45.5%
100.0%
142.2%
138.1%
845.5%
100.0%
(40.2%)
Slide 39PricewaterhouseCoopers/National Venture Capital Association MoneyTree™ Report based on data from Thomson Financial
May 2007
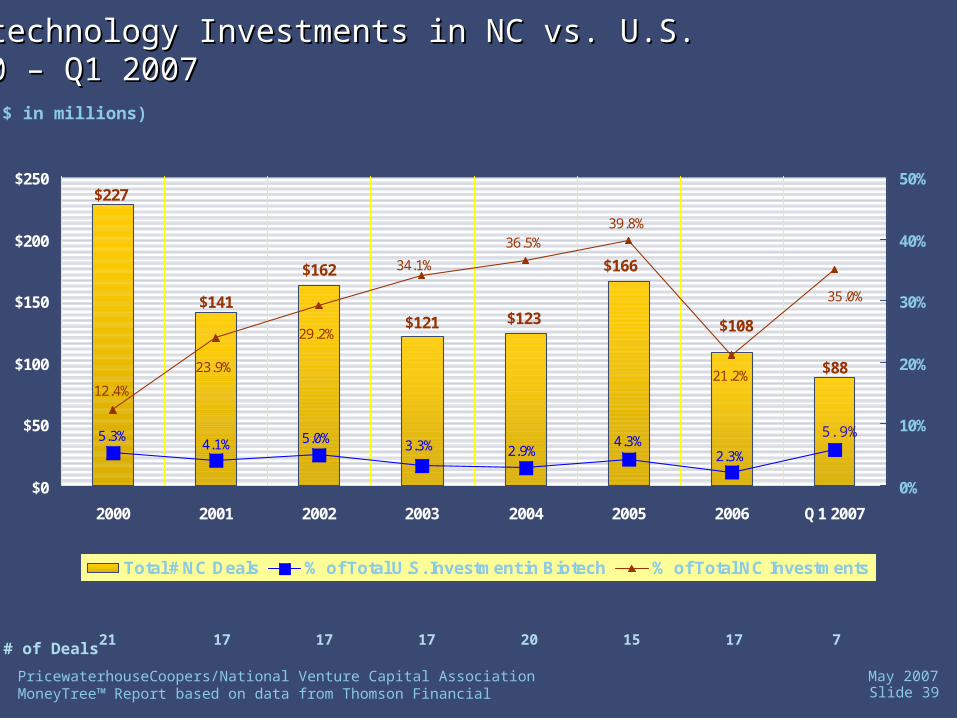
$166$162
$108$123$121$141
$227
$88
12.4%
2.3%2.9%4.3%5.0%5.3%
4.1% 3.3%
23.9%
39.8%36.5%
29.2%
21.2%
35.0%
34.1%
$0
$50
$100
$150
$200
$250
2000 2001 2002 2003 2004 2005 2006 Q1 2007
0%
10%
20%
30%
40%
50%
Total # NC Deals % of Total U.S. Investment in Biotech % of Total NC Investments
($ in millions)
Biotechnology Investments in NC vs. U.S.Biotechnology Investments in NC vs. U.S.2000 – Q1 20072000 – Q1 2007
21 17 17 17 20 715 17# of Deals
5.9%
Slide 40PricewaterhouseCoopers/National Venture Capital Association MoneyTree™ Report based on data from Thomson Financial
May 2007
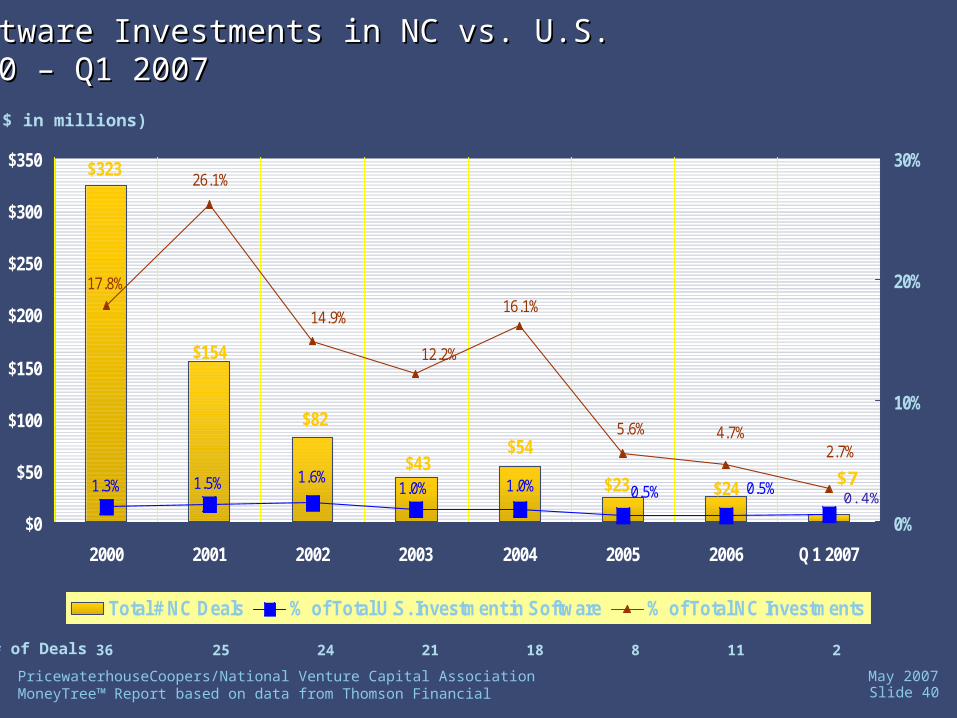
$82
$24
$54$43
$154
$323
$23
17.8%
0.5%1.0% 0.5%1.6%1.3% 1.5% 1.0%
14.9%
4.7%
16.1%
5.6%
12.2%
2.7%
26.1%
$0
$50
$100
$150
$200
$250
$300
$350
2000 2001 2002 2003 2004 2005 2006 Q1 2007
0%
10%
20%
30%
Total # NC Deals % of Total U.S. Investment in Software % of Total NC Investments
($ in millions)
Software Investments in NC vs. U.S.Software Investments in NC vs. U.S.2000 – Q1 20072000 – Q1 2007
36 25 24 21 18 28 11# of Deals
0.4%$7
Slide 41PricewaterhouseCoopers/National Venture Capital Association MoneyTree™ Report based on data from Thomson Financial
May 2007
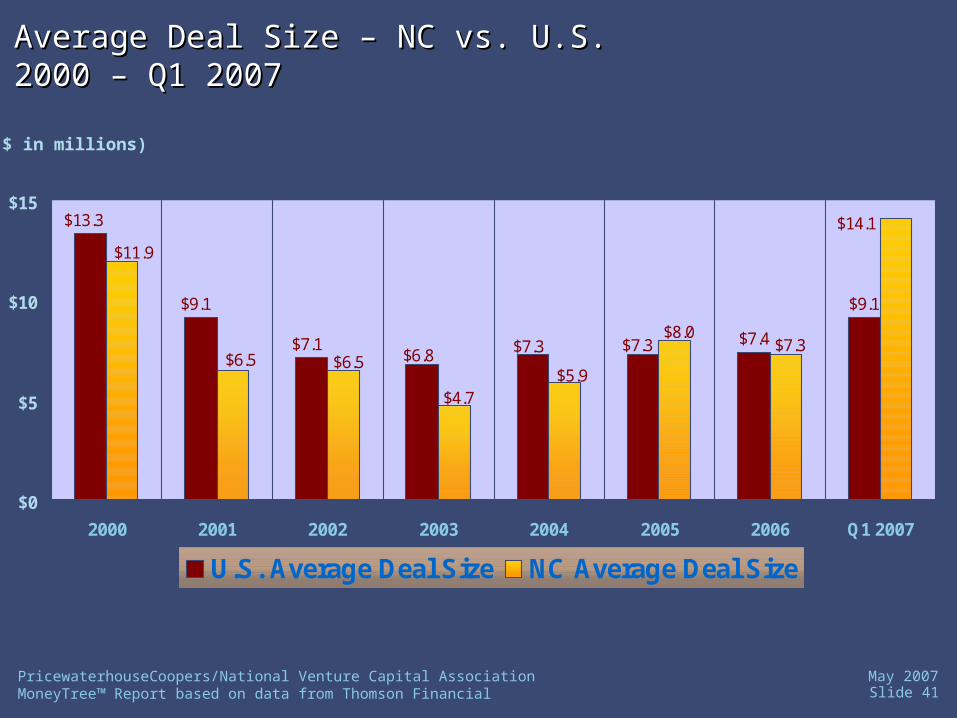
Average Deal Size – NC vs. U.S.Average Deal Size – NC vs. U.S.2000 – Q1 20072000 – Q1 2007
$7.4
$9.1
$13.3
$9.1
$7.1$6.8 $7.3 $7.3
$11.9
$6.5 $6.5
$4.7$5.9
$8.0$7.3
$14.1
$0
$5
$10
$15
2000 2001 2002 2003 2004 2005 2006 Q1 2007
U.S. Average Deal Size NC Average Deal Size
($ in millions)

Slide 42PricewaterhouseCoopers/National Venture Capital Association MoneyTree™ Report based on data from Thomson Financial
May 2007
6th Sense Analytics, Inc. Software $
5,000,000
AlphaVax, Inc.Biotechnology $ 12,650,000
Chimerix, Inc.Biotechnology $ 23,099,900
HyperBranch Medical Technology, Inc. Medical Devices & Equipment $
2,000,000
InnerPulse, Inc.Medical Devices & Equipment $ 50,000,500
Liquidia Technologies, Inc. Industrial/Energy $
15,999,900
Motricity Telecommunications $ 50,000,000
Nextreme Thermal Solutions, Inc. Electronics/Instrumentation $
5,292,000
Phase Bioscience, Inc. Biotechnology $
1,250,100
Regado Biosciences, Inc. Biotechnology $
23,000,200
rPath, Inc .Software $ 1,749,900
Serenex, Inc.Biotechnology $ 13,999,800
StrikeIron, Inc.IT Services $ 5,000,000
Tranzyme Pharma, Inc. Biotechnology $
11,000,000
Unit Dose Solutions, Inc. Biotechnology $
2,500,000
XDS, Inc. IT Services IT Services $
2,274,000
$
224,816,300
North Carolina Companies Funded in Q1 2007North Carolina Companies Funded in Q1 2007
Company Name AmountIndustry
Slide 43PricewaterhouseCoopers/National Venture Capital Association MoneyTree™ Report based on data from Thomson Financial
May 2007
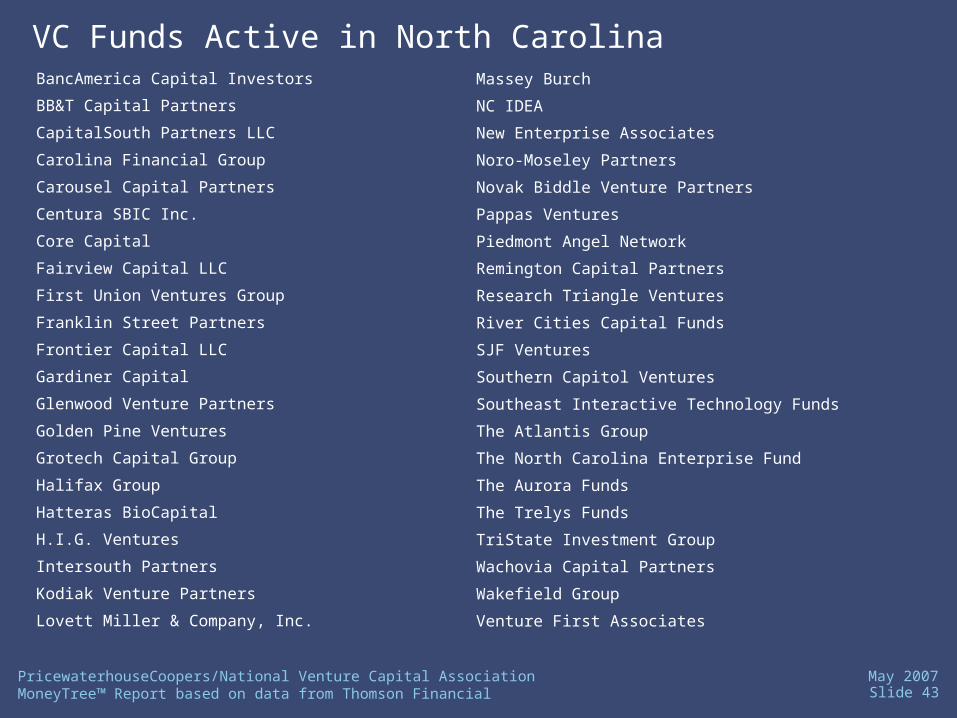
VC Funds Active in North CarolinaBancAmerica Capital Investors
BB&T Capital Partners
CapitalSouth Partners LLC
Carolina Financial Group
Carousel Capital Partners
Centura SBIC Inc.
Core Capital
Fairview Capital LLC
First Union Ventures Group
Franklin Street Partners
Frontier Capital LLC
Gardiner Capital
Glenwood Venture Partners
Golden Pine Ventures
Grotech Capital Group
Halifax Group
Hatteras BioCapital
H.I.G. Ventures
Intersouth Partners
Kodiak Venture Partners
Lovett Miller & Company, Inc.
Massey Burch
NC IDEA
New Enterprise Associates
Noro-Moseley Partners
Novak Biddle Venture Partners
Pappas Ventures
Piedmont Angel Network
Remington Capital Partners
Research Triangle Ventures
River Cities Capital Funds
SJF Ventures
Southern Capitol Ventures
Southeast Interactive Technology Funds
The Atlantis Group
The North Carolina Enterprise Fund
The Aurora Funds
The Trelys Funds
TriState Investment Group
Wachovia Capital Partners
Wakefield Group
Venture First Associates

Slide 44PricewaterhouseCoopers/National Venture Capital Association MoneyTree™ Report based on data from Thomson Financial
May 2007
Entrepreneurs and Venture Capital On-Line Resource ListEntrepreneurs and Venture Capital On-Line Resource Listwww.pwc.com - The PricewaterhouseCoopers Global website.
www.pwcmoneytree.com, www.nvca.org, www.ventureeconomics.com - The PricewaterhouseCoopers/National Venture Capital Association MoneyTree TM Report based on data from Thomson Financial is a quarterly study of equity investments made by the venture capital community in private companies in the U.S. The survey identifies regional and national trends, entrepreneurial developments and promising industry segments.
www.pwcnextwave.com - PricewaterhouseCoopers’ thought leadership articles for the world of private equity.
www.cfodirect.com - CFOdirect Network – PricewaterhouseCoopers’ online accounting, finance and business resource for senior financial executives.
www.pwcV2R.com - The Vision to Reality Entrepreneur Resource Center site offers proven business plan templates, financial models, technology-specific ratios, benchmarks and more.
www.pwcvc.com - The VC BestPractices site serves to provide an aggregate, comparative view of key issues and activities impacting the venture capital community, and to identify best practices.
www.barometersurveys.com - PricewaterhouseCoopers’ Trendsetter and Technology Barometers site – result & analysis of the quarterly survey of fast-growth and large company CEO’s.
www.cednc.org - The Council for Entrepreneurial Development
www.nc-tech.org - North Carolina Technologies Association

Slide 45PricewaterhouseCoopers/National Venture Capital Association MoneyTree™ Report based on data from Thomson Financial
May 2007
For more information, contact:
Jeff Barberor
Peter Coode
Carolinas Technology Industry GroupPhone 919 755-3000
[email protected]@us.pwc.com